Categories
Commentary

Daily Brief For May 24, 2021

Quick Note: From May 25 to May 28, the daily newsletter will be off as I will be on a trip. It would not be fair for me to provide lackluster content since I won’t have all the tools at my disposal.

Market Commentary

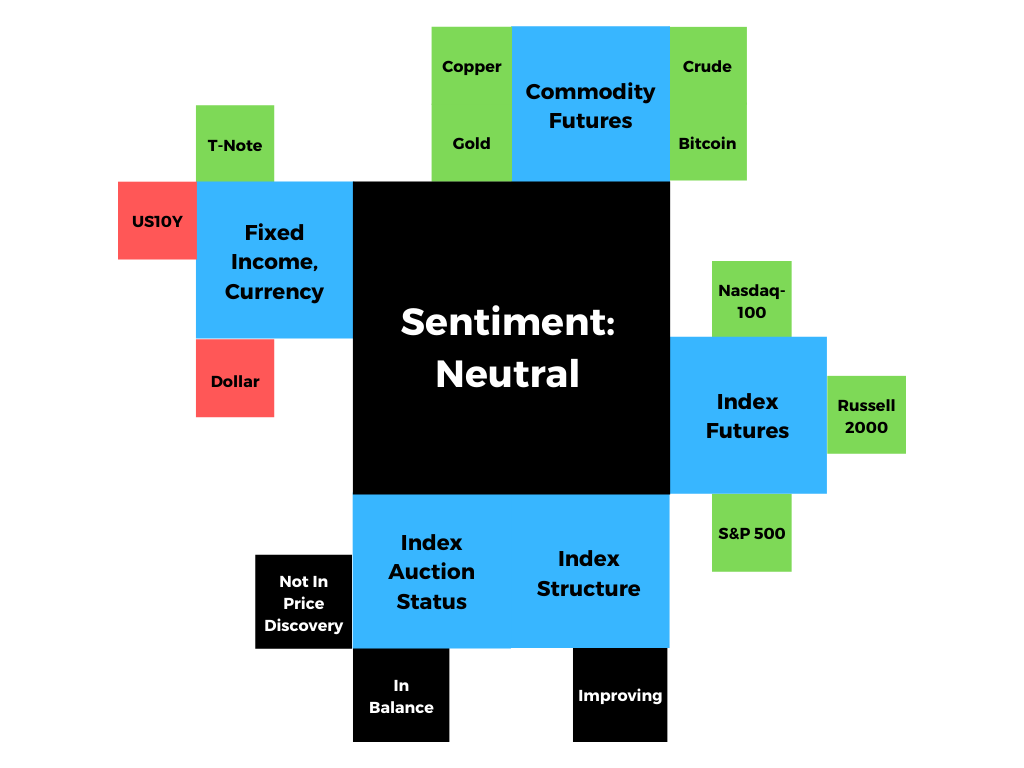
Index futures in balance.

  • The U.S. may be facing deflation.
  • Ahead is CFNAI data, Fed speak.
  • Stock indexes sideways to higher.

What Happened: U.S. stock index futures auctioned higher overnight alongside renewed political tensions, cryptocurrency volatility, as well as a crackdown by China on commodity speculation.

Graphic updated 7:50 AM EST.

What To Expect: Monday’s regular session (9:30 AM – 4:00 PM EST) in the S&P 500 will likely open inside of prior-range and -value, suggesting a limited potential for immediate directional opportunity. 

Value-Area Placement: Perception of value unchanged if value overlapping (i.e., inside day). Perception of value has changed if value not overlapping (i.e., outside day). Delay trade in the former case.

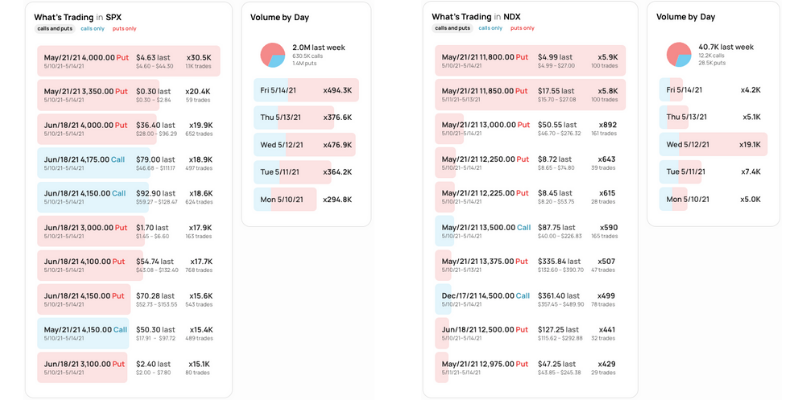
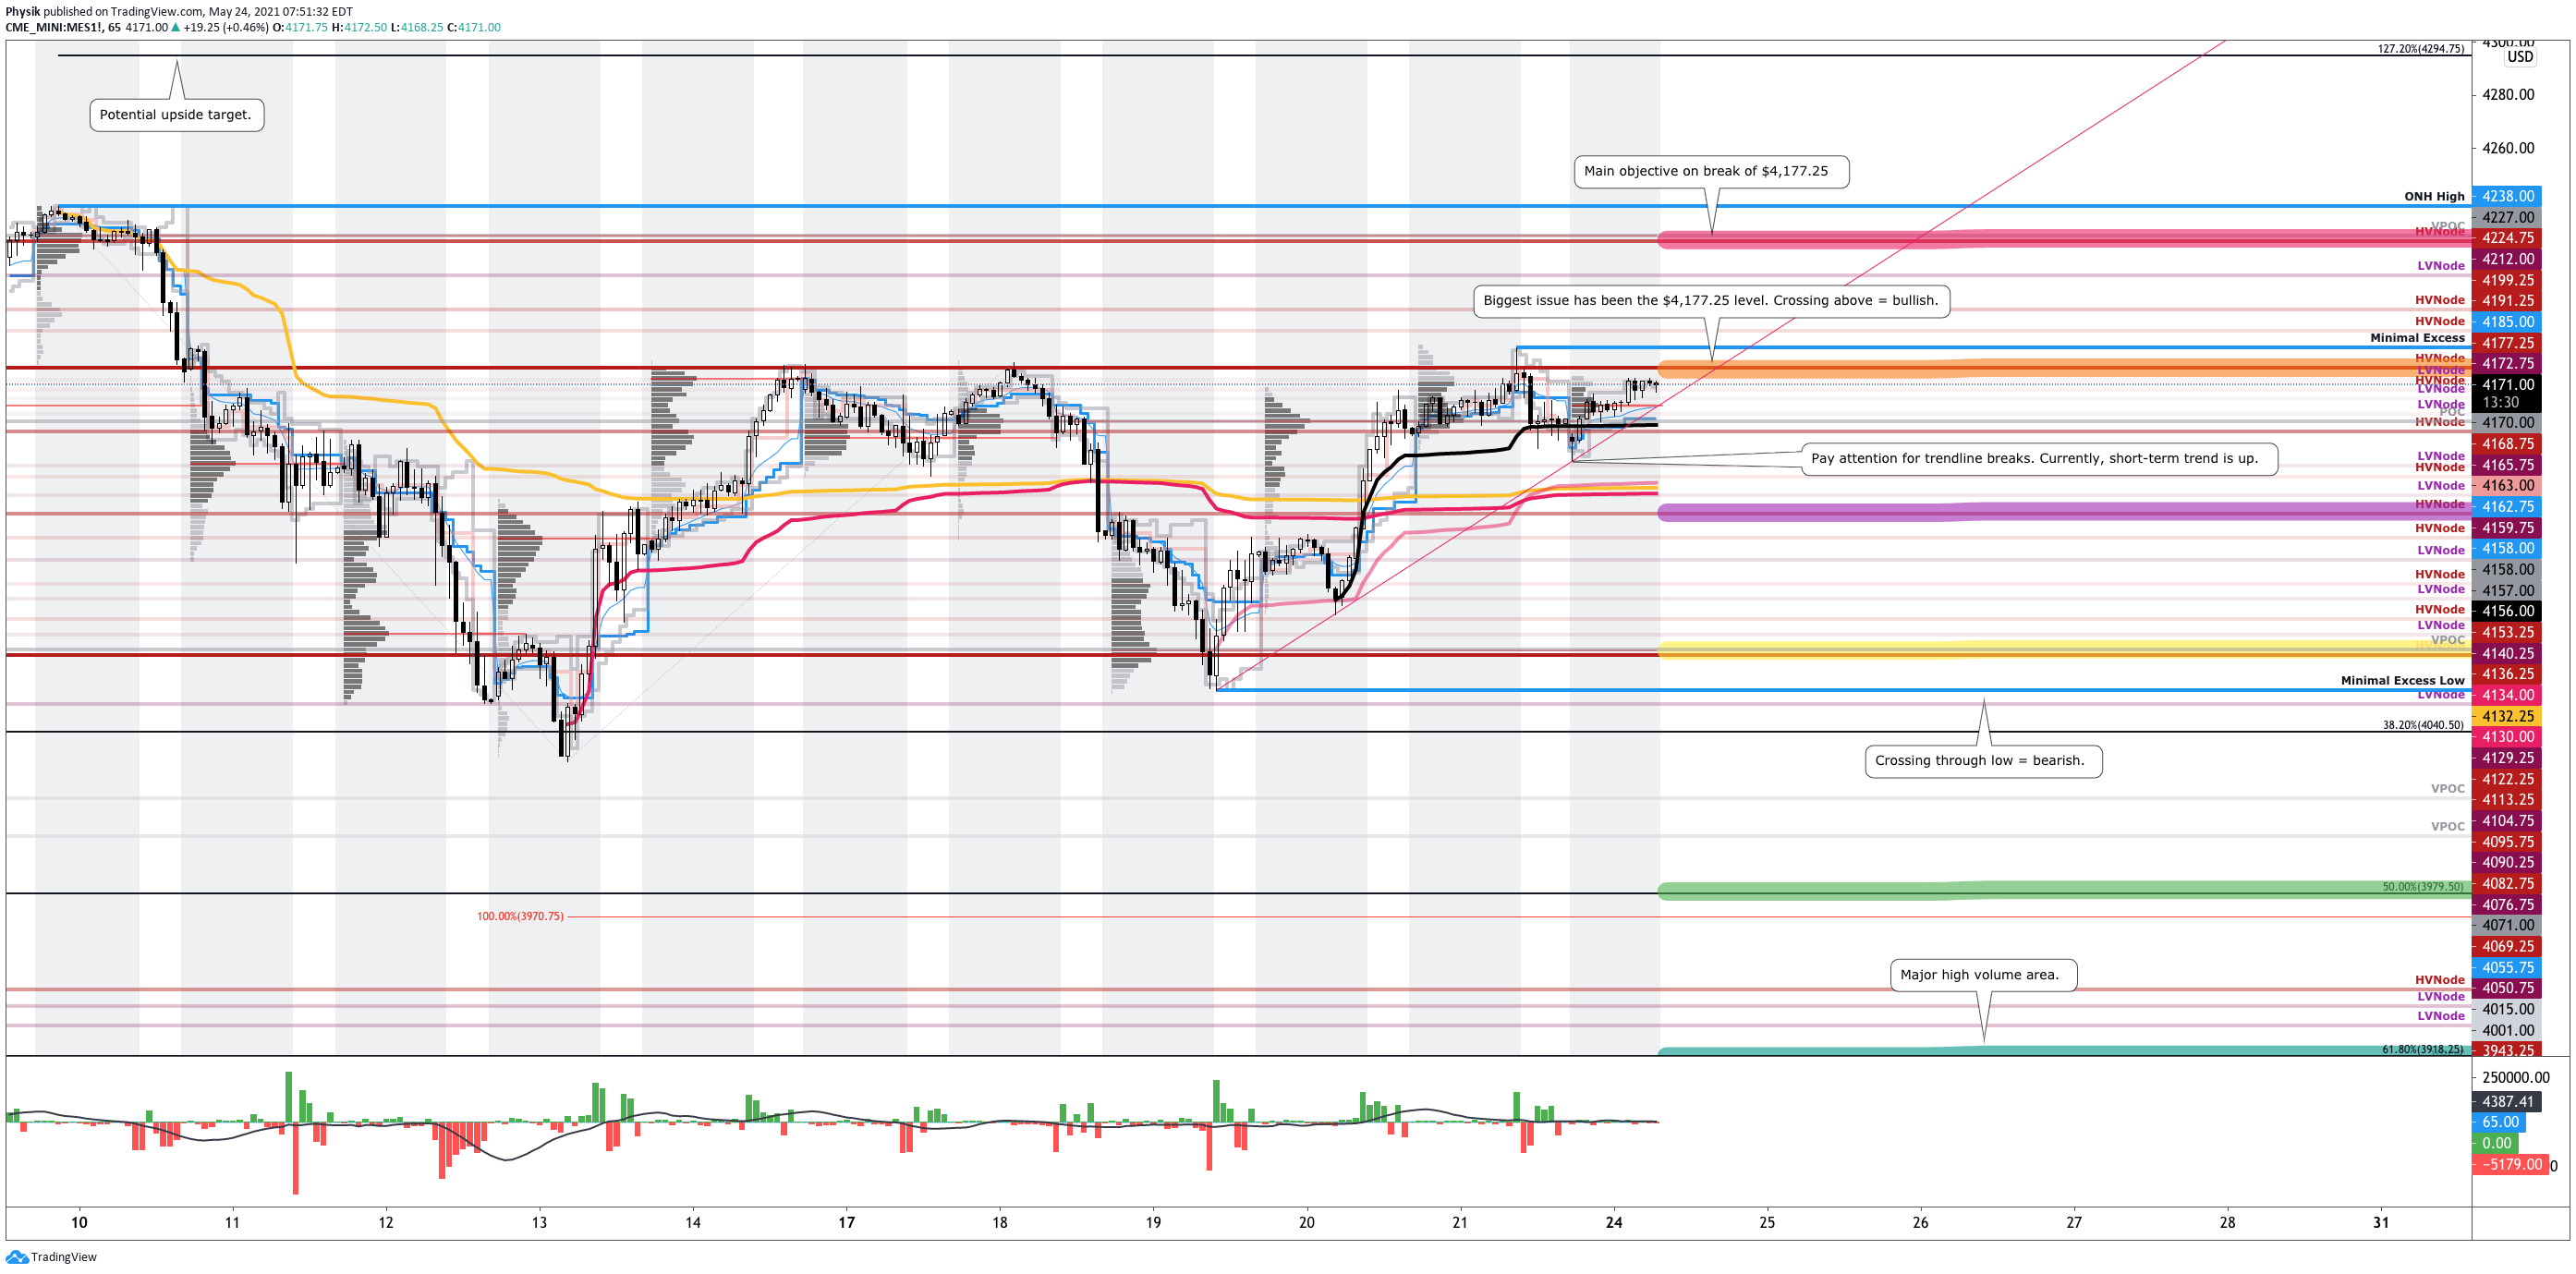
Adding, during the prior day’s regular trade, the worst-case outcome occurred, evidenced by the responsive selling that surfaced at and above the $4,177.25 high volume area (HVNode). This is not all too significant given the large monthly options expiration. Still, according to SpotGamma, “[w]hile roughly 1/3 of total QQQ gamma rolled off on Friday, … [the] QQQ remains under the control of put options,” a source of potential volatility in the Nasdaq 100.

Responsive Selling: Selling in response to prices above area of recent price acceptance.

Volume Areas: A structurally sound market will build on past areas of high volume. Should the market trend for long periods of time, it will lack sound structure (identified as a low volume area which denotes directional conviction and ought to offer support on any test). 

If participants were to auction and find acceptance into areas of prior low volume, then future discovery ought to be volatile and quick as participants look to areas of high volume for favorable entry or exit.

Options: If an option buyer was short (long) stock, he or she would buy a call (put) to hedge upside (downside) exposure. Option buyers can also use options as an efficient way to gain directional exposure.

Options Expiration (OPEX): Option expiries mark an end to pinning (i.e, the theory that market makers and institutions short options move stocks to the point where the greatest dollar value of contracts will expire worthless) and the reduction dealer gamma exposure.

Gamma: Gamma is the sensitivity of an option to changes in the underlying price. Dealers that take the other side of options trades hedge their exposure to risk by buying and selling the underlying. When dealers are short-gamma, they hedge by buying into strength and selling into weakness. When dealers are long-gamma, they hedge by selling into strength and buying into weakness. The former exacerbates volatility. The latter calms volatility.

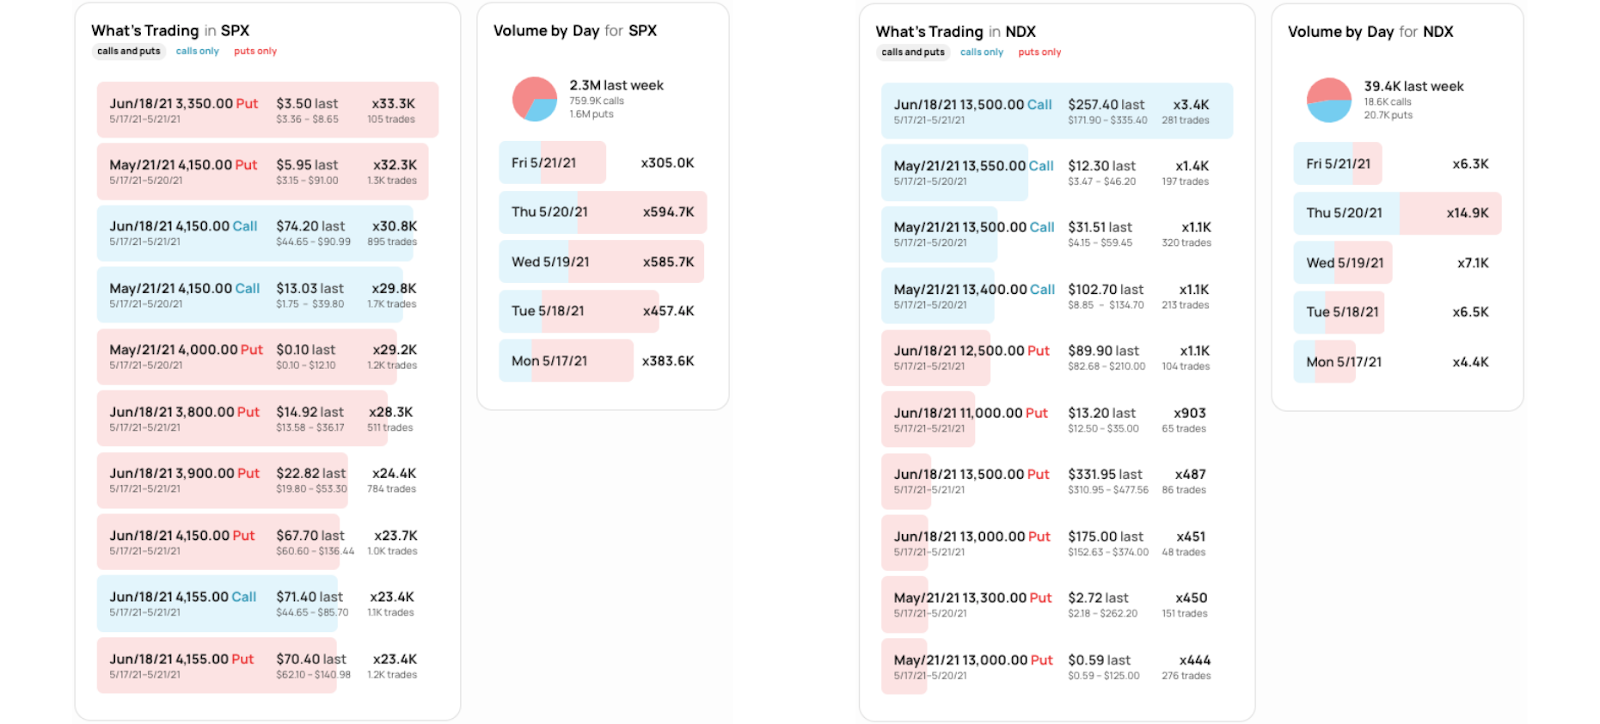
As stated in Sunday’s weekly note, equities are in a seasonally weak period. At the same time, inflation and uninspiring economic data are major worries investors are attempting to price in. That said, however, during the May 19 reversal, in the S&P 500 and Nasdaq 100, participants increased exposure to the upside with relatively cheap, longer-dated calls.

Further, for today, participants can trade from the following frameworks. 

In the best case, the S&P 500 trades sideways or higher; activity above $4,177.25 puts in play the $4,227.00 point of control (POC). Initiative trade beyond the POC could reach as high as the $4,238.00 overnight all-time high. 

POCs: POCs (like HVNodes described above) are valuable as they denote areas where two-sided trade was most prevalent. Participants will respond to future tests of value as they offer favorable entry and exit.

Initiative Buying: Buying within or above the previous day’s value area.

Overnight Rally Highs (Lows): Typically, there is a low historical probability associated with overnight rally-highs (lows) ending the upside (downside) discovery process.

In the worst case, the S&P 500 trades lower; activity below $4,177.25 puts in play the $4,122.25 HVNode. Thereafter, if lower, key references include the $4,071.00 POC and $4,050.75 low volume area (LVNode). Long-biased traders are cautioned on trade below the LVNode. 

Graphic: 65-minute profile chart of the Micro E-mini S&P 500 Futures.
Graphic: Daily candlestick charts of the S&P 500 (top left), Nasdaq 100 (top right), Russell 2000 (bottom left), and Dow Jones Industrial Average (bottom right). The Nasdaq is regaining relative strength. A rotation would be bullish, or supportive of a new leg higher (if one were to happen).
Graphic: Physik Invest maps out the purchase of call and put options in the SPDR S&P 500 ETF Trust (NYSE: SPY), for last week. Though activity in the options market was primarily concentrated in short-dated tenors, increased trade in farther-dated call-side strikes is observed as a commitment to higher prices.
Graphic: SHIFT search suggests participants were most interested in put strikes at and below current prices in the cash-settled S&P 500 Index (INDEX: SPX) and Nasdaq 100 Index (INDEX: NDX), last week. To note, however, participants began paying up for longer-dated upside exposure (evidenced by call activity).

News And Analysis

Economy | Cathie Wood: U.S. “setting up for a massive period deflation.” (BBG)

Economy | European labor market’s capacity to absorb shocks varies. (Moody’s)

Markets | How a global minimum corporate tax could impact markets. (WSJ)

Markets | Goldman sees oil hitting $80/bbl despite likely supply return. (REU)

Security | Three disasters show gaps in the $1.7T infrastructure plan. (BBG)

Markets | Mainstream markets shrug volatile $1T crypto flash crash. (BBG)

Trade | Sea change: global freight sails out of the digital dark ages. (REU)

Politics | EU weighs sanctions over so-called ‘hijacking’ of Ryanair jet. (BBG)

What People Are Saying

Innovation And Emerging Trends

FinTech | HSBC CEO says bitcoin, cryptocurrencies are not for them. (REU)

FinTech | Robinhood to allow users to buy into IPOs ahead of debut. (REU)

FinTech | VCs are predicting new areas of consumer fintech disruption. (BI)

Environment | Unpacking the problems with reinforced concrete. (Convo)

Markets | First warning sign in global commodity boom flashes in China. (BBG)

About

Renato founded Physik Invest after going through years of self-education, strategy development, and trial-and-error. His work reporting in the finance and technology space, interviewing leaders such as John Chambers, founder, and CEO, JC2 Ventures, Kevin O’Leary, businessman and Shark Tank host, Catherine Wood, CEO and CIO, ARK Invest, among others, afforded him the perspective and know-how very few come by.

Having worked in engineering and majored in economics, Renato is very detailed and analytical. His approach to the markets isn’t built on hope or guessing. Instead, he leverages the unique dynamics of time and volatility to efficiently act on opportunity.

Disclaimer

At this time, Physik Invest does not manage outside capital and is not licensed. In no way should the materials herein be construed as advice. Derivatives carry a substantial risk of loss. All content is for informational purposes only.

Categories
Commentary

Weekly Brief For May 16, 2021

Market Commentary

Key Takeaways: Index futures are back in balance.

  • Economic data failing to surprise.
  • JPM: “Market is a little oversold.”
  • Indices reject lower prices, rotate.

What Happened: Last week, U.S. stock index futures auctioned lower alongside the release of uninspiring economic data.

In particular, the S&P 500 advertised prices below a key consolidation area but failed to solicit aggressive selling. Thereafter, participants rotated the index back inside the aforementioned consolidation, suggesting they were seeking more information to base a directional move. 

As stated in the last few weekly commentaries, participants have a lot to account for in positioning themselves during one of the weakest stretches of the year. Among their worries are inflation expectations – in part due to “choke points in global supply chains” – and stalling retail sales, as well as consumer price and job data misses. At the same time, sentiment and positioning metrics are waning while inflows remain strong, across the globe, and many year-end index targets remain clustered at and above current prices.

Of all the factors mentioned, inflation is a key concern. Why? Generally speaking, inflation and rates move inverse to each other. Low rates stimulate demand for loans (i.e., borrowing money more attractive). With the rapid recovery, though, market participants are fearful that rates may have to rise to protect the economy from overheating.

Higher rates have the potential to reduce the present value of future earnings, making stocks, especially those that are high growth, less attractive. To note, however, rates remain rangebound; rates on the 10 Year T-Note sit below their March high and are likely to continue higher, which, according to research by JPMorgan Chase & Co (NYSE: JPM), the market will likely absorb.

In fact, JPMorgan’s Marko Kolanovic, in a CNBC appearance, said that the market is a little oversold, and his S&P 500 target of $4,400.00 remains in play.

“I think market is now actually getting cheap, in some sense,” Kolanovic said. “I think we’re at the end of this upset. I think the market is going to go higher here. That said, we do still again prefer reflationary themes.”

Looking back, also, according to The Market Ear, even during the so-called Taper Tantrum, in the early 2010s, rates settled in a wide range, and equities rallied big. 

Graphic: Nasdaq 100 rallies in 2013 after rates settle in a wide range, via The Market Ear.

To add, technically speaking, after testing into a composite low volume area (LVNode), the S&P 500 rejected lower prices and quickly traded back to the valuable $4,177.25 high volume area (HVNode).

Volume Areas: A structurally sound market will build on past areas of high volume. Should the market trend for long periods of time, it will lack sound structure (identified as a low-volume area which denotes directional conviction and ought to offer support on any test). 

If participants were to auction and find acceptance into areas of prior low-volume, then future discovery ought to be volatile and quick as participants look to areas of high volume for favorable entry or exit.

This volatility was expected; coming into the May 13 reversal, stock indexes were positioning for a vicious rebound as near-term downside discovery reached a potential limit, based on market liquidity metrics and the inventory positioning of participants. According to SqueezeMetrics, the steepness of the GammaVol (GXV) curve suggested there was more risk to the upside than the downside.

More On Gamma: In the simplest way, gamma is the sensitivity of an option to changes in the underlying price. Dealers that take the other side of options trades to hedge their exposure to risk by buying and selling the underlying. When dealers are short-gamma, they hedge by buying into strength and selling into weakness. When dealers are long-gamma, they hedge by selling into strength and buying into weakness. The former exacerbates volatility. The latter calms volatility.

What To Expect: In the coming sessions, participants will want to focus their attention on where the S&P 500 trades in relation to the $4,177.25 HVNode pivot.

That said, participants can trade from the following frameworks.

In the best case, the index trades sideways or higher; activity above the $4,177.25 HVNode may reach as high as the $4,227.00 POC. Initiative trade beyond the POC could reach as high as $4,238.00 overnight high (ONH) and $4,294.75 Fibonacci price extension, a typical recovery target.

POCs: POCs (like HVNodes described above) are valuable as they denote areas where two-sided trade was most prevalent. Participants will respond to future tests of value as they offer favorable entry and exit.

Overnight Highs (Lows): Typically, there is a low historical probability associated with overnight rally-highs (lows) ending the upside (downside) discovery process.

In the worst case, the index trades lower; activity below the $4,177.25 HVNode has the potential to reach the $4,136.25 HVNode. Beyond that level, of interest is the $4,122.25 HVNode, the $4,104.75 LVNode, and the $4,069.25 HVNode. 

Trading below the $4,029.25 overnight low (ONL) suggests a continuation of the bear trend. Caution longs.

Graphic: 4-hour profile chart of the Micro E-mini S&P 500 Futures.
Graphic: Weekly candlestick charts of the S&P 500 (top left), Nasdaq 100 (top right), Russell 2000 (bottom left), and Dow Jones Industrial Average (bottom right).
Graphic: SHIFT search suggests participants were most interested in put strikes at and below current prices in the cash-settled S&P 500 Index (INDEX: SPX) and Nasdaq 100 Index (INDEX: NDX), last week. It appears that participants were positioning themselves in strikes across further-dated expiries (e.g., June 18, 2021) suggesting more commitment.

News And Analysis

Markets | Rates remain resilient after the recent inflation scare. (MND)

Markets | Caught-short strategists are a stealth market accelerant. (BBG)

Ratings | Out-of-court restructurings may lead to repeat defaults. (S&P)

Energy | Oil, and gas benefiting from rising crude, value rotation. (BBG)

Energy | Colonial Pipeline resumes normal operations after hack. (Axios)

Markets | Selected indicators – global automotive manufacturing. (REU)

Ratings | Risk of supply chain financing, partial asset sell-downs. (S&P)

Economy | U.K.’s worse recession to turn into a stronger recovery. (S&P)

Economy | Don’t you dare say stagflation; safeguards are slipping. (BBG)

What People Are Saying

Innovation And Emerging Trends

Working | Reimagining the workplace – adapting to new normals. (S&P)

Banking | US banks could cut nearly 200K jobs over the next decade. (FT)

Space | China has made history with its successful Mars landing. (Axios)

FinTech | Cryptocurrency, and blockchain must lead in sustainability. (TC)

Energy | California Governor proposes a $3.2B EV investment plan. (TC)

About

Renato founded Physik Invest after going through years of self-education, strategy development, and trial-and-error. His work reporting in the finance and technology space, interviewing leaders such as John Chambers, founder, and CEO, JC2 Ventures, Kevin O’Leary, businessman and Shark Tank host, Catherine Wood, CEO and CIO, ARK Invest, among others, afforded him the perspective and know-how very few come by.

Having worked in engineering and majored in economics, Renato is very detailed and analytical. His approach to the markets isn’t built on hope or guessing. Instead, he leverages the unique dynamics of time and volatility to efficiently act on opportunity.

Disclaimer

At this time, Physik Invest does not manage outside capital and is not licensed. In no way should the materials herein be construed as advice. Derivatives carry a substantial risk of loss. All content is for informational purposes only.

Categories
Commentary

Market Commentary For The Week Ahead: ‘Follow The Flow’

Key Takeaways:

What Happened: After prices were advertised below balance in the week prior, responsive buyers in the S&P 500 began a rally that found acceptance back inside a larger balance-area, near the $3,800 high-open interest strike.

Thereafter, initiative buyers extended the S&P 500’s rally, breaking the index above its $3,824.25 balance-area high (BAH), before establishing acceptance near the $3,850.00 price extension, an upside target, and auctioning back into range, repairing poor structures left in the wake of discovery.

What Does It Mean: In light of a failed breakdown in the week prior, U.S. stock indexes were best positioned for further downside discovery. However, after what appears to be aggressive buying in response to prices below value, it was clear that was not the case.

This leads to the following question: why did selling stop on January 15? One answer, aside from a positive start to the earnings season and prospects for further stimulus, may be OPEX, the January 15 option expiry. On expiration days, delta and gamma exposures change — depending on how derivatives exposure is removed or rolled — which causes dealers to adjust hedges.

According to SpotGamma, the January 15 expiry “resulted in a ~50% reduction in single stock gamma … [which] creates volatility because, as large options positions expire[], are closed and/or rolled, dealers have large hedges they need to adjust. There is a trove of data to suggest that the bulk of single stock call activity is long calls, and based on that we believe dealers (who are short calls vs long stock) therefore have long stock positions to sell.”

Put more simply, the price action may have been attributable to the sale of long stock that hedged expiring short derivatives exposure above the market (i.e., call side).

Per the SpotGamma S&P 500 dealer hedging graphic for the January 15 expiry below, “The black line was the mark on Thursday evening, with the red line being the forecasted position on Tuesday. This red line being substantially lower than the black suggests that dealers had to reduce delta exposure as a result of expiration. Note there is a larger shift at overhead prices suggesting this was a ‘call heavy’ expiration.”

Graphic 1: SpotGamma S&P 500 dealer hedging graphic for the January 15 options expiry

After the VIX (i.e., CBOE’s Volatility Index) expiry on January 20, alongside the inauguration of President Joe Biden, the prospects for a rally improved as “event premium in IV dries up … [and] put values drop, which allows dealers (who are short puts) to buy back short hedges … [fueling] a quick rally up to the 3850SPX/385SPY level (green arrow).”

Graphic 2: SpotGamma S&P 500 Gamma Levels

Adding, the number of put options sold to open exceeded the number bought to open, per SpotGamma, suggesting increased confidence in higher prices as market participants look to options for income, and not insurance.

Historically, the returns after such developments are mixed — more often the appearance of strong initiative buying surfaces (e.g., August and January 2020) before a liquidation helps correct excess inventory, and bring sense back into the market.

Graphic 3: SpotGamma plots opening option positions.

What To Expect: During Friday’s session in the S&P 500, responsive buying surfaced after a test of the $3,818.25 High-Volume Node (HVNode), above the $3,813.50 ledge (below which is a pocket of low-volume).

In the simplest way, high-volume areas can be thought of as building blocks. A structurally sound market will build on past areas of high-volume. Should the market trend for long periods of time, it will lack sound structure (identified as a low-volume area which denotes directional conviction and ought to offer support on any test).

If participants were to auction and find acceptance into areas of prior low-volume, then future discovery ought to be volatile and quick as participants look to areas of value for favorable entry or exit.

After the S&P 500 found acceptance above the $3,813.50 ledge and $3,824.25 BAH, it encountered responsive selling near the $3,840.75 HVNode, the site of a downtrend line. Since the selling transpired at a visual level, market participants know that technically-driven, short-term traders in control. In other words, institutions (e.g, funds) tend not to transact at exact technical levels.

Given the aforementioned dynamics, participants will come into Monday’s session knowing the following:

  1. The S&P 500’s higher-time frame breakout remains intact, per graphics 7, 8, and 9.
  2. Late last year, JPMorgan Chase & Co. (NYSE: JPM) strategist Marko Kolanovic suggested equities would rally with the S&P 500 auctioning as high as $4,000 on the basis of low rates, improved fundamentals, buybacks, as well as systematic and hedge fund strategies. Since then, Kolanovic downgraded growth and expressed the limited potential for further upside.
  3. The earnings of heavily weighted index constituents suggests participants discount improved speculative flows and delta (e.g., presence of committed buying or selling as measured by volume delta). Please see graphics 4, 5, and 6.
Graphic 4: Supportive order flow in the SPDR S&P 500 ETF Trust (NYSE: SPY), the largest ETF that tracks the S&P 500, on January 20 trend day.
Graphic 5: Supportive order flow in the SPDR S&P 500 ETF Trust (NYSE: SPY), the largest ETF that tracks the S&P 500, on January 22.
Graphic 6: Speculative derivatives activity for the week ending January 23, 2021.
Graphic 7: Daily candlestick chart of the cash S&P 500 Index

Given the above dynamics, the following frameworks apply for next week’s trade.

In the best case, the S&P 500 takes back Friday’s liquidation and auctions above the $3,840.75 HVNode. Expectations thereafter include continued balance or initiative buying to take out the $3,859.75 overnight all-time high (there is a low probability that overnight all-time highs end the upside discovery process). Thereafter buying continues as high as the $3,884.75 price projection, or double the width of the balance-area, the typical target on a balance-area breakout.

In the worst case, any break that finds increased involvement (i.e., supportive flows and delta) below $3,824.25 BAH, would favor continuation as low as the $3,763.75 BAL.

Graphic 8: Profile overlays on a 15-minute candlestick chart of the Micro E-mini S&P 500 Futures

Conclusions: Despite broad-market indices being in a longer-term uptrend, the odds of substantial upside resolve are low. Participants ought to look for favorable areas to transact, such as those high-volume areas in the S&P 500 featured in graphic 8.

All in all, the risk and reward dynamics, at these price levels, are poor.

Graphic 9: 4-hour profile chart of the Micro E-mini S&P 500 Futures

Levels Of Interest: $3,884.75, $3,859.75, $3,840.75 HVNode, $3,824.25 BAH, $3,763.75 BAL.

Cover photo by Jayant Kulkarni from Pexels.