The daily brief is a free glimpse into the prevailing fundamental and technical drivers of U.S. equity market products. Join the 980+ that read this report daily, below!
Administrative
Apologies for the delay. Hectic end-of-week! A little heavy on the fundamental side of things and light on the positioning. More to unpack next week. Have a great weekend!
Fundamental
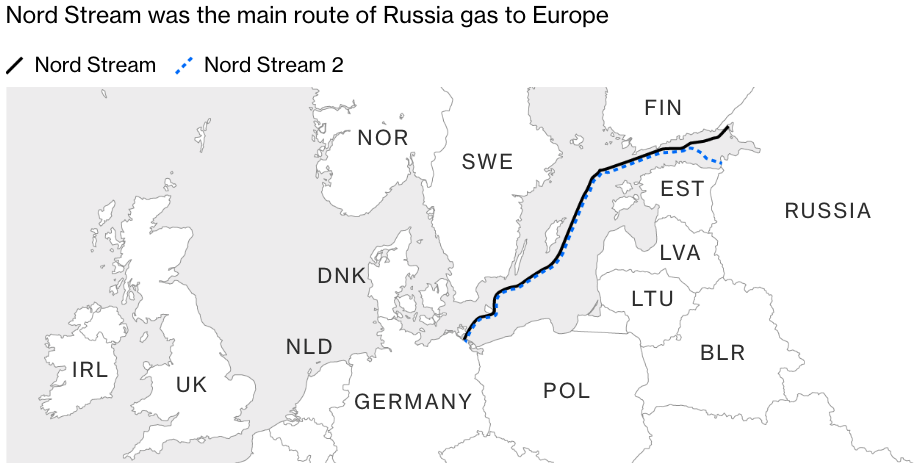
As an update to our September 29, 2022 letter, Russia responded to the Nord Stream attack suggesting the incident spoke of state-sponsored “terrorism”, all the while “an EU official said the incident had fundamentally changed the nature of the conflict in Ukraine,” per Refinitiv.
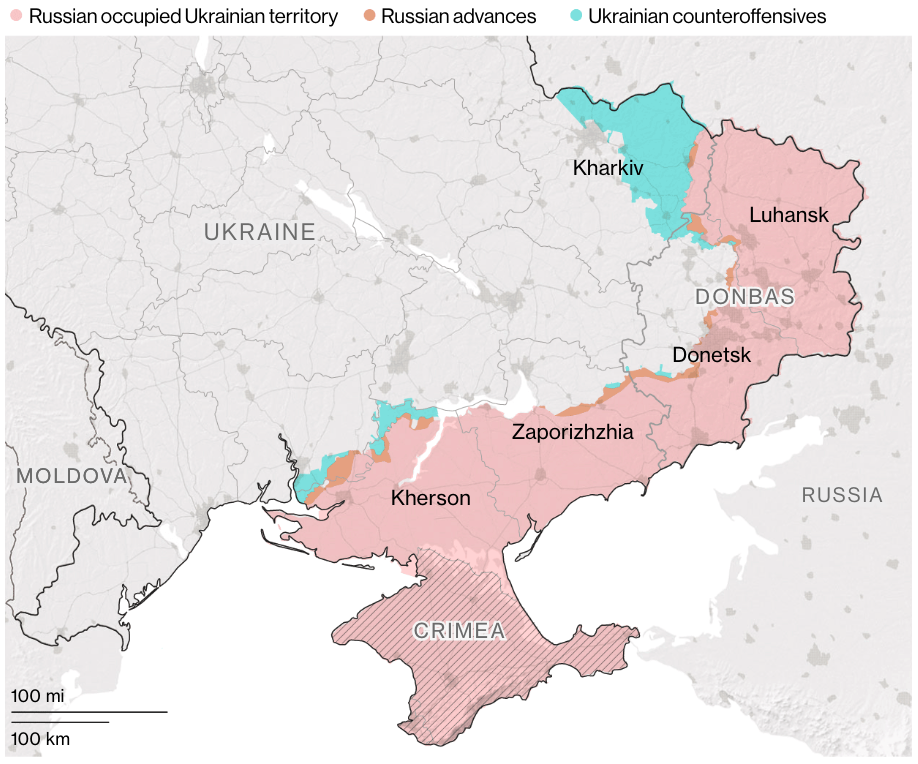
In short, Russia’s throwing blame on the US, among others, suggesting it was likely to benefit through a boost in liquefied natural gas (LNG) sales. Russia previously said the leaks were in areas “fully under the control” of US intelligence agencies.
It’s the case that in February 2022, Joe Biden commented that if Russia invaded Ukraine, there would “no longer be a Nord Stream 2,” also.
In response, Nord Stream 1 leaks will be stopped on Monday with no forecasts yet on the future of the pipeline’s operation.
To note, the pipelines were not “supplying gas to Europe when the leaks were first detected, … [but] both had gas in them.” Regardless, the EU will be assessing the application of sanctions.
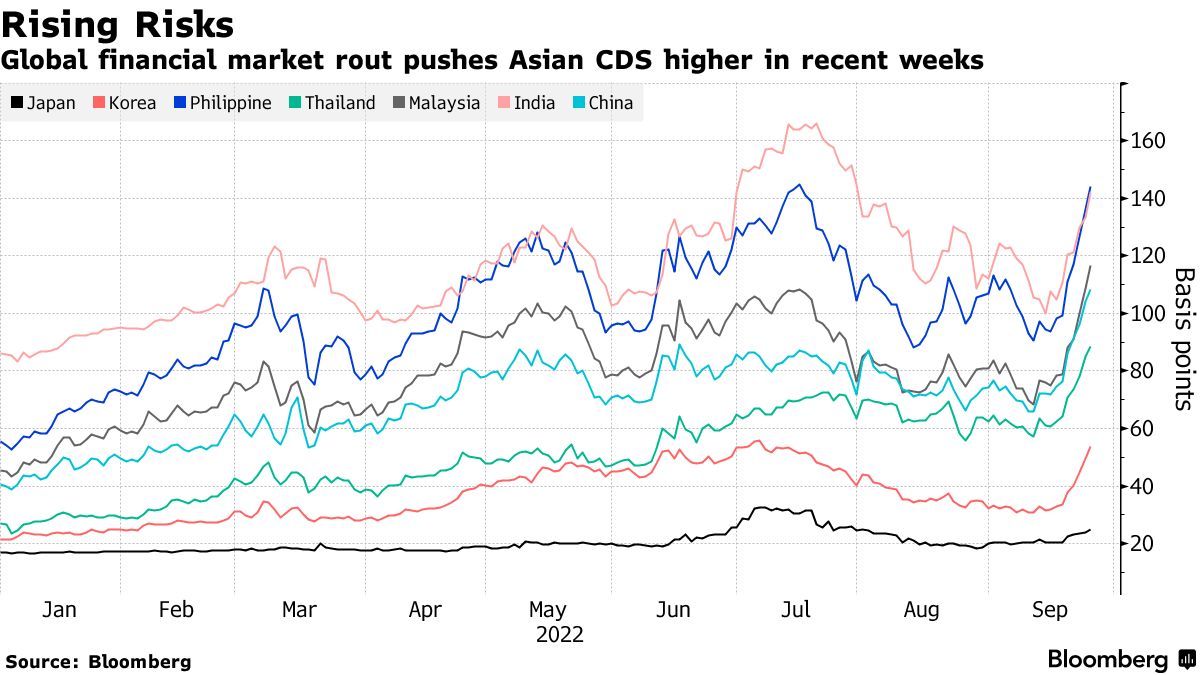
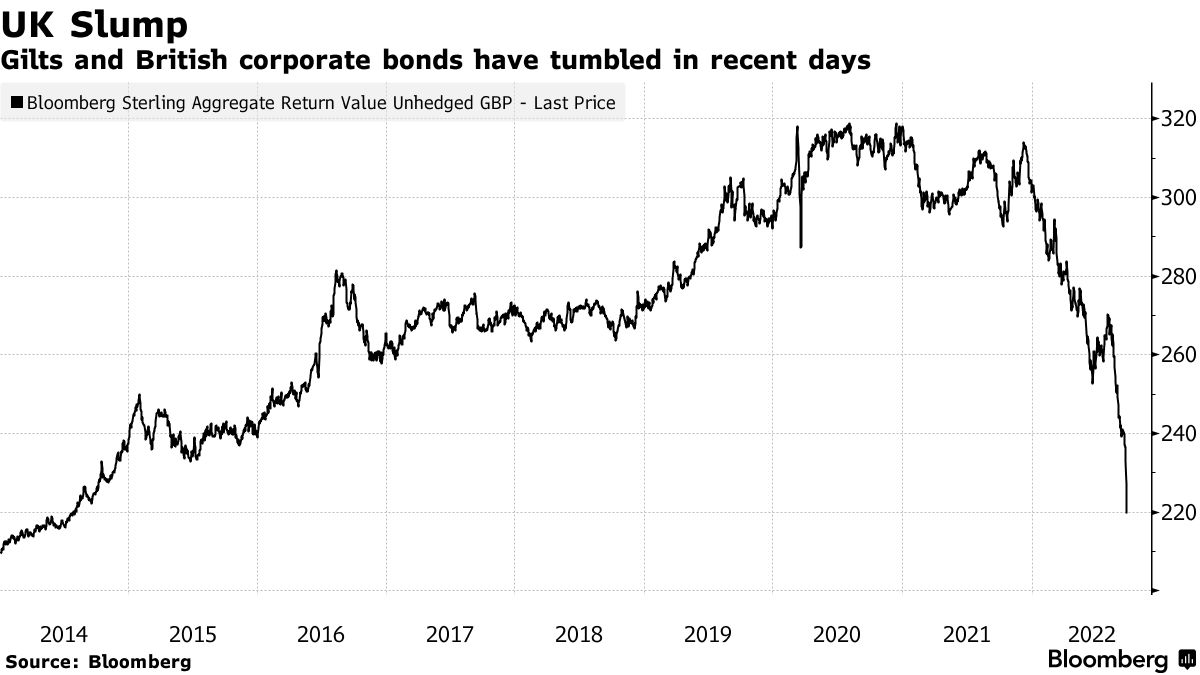
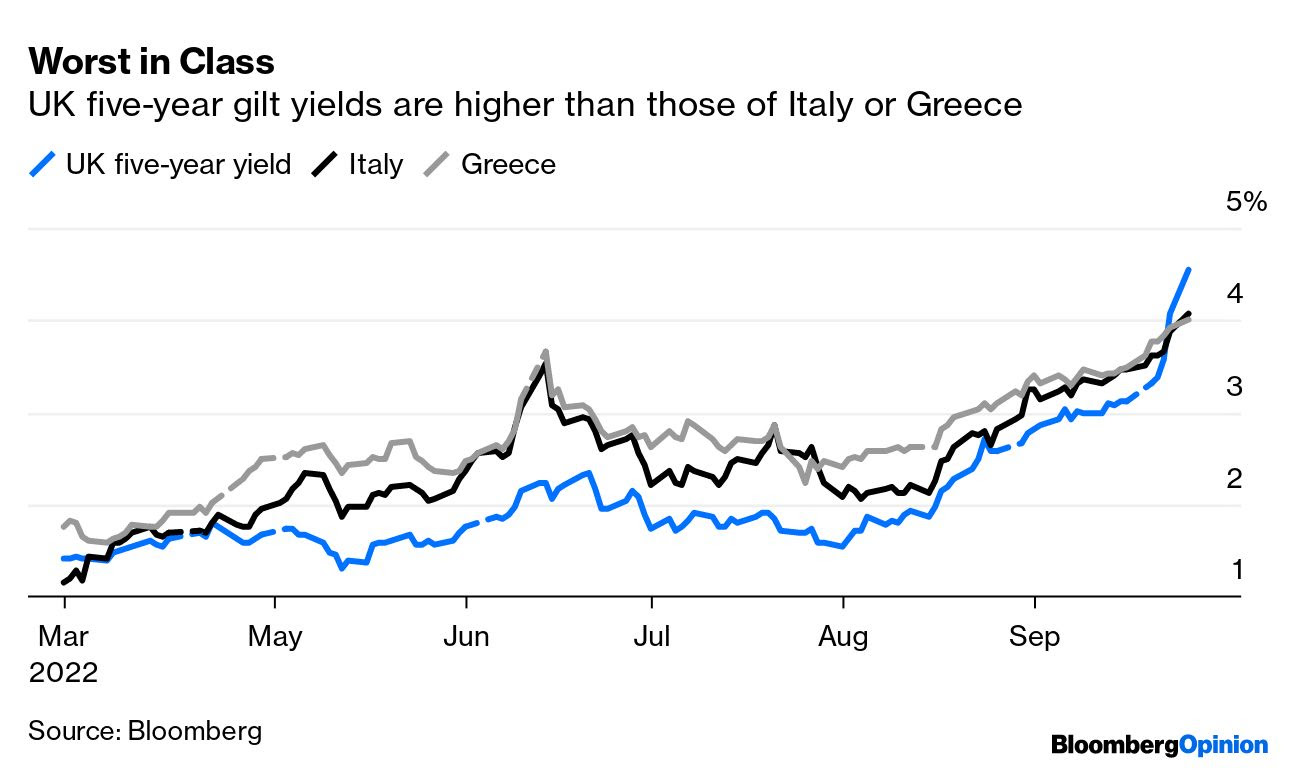
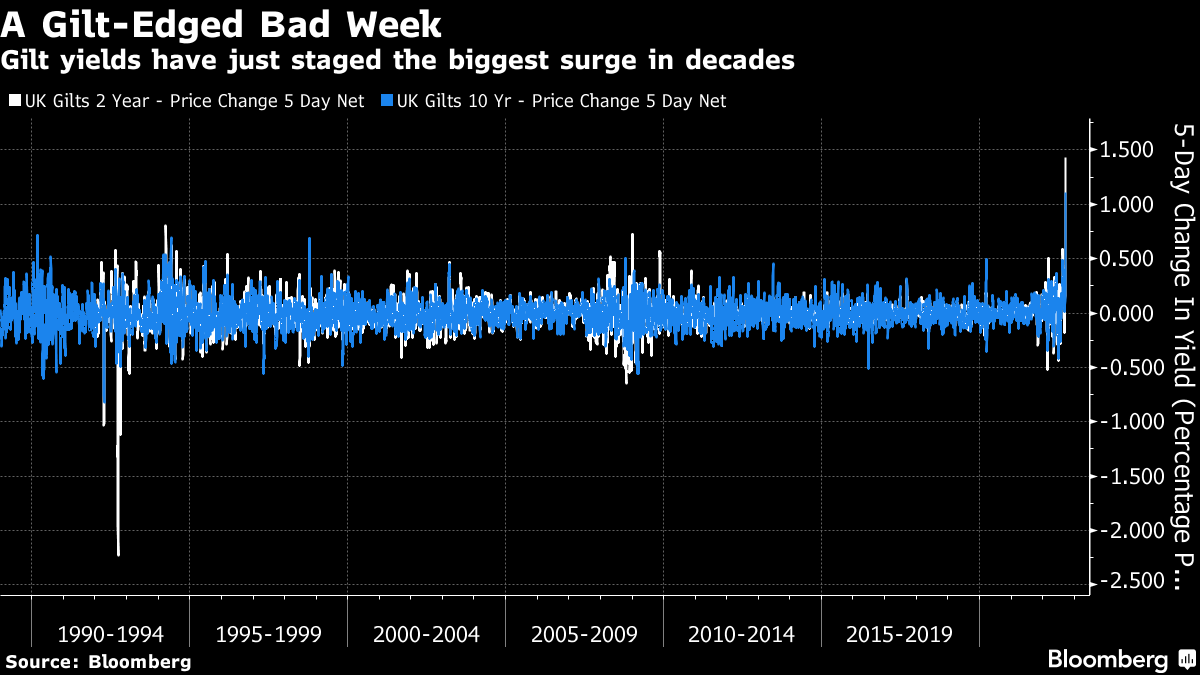
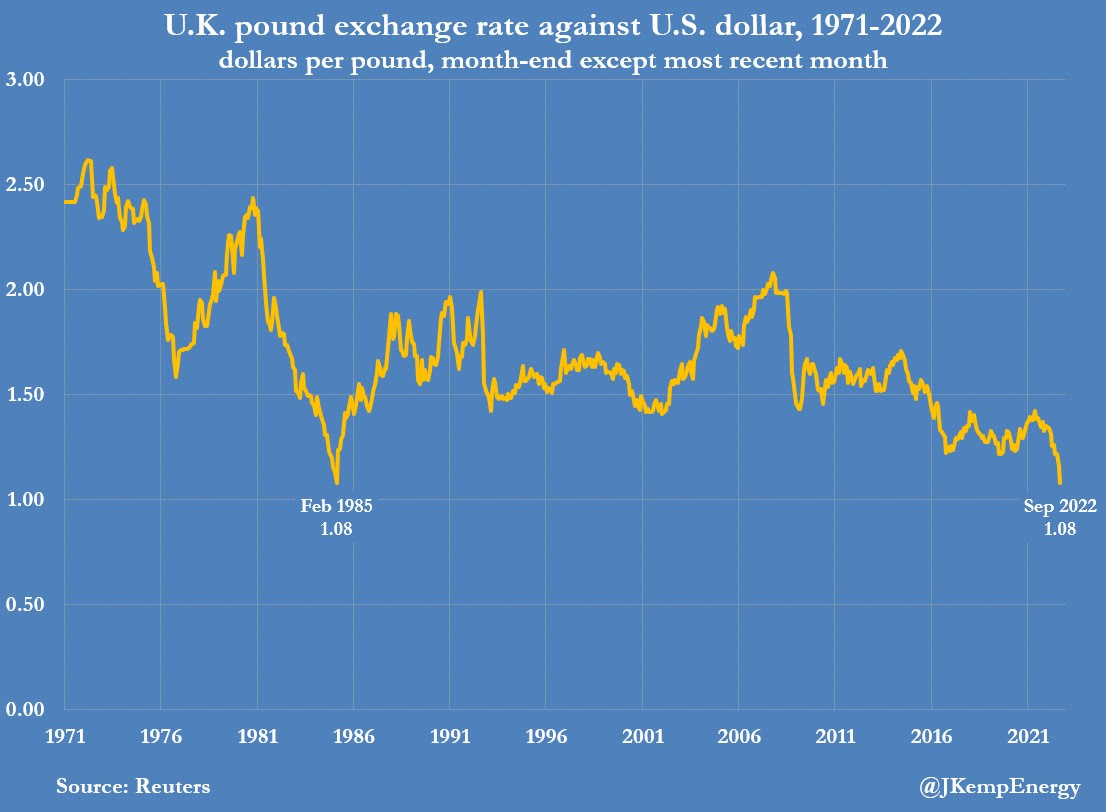
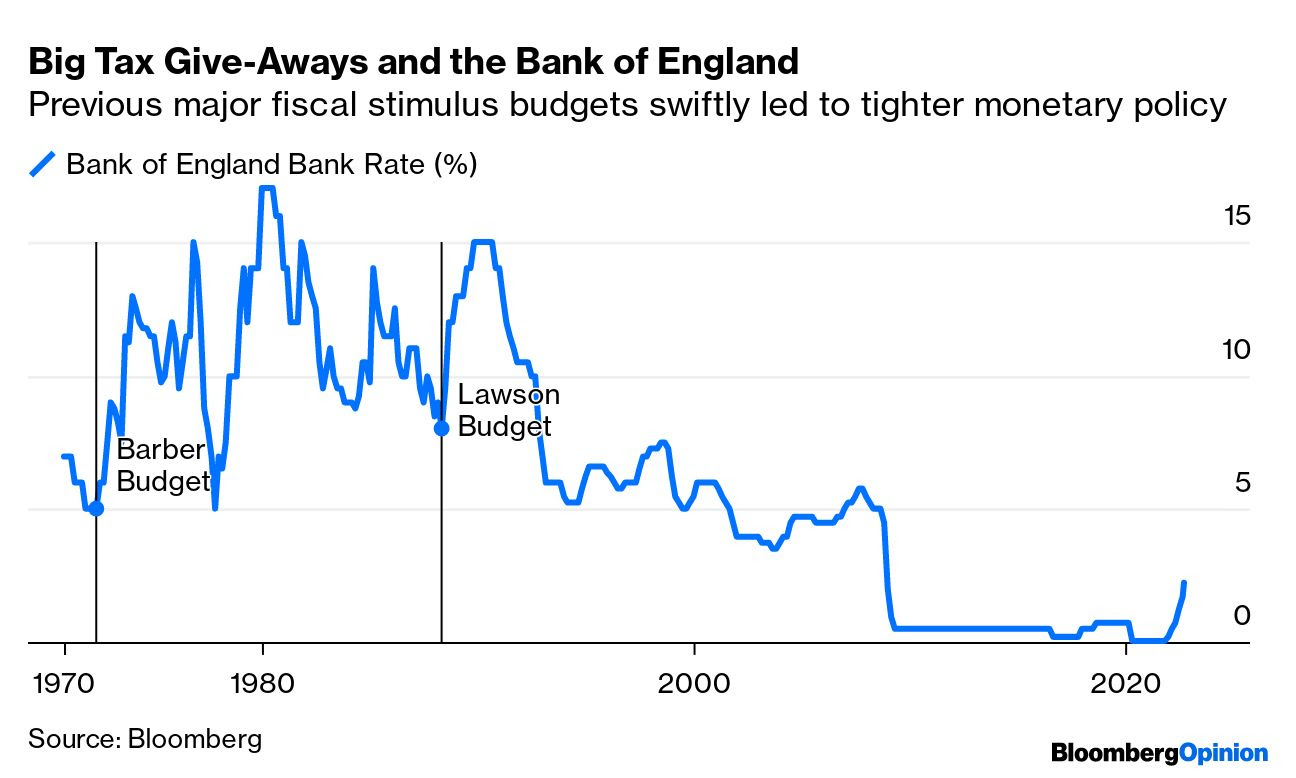
Moving on, as a recap, this week there was tons of volatility in overseas fixed income and FX markets. In short, the announcement of new fiscal policies coincided with market volatility that prompted reflexive feedback responses, which we dissected in our September 29, 2022 letter.
A cascade of margin calls, during the route to 7-8% yields, would have put in jeopardy 90% of UK pension funds.
To explain, per Reuters, there are schemes “that pay pensioners a fixed annual amount, often a portion of the final salary they earned as employees.” The schemes invest about 50% of assets in bonds, in order to have cash on hand and pay pension liabilities.
To reduce the effects of market volatility, positions are hedged through derivatives “managed by so-called liability-driven investment (LDI) funds,” Reuters well explained. “For example, pension schemes might pay the floating rate leg of an interest rate swap and receive fixed rates.”
Due to the leverage, market moves have an amplified effect on the funds. Therefore, if bonds fall too much, too fast, more cash must be sent to these LDIs.
“[P]ositions become loss-making – they are paying out more money in the transaction than they are receiving.”
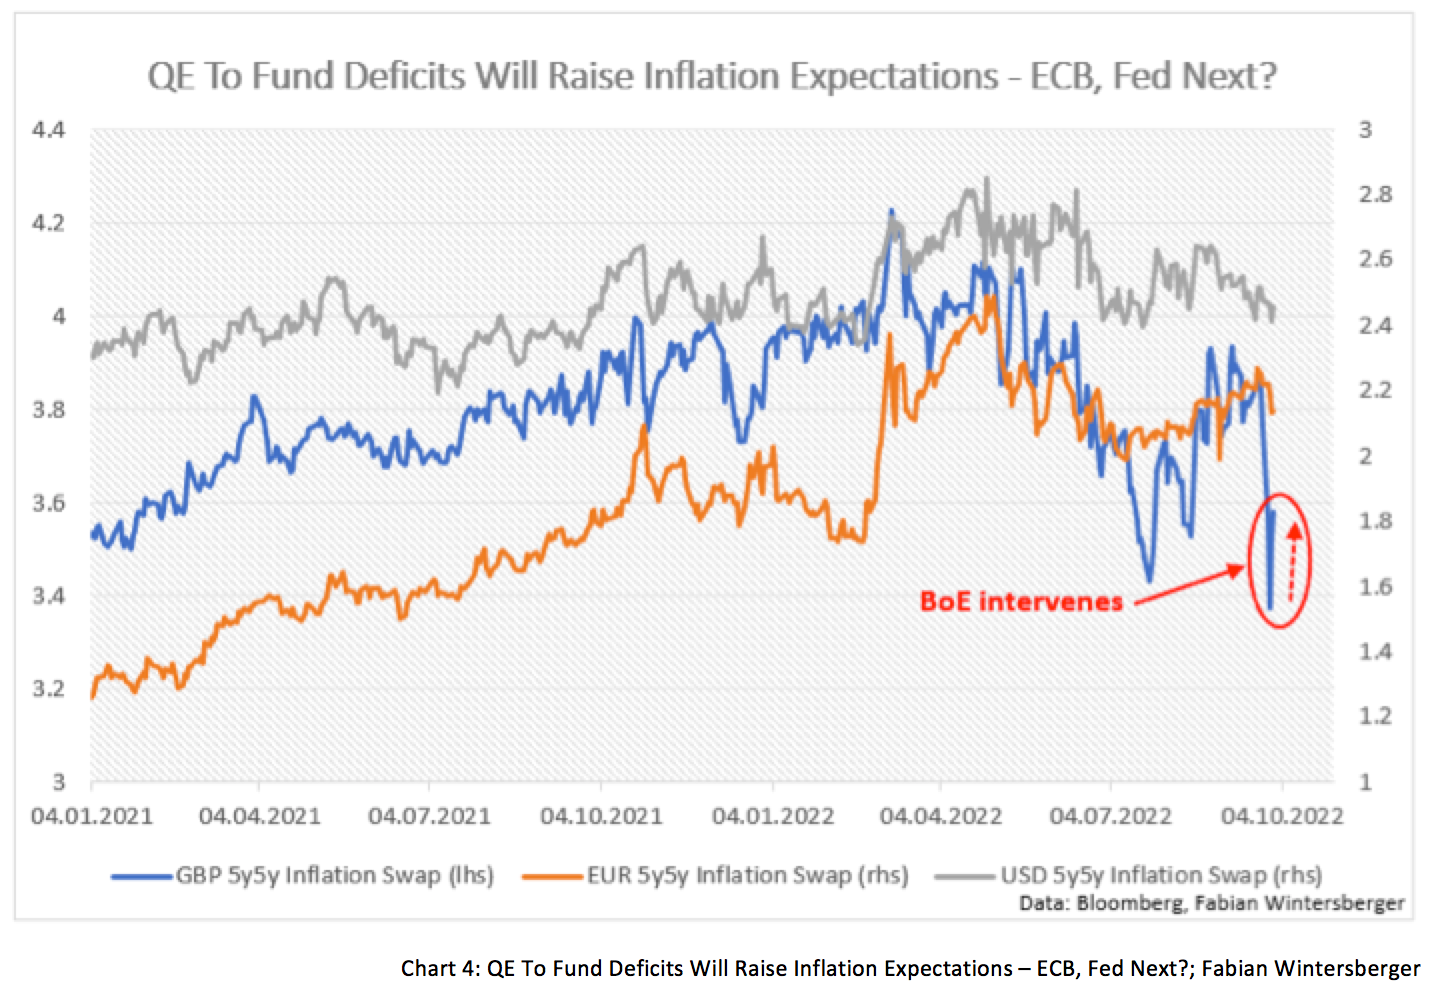
In some cases, schemes were to have “cash reserves to cope with a 200 bps rise in swap rates over a year. However, 30-year gilt interest rate swaps … rose 360 bps this year and 120 bps in the last few days before the BoE stepped in” and bought bonds, boosting inflation expectations, the thing that monetary tightening was, in part, intended to reduce.
Accordingly, pensions sold gilts to “ready cash to meet those collateral calls, or they were kicked out of their derivatives positions because they could not pay up in time and had to sell gilts to avoid having a naked exposure to further sharp moves.”
The BoE’s actions calm the market allowing for the more orderly processing of transactions.
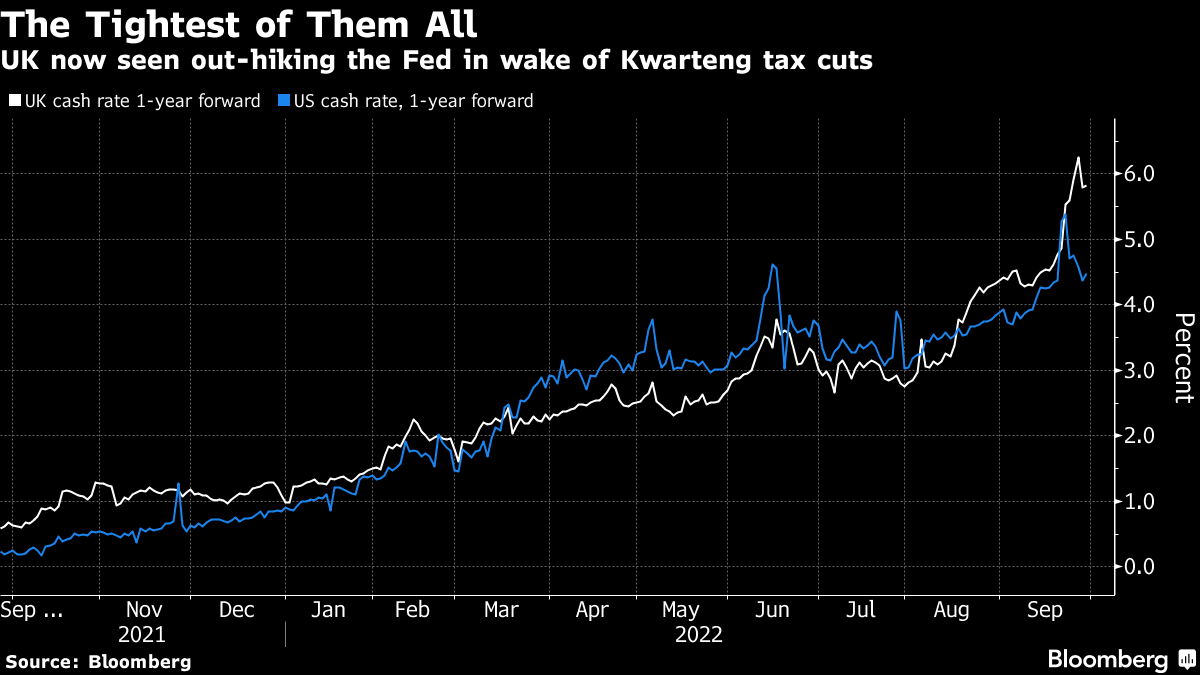
Still, the UK is seen “out-hiking the Fed in the wake of Kwarteng tax cuts,” while “schemes are running out of cash.”
The risks don’t just stop there, though, we added.
For one, there’s damage to be had if FX hedges go awry, which we said would likely prompt a call for collateral, too; investors will “buy overseas assets and hedge away the currency risk,” Jim Leaviss explained. “[I]f you had bought a dollar bond and hedged it, the dollars that you have effectively sold ‘short’ against sterling as the hedge have rallied, and the counterparty to the FX hedge will call for a collateral payment.”
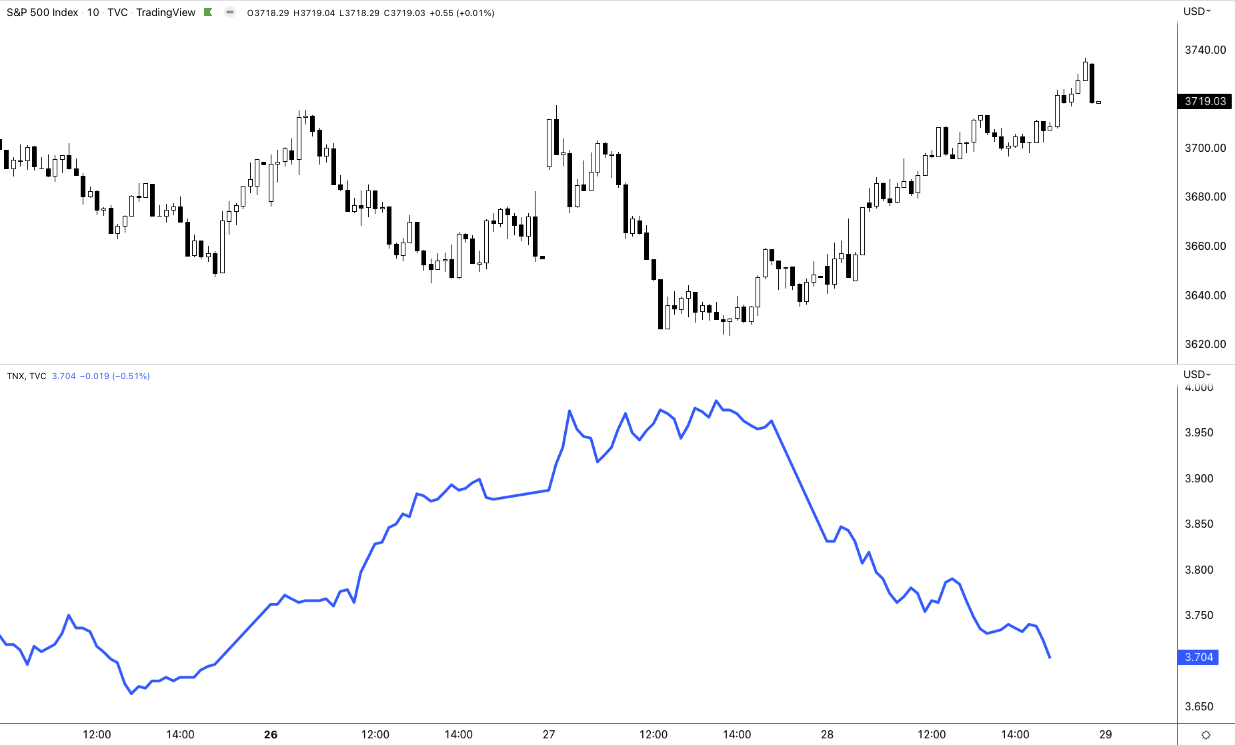
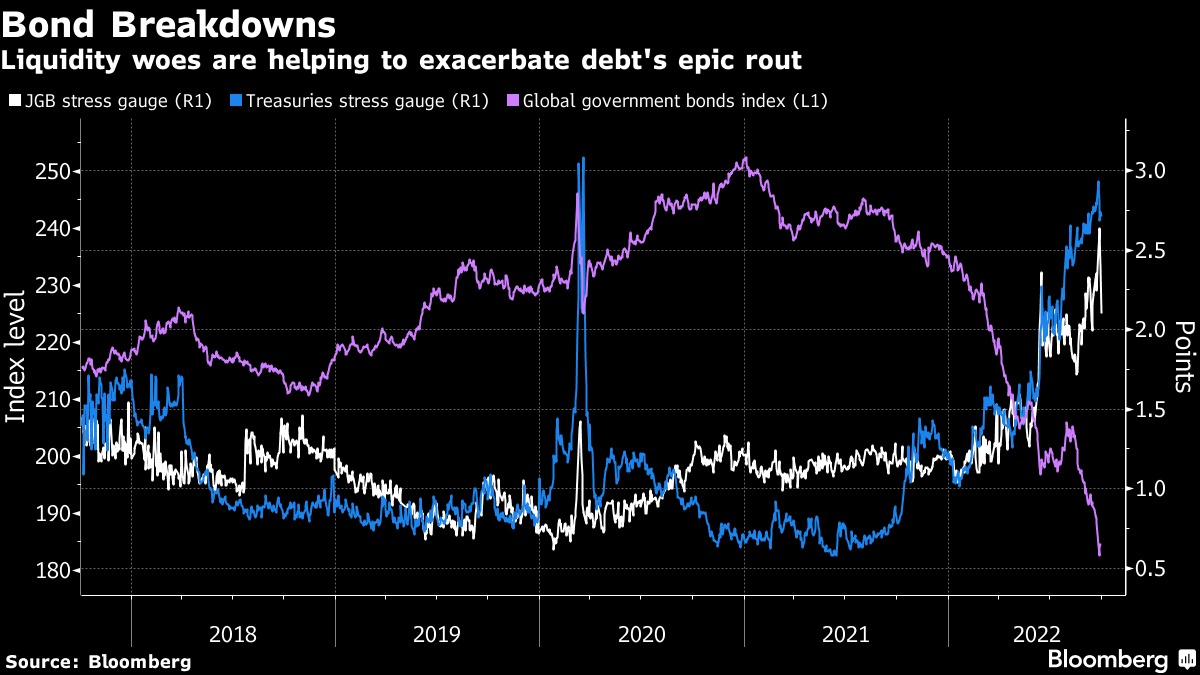
The actions of the recent days likely put investors in a position of less liquid assets to meet the (potential) collateral calls, and this is part of the aforementioned technical factors that are likely to have a bearing on the direction of bonds and yields “over coming months.”
Additionally, some participants speculate the US may run into similar issues as the UK. A single (unconfirmed) participant explained pensions may be “selling equities and other asset classes to meet their swap obligations.”
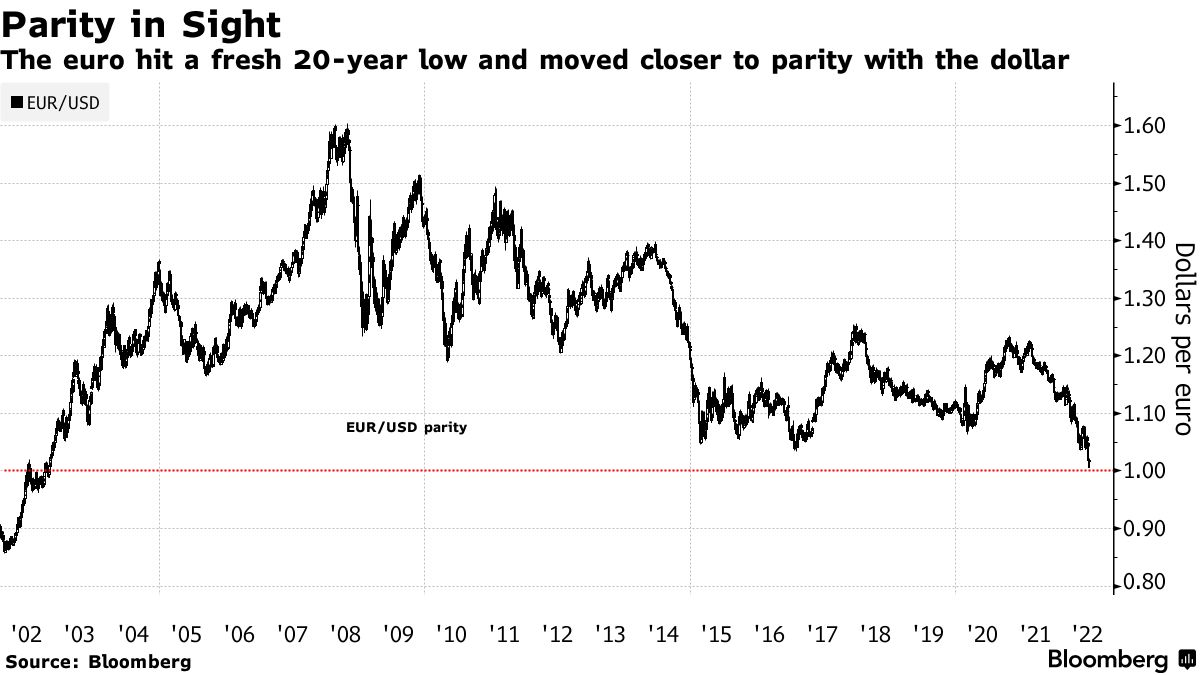
Separately, another topic of discussion was the People’s Bank of China (PBOC) telling state-run banks to prepare for the shedding of dollar holdings to buy and assist in propping up the yuan.
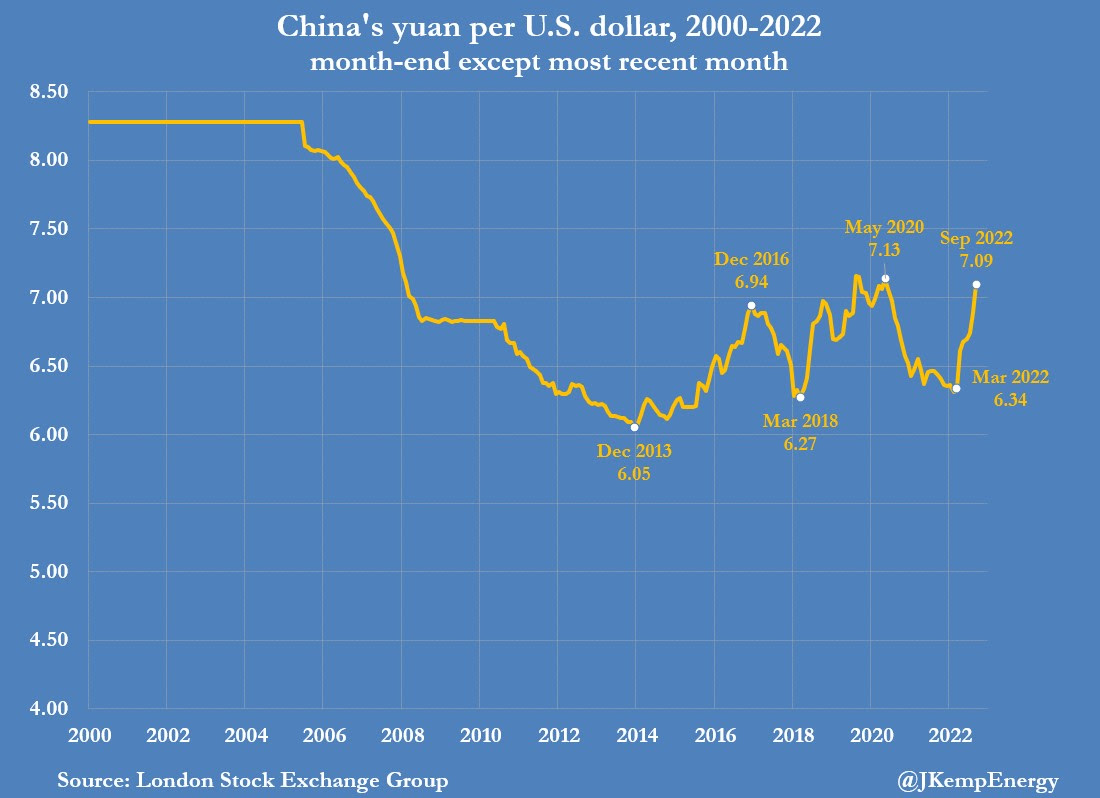
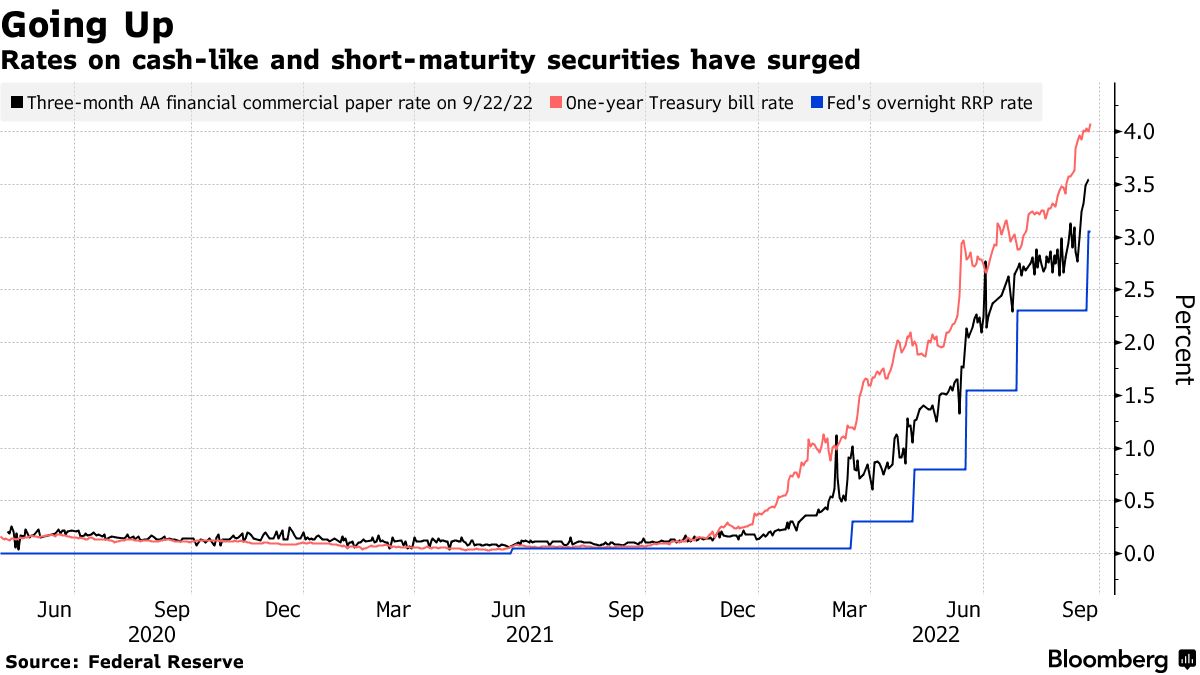
This is all the while the Federal Reserve (Fed), to address problems of its own (e.g., real estate affordability) is implementing aggressive monetary tightening (prompting a rise in the dollar and triggering a “reverse currency war”).
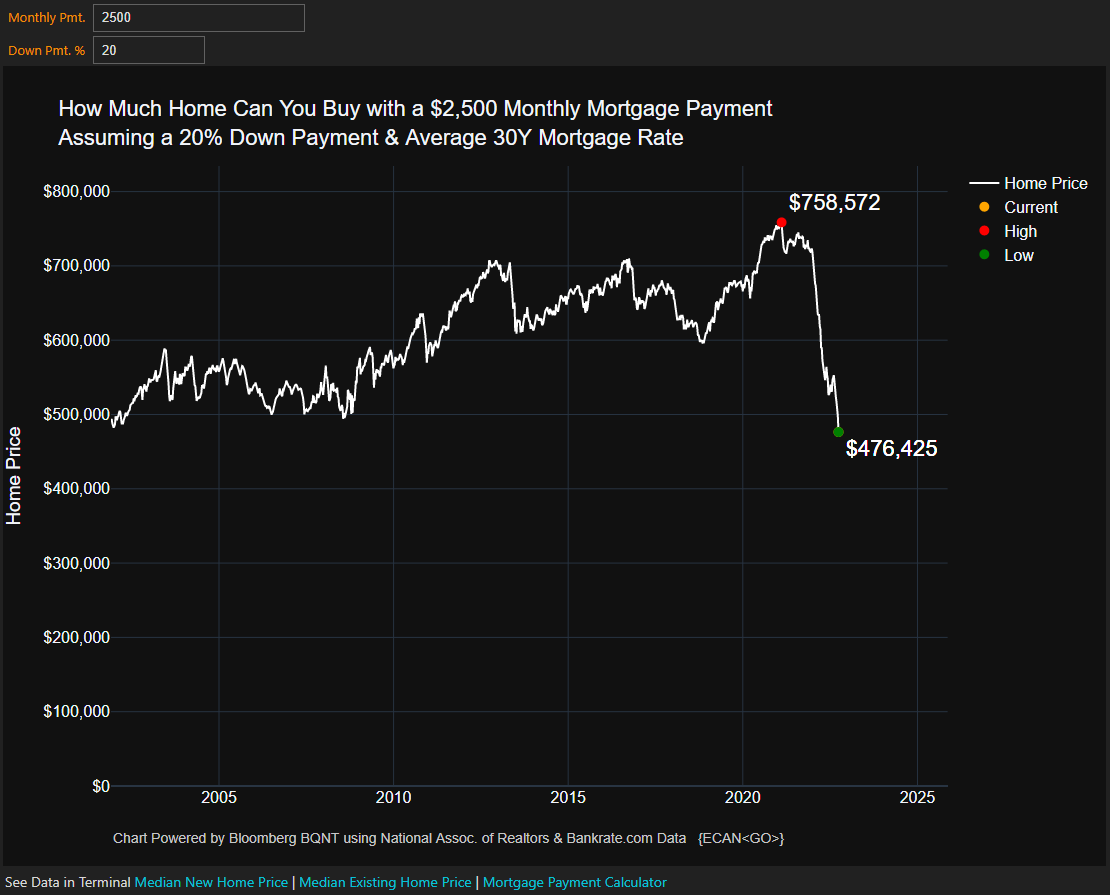
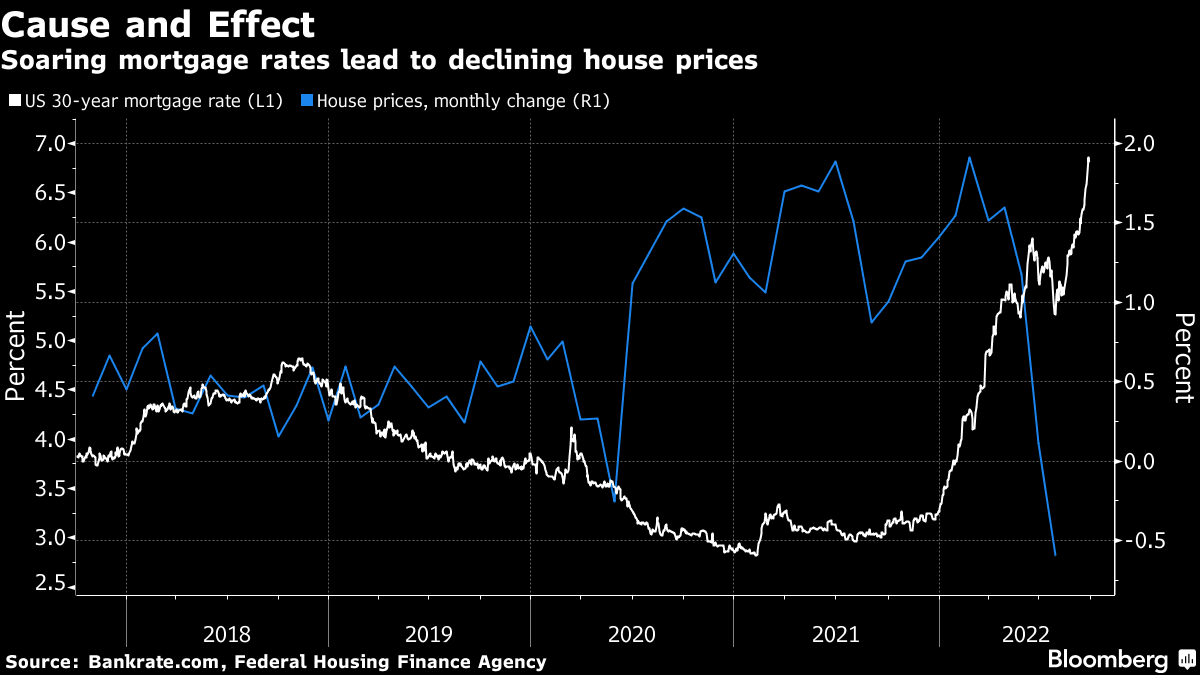
As an aside, US mortgage rates hit a 15-year high and home prices are falling.
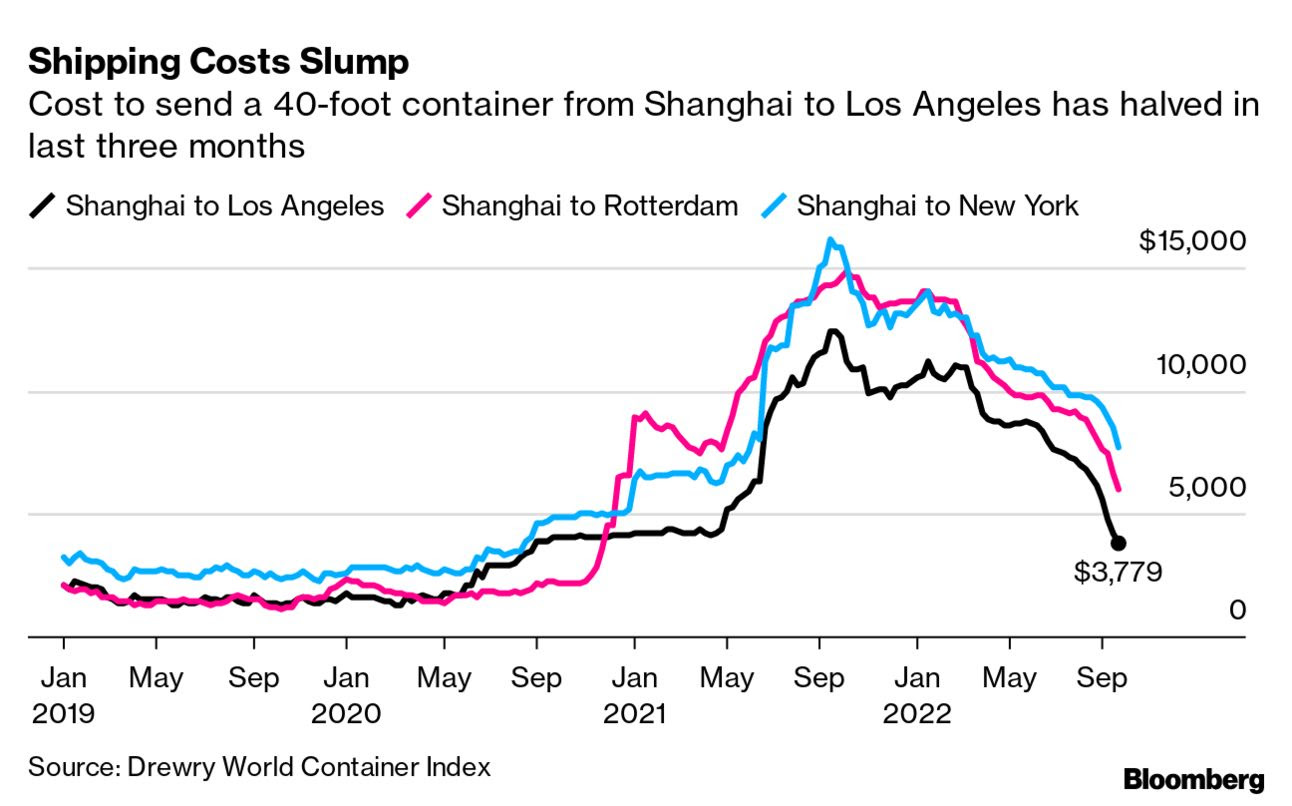
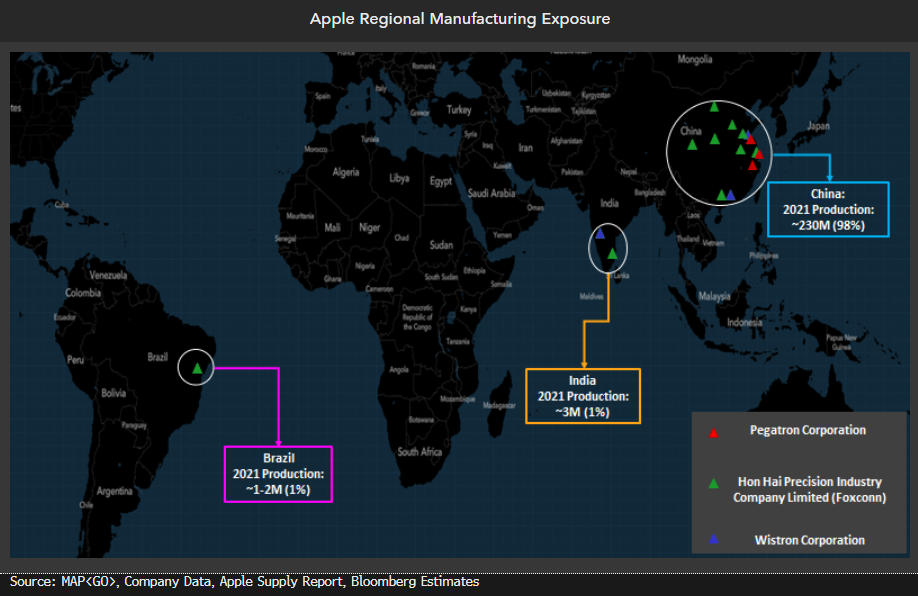
China is looking to do less of the same and “spark growth in an economy that’s been dragged down by COVID-19 lockdowns, a real estate crash, and supply chain snags,” which have hurt some US firms including Apple Inc (NASDAQ: AAPL).
That’s the mismatch (i.e., China easy, US uneasy) that’s going on and, per some, the Fed may be acting on a set of lagging indicators; monetary policy action may do more harm than good.
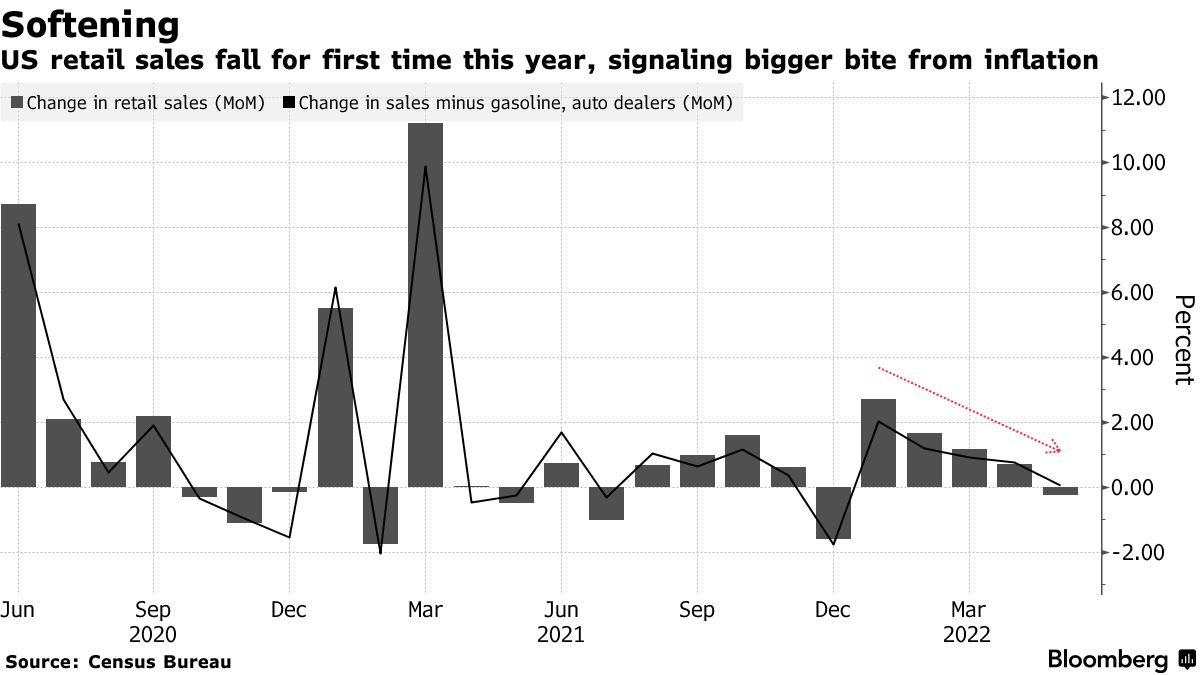
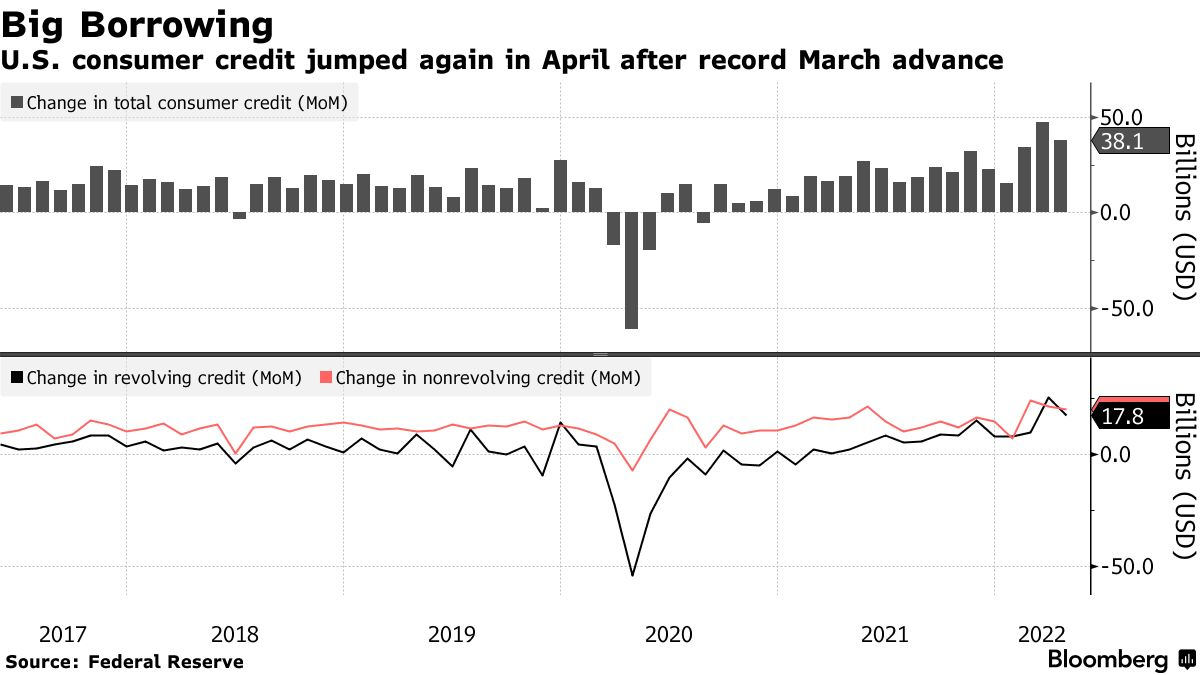
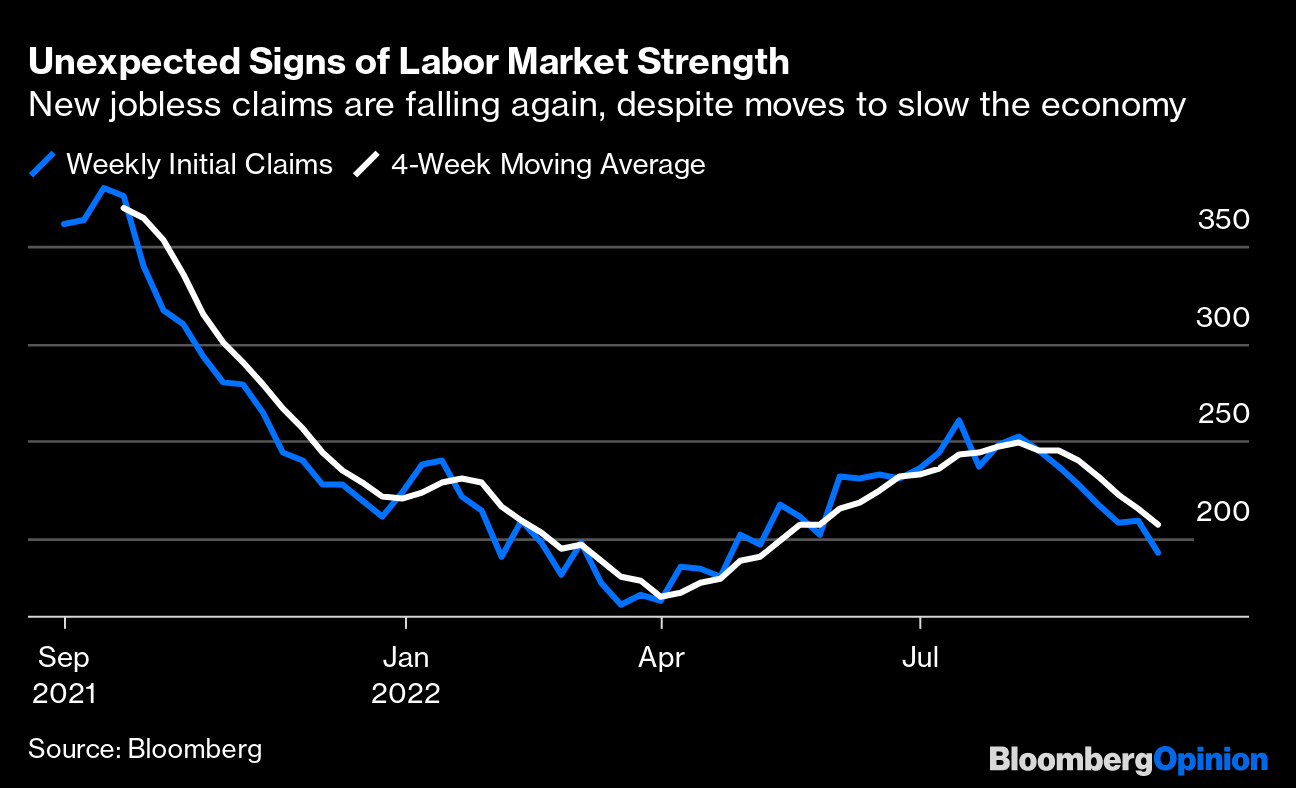
But, for now, a robust labor market and continued spending by American consumers have some feeling there’s far more room to go before US monetary policy does more harm than good.
Positioning
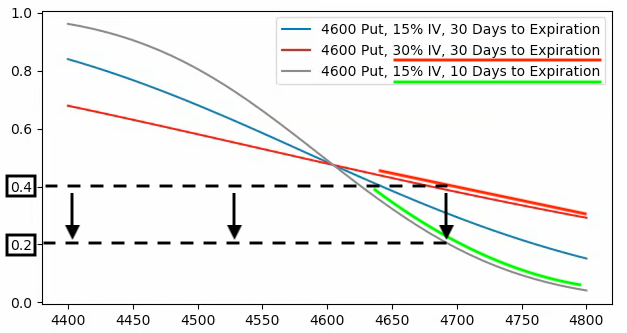
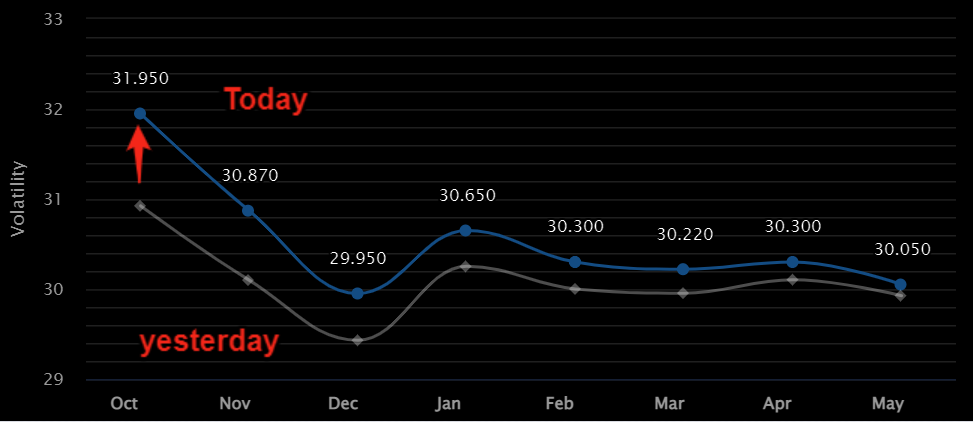
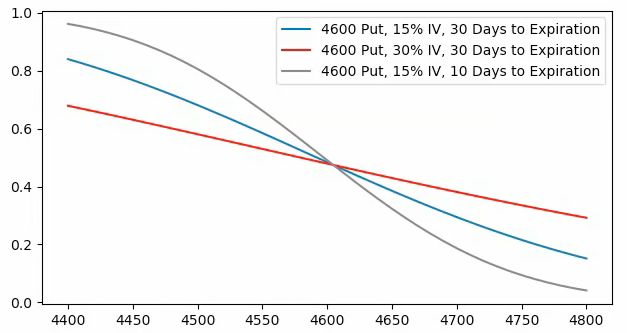
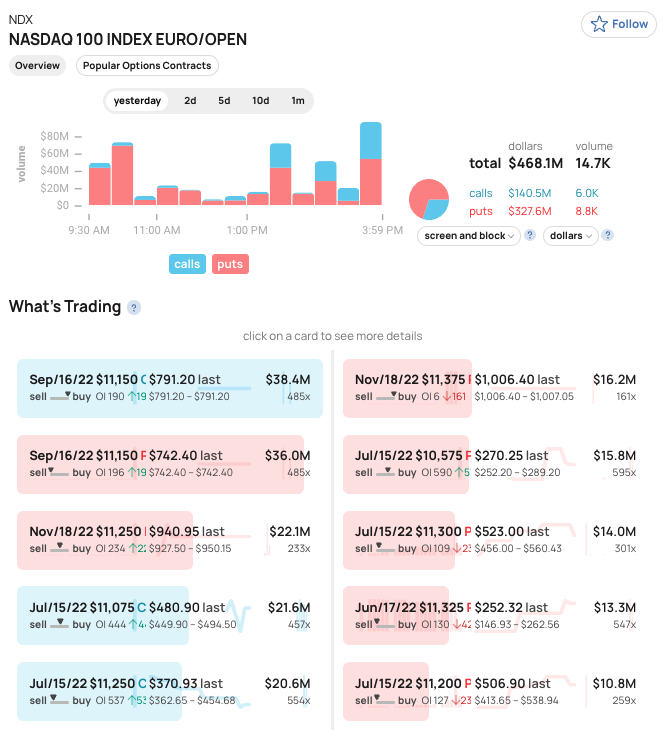
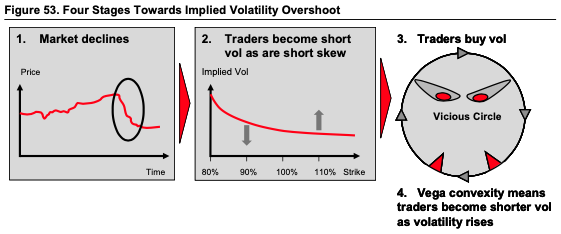
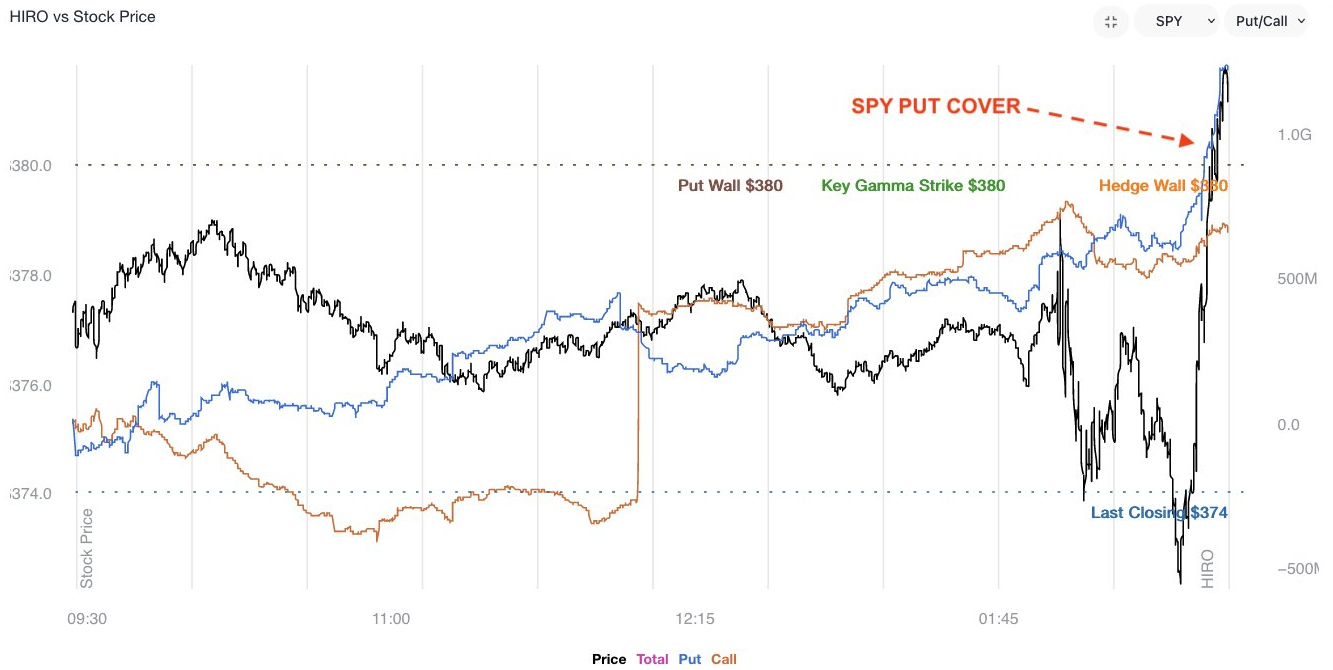
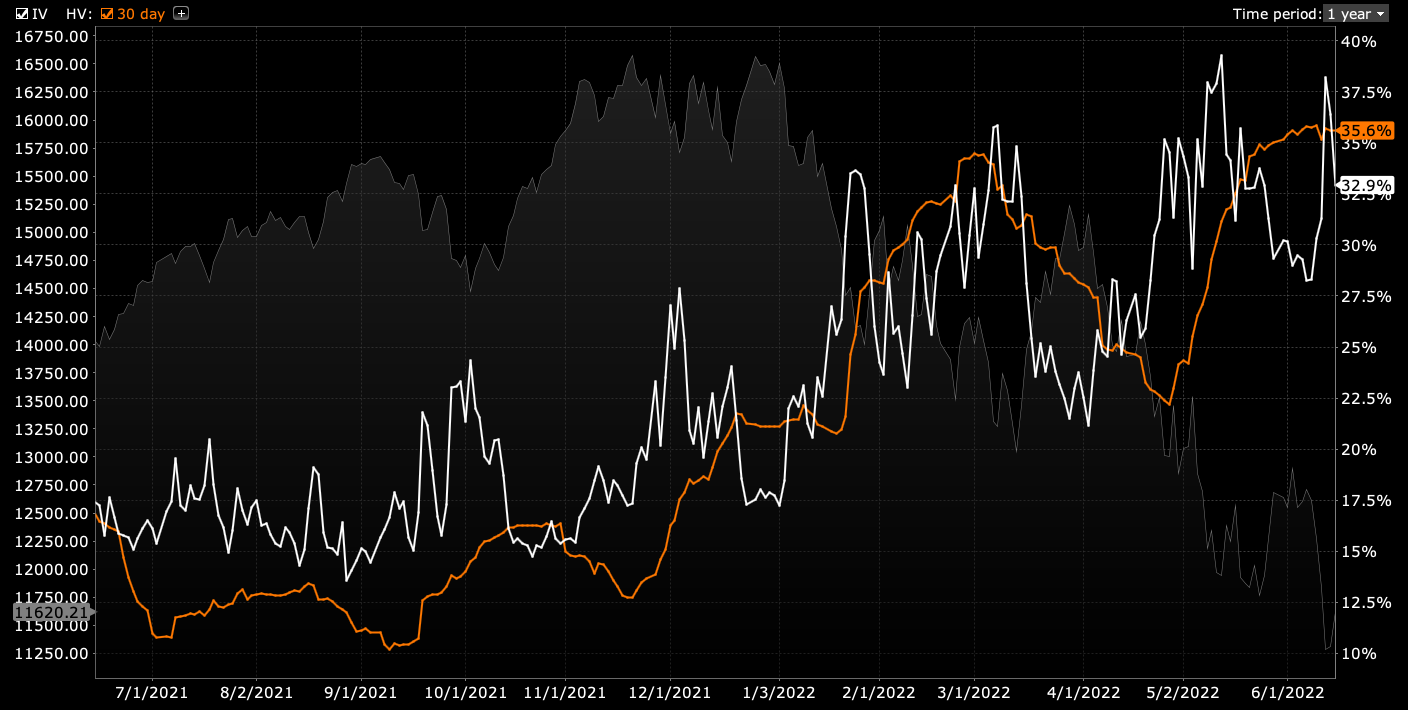
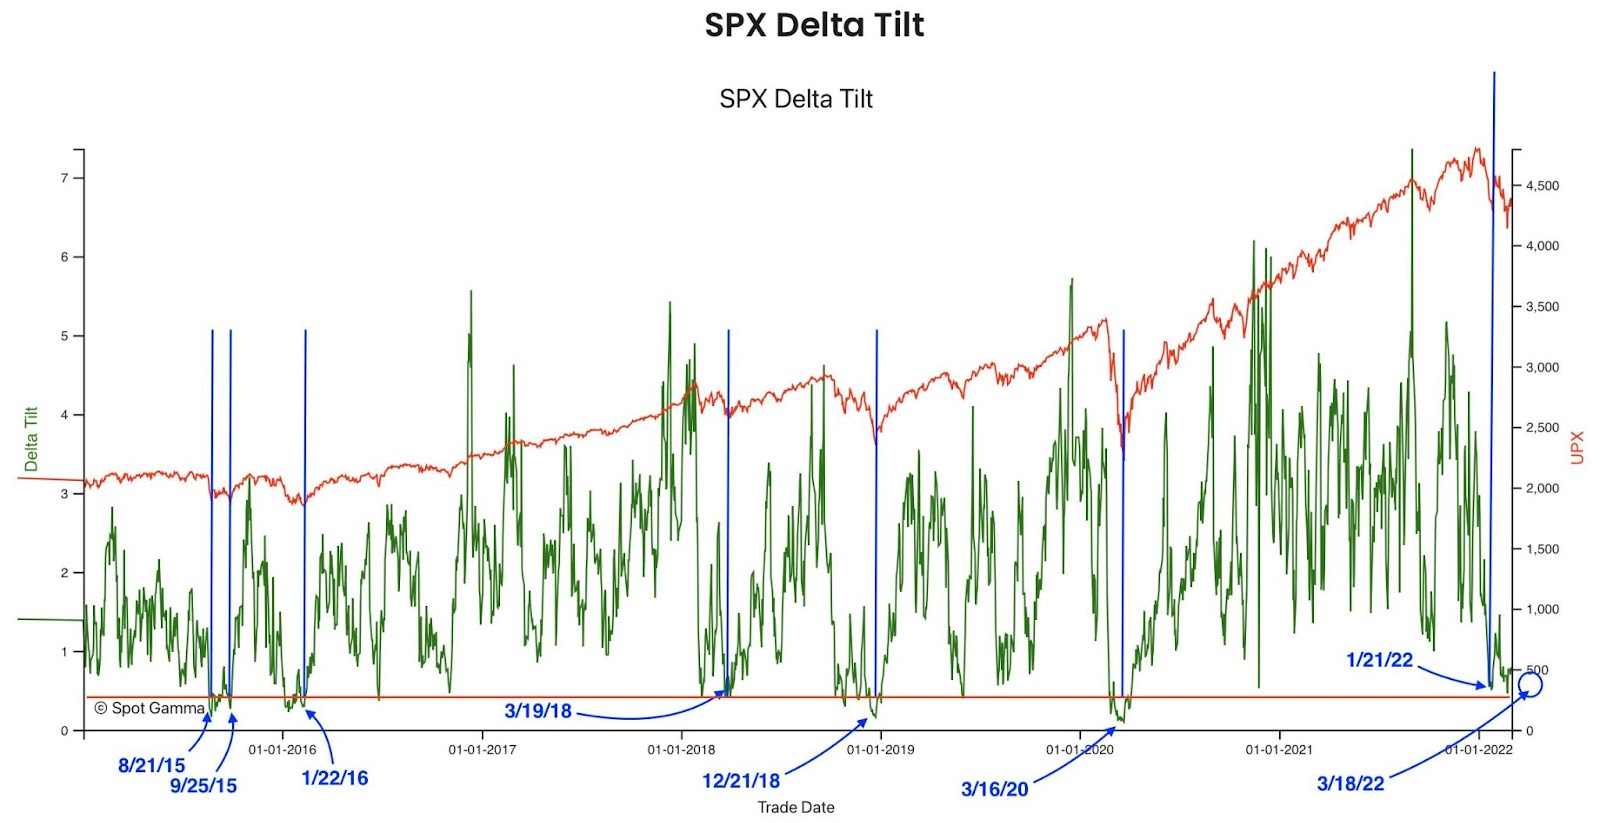
All that was said yesterday, and earlier this week, remains valid. In short, the decline prompted traders to demand downside protection, and this wound measures of implied volatility (IVOL).
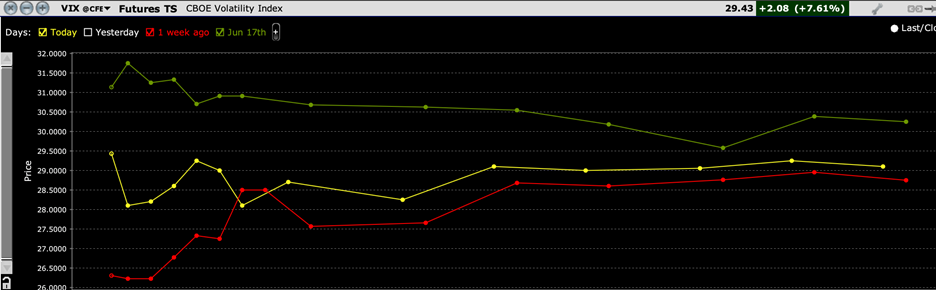
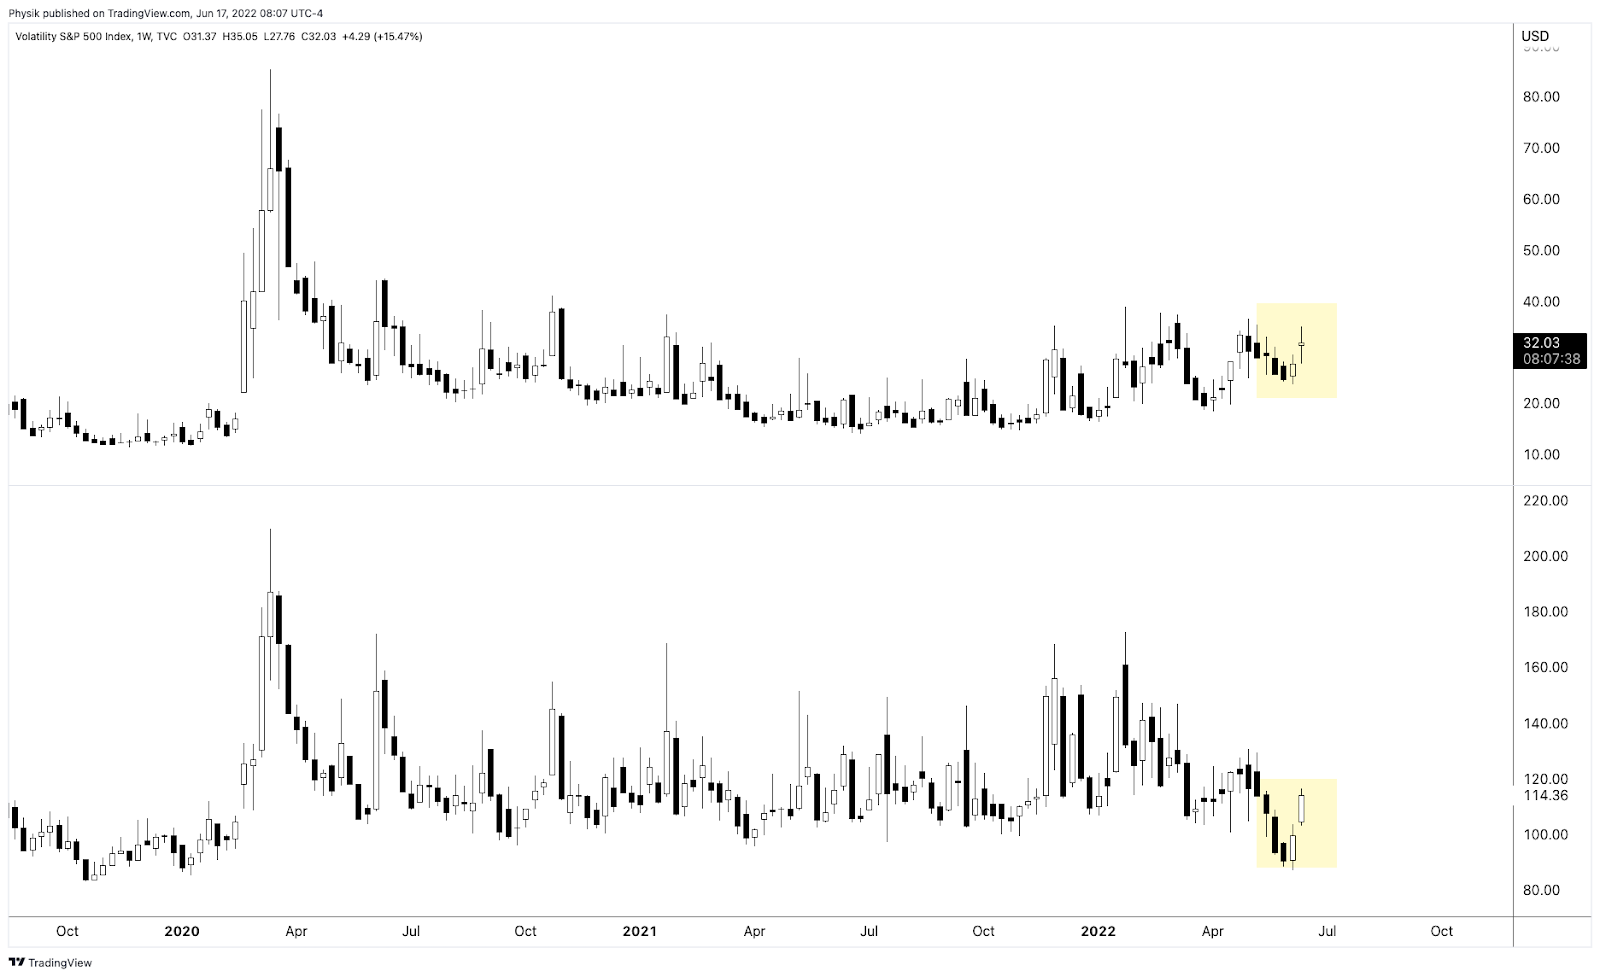
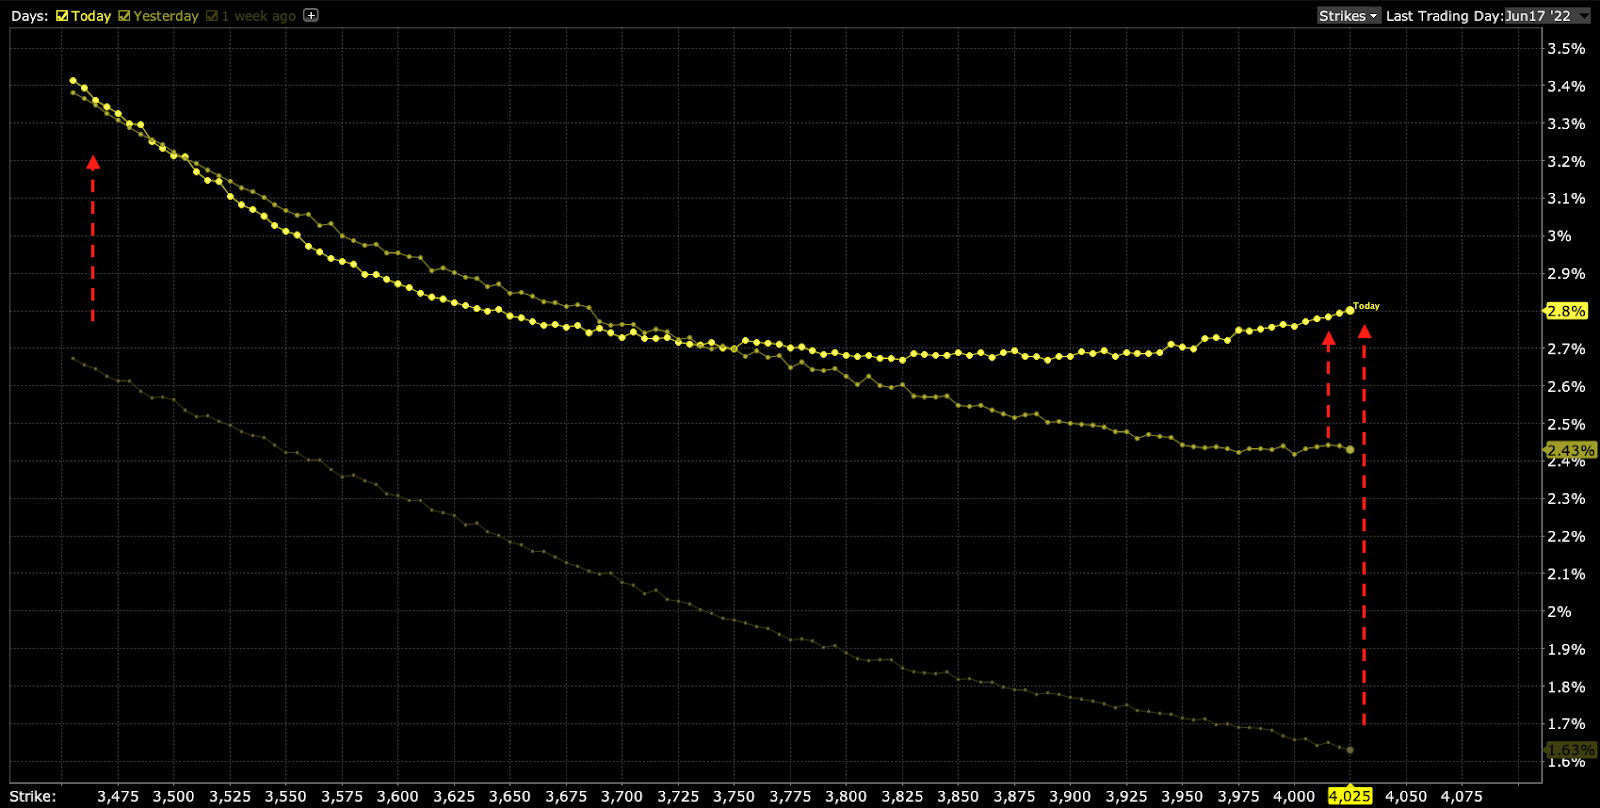
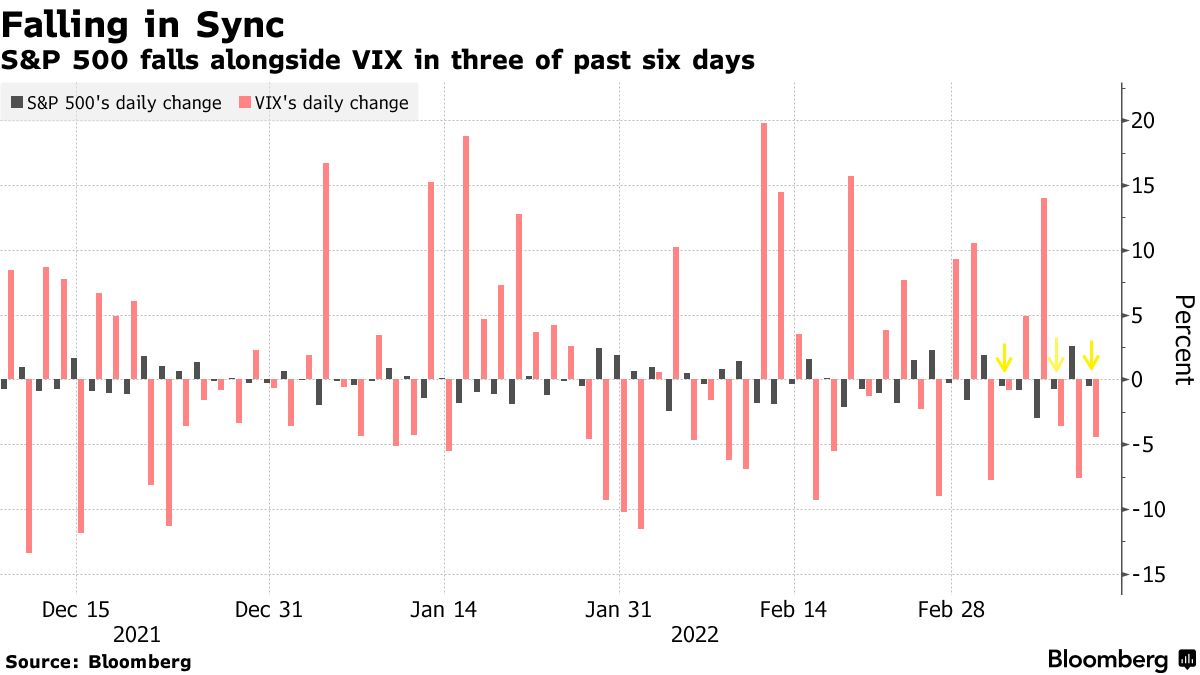
For IVOL measures to remain wound, something bad needs to happen, in short. Otherwise, as seen yesterday, slightly, the S&P 500 drifted lower while certain IVOL measures, such as the Cboe Volatility Index (INDEX: VIX) printed a lower high than that observed on Wednesday.
Per SpotGamma, “If the decline in IVOL is very pronounced, relative to the decline in the S&P, that too can aid in a push-and-pull that actually serves to … resist far-reaching weakness.”

From hereon, the decay and/or removal of the protection that’s been demanded in the past days and weeks may place a like on IVOL and boost markets over a very short term. In the long term, however, weakness is here to stay, says Kai Volatility’s Cem Karsan.
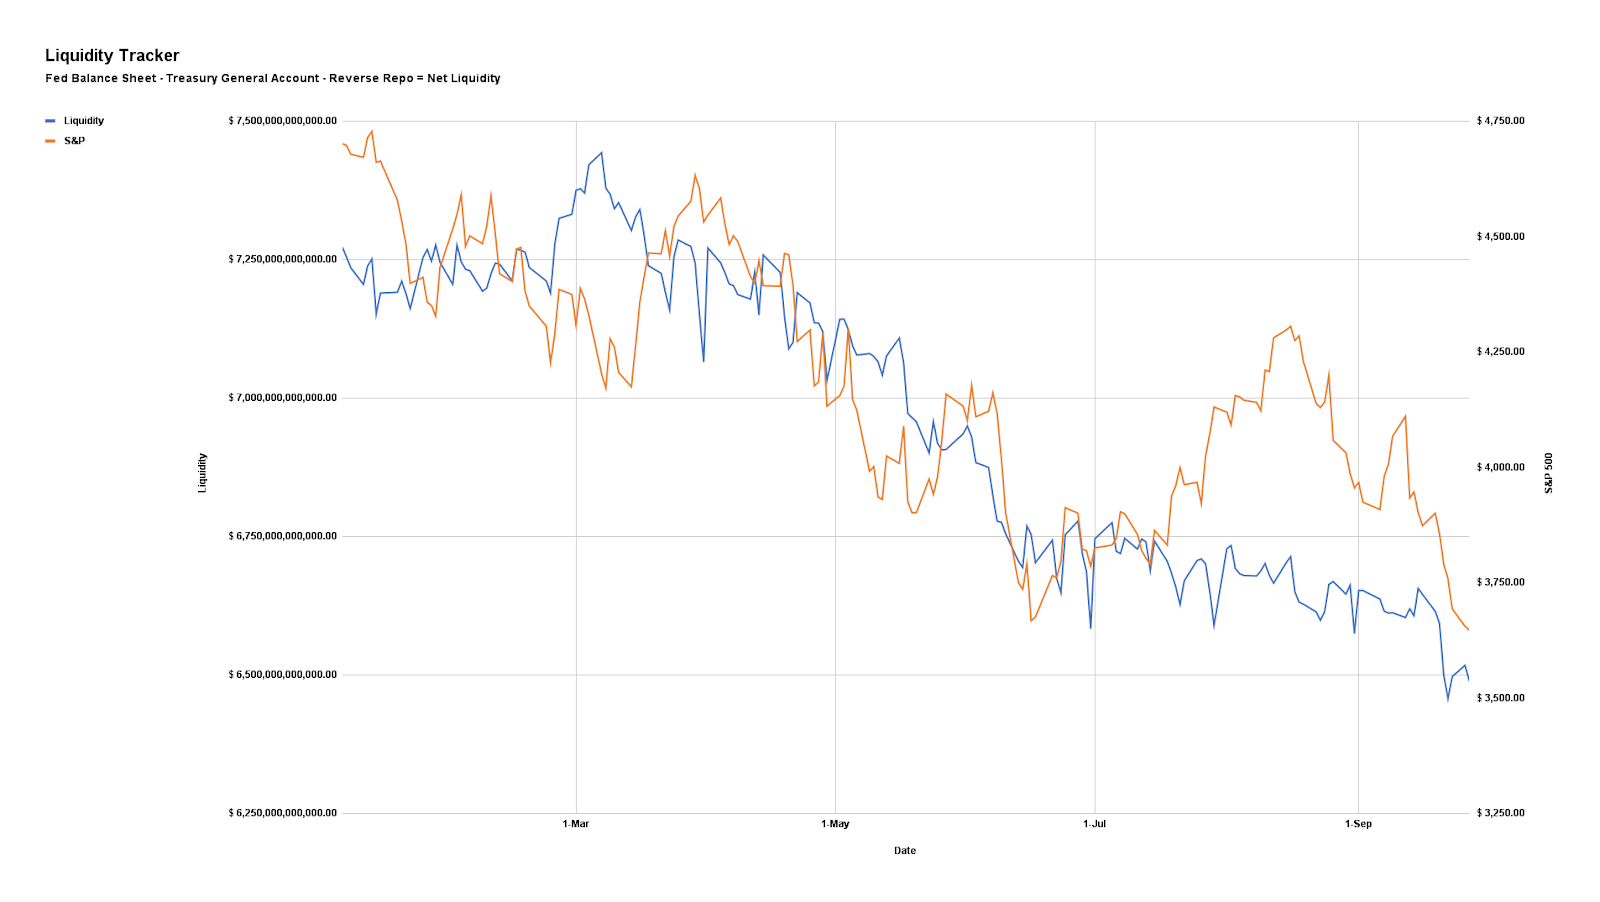
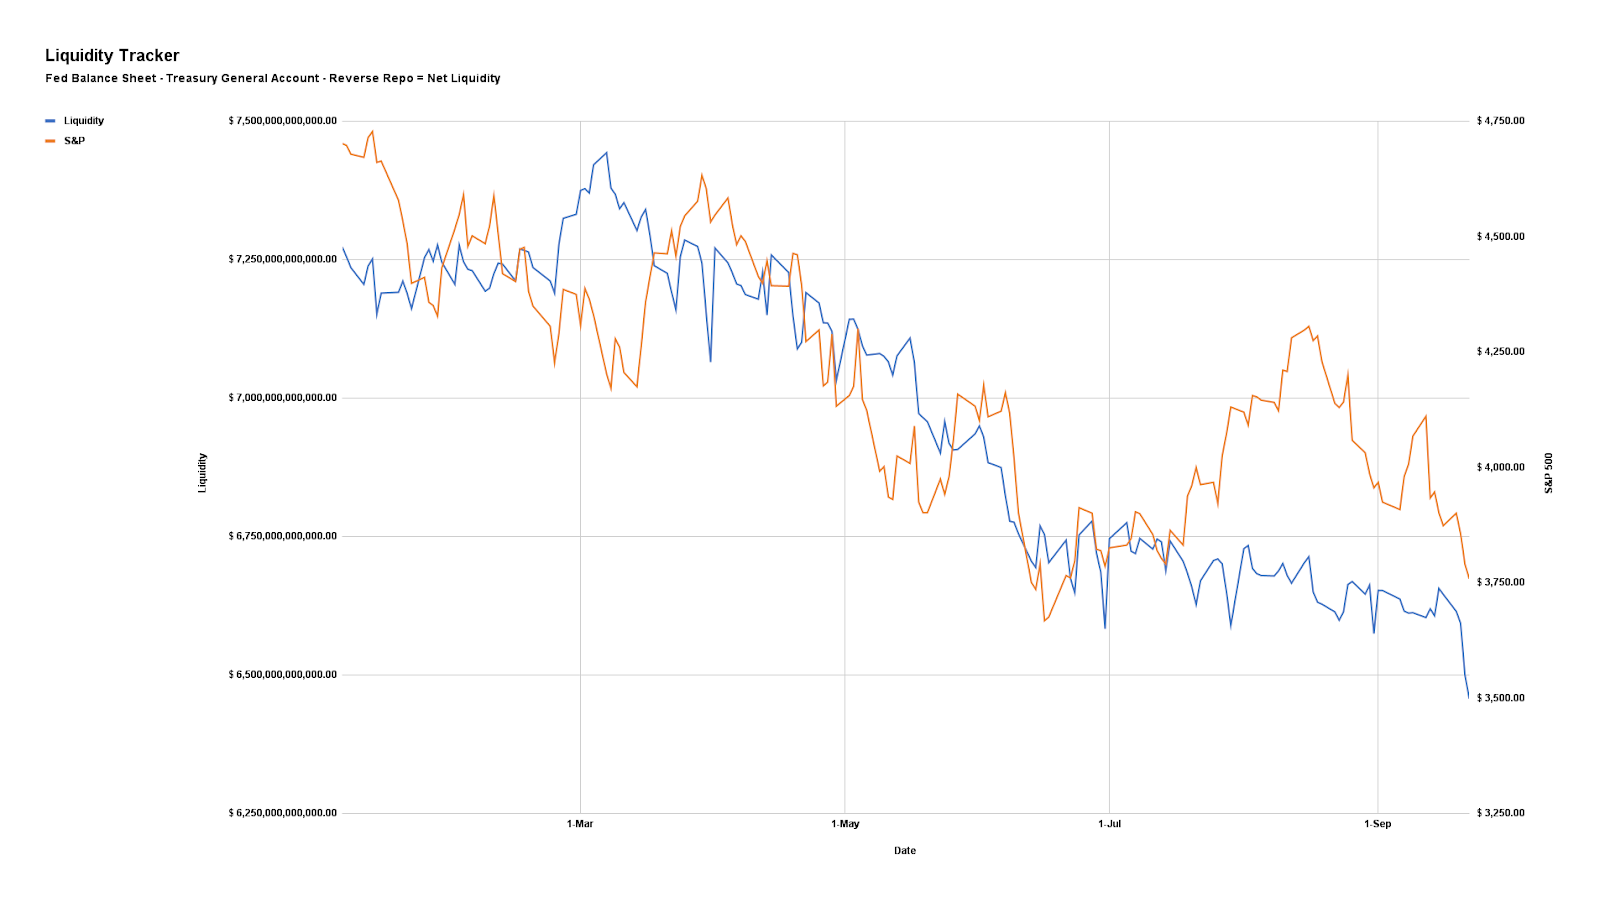
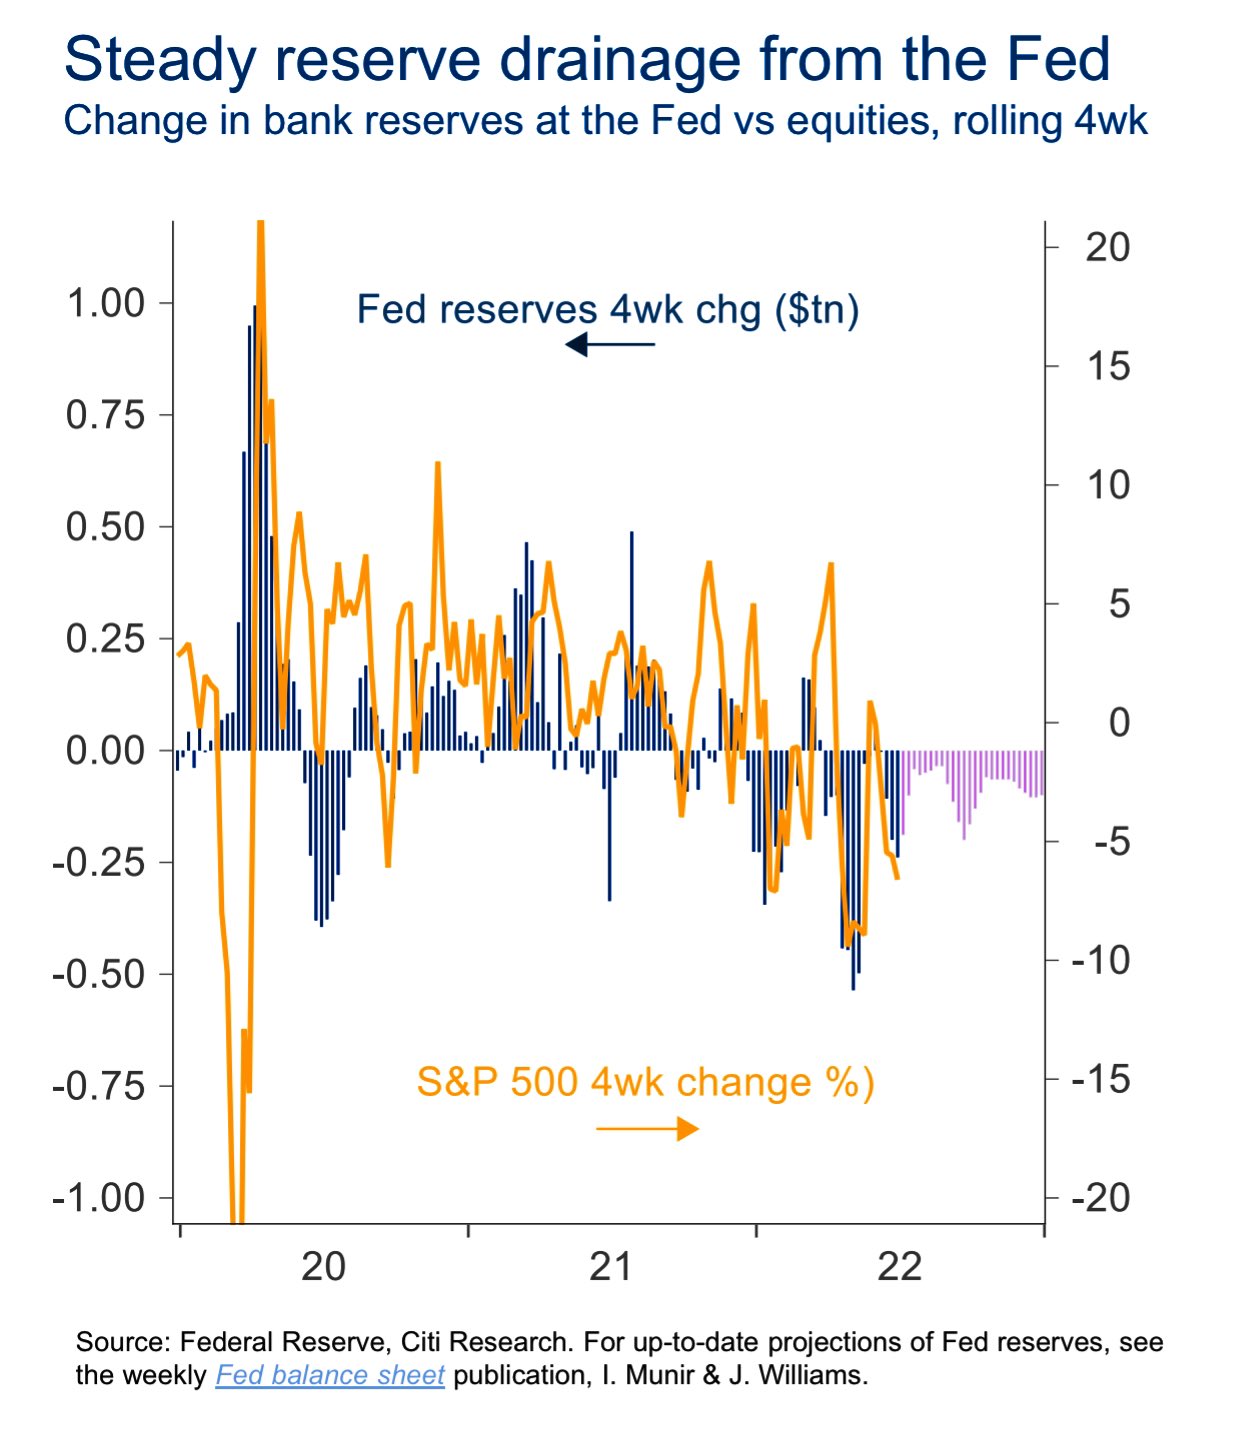
That’s amid impacts of quantitative tightening (QT) which is manifesting itself as “$4.5 billion less in demand for assets per day,” as well as the blackout period for buybacks (which were consistently “supporting the market”) and options repositioning bolstering the weakness.

A lot more on this positioning, and the rollover of some large fund exposures, which have grasped the attention of many online, in some coming letters.
Technical
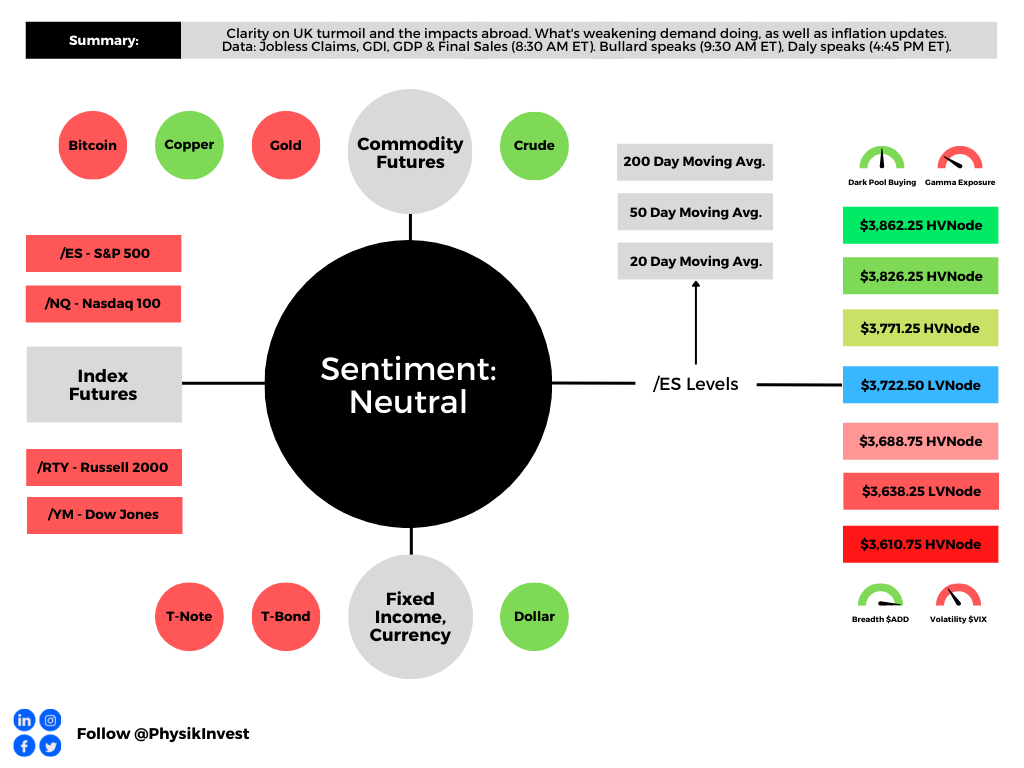
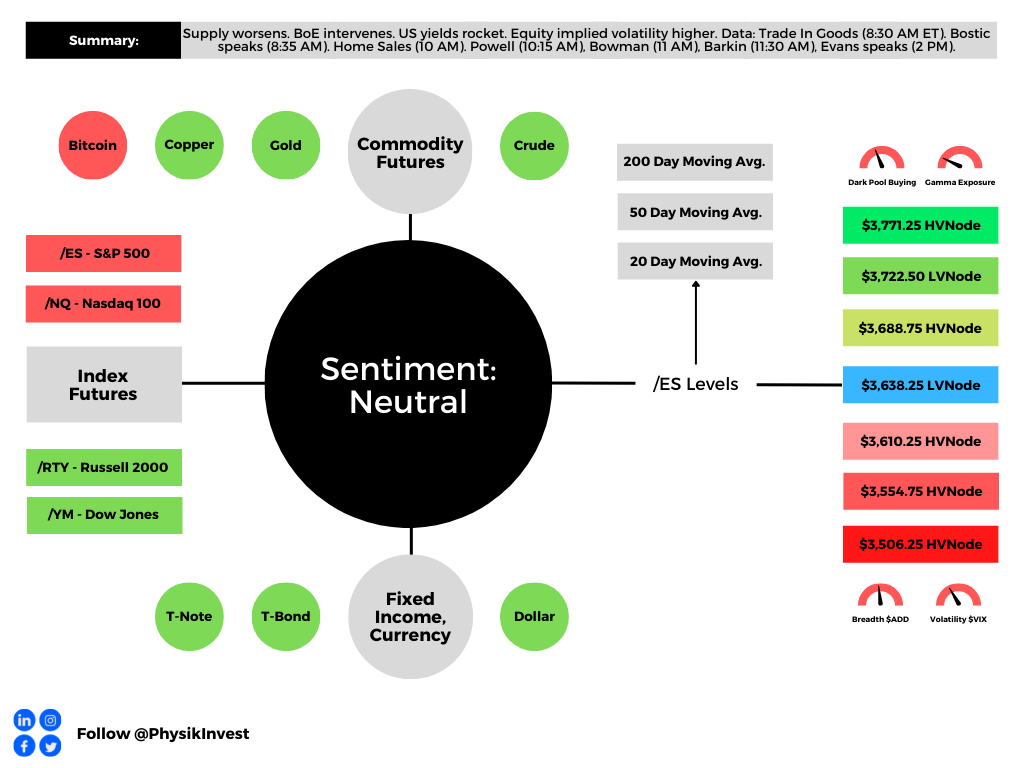
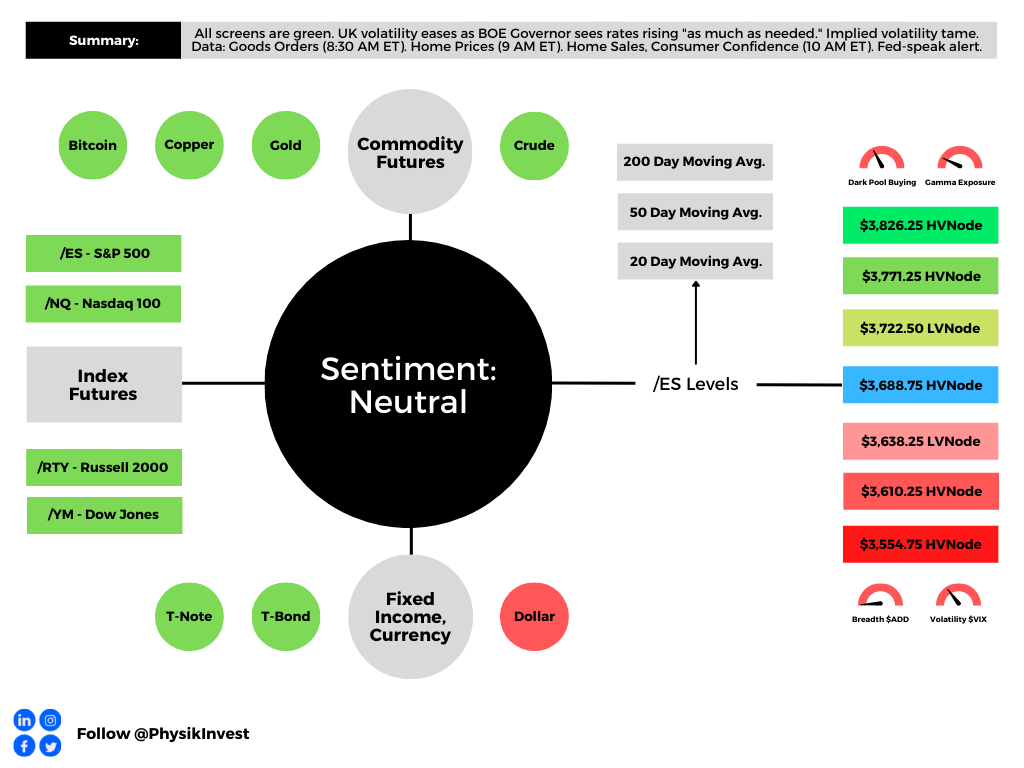
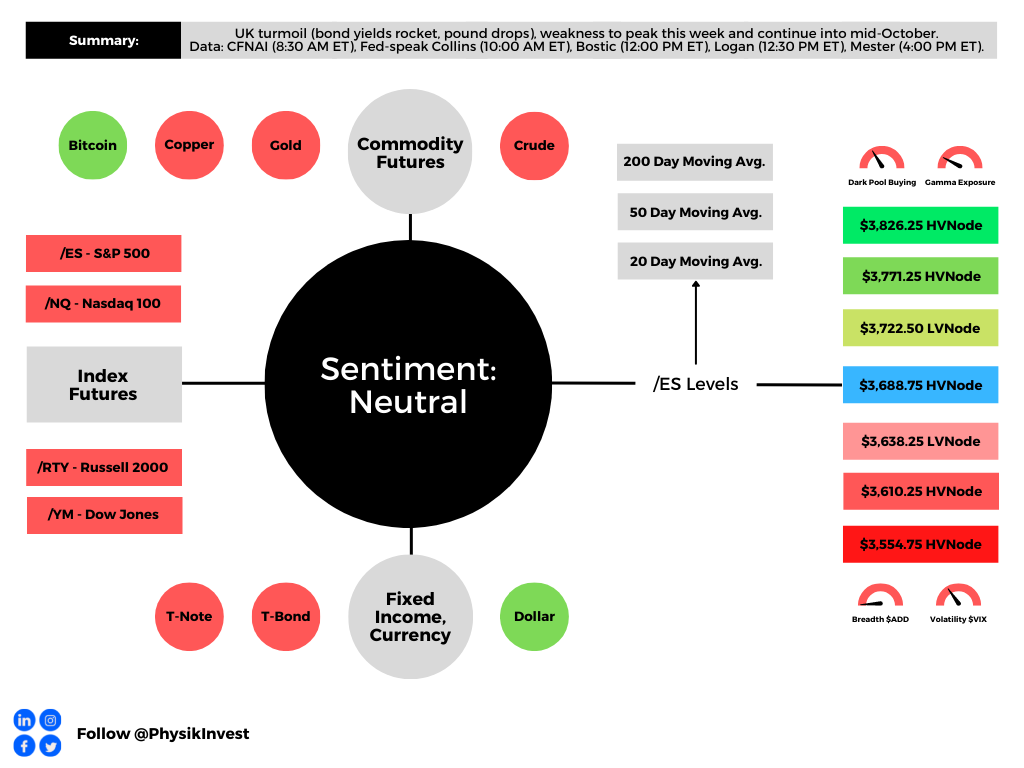
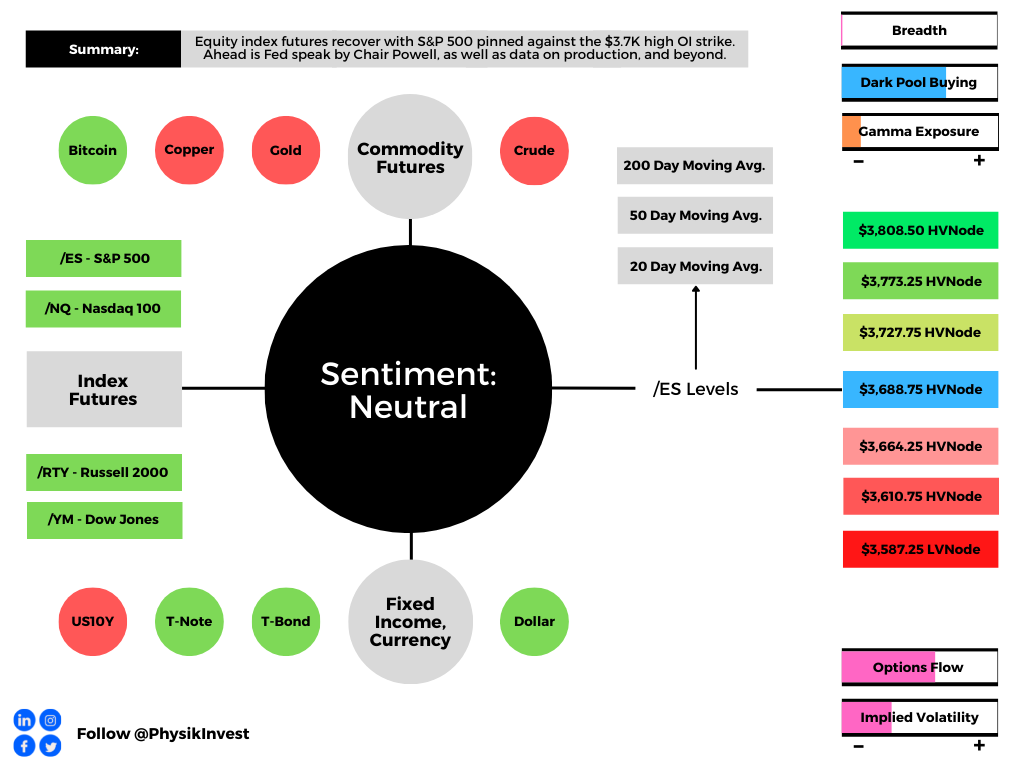
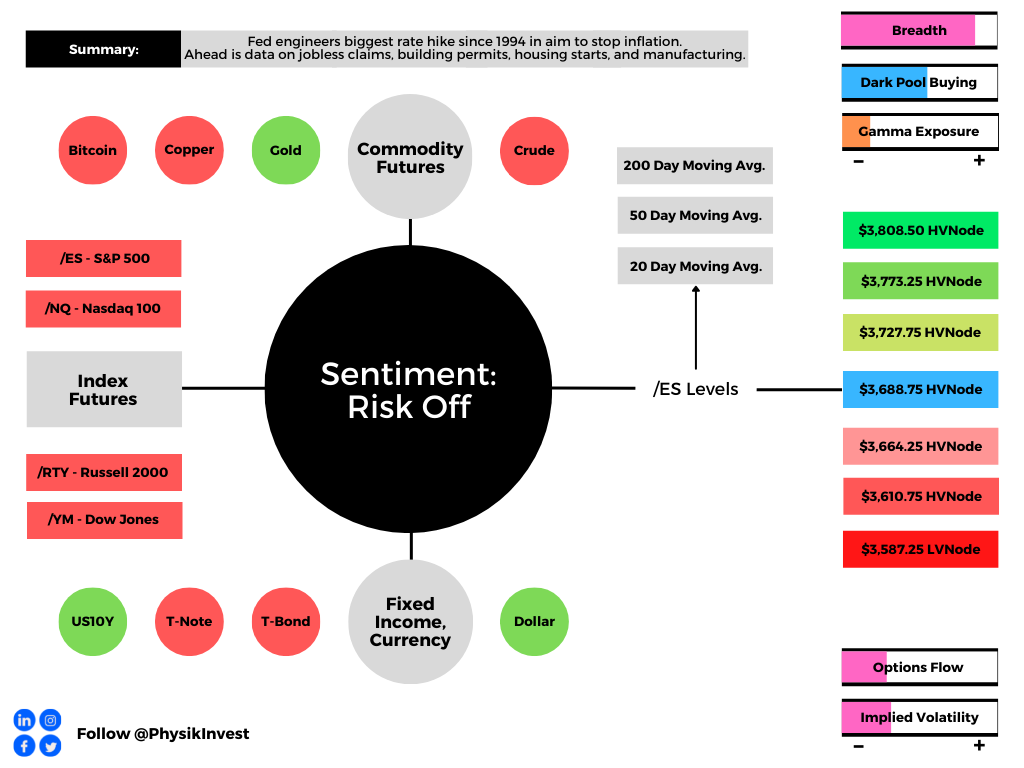
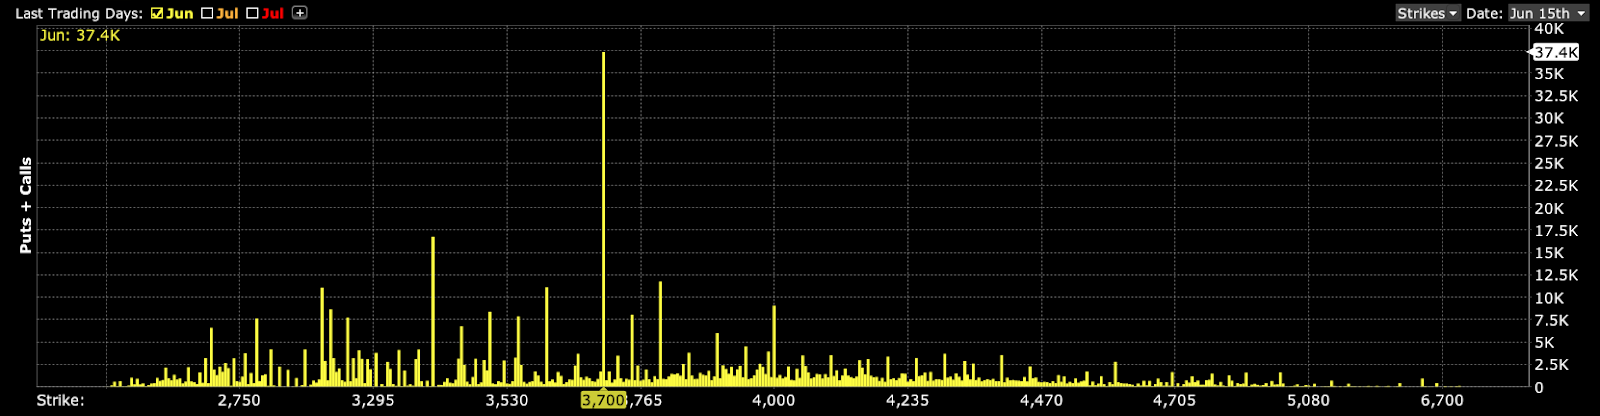
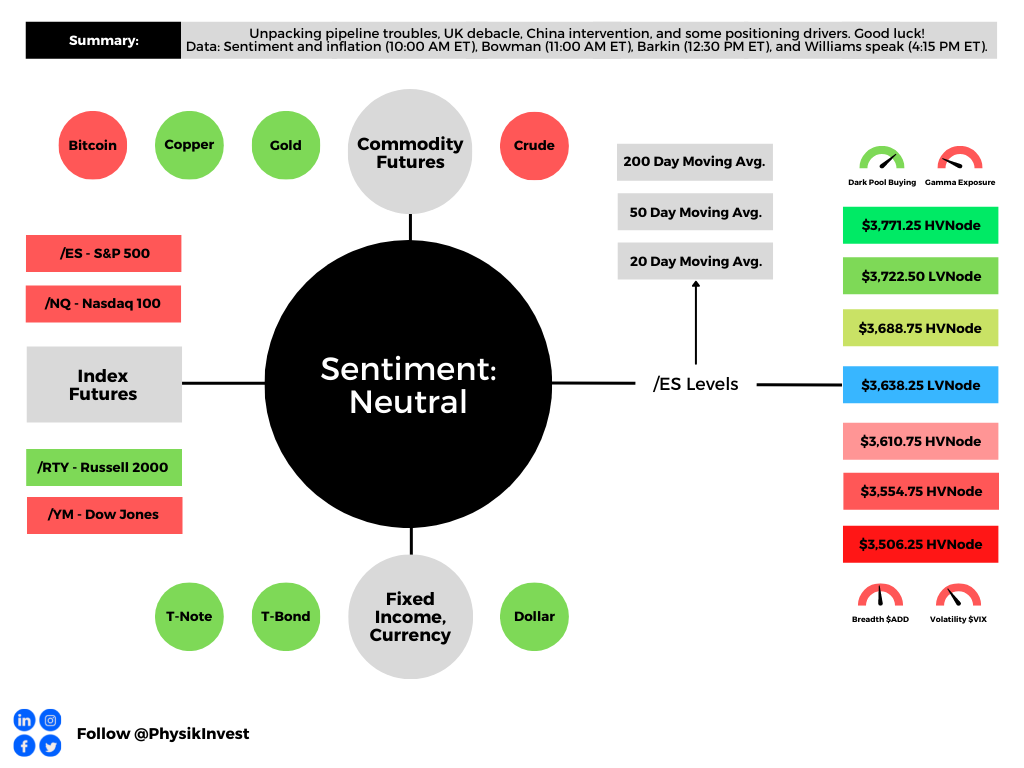
As of 9:50 AM ET, Friday’s regular session (9:30 AM – 4:00 PM ET), in the S&P 500, is likely to open in the middle part of a balanced overnight inventory, inside of prior-range and -value, suggesting a limited potential for immediate directional opportunity.
In the best case, the S&P 500 trades higher.
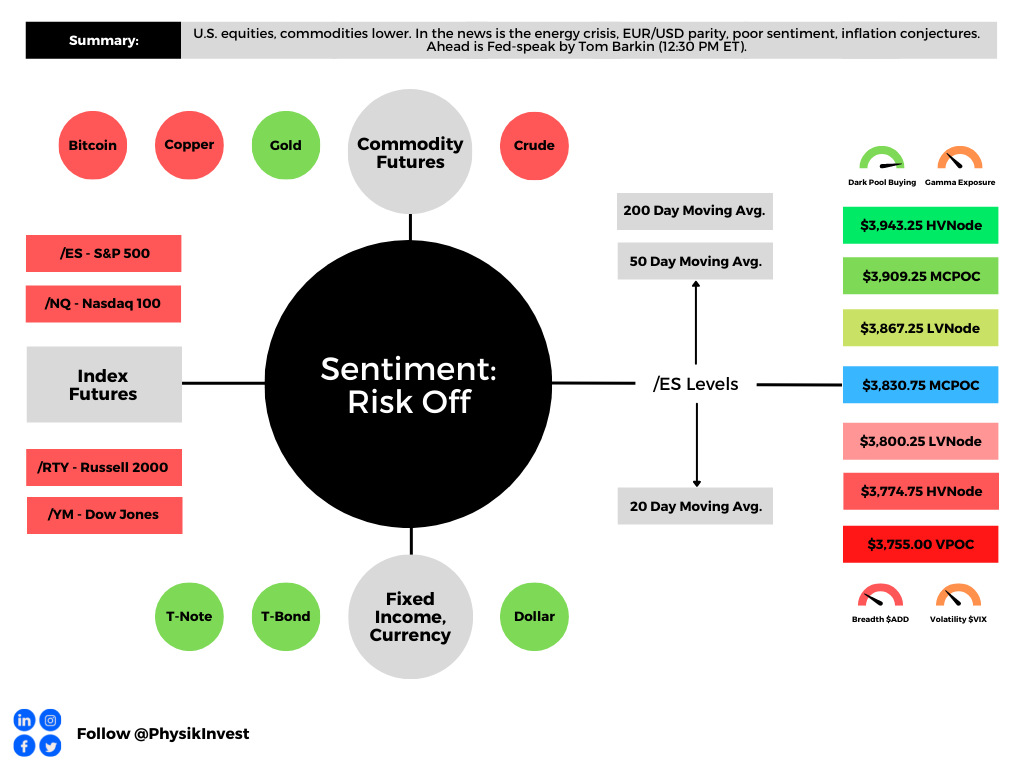
Any activity above the $3,638.25 LVNode puts into play the $3,688.75 HVNode. Initiative trade beyond the HVNode could reach as high as the $3,722.50 LVNode and $3,771.25 HVNode, or higher.
In the worst case, the S&P 500 trades lower.
Any activity below the $3,638.25 LVNode puts into play the $3,610.75 HVNode. Initiative trade beyond the latter could reach as low as the $3,554.75 and $3,506.25 HVNode, or lower.
Click here to load today’s key levels into the web-based TradingView charting platform. Note that all levels are derived using the 65-minute timeframe. New links are produced, daily.

Definitions
Volume Areas: A structurally sound market will build on areas of high volume (HVNodes). Should the market trend for long periods of time, it will lack sound structure, identified as low volume areas (LVNodes). LVNodes denote directional conviction and ought to offer support on any test.
If participants were to auction and find acceptance into areas of prior low volume (LVNodes), then future discovery ought to be volatile and quick as participants look to HVNodes for favorable entry or exit.
About
After years of self-education, strategy development, mentorship, and trial-and-error, Renato Leonard Capelj began trading full-time and founded Physik Invest to detail his methods, research, and performance in the markets.
Capelj also develops insights around impactful options market dynamics at SpotGamma and is a Benzinga reporter.
Some of his works include conversations with ARK Invest’s Catherine Wood, investors Kevin O’Leary and John Chambers, FTX’s Sam Bankman-Fried, ex-Bridgewater Associate Andy Constan, Kai Volatility’s Cem Karsan, The Ambrus Group’s Kris Sidial, among many others.
Disclaimer
In no way should the materials herein be construed as advice. Derivatives carry a substantial risk of loss. All content is for informational purposes only.