The daily brief is a free glimpse into the prevailing fundamental and technical drivers of U.S. equity market products. Join the 800+ that read this report daily, below!
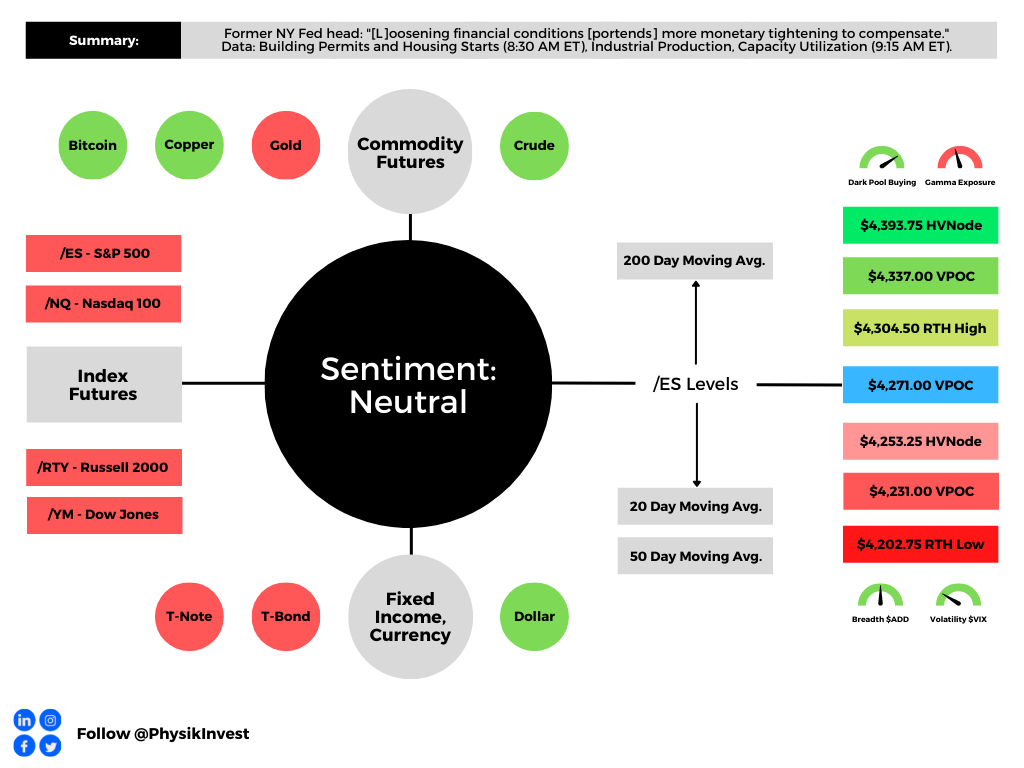
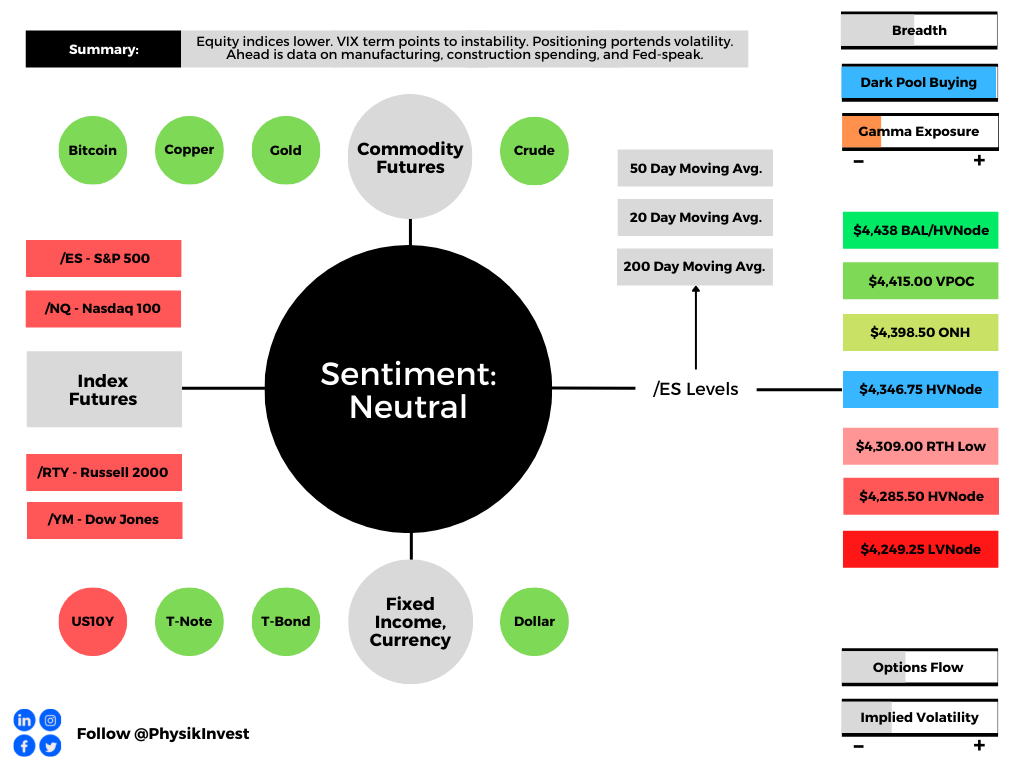
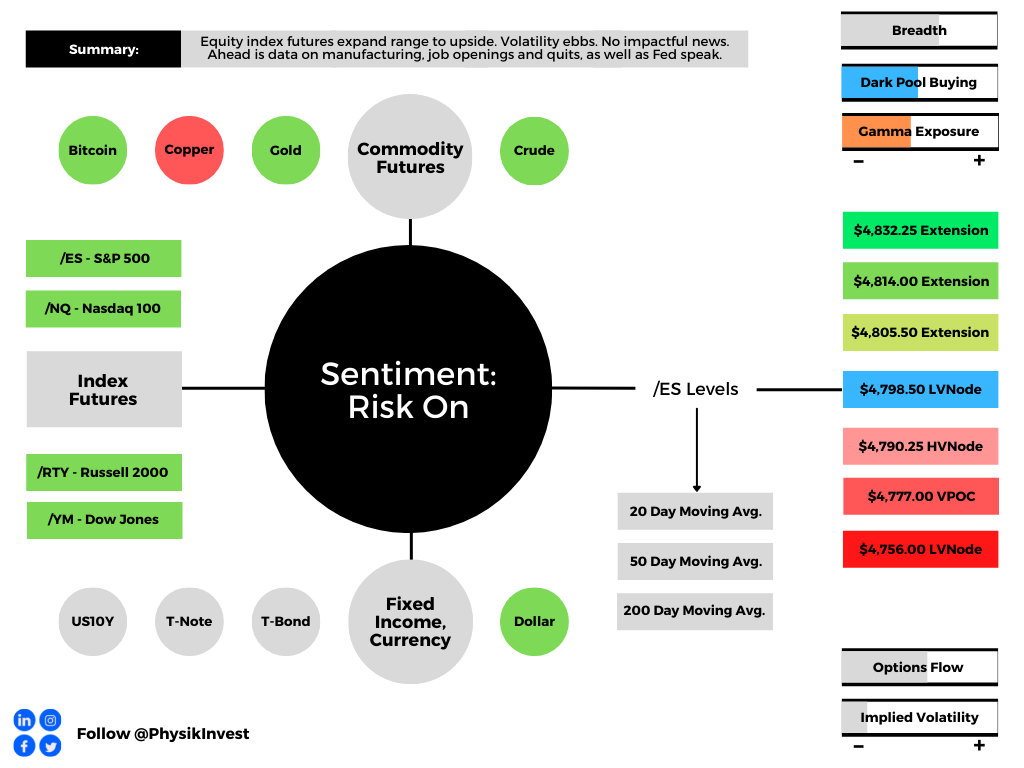
Graphic updated 7:00 AM ET. Sentiment Neutral if expected /ES open is inside of the prior day’s range. /ES levels are derived from the profile graphic at the bottom of the following section. Levels may have changed since initially quoted; click here for the latest levels. SqueezeMetrics Dark Pool Index (DIX) and Gamma (GEX) calculations are based on where the prior day’s reading falls with respect to the MAX and MIN of all occurrences available. A higher DIX is bullish. At the same time, the lower the GEX, the more (expected) volatility. Learn the implications of volatility, direction, and moneyness. Breadth reflects a reading of the prior day’s NYSE Advance/Decline indicator. VIX reflects a current reading of the CBOE Volatility Index (INDEX: VIX) from 0-100.
Fundamental
The Daily Brief for Monday, August 15, 2022, provided us with a great start to the week. Today, unfortunately, we add only lightly to this narrative, and we will elaborate in later sessions.
In short, markets experienced one of the largest, wide-ranging, short-covering rallies, in years, bolstered by machines “hell-bent on pushing the financial conditions easing trade,” as well put by Dennis DeBusschere, the founder of 22V Research.
Notwithstanding improving sentiment and data on jobs, as well as cooler inflation figures, former New York Federal Reserve (Fed) President William Dudley, thinks markets have underestimated the Fed’s determination to stem inflation.
To summarize, the Fed will keep hiking until inflation is back to its 2% target and there is more slack in the labor market.
“I think the Fed is going to be higher for longer than what market participants understand at this point,” he explained. This action ought to last at least until the unemployment rate is “well above 4%,” above today’s 3.5%.
Accordingly, “whenever the unemployment rate has risen by a half percentage point or more, the result has been a full-blown recession.”
There is also quantitative tightening (QT), the direct flow of capital from capital markets.
Bank of America Corporation (NYSE: BAC) strategists see the prevailing assumption as if “QT is already priced into the market.”
“The market does not seem to be looking ahead,” the strategists said, suggesting the S&P 500 could print 7% lower, at least. “If financial conditions tighten in a meaningful way, then that could make QT a more important topic.”
Still, Treasury buybacks are among the tools that could be used to strengthen markets against the rising tide of “issuance and potential structural inflation, … [easing] QT by moving liquidity out of the RRP and into the banking sector,” per Joseph Wang.
More on this, later!
Graphic: Via Physik Invest. Data compiled by @jkonopas623. Fed Balance Sheet data, here. Treasury General Account Data, here. Reverse Repo data, here. NL = BS – TGA – RRP.
As of 7:00 AM ET, Tuesday’s regular session (9:30 AM – 4:00 PM ET), in the S&P 500, is likely to open in the middle part of a negatively skewed overnight inventory, inside of prior-range and -value, suggesting a limited potential for immediate directional opportunity.
In the best case, the S&P 500 trades higher.
Any activity above the $4,271.00 VPOC puts into play the $4,304.50 RTH High. Initiative trade beyond the RTH High could reach as high as the $4,337.00 VPOC and $4,393.75 HVNode, or higher.
In the worst case, the S&P 500 trades lower.
Any activity below the $4,271.00 VPOC puts into play the $4,253.25 HVNode. Initiative trade beyond the HVNode could reach as low as the $4,231.00 VPOC and $4,202.75 RTH Low, or lower.
Click here to load today’s key levels into the web-based TradingView charting platform. Note that all levels are derived using the 65-minute timeframe. New links are produced, daily.
Graphic: 65-minute profile chart of the Micro E-mini S&P 500 Futures.
Considerations: Responsiveness near key-technical areas (that are discernable visually on a chart), suggests technically-driven traders with short time horizons are very active.
Such traders often lack the wherewithal to defend retests and, additionally, the type of trade may be indicative of the other time frame participants waiting for more information to initiate trades.
Definitions
Volume Areas: A structurally sound market will build on areas of high volume (HVNodes). Should the market trend for long periods of time, it will lack sound structure, identified as low volume areas (LVNodes). LVNodes denote directional conviction and ought to offer support on any test.
If participants were to auction and find acceptance into areas of prior low volume (LVNodes), then future discovery ought to be volatile and quick as participants look to HVNodes for favorable entry or exit.
POCs: POCs are valuable as they denote areas where two-sided trade was most prevalent in a prior day session. Participants will respond to future tests of value as they offer favorable entry and exit.
About
After years of self-education, strategy development, mentorship, and trial-and-error, Renato Leonard Capelj began trading full-time and founded Physik Invest to detail his methods, research, and performance in the markets.
Capelj also develops insights around impactful options market dynamics at SpotGamma and is a Benzinga reporter.
In no way should the materials herein be construed as advice. Derivatives carry a substantial risk of loss. All content is for informational purposes only.
Editor’s Note: The Daily Brief is a free glimpse into the prevailing fundamental and technical drivers of U.S. equity market products. Join the 200+ that read this report daily, below!
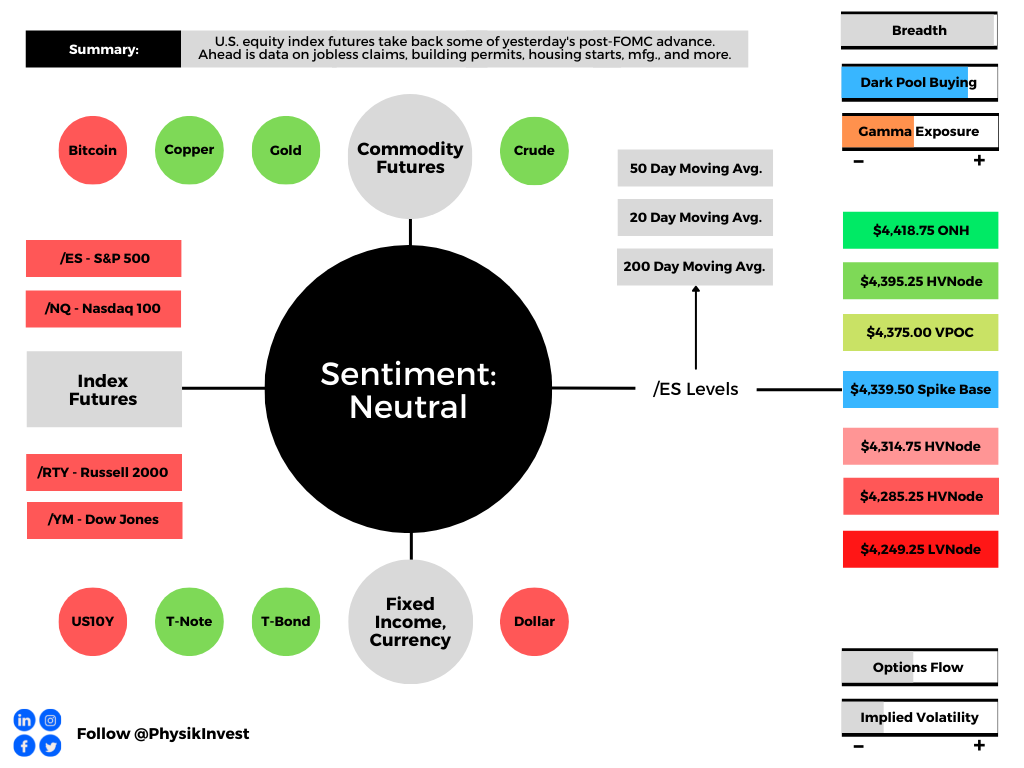
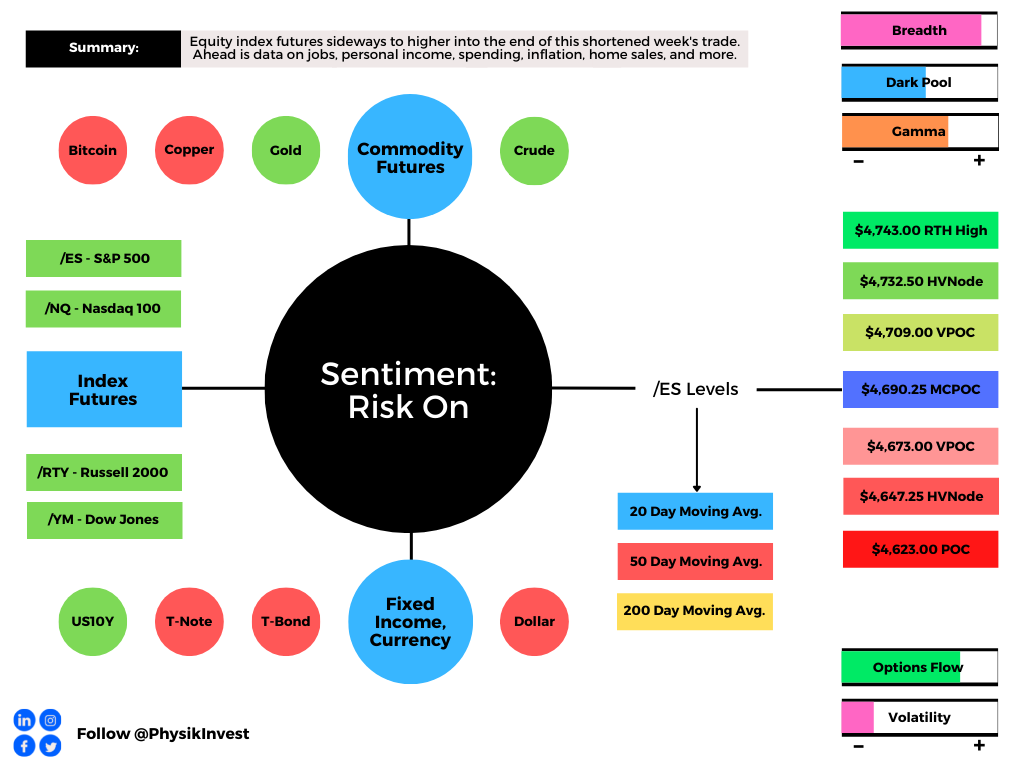
Overnight, equity index futures took back part of Wednesday’s advance after the Federal Open Market Committee (FOMC) made the decision to tighten, albeit at a more aggressive pace than previously expected.
Moreover, according to some reports, last night’s decline comes as the Kremlin rejected claims that Ukraine peace talks were making progress. Subsequently, most commodity products rose.
Ahead is data on jobless claims, building permits, housing starts, and the Philadelphia Fed manufacturing survey (8:30 AM ET). Later, participants receive data on industrial production and capacity utilization (9:15 AM ET).
Graphic updated 6:40 AM ET. Sentiment Neutral if expected /ES open is inside of the prior day’s range. /ES levels are derived from the profile graphic at the bottom of the following section. Levels may have changed since initially quoted; click here for the latest levels. SqueezeMetrics Dark Pool Index (DIX) and Gamma (GEX) calculations are based on where the prior day’s reading falls with respect to the MAX and MIN of all occurrences available. A higher DIX is bullish. At the same time, the lower the GEX, the more (expected) volatility. Learn the implications of volatility, direction, and moneyness. SHIFT data used for S&P 500 (INDEX: SPX) options activity. Note that options flow is sorted by the call premium spent; if more positive, then more was spent on call options. Breadth reflects a reading of the prior day’s NYSE Advance/Decline indicator. VIX reflects a current reading of the CBOE Volatility Index (INDEX: VIX) from 0-100.
What To Expect
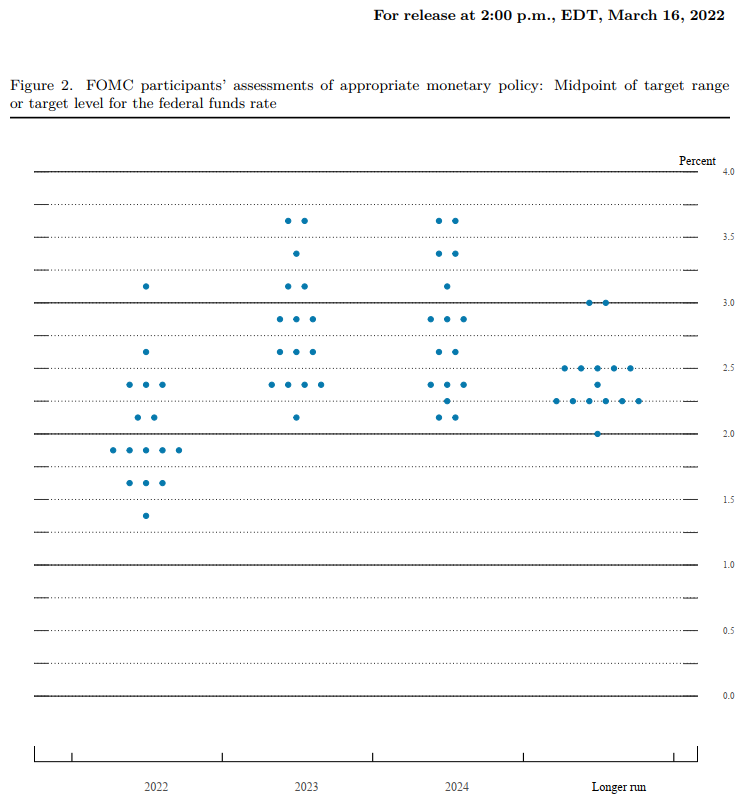
Fundamental: In the face of a strong economy (at home) plagued by supply and demand imbalances, as well as geopolitical tensions and economic turmoil (abroad), the Federal Reserve (Fed) raised borrowing costs by a quarter percentage point and signaled six more in 2022 putting the policy rate at ~2.8% before 2024.
Graphic: Via Bloomberg. The Fed’s updated dot plot.
Bloomberg’s John Authers explains well what transpired. Essentially, not one FOMC member thought rates would exceed 2.25% by the end of 2023. Now, most members think rates may need to go as high as 3.75% to help rein in inflation and promote price stability.
“In addition to giving up on ‘lower for longer’ rates, the Fed also seems to be capitulating on its forecasts for inflation to come under control relatively swiftly,” Authers explains.
“There is no consensus. That is alarming, and prompted some to fear that the Fed was admitting it didn’t know what was going on.”
Graphic: Via Bloomberg. “This chart shows how expectations for inflation at the end of this year and next have moved between the two [FOMC] meetings.”
Ultimately, the FOMC thinks inflation will return to their 2% long-term target, and the fed funds rate may top out at 2.4%, “the lowest projection for long-term rates on record.”
In terms of asset purchases, the FOMC will have an updated quantitative tightening (QT) schedule as soon as May.
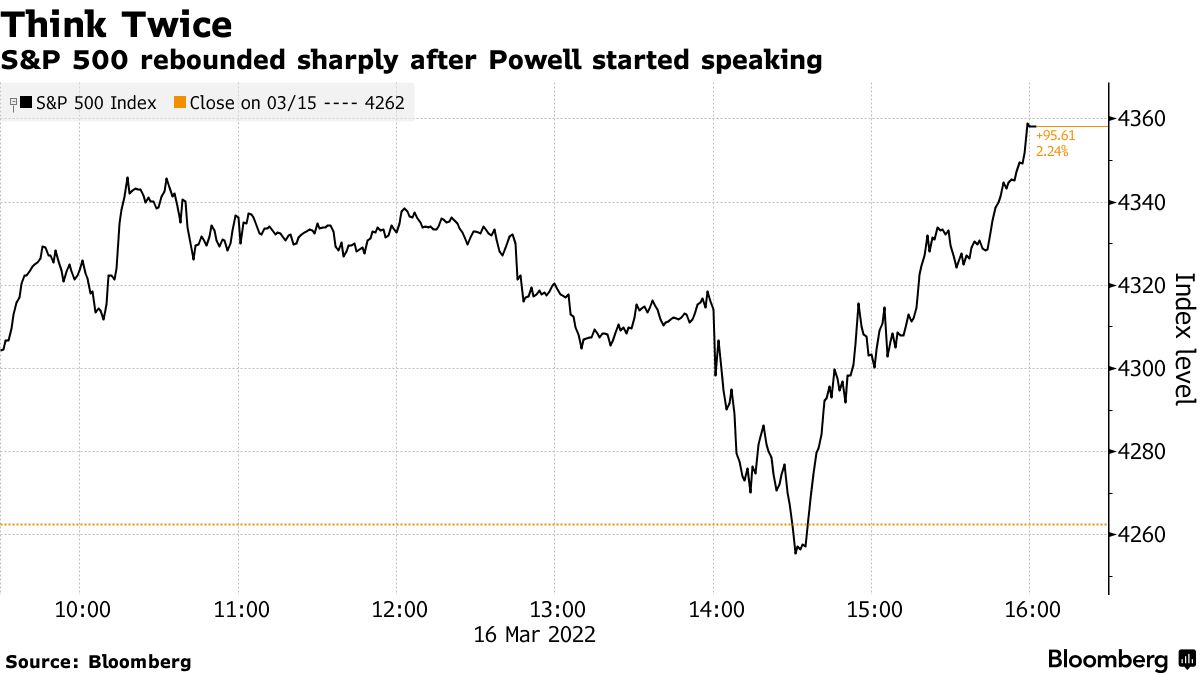
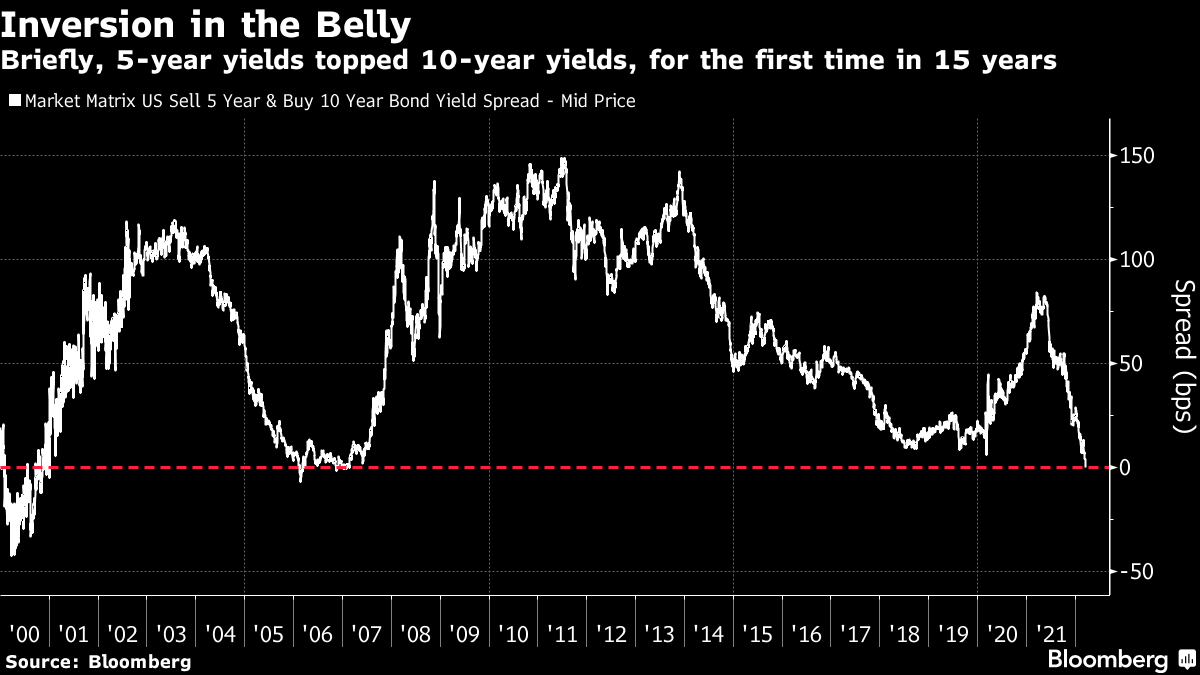
After the announcement, the U.S. equity market closed higher while 5-year yields topped 10-year yields for the first time in 15 years.
Graphic: Via Bloomberg. Stocks rise after the Fed’s Powell started speaking. “Jobs are stronger than ever. The unemployment rate is lower than pre-Covid, basically. Consumer spending is quite healthy. Consumer savings remains at all-time highs at $2.7 trillion,” said Sylvia Jablonski, CEO and CIO of Defiance ETFs. “It’s really hard to think about how we would go into a recession.”
“It was the first time this relationship had inverted since early 2007, shortly before the beginning of the credit crisis,” Authers explained in statements as to the factors that may lead to the Fed abandoning its tightening schedule.
Graphic: Via Bloomberg. “Whenever the yield curve inverts, it tends to function as an early warning for a recession, suggesting that in the medium-term rates will have to fall.”
“Any inversion is a worrying sign, although one between five and 10 years, in the so-called ‘belly’ of the curve, is not as alarming as an inversion between three-month or two-year yields and the 10-year yield.”
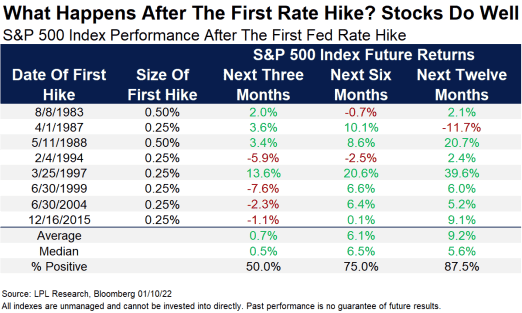
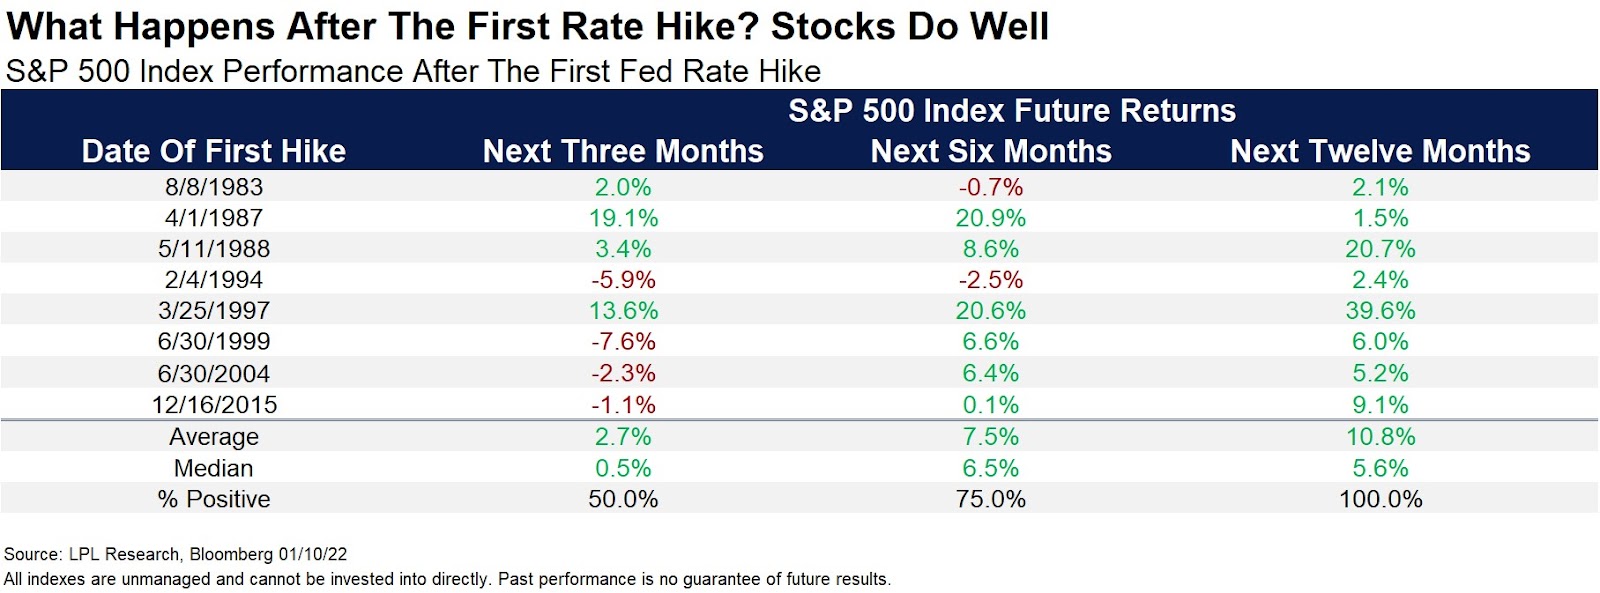
Moreover, according to stats compiled by LPL Research, stocks tend to do well after the Fed starts hiking rates.
“Fed rate hikes usually happen near the middle of the economic cycle, with potentially years left of gains in stocks and the economy,” explained LPL Financial’s Ryan Detrick.
“In fact, a year after the first hike in a cycle has been fairly strong, higher a year later the past six times.”
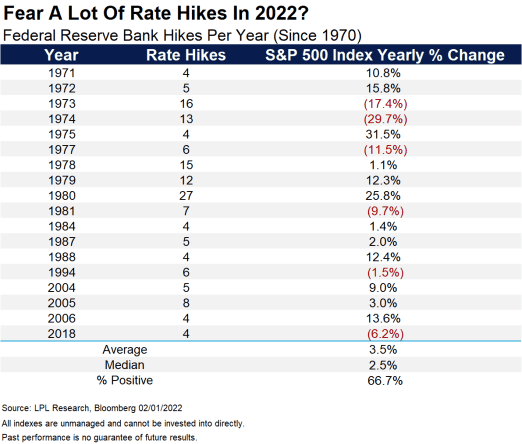
Graphic: Via LPL Research. “Lastly, here’s how stocks have done in years with a lot of rate hikes. The mid-2000s cycle is what has our attention, as there were 17 total rate hikes in 2004, 2005, and 2006, yet the S&P 500 managed to gain in every year.”
Positioning: Implied volatility metrics compressed markedly, yesterday, and this bolstered a near-vertical price rise in the equity market, as suggested would happen in past letters.
Graphic: Implied volatility term structure shifts inward. This solicits positive hedging (vanna) flows as counterparty exposure to positive delta declines. In other words, short stock and futures hedges (against options) are bought back.
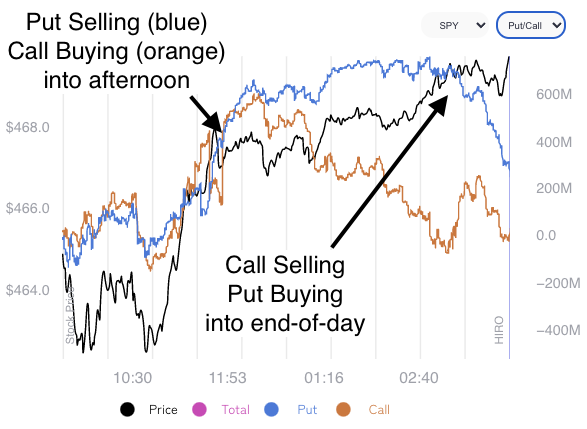
Checking out SpotGamma’s Hedging Impact of Real-Time Options (HIRO) indicator, we see little commitment by S&P 500 participants in this rally. Instead, the response was quite neutral.
Graphic: SpotGamma’s Hedging Impact of Real-Time Options (HIRO) indicator.
Taking a look at some of the cash-settled indexes, like the growth- and tech-heavy Nasdaq 100 (INDEX: NDX), there was some notable buying of call spreads (i.e., positions that make money if the underlying moves higher, all else equal), though.
Graphic: Via SHIFT. Notice the duration of the spread. Though this may have been a new trade, one must not discount the potential for it to have been a closing trade. In either case, there is potential that the de-rate in the tech and growth areas of the market has played its course.
“Moreover, heading into Wednesday’s FOMC, we saw the market well-hedged,” SpotGamma explained. “Participants’ demand for protection is concentrated in options with little time to expiry (given the monthly options expiration and roll-off a significant size of S&P delta).”
“Adding, the compression of volatility today, coupled with trade higher, solicits less counterparty hedging of put protection … [and] less positive delta = less selling to hedge = less pressure.”
Graphic: Via SpotGamma. “For education only. As implied volatility falls, options delta falls. This solicits positive delta hedging flows (with respect to volatility) or vanna.”
Ultimately, this post-FOMC price rise may put the market in an underhedged position. In such a case, as talked about yesterday, new demand for protection would add fuel to weakness (later).
Regardless, comparing buying and options positioning metrics, the returns distribution remains skewed positive (albeit much less so than before).
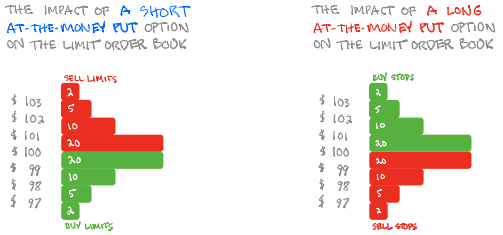
Graphic: SqueezeMetrics details the implications of customer activity in the options market, on the underlying’s order book. For instance, in selling a put, customers add liquidity and stabilize the market. How? The market maker long the put will buy (sell) the underlying to neutralize directional risk as price falls (rises).
Technical: As of 6:30 AM ET, Thursday’s regular session (9:30 AM – 4:00 PM ET), in the S&P 500, will likely open in the middle-to-lower part of a negatively skewed overnight inventory, inside of prior-range and -value, suggesting a limited potential for immediate directional opportunity.
Spike Scenarios In Play: Spikes mark the beginning of a break from value. Spikes higher (lower) are validated by trade at or above (below) the spike base (i.e., the origin of the spike).
In the best case, the S&P 500 trades higher; activity above the $4,339.50 spike base puts in play the $4,375.00 untested point of control (VPOC). Initiative trade beyond the VPOC could reach as high as the $4,395.25 high volume area (HVNode) and $4,418.75 overnight high (ONH), or higher.
In the worst case, the S&P 500 trades lower; activity below the $4,339.50 spike base puts in play the $4,314.75 HVNode. Initiative trade beyond the $4,314.75 could reach as low as the $4,285.25 HVNode and $4,249.25 low volume area (LVNode), or lower.
Considerations: Push-and-pull, as well as responsiveness near key-technical areas (that are discernable visually on a chart), suggests technically-driven traders with short time horizons are very active.
Such traders often lack the wherewithal to defend retests and, additionally, the type of trade may be indicative of the other time frame participants waiting for more information to initiate trades.
Click here to load today’s key levels into the web-based TradingView charting platform. Note that all levels are derived using the 65-minute timeframe. New links are produced, daily.
Graphic: 65-minute profile chart of the Micro E-mini S&P 500 Futures.
Definitions
Overnight Rally Highs (Lows): Typically, there is a low historical probability associated with overnight rally-highs (lows) ending the upside (downside) discovery process.
Volume Areas: A structurally sound market will build on areas of high volume (HVNodes). Should the market trend for long periods of time, it will lack sound structure, identified as low volume areas (LVNodes). LVNodes denote directional conviction and ought to offer support on any test.
If participants were to auction and find acceptance into areas of prior low volume (LVNodes), then future discovery ought to be volatile and quick as participants look to HVNodes for favorable entry or exit.
POCs: POCs are valuable as they denote areas where two-sided trade was most prevalent in a prior day session. Participants will respond to future tests of value as they offer favorable entry and exit.
About
After years of self-education, strategy development, mentorship, and trial-and-error, Renato Leonard Capelj began trading full-time and founded Physik Invest to detail his methods, research, and performance in the markets.
Capelj is also a Benzinga finance and technology reporter interviewing the likes of Shark Tank’s Kevin O’Leary, JC2 Ventures’ John Chambers, FTX’s Sam Bankman-Fried, and ARK Invest’s Catherine Wood, as well as a SpotGamma contributor developing insights around impactful options market dynamics.
Disclaimer
Physik Invest does not carry the right to provide advice.
In no way should the materials herein be construed as advice. Derivatives carry a substantial risk of loss. All content is for informational purposes only.
Editor’s Note: The Daily Brief is a free glimpse into the prevailing fundamental and technical drivers of U.S. equity market products. Join the 200+ that read this report daily, below!
Overnight, equity indices auctioned lower, further into the thick of Monday’s wide trading range.
The implied volatility (VIX) term structure is downward sloping as front-month contracts price higher than those in the back as a result of participants’ heightened fear in the short-term.
The take by some on current events and their impact on markets is mixed.
Some suggest the ‘worst might be behind us’ while others suggest markets may tend toward instability until participants’ fears are assuaged at the next Federal Reserve meeting, and the decline in so-called negative gamma exposures post-options expiry later this month.
Ahead is data on Markit manufacturing PMI (9:45 AM ET), as well as ISM manufacturing index and constructions spending (10:00 AM ET).
Graphic updated 6:45 AM ET. Sentiment Neutral if expected /ES open is inside of the prior day’s range. /ES levels are derived from the profile graphic at the bottom of the following section. Levels may have changed since initially quoted; click here for the latest levels. SqueezeMetrics Dark Pool Index (DIX) and Gamma (GEX) calculations are based on where the prior day’s reading falls with respect to the MAX and MIN of all occurrences available. A higher DIX is bullish. At the same time, the lower the GEX, the more (expected) volatility. Learn the implications of volatility, direction, and moneyness. SHIFT data used for S&P 500 (INDEX: SPX) options activity. Note that options flow is sorted by the call premium spent; if more positive, then more was spent on call options. Breadth reflects a reading of the prior day’s NYSE Advance/Decline indicator. VIX reflects a current reading of the CBOE Volatility Index (INDEX: VIX) from 0-100.
What To Expect
Fundamental: Pursuant to remarks this commentary disclosed yesterday from Credit Suisse Group AG’s (NYSE: CS) Zoltan Pozsar, other strategists, like JPMorgan Chase & Co’s (NYSE: JPM) Marko Kolanovic believe geopolitical conflicts (and harsh responses) are likely to dim the prospects for aggressive Federal Reserve monetary tightening initiatives.
“The worst might be behind us for risk assets,” Kolanovic said. The strategist sees heightened short-term opportunity in growth stocks such as tech and medium-term value in value stocks and commodity-linked assets.
“Indirect risks are more substantial, given effects of higher commodity prices on inflation, growth, and consumers; however, one silver lining is that the crisis forced a dovish reassessment of the Fed by the market.”
Graphic: Per Bloomberg, after the escalation of conflict abroad, the market priced in diminished odds of a 50-basis-point rate hike in March.
This is in opposition to valuation worries by Morgan Stanley’s (NYSE: MS) Mike Wilson.
“The median stock forward P/E for the S&P is still 19x (94th percentile of historical levels back 40 years). We think this lends support to the idea that multiples across the index have room to compress due to our Ice thesis even after discounting the geopolitical developments of the last couple of weeks as well as a hawkish Fed.”
To note, historically speaking, though “big stock gains tend to happen late in a mid-term year, … be aware that March tends to see strength,” LPL Financial’s Ryan Detrick says.
Positioning: As stated, yesterday, there is strong passive buying support (via buybacks and retail inflows), and this is in the face of a negative-gamma, lower liquidity, high-volatility regime.
Graphic: Via Goldman Sachs. Taken from The Market Ear. “US equities on the GS Prime book saw the largest $ net buying in the past month (1-Year Z score +2.0), driven by long buys and to a lesser extent short covers (2.4 to 1), … [and] single Names saw the largest net buying in a month (1-Year Z score +2.0), driven entirely by long buys as short flows were relatively flat.”
Participants have pulled forward their bets and are trading in some of the most short-dated contracts, and this is evidenced still via a downward sloping VIX term structure.
Graphic: VIX term structure. Shifts higher portend negative delta hedging flows with respect to increases in volatility (vanna). Shifts lower portend positive vanna flows.
Jefferies Financial Group (NYSE: JEF) ran an analysis and found that VIX inversions often precede positive resolve.
“[W]e ran SPX performance from VIX inversions going back to 2004. While the performance seems a bit middling, outside of the GFC, it balloons, with 6M SPX performance over 6% and 12M over 12%. In addition, the inversion we saw on Wednesday was over 3 handles, which has led to even better performance. Outside of the GFC, 12M SPX performance has averaged over 17% and been positive in every single instance.”
Further, prevailing monetary frameworks and max liquidity promoted a large divergence in price from fundamentals. The evolution of monetary policy may make valuations much less justifiable.
Therefore, participants are looking to events such as the March Federal Open Market Committee (FOMC) meeting mid-March (March 15-16) for clarity on policy.
After this event provides clarity and potentially assuages participants of their fears, there is a large options expiration the same week.
Participants having less fear likely coincides with the lesser need to hedge, while the large options expiration is to “reset” options counterparty gamma exposures.
At present, the demand for downside (put) protection leaves counterparties short puts (i.e., a positive-delta, negative-gamma trade in which losses are amplified on increases in volatility or trade lower).
Options expirations work to clear this exposure and therefore are to reduce the amount of negative gamma. In having less negative gamma to hedge, there will be counterparty-based support (i.e., a buy-back of the short stock and futures hedges to the short put exposures).
Technical: As of 6:30 AM ET, Tuesday’s regular session (9:30 AM – 4:00 PM ET), in the S&P 500, will likely open in the lower part of a balanced overnight inventory, inside of prior-range and -value, suggesting a limited potential for immediate directional opportunity.
In the best case, the S&P 500 trades higher; activity above the $4,346.75 high volume area (HVNode) puts in play the $4,398.50 overnight high (ONH). Initiative trade beyond the ONH could reach as high as the $4,415.00 untested point of control (VPOC) and $4,438.75 key response area, or higher.
In the worst case, the S&P 500 trades lower; activity below the $4,346.75 HVNode puts in play the $4,309.00 regular trade low (RTH Low). Initiative trade beyond the RTH Low could reach as low as the $4,285.50 HVNode and $4,249.25 low volume area (LVNode), or lower.
Click here to load today’s key levels into the web-based TradingView charting platform. Note that all levels are derived using the 65-minute timeframe. New links are produced, daily.
Graphic: 65-minute profile chart of the Micro E-mini S&P 500 Futures.
Definitions
Cave-Fill Process: Widened the area deemed favorable to transact at by an increased share of participants. This is a good development.
Overnight Rally Highs (Lows): Typically, there is a low historical probability associated with overnight rally-highs (lows) ending the upside (downside) discovery process.
Volume Areas: A structurally sound market will build on areas of high volume (HVNodes). Should the market trend for long periods of time, it will lack sound structure, identified as low volume areas (LVNodes). LVNodes denote directional conviction and ought to offer support on any test.
If participants were to auction and find acceptance into areas of prior low volume (LVNodes), then future discovery ought to be volatile and quick as participants look to HVNodes for favorable entry or exit.
Gamma: Gamma is the sensitivity of an option to changes in the underlying price. Dealers that take the other side of options trades hedge their exposure to risk by buying and selling the underlying. When dealers are short-gamma, they hedge by buying into strength and selling into weakness. When dealers are long-gamma, they hedge by selling into strength and buying into weakness. The former exacerbates volatility. The latter calms volatility.
Vanna: The rate at which the delta of an option changes with respect to volatility.
POCs: POCs are valuable as they denote areas where two-sided trade was most prevalent in a prior day session. Participants will respond to future tests of value as they offer favorable entry and exit.
About
After years of self-education, strategy development, mentorship, and trial-and-error, Renato Leonard Capelj began trading full-time and founded Physik Invest to detail his methods, research, and performance in the markets.
Capelj is also a Benzinga finance and technology reporter interviewing the likes of Shark Tank’s Kevin O’Leary, JC2 Ventures’ John Chambers, FTX’s Sam Bankman-Fried, and ARK Invest’s Catherine Wood, as well as a SpotGamma contributor developing insights around impactful options market dynamics.
Disclaimer
Physik Invest does not carry the right to provide advice.
In no way should the materials herein be construed as advice. Derivatives carry a substantial risk of loss. All content is for informational purposes only.
The Daily Brief is a free glimpse into the prevailing fundamental and technical drivers of U.S. equity market products. Join the 200+ that read this report daily, below!
Overnight, equity index, as well as most commodity, and bond futures were higher ahead of data releases on the Consumer Price Index (8:30 AM ET), Federal Budget, and Beige Book (2:00 PM ET), as well as Fed-speak by Neel Kashkari (1:00 PM ET).
Graphic updated 6:30 AM ET. Sentiment Risk-On if expected /ES open is above the prior day’s range. /ES levels are derived from the profile graphic at the bottom of the following section. Levels may have changed since initially quoted; click here for the latest levels. SqueezeMetrics Dark Pool Index (DIX) and Gamma (GEX) calculations are based on where the prior day’s reading falls with respect to the MAX and MIN of all occurrences available. A higher DIX is bullish. At the same time, the lower the GEX, the more (expected) volatility. Learn the implications of volatility, direction, and moneyness. SHIFT data used for S&P 500 (INDEX: SPX) options activity. Note that options flow is sorted by the call premium spent; if more positive, then more was spent on call options. Breadth reflects a reading of the prior day’s NYSE Advance/Decline indicator. VIX reflects a current reading of the CBOE Volatility Index (INDEX: VIX) from 0-100.
What To Expect
Fundamental: The focus, today, is whether or not the headline inflation rate tops 7%.
This is as improvements in the U.S. labor market and increased hawkishness from the Federal Reserve (Fed) are playing into a recent rotation (into value) and broad market slump.
As stocks recover from their multi-day slump; Jerome Powell reassured investors, Tuesday, that the Fed would stem increasing inflation and shrink its balance sheet.
“Hawkish Fed repricing is likely largely done for now,” and “resilient earnings should help equities rebound,” Barclays Plc (NYSE: BCS) strategists explained in a recent note.
Graphic: Via @biancoresearch, “we are in a rare period when what the market has priced in is the outlier call.”
JPMorgan Chase & Co (NYSE: JPM) agrees. Equities should be able to withstand hikes and balance sheet runoff amidst above-trend growth and a rebound in some international markets.
“As long as yields are rising for the right reasons, including better growth, we believe that equities should be able to tolerate the move,” a JPMorgan note said.
“The rise in real rates should not be hurting equity markets, or economic activity, at least until they move into positive territory, or even as long as real rates are below the real potential growth.”
In support of JPMorgan’s comments on real rates and growth, Sanford Bernstein outlines a bull case stating: “[H]istorically, when real yields normalized back to zero from negative levels, equities have had positive returns.”
As a bonus, per Ryan Detrick of LPL Financial, “Yes, the Fed will probably hike rates for the first time in a new cycle some time during the first half of 2022. Remember though, looking at the past 8 first hikes, stocks were higher a year later every single time.”
Graphic: S&P 500 performance post-hiking, via LPL Financial.
In opposition to the bull-narrative, Jim Bianco of Bianco Research puts it well: “So, if the bond market is having epic convulsions in the wake Fed printer getting turned off, do not take solace that the stock market ‘doesn’t get it.’
“This is how financial markets turn, the stock market often stays too long and turns last.”
Positioning: To keep things fresh, recall that in buying a put, for instance, customers indirectly take liquidity as the counterparties hedge short put exposure by selling underlying.
Higher implied volatility marks up options delta (exposure to direction) and this leads to more selling, as hedging pressures exacerbate weakness. Higher volatility, higher delta, more selling.
As implied volatility compresses, options delta (exposure to direction) is marked down. This leads to buying by the counterparty.
Per SpotGamma’s (unreleased) Hedging Impact of Real-Time Options indicator, over the past sessions, positive delta trade on the part of counterparties, as a result of customer put selling and call buying, has supported the near-vertical price rise from Monday’s lows.
Graphic: SpotGamma’s (beta) Hedging Impact of Real-Time Options (HIRO) indicator.
As visualized, above, positive delta trade tapered off into the close, Tuesday, while S&P 500 prices continued higher. Interesting, right? Part of that rally has to do with volatility compression.
The VIX term structure remains upward sloping and volatility (via the INDEX: VIX) has fallen. As stated, above, compression marks options delta down and leads to buying by the counterparty.
My $VIX technical analysis shows a big wick yesterday as a result of the intraday VIX reversal from 23.5 to 19.5. Seems to be associated with (VIX) tops. pic.twitter.com/JgFdmfLybE
Technical: As of 6:30 AM ET, Wednesday’s regular session (9:30 AM – 4:00 PM ET), in the S&P 500, will likely open in the middle part of a positively skewed overnight inventory, just outside of prior-range and -value, suggesting a potential for immediate directional opportunity.
Gap Scenarios: Gaps ought to fill quickly. Should they not, that’s a signal of strength; do not fade. Leaving value behind on a gap-fill or failing to fill a gap (i.e., remaining outside of the prior session’s range) is a go-with indicator.

Auctioning and spending at least 1-hour of trade back in the prior range suggests a lack of conviction; in such a case, do not follow the direction of the most recent initiative activity.
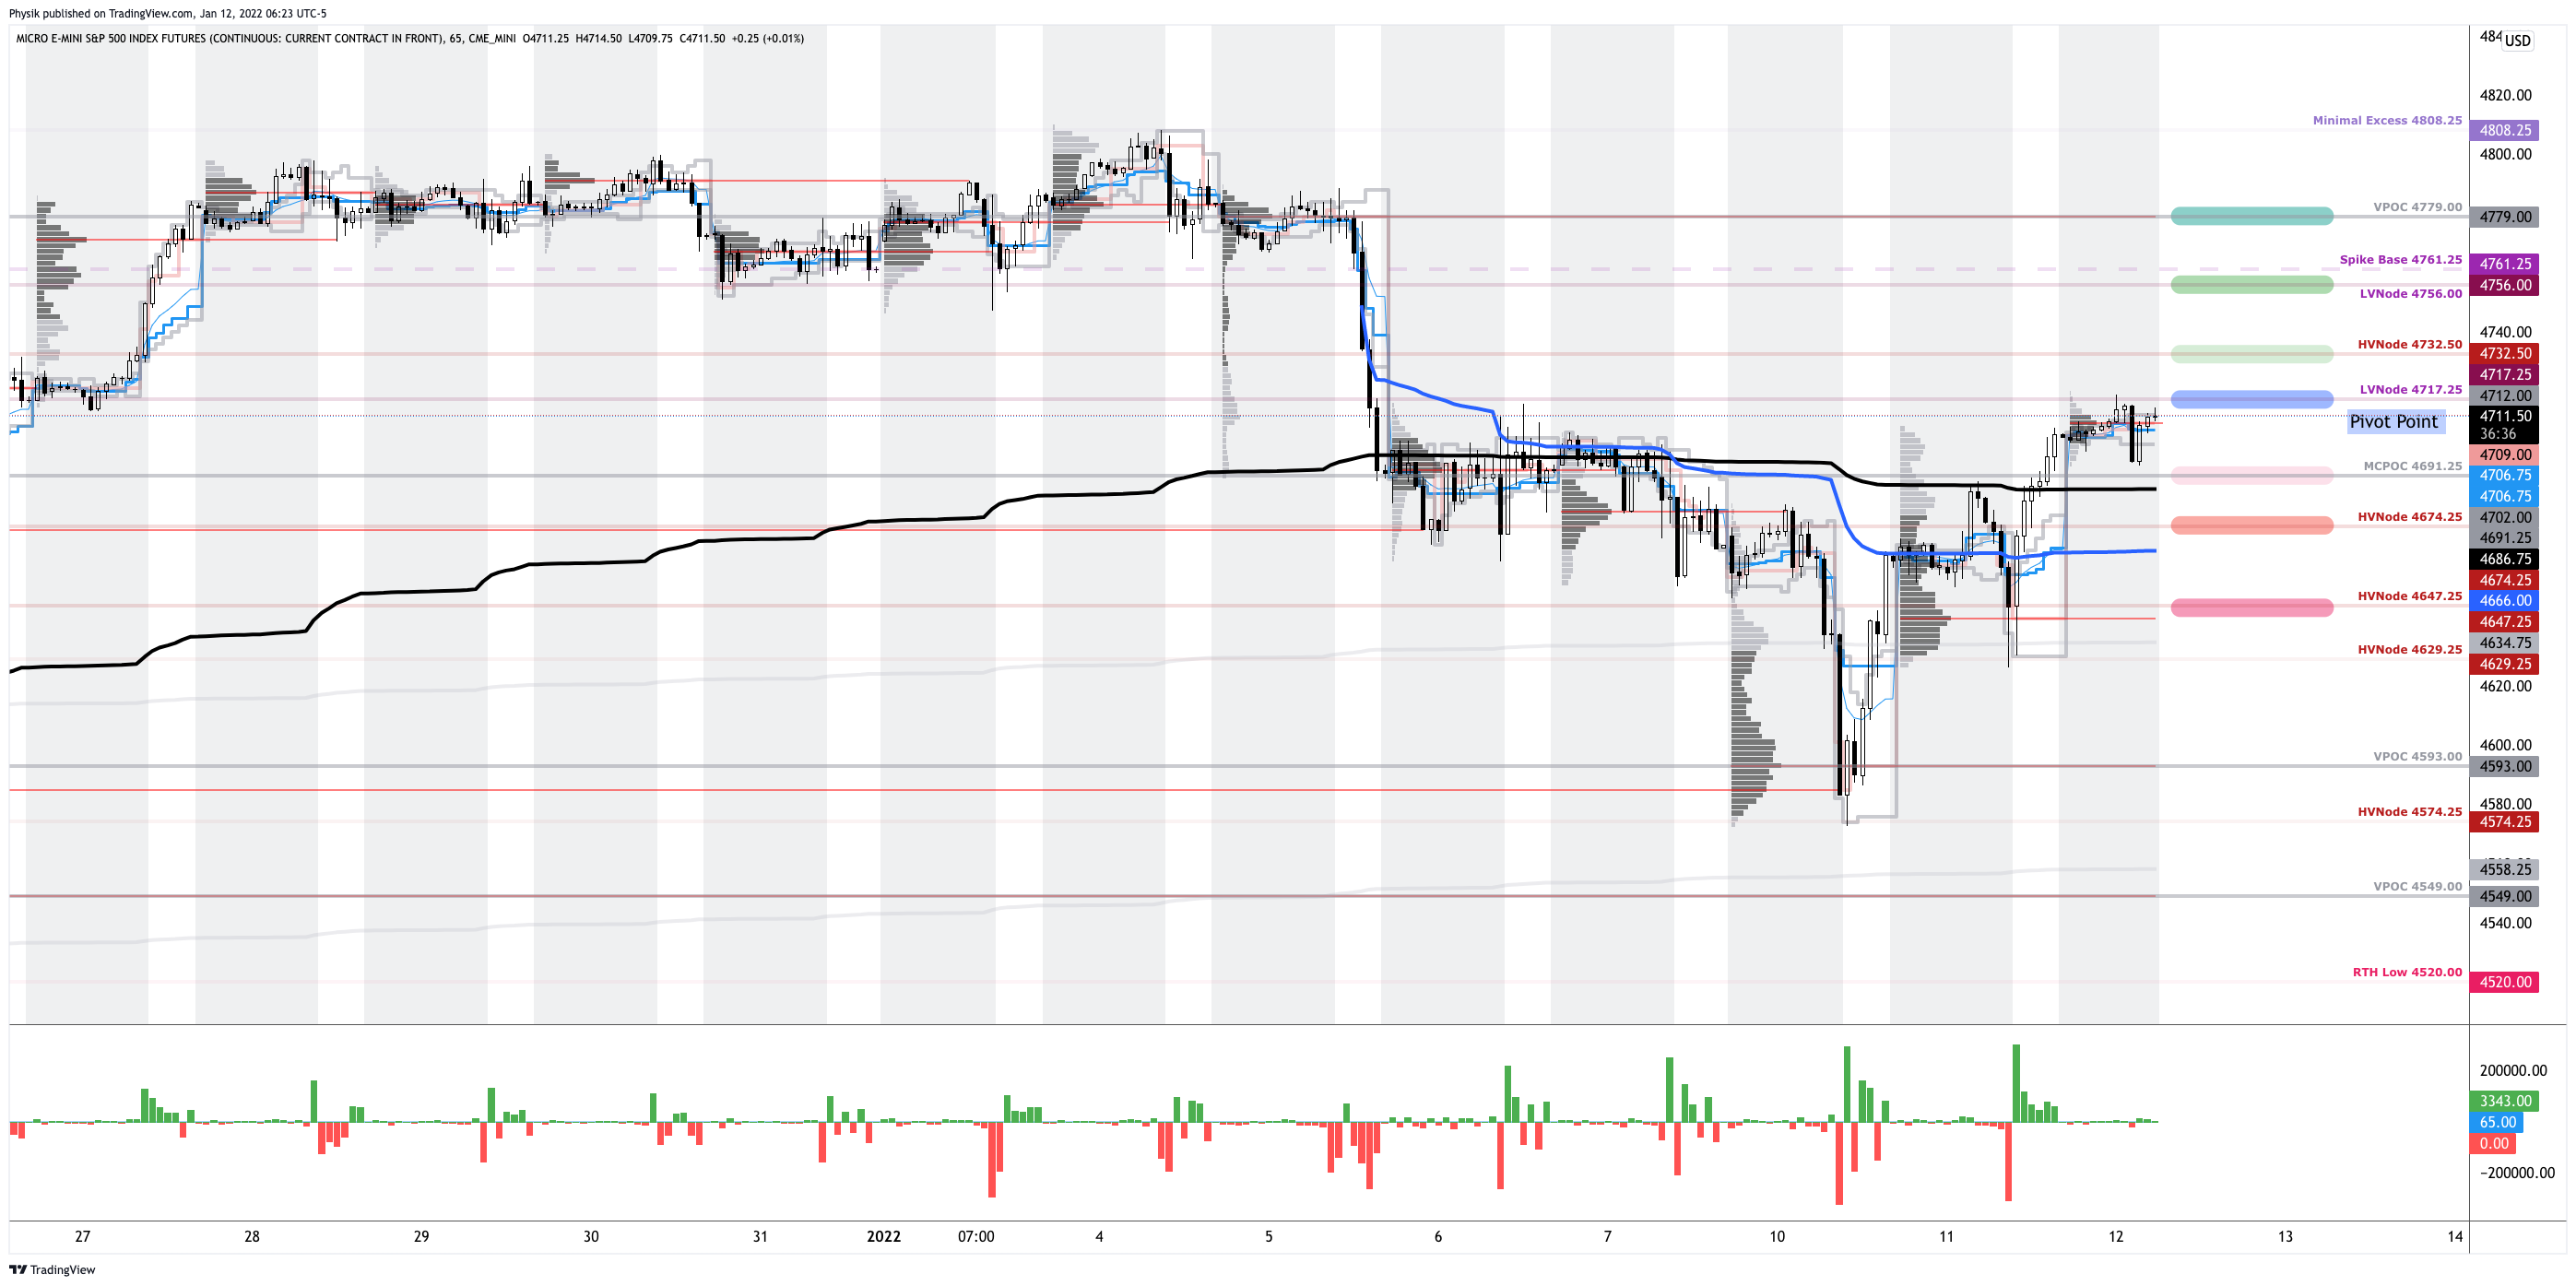
In the best case, the S&P 500 trades higher; activity above the $4,717.25 low volume area (LVNode) puts in play the $4,732.50 high volume area (HVNode). Initiative trade beyond the HVNode could reach as high as the $4,756.00 LVNode and $4,779.00 untested point of control (VPOC), or higher.
In the worst case, the S&P 500 trades lower; activity below the $4,717.25 LVNode puts in play the $4,691.25 micro composite point of control (MCPOC). Initiative trade beyond the MCPOC could reach as low as the $4,674.25 and $4,647.25 HVNode, or lower.
Click here to load today’s key levels into the web-based TradingView charting platform. Note that all levels are derived using the 65-minute timeframe. New links are produced, daily.
Graphic: 65-minute profile chart of the Micro E-mini S&P 500 Futures.
What People Are Saying
A fundamental question that is overlooked as traders jump into indicators, tools, chart types, patterns, moon cycles or whatever: why should the market reward your trade? Why here? Why long or short? For what target and at what stop? Cont… #trading
Volume Areas: A structurally sound market will build on areas of high volume (HVNodes). Should the market trend for long periods of time, it will lack sound structure, identified as low volume areas (LVNodes). LVNodes denote directional conviction and ought to offer support on any test.
If participants were to auction and find acceptance into areas of prior low volume (LVNodes), then future discovery ought to be volatile and quick as participants look to HVNodes for favorable entry or exit.
POCs: POCs are valuable as they denote areas where two-sided trade was most prevalent in a prior day session. Participants will respond to future tests of value as they offer favorable entry and exit.
MCPOCs: POCs are valuable as they denote areas where two-sided trade was most prevalent over numerous day sessions. Participants will respond to future tests of value as they offer favorable entry and exit.
About
After years of self-education, strategy development, mentorship, and trial-and-error, Renato Leonard Capelj began trading full-time and founded Physik Invest to detail his methods, research, and performance in the markets.
Capelj is also a Benzinga finance and technology reporter interviewing the likes of Shark Tank’s Kevin O’Leary, JC2 Ventures’ John Chambers, FTX’s Sam Bankman-Fried, and ARK Invest’s Catherine Wood, as well as a SpotGamma contributor developing insights around impactful options market dynamics.
Disclaimer
Physik Invest does not carry the right to provide advice.
In no way should the materials herein be construed as advice. Derivatives carry a substantial risk of loss. All content is for informational purposes only.
Overnight, equity index futures auctioned higher alongside most commodities and volatility fell.
This is as investors await data on manufacturing and job openings/quits (10:00 AM ET).
Graphic updated 6:30 AM ET. Sentiment Risk-On if expected /ES open is above the prior day’s range. /ES levels are derived from the profile graphic at the bottom of the following section. Levels may have changed since initially quoted; click here for the latest levels. SqueezeMetrics Dark Pool Index (DIX) and Gamma (GEX) calculations are based on where the prior day’s reading falls with respect to the MAX and MIN of all occurrences available. A higher DIX is bullish. At the same time, the lower the GEX, the more (expected) volatility. Learn the implications of volatility, direction, and moneyness. SHIFT data used for S&P 500 (INDEX: SPX) options activity. Note that options flow is sorted by the call premium spent; if more positive then more was spent on call options. Breadth reflects a reading of the prior day’s NYSE Advance/Decline indicator. VIX reflects a current reading of the CBOE Volatility Index (INDEX: VIX) from 0-100.
What To Expect
Fundamental: The aforementioned trade is happening in the context of a resurgence in the coronavirus, as well as the Federal Reserve’s intent to moderate stimulus, among other things.
“We expect 2022 to be far more challenging from an investment perspective,” Heather Wald, vice president at Bel Air Investment Advisors, said.
“Rarely has a market delivered three consecutive years of double-digit returns, as we have seen from 2019-2021. With the Federal Reserve set to accelerate tightening and a fairly valued stock market, we anticipate more muted returns for the S&P next year but still expect equities to remain attractive versus other liquid asset classes.”
Wald’s comments align with some metrics posted by LPL Financial’s Ryan Detrick.
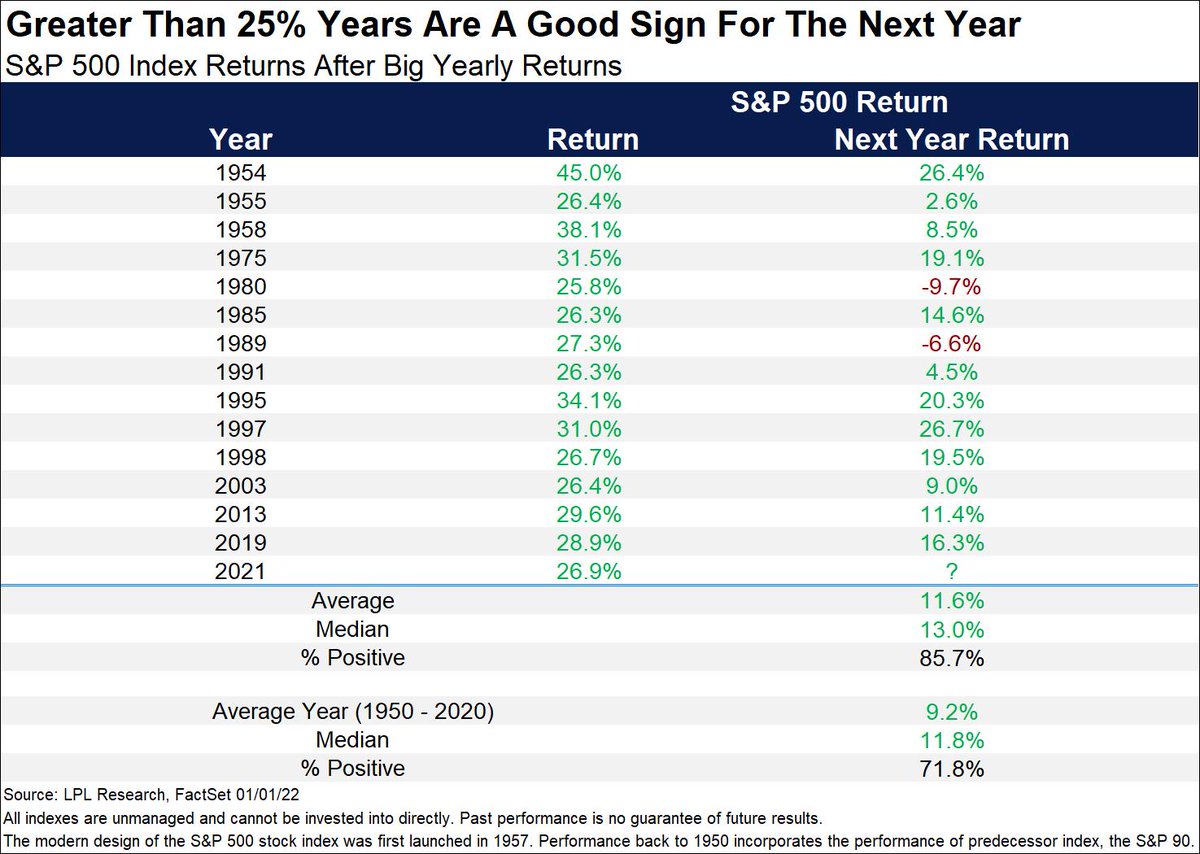
“The bad news is when the S&P 500 gains more than 25% in a year, it has never gained more the following year,” Detrick said. “The good news? That next year can still be pretty darn good. Higher 85% of the time and up a solid 11% on average.”
Graphic: S&P 500 returns via Ryan Detrick.
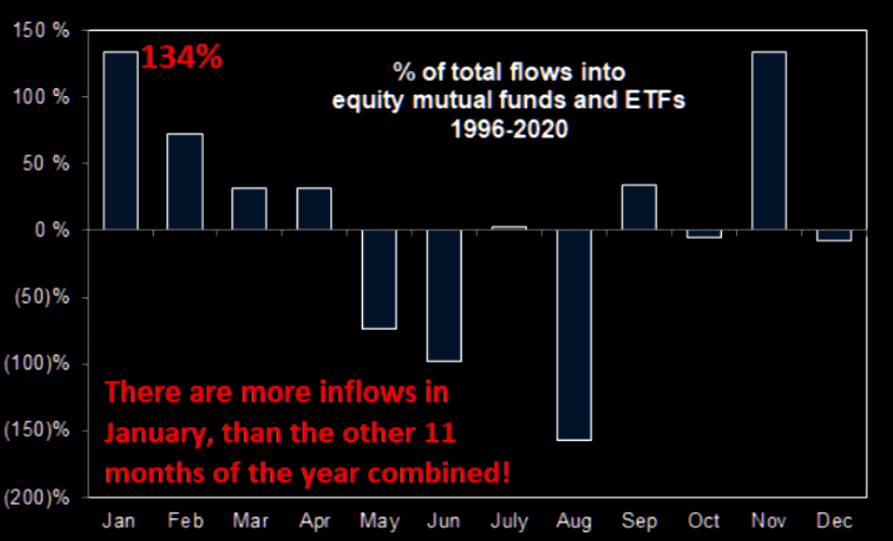
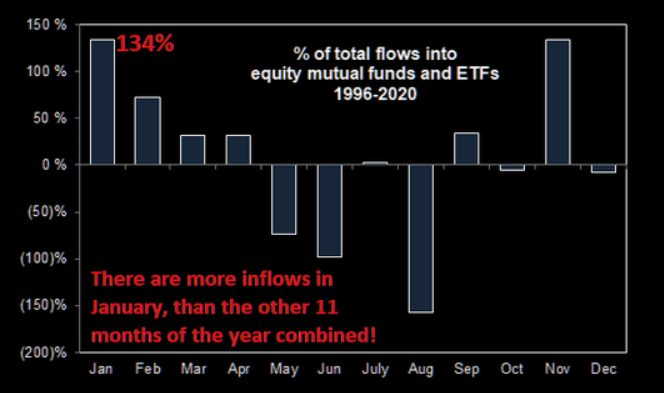
This is as the S&P 500 sticks to its seasonal script; in the face of light positioning metrics, expected are massive inflows in the first few months of this year.
Graphic: Per The Market Ear, “January typically sees 134% of inflows (the rest of the 11 months -34%). And with every private wealth manager in the world right now pitching increased allocations into equities (out of cash and out of bonds), Goldman calculates that keeping 2021 pace, This would be $125BN worth of inflows quickly in January.”
This year is likely to be “dominated by continued knife-edge judgments by the Fed,” and inflation proving better than the most pessimistic forecasts, potentially.
The prospects of a rally into the first rate hike are emboldened. Thereafter, the market may decline through the rest of 2022.
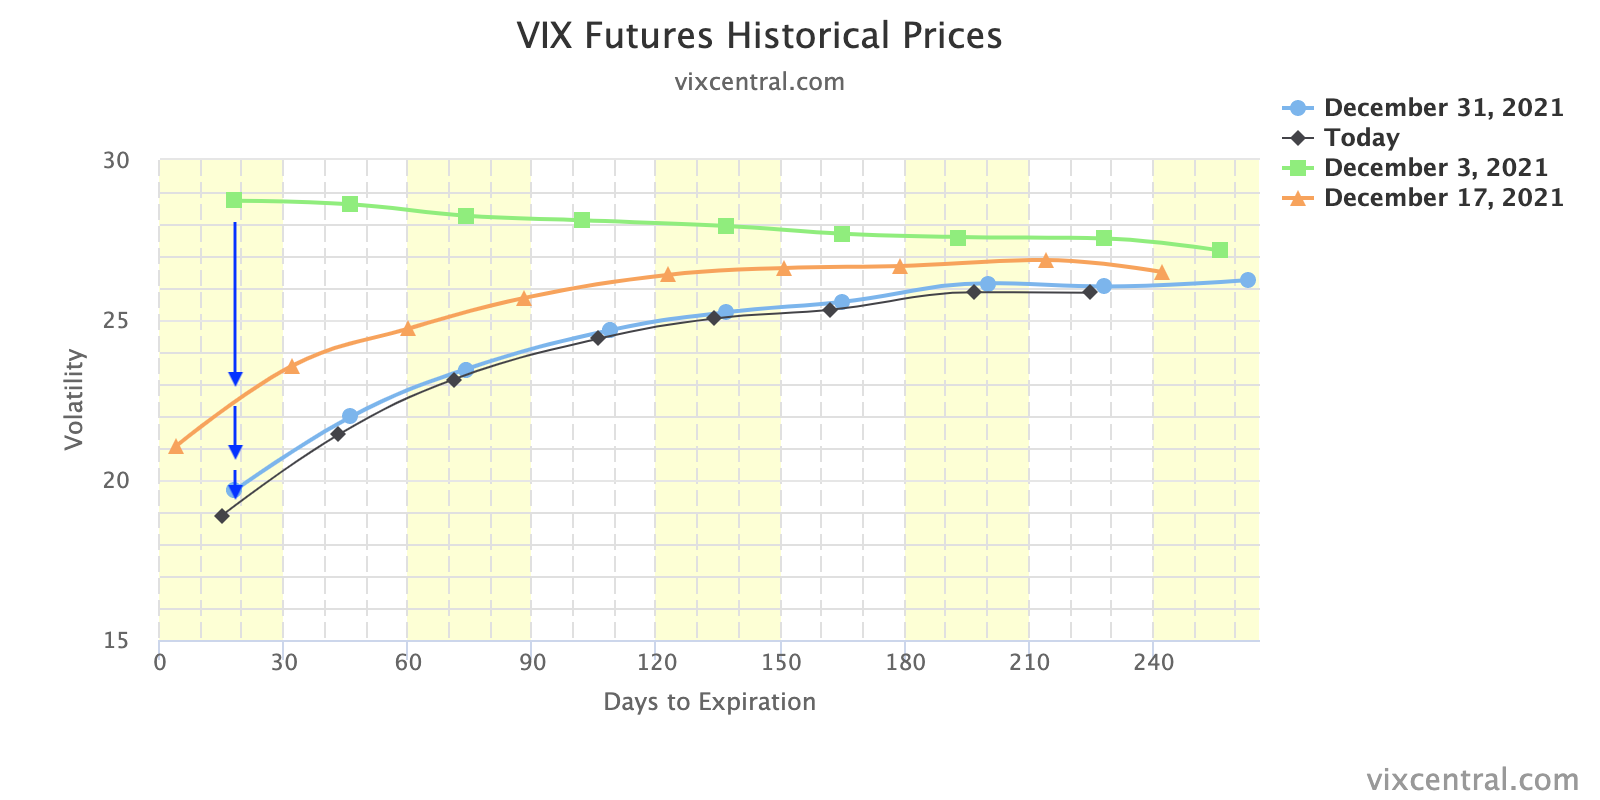
Positioning: Interesting Twitter thread by Kris Sidial on the transfer of risk in different areas of the volatility term structure.
“You are seeing institutions aim to harvest the VRP in single stock land by hammering away at the front of the term structure. Especially the exotics desks that are notorious for carrying this inherent short calendar profile.”
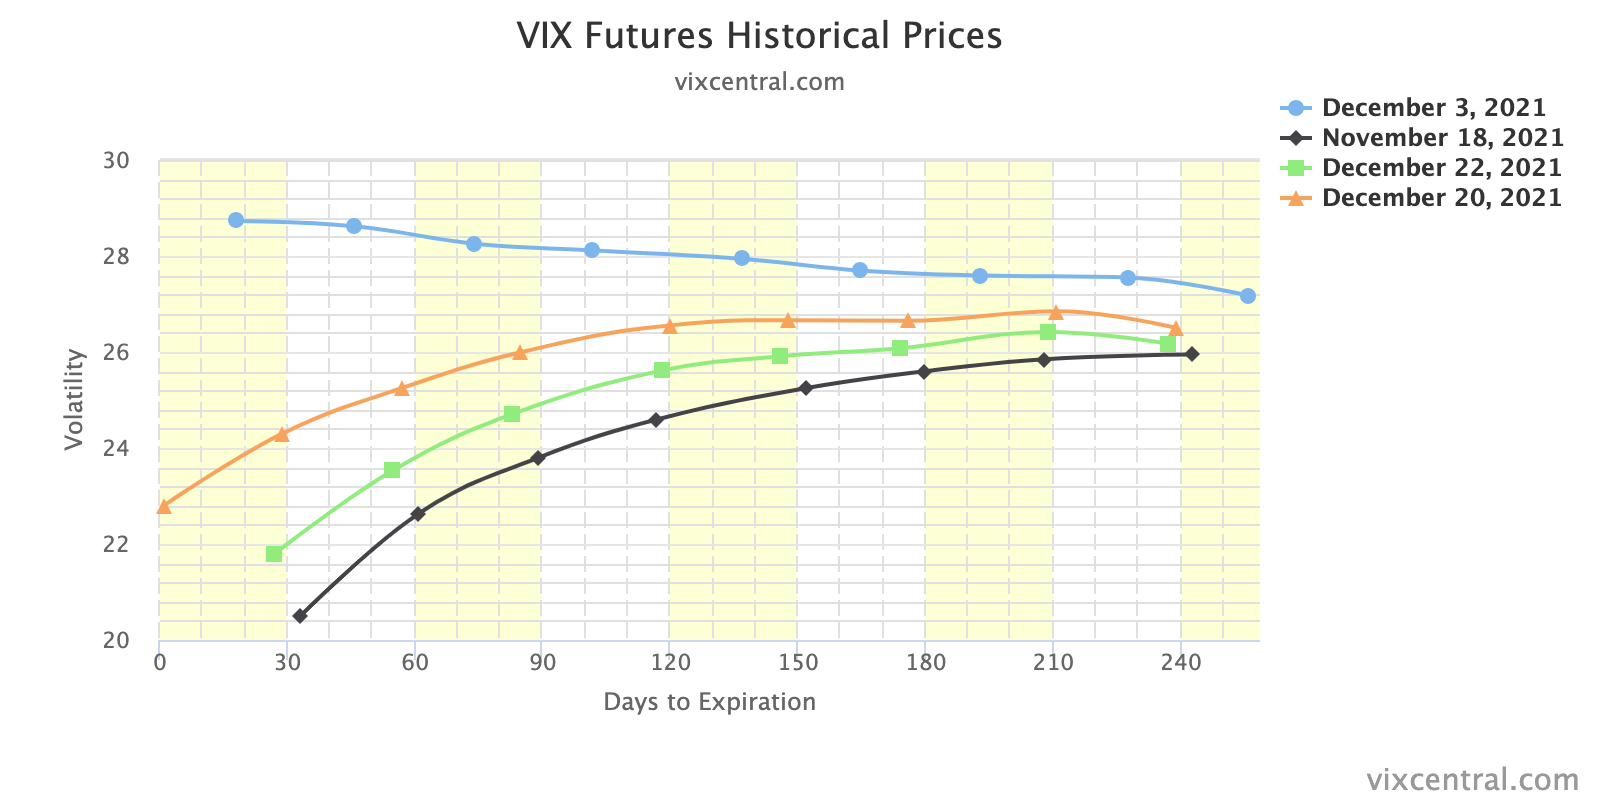
What Sidial is talking about is most easily visualized by the compression and expansion of the VIX term structure in the graphic below. Notice the front move, relative to the back, below.
Graphic: VIX term shifts inward; as mostly short-dated protection is monetized or expired, volatility collapses and dealers’ exposure to the positive delta (via short puts) declines which meant they would cover their short futures hedges. This “vanna” flow bolsters SPX rallies.
The implications of this are staggering.
Participants, having been pushed out the risk curve, are using leverage to juice returns; option volumes are comparable to stock volumes.
As a result, related hedging flows represent an increased share of volume.
As I once wrote in a Benzinga article: “The reflexive response by the opposing side of options trades — a result of regulatory frameworks, the low-interest-rate environment, as well as growth of the derivatives complex — causes a cascading reaction that exacerbates underlying price movements.”
Sidial adds: “[T]his short gamma profile with more and more people using derivatives will make way for the rapid moves in shorter time frames.”
That explains a lot!
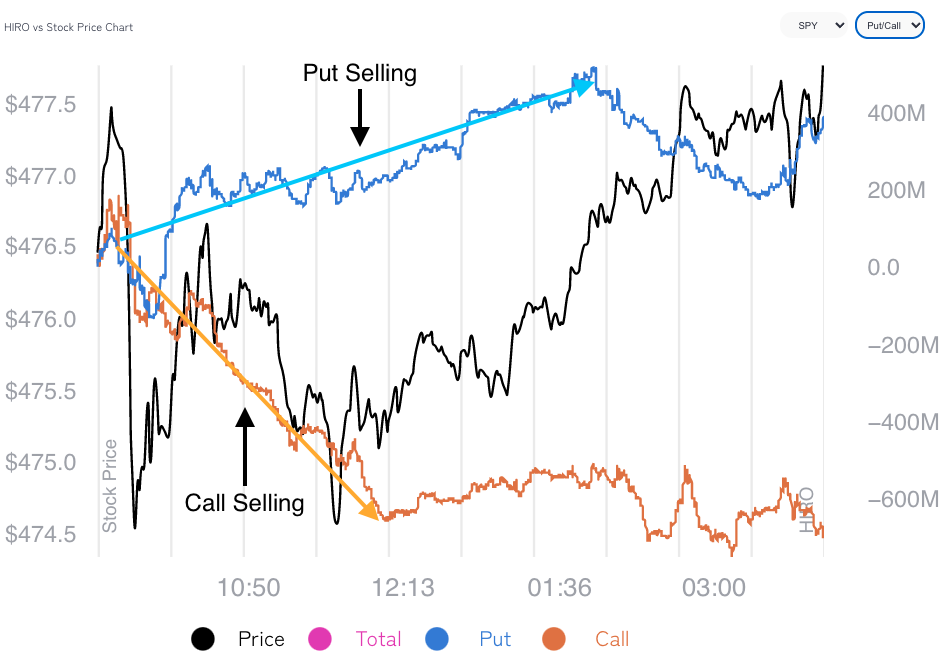
Moreover, if we zoom in more narrow, today, though implied volatility “is well above its pre-COVID level across the term structure,” it is being sold at the front end.
SpotGamma data confirms this. Via the graphic below, the compression of volatility coincides with call and put selling at the index level; note, though, the increased put selling (more bullish).
Graphic: SpotGamma’s Hedging Impact of Real-Time Options (HIRO) indicator.
Participants’ activity in shorter-dated tenors (as evidenced by the compression of VIX term structure mainly at the front-end) where options are more so sensitive to changes in the underlying price, time, and volatility, is promoting choppy (but bullish) price action, for now.
With bullish activity in single stocks like Tesla Inc (which was primed for an options-driven squeeze heading into Monday) feeding into S&P positioning, alongside the removal of hedges to positioning that was pressuring stocks and indices heading into Friday OPEX, and passive buying support, there’s potentially more room for higher, to put it simply.
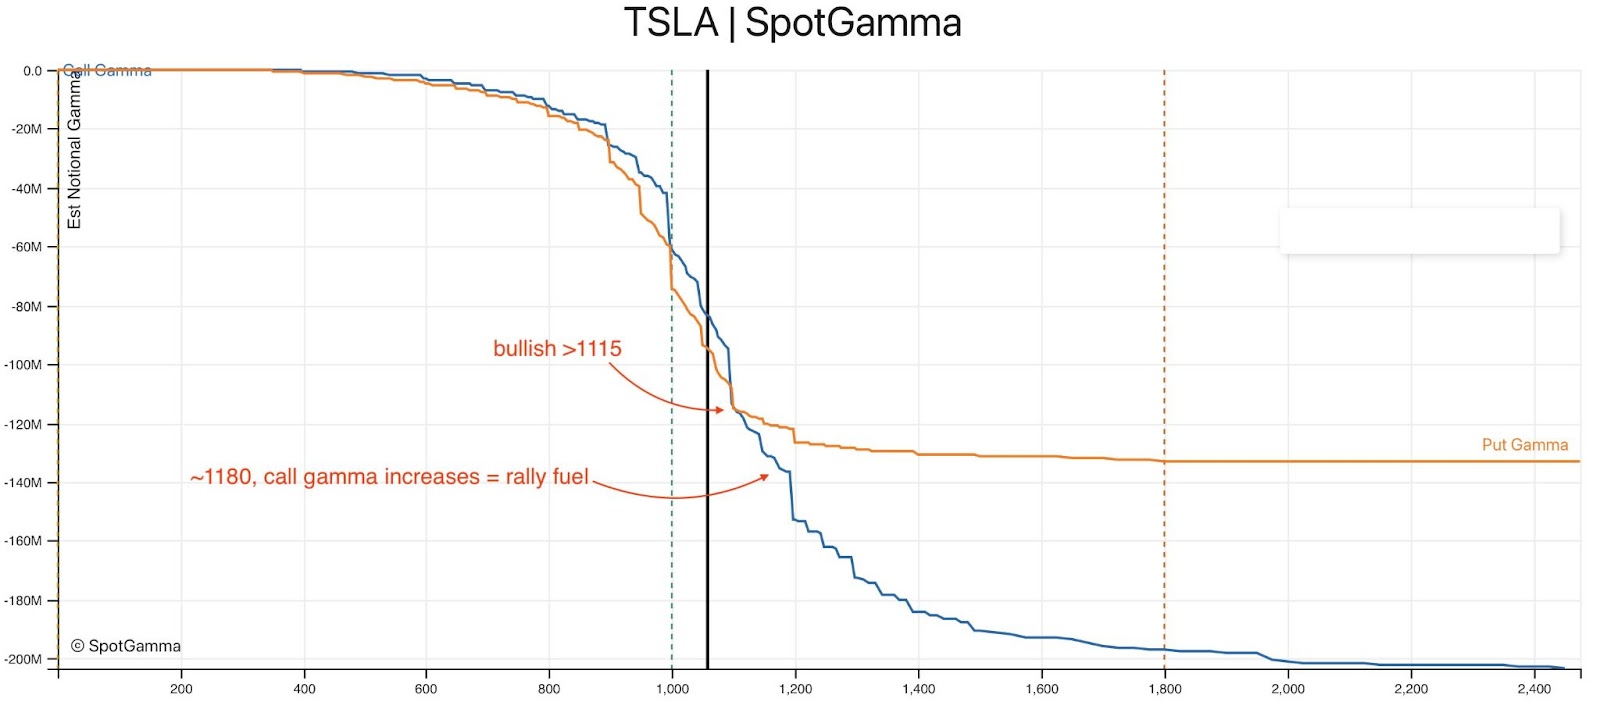
Graphic: SpotGamma posts on TSLA’s options positioning, Monday.
In the end, the concern is whether this bullishness leaves participants reaching for downside (put) protection, later. This would have destabilizing implications, as Sidial alluded to earlier.
Graphic: The “Biggest tail risk to SPX isn’t any macro data/virus/war but its own options market.”
Expectations: As of 6:30 AM ET, Tuesday’s regular session (9:30 AM – 4:00 PM ET), in the S&P 500, will likely open in the upper part of a positively skewed overnight inventory, outside of prior-range and -value, suggesting a potential for immediate directional opportunity.
Balance-Break + Gap Scenarios: A change in the market (i.e., the transition from two-time frame trade, or balance, to one-time frame trade, or trend) is occurring.

Monitor for acceptance (i.e., more than 1-hour of trade) outside of the balance area.

Leaving value behind on a gap-fill or failing to fill a gap (i.e., remaining outside of the prior session’s range) is a go-with indicator.

Rejection (i.e., return inside of balance) portends a move to the opposite end of the balance.
In the best case, the S&P 500 trades higher; activity above the $4,798.50 low volume area (LVNode) puts in play the $4,805.50 extension. Initiative trade beyond the $4,805.50 could reach as high as the $4,814.00 and $4,832.25 extension, or higher.
In the worst case, the S&P 500 trades lower; activity below the $4,798.50 LVNode puts in play the $4,790.25 high volume area (HVNode). Initiative trade beyond the HVNode could reach as low as the $4,777.00 untested point of control (VPOC) and $4,756.00 LVNode, or lower.
Click here to load today’s key levels into the web-based TradingView charting platform. Note that all levels are derived using the 65-minute timeframe. New links are produced, daily.
Graphic: 65-minute profile chart of the Micro E-mini S&P 500 Futures.
Definitions
Volume Areas: A structurally sound market will build on areas of high volume (HVNodes). Should the market trend for long periods of time, it will lack sound structure, identified as low volume areas (LVNodes). LVNodes denote directional conviction and ought to offer support on any test.
If participants were to auction and find acceptance into areas of prior low volume (LVNodes), then future discovery ought to be volatile and quick as participants look to HVNodes for favorable entry or exit.
Gamma: Gamma is the sensitivity of an option to changes in the underlying price. Dealers that take the other side of options trades hedge their exposure to risk by buying and selling the underlying. When dealers are short-gamma, they hedge by buying into strength and selling into weakness. When dealers are long-gamma, they hedge by selling into strength and buying into weakness. The former exacerbates volatility. The latter calms volatility.
Vanna: The rate at which the delta of an option changes with respect to volatility.
Charm: The rate at which the delta of an option changes with respect to time.
POCs: POCs are valuable as they denote areas where two-sided trade was most prevalent in a prior day session. Participants will respond to future tests of value as they offer favorable entry and exit.
Options Expiration (OPEX): Traditionally, option expiries mark an end to pinning (i.e, the theory that market makers and institutions short options move stocks to the point where the greatest dollar value of contracts will expire) and the reduction dealer gamma exposure.
Volume-Weighted Average Prices (VWAPs): A metric highly regarded by chief investment officers, among other participants, for quality of trade. Additionally, liquidity algorithms are benchmarked and programmed to buy and sell around VWAPs.
Rates: Low rates have to potential to increase the present value of future earnings making stocks, especially those that are high growth, more attractive. To note, inflation and rates move inversely to each other. Low rates stimulate demand for loans (i.e., borrowing money is more attractive).
About
After years of self-education, strategy development, mentorship, and trial-and-error, Renato Leonard Capelj began trading full-time and founded Physik Invest to detail his methods, research, and performance in the markets.
Capelj is also a Benzinga finance and technology reporter interviewing the likes of Shark Tank’s Kevin O’Leary, JC2 Ventures’ John Chambers, FTX’s Sam Bankman-Fried, and ARK Invest’s Catherine Wood, as well as a SpotGamma contributor developing insights around impactful options market dynamics.
Disclaimer
At this time, Physik Invest does not carry the right to provide advice.
In no way should the materials herein be construed as advice. Derivatives carry a substantial risk of loss. All content is for informational purposes only.
Notice: Up to January 3, 2022, any commentaries published will be lighthearted and, generally, shorter in length.
What Happened
Overnight, equity index and bond futures were divergent while most commodities traded lower.
In the face of “holiday-thinned liquidity,” the CBOE Volatility Index (INDEX: VIX) rose ~1.15; this week, the expectation is (A) flatlined volatility or (B) ugly, headline-driven intraday moves.
Ahead, there is no data scheduled for release.
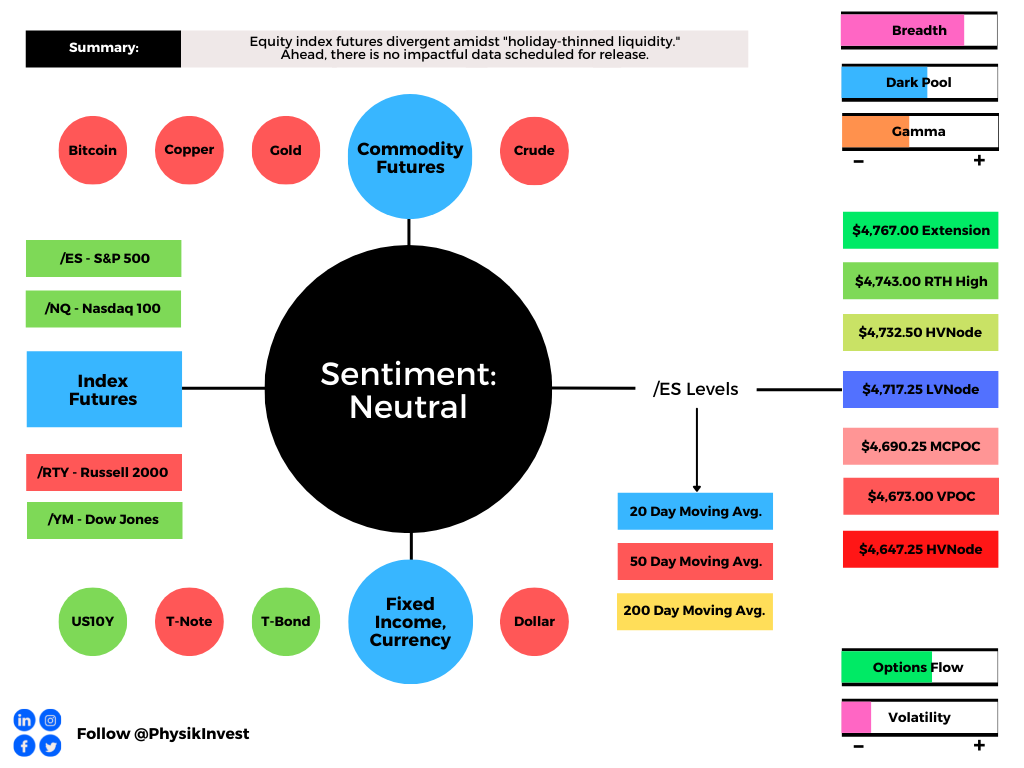
Graphic updated 5:45 AM ET. Sentiment Neutral if expected /ES open is inside of the prior day’s range. /ES levels are derived from the profile graphic at the bottom of the following section. Levels may have changed since initially quoted; click here for the latest levels. SqueezeMetrics Dark Pool Index (DIX) and Gamma (GEX) calculations are based on where the prior day’s reading falls with respect to the MAX and MIN of all occurrences available. A higher DIX is bullish. At the same time, the lower the GEX, the more (expected) volatility. Learn the implications of volatility, direction, and moneyness. SHIFT data used for S&P 500 (INDEX: SPX) options activity. Note that options flow is sorted by the call premium spent; if more positive then more was spent on call options. Breadth reflects a reading of the prior day’s NYSE Advance/Decline indicator. VIX reflects a current reading of the CBOE Volatility Index (INDEX: VIX) from 0-100.
What To Expect
Last week, on lackluster intraday breadth and market liquidity metrics, the best case outcome occurred via an expansion of range and separation of value, the levels at which participants found it most favorable to transact.
The aforementioned activity, which marks the continuation of a trend, is built on poor structure.
That, ultimately, adds to technical instability.
Why?As explained, Thursday, given the persistence of mechanical responses to key technical levels, visually-driven, weaker-handed participants (which seldom bear the wherewithal to defend retests) carry a heavier hand in recent price discovery.
Via volume profile analysis, we see a plethora of low-volume pockets – voids, if you will – that likely hold virgin tests. As stated, yesterday, successful penetration portends follow-through given the participants that were most active at those technical levels. Caution is still warranted.
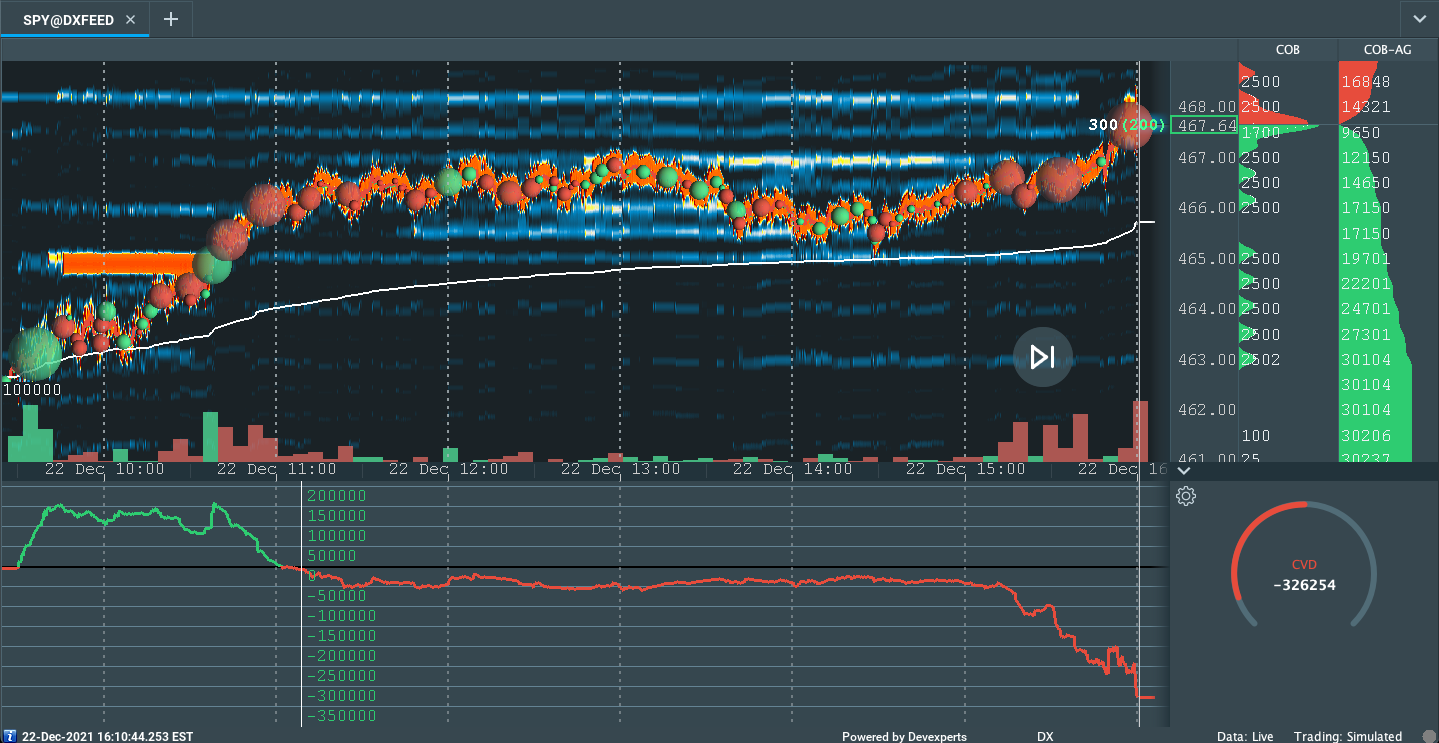
Graphic: Divergent delta (i.e., non-committed buying and selling as measured by volume delta or buying and selling power as calculated by the difference in volume traded at the bid and offer) in SPDR S&P 500 ETF Trust (NYSE: SPY), one of the largest ETFs that track the S&P 500 index, via Bookmap. The readings are supportive of responsive trade (i.e., rotational trade that suggests current prices may offer favorable entry/exit; the market is attempting to balance).
Context: In the face of a “stealth correction,” and an “off-loading of risk by professional speculators,” the S&P 500 closed beyond a visual resistance level, last week, on light volume.
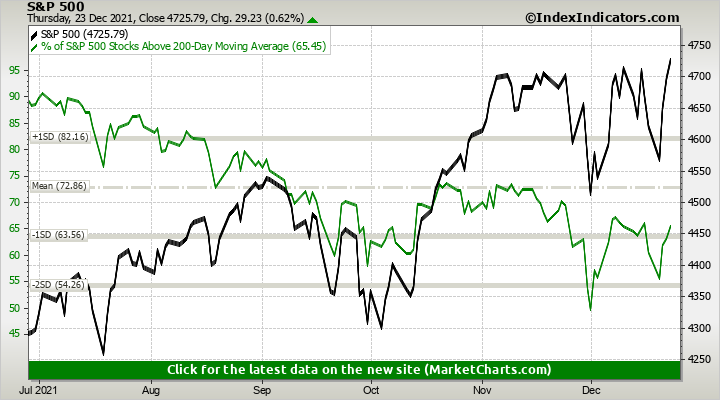
Graphic: A multi-month divergence (and downtrend) in breadth metrics stabilize as participants attempt to discover higher prices in the S&P 500.
This is as, according to Ryan Detrick of LPL Financial, the “official Santa Claus Rally starts this Monday (last 5 days of the year and the first two of the following year).”
Kai Volatility’s Cem Karsan echoes Detrick’s remarks.
“Since 1980, there have been 10 instances where the S&P 500 was up 20% or more going into the last stretch of trading, and in 9 of those years, it ended the final 6 days higher.”
Moreover, despite an eventual decline in fiscal support, negative adjustments to the EPS guidance of more index constituents, and revisions lower in growth forecasts, Morgan Stanley’s (NYSE: MS) saw flows shift in high-growth, rate-sensitive names – “flows have reversed in recent sessions as there have been small levels of net buying.”
The change in tone with respect to flows is seasonally-aligned, so to speak; per Goldman Sachs Group (NYSE: GS), January sees more inflows than all other months combined.
Graphic: Per The Market Ear, “January typically sees 134% of inflows (the rest of the 11 months -34%). And with every private wealth manager in the world right now pitching increased allocations into equities (out of cash and out of bonds), Goldman calculates that keeping 2021 pace, This would be $125BN worth of inflows quickly in January.”
Adding, in the face of this week’s weighty “Quarterlys” expiry, Goldman Sachs sees options selling attractive, near term; a commitment of capital on lower volatility likely results in counterparties to customer options trades taking on more exposure to sticky positive gamma.
Note: As a position’s delta rises with stock or index price rises, gamma (or how an option’s delta is expected to change given a change in the underlying) is added to the delta.
This is while many products are in lower liquidity and short-gamma (wherein an options delta decreases with stock prices rises and increases when stock prices drop) in which moves are more erratic.
Therefore, coming into weighty options expiration, correlations may be off (as that is the only reconciliation in an environment where, at the index level, hedging pressures are sticky, whereas elsewhere they aren’t).
Thereafter, participants ought to monitor the sides and levels capital is committed for clues as to where we go next.
Continued compression of volatility, as well as a commitment to options higher in prices and further out in time, supports upward price discovery.
Unpacked with @spotgamma recent trade through an options market lens.
Key Points: – What is delta, long/short gamma, vanna, charm – Implications of NOV, DEC expiry. Post-OPEX vol – Where to next given current options positioning – Expert comments + morehttps://t.co/ZUf97pYhtb
Expectations: As of 5:45 AM ET, Monday’s regular session (9:30 AM – 4:00 PM ET), in the S&P 500, will likely open in the upper part of a balanced overnight inventory, inside of prior-range and -value, suggesting a limited potential for immediate directional opportunity.
In the best case, the S&P 500 trades sideways or higher; activity above the $4,717.25 low volume area (LVNode) puts in play the $4,732.50 high volume area (HVNode). Initiative trade beyond the HVNode could reach as high as the $4,743.00 regular trade high (RTH High) and $4,767.00 extension, or higher.
In the worst case, the S&P 500 trades lower; activity below the $4,717.25 LVNode puts in play the $4,690.25 micro composite point of control (MCPOC). Initiative trade beyond the MCPOC could reach as low as the $4,673.00 untested point of control (VPOC) and $4,647.25 HVNode, or lower.
Click here to load today’s key levels into the web-based TradingView charting platform. Note that all levels are derived using the 65-minute timeframe. New links are produced, daily.
Graphic: 65-minute profile chart of the Micro E-mini S&P 500 Futures. Learn about the profile.
Vol trader & renowned author, @SinclairEuan joins @JasonMutiny in the last segment of this week's Real Visionaries for a look at his wild journey from market making & sports betting to even card counting in #Vegas. pic.twitter.com/5l7Av6wXZa
Volume Areas: A structurally sound market will build on areas of high volume (HVNodes). Should the market trend for long periods of time, it will lack sound structure, identified as low volume areas (LVNodes). LVNodes denote directional conviction and ought to offer support on any test.
If participants were to auction and find acceptance into areas of prior low volume (LVNodes), then future discovery ought to be volatile and quick as participants look to HVNodes for favorable entry or exit.
POCs: POCs are valuable as they denote areas where two-sided trade was most prevalent in a prior day session. Participants will respond to future tests of value as they offer favorable entry and exit.
MCPOCs: POCs are valuable as they denote areas where two-sided trade was most prevalent over numerous day sessions. Participants will respond to future tests of value as they offer favorable entry and exit.
Volume-Weighted Average Prices (VWAPs): A metric highly regarded by chief investment officers, among other participants, for quality of trade. Additionally, liquidity algorithms are benchmarked and programmed to buy and sell around VWAPs.
About
After years of self-education, strategy development, and trial-and-error, Renato Leonard Capelj began trading full-time and founded Physik Invest to detail his methods, research, and performance in the markets.
Additionally, Capelj is a Benzinga finance and technology reporter interviewing the likes of Shark Tank’s Kevin O’Leary, JC2 Ventures’ John Chambers, and ARK Invest’s Catherine Wood, as well as a SpotGamma contributor, helping develop insights around impactful options market dynamics.
Disclaimer
At this time, Physik Invest does not carry the right to provide advice. In no way should the materials herein be construed as advice. Derivatives carry a substantial risk of loss. All content is for informational purposes only.
Led by the Russell 2000, overnight, equity index futures continued higher while commodities were mixed and bonds were a touch lower. Friday, December 24, markets are closed.
Pursuant to comments made earlier this week, volatility was sold aggressively; the CBOE Volatility Index (INDEX: VIX) dropped ~9.00. This coincides with a compression in the VIX’s term structure, and that has so-called bullish/supportive implications.
Ahead is data on jobless claims, personal income, consumer spending, inflation, disposable income, goods orders (8:30 AM ET), as well as new home sales, University of Michigan sentiment, and five-year inflation expectations (10:00 AM ET).
Graphic updated 6:40 AM ET. Sentiment Risk-On if expected /ES open is above the prior day’s range. /ES levels are derived from the profile graphic at the bottom of the following section. Levels may have changed since initially quoted; click here for the latest levels. SqueezeMetrics Dark Pool Index (DIX) and Gamma (GEX) calculations are based on where the prior day’s reading falls with respect to the MAX and MIN of all occurrences available. A higher DIX is bullish. At the same time, the lower the GEX, the more (expected) volatility. Learn the implications of volatility, direction, and moneyness. SHIFT data used for S&P 500 (INDEX: SPX) options activity. Note that options flow is sorted by the call premium spent; if more positive then more was spent on call options. Breadth reflects a reading of the prior day’s NYSE Advance/Decline indicator. VIX reflects a current reading of the CBOE Volatility Index (INDEX: VIX) from 0-100.
What To Expect
On lackluster intraday breadth and divergent market liquidity metrics, the best case outcome occurred, via the S&P 500’s spike close higher, away from intraday value, the levels at which participants found it most favorable to transact.
This activity, which marks the continuation of an earlier trend change, is built on poor structure.
That, ultimately, adds to technical instability.
Why?If you haven’t noticed, the levels quoted daily in this particular commentary seem to be holding to the tick. Given the persistence of mechanical responses to key technical levels, visually-driven, weaker-handed participants (which seldom bear the wherewithal to defend retests) carry a heavier hand in recent price discovery.
Via volume profile analysis, we see a plethora of low-volume pockets – voids, if you will – that likely hold virgin tests. As stated, yesterday, successful penetration portends follow-through given the participants that were most active at those technical levels. Caution is warranted.
Graphic: Divergent delta (i.e., non-committed buying as measured by volume delta or buying and selling power as calculated by the difference in volume traded at the bid and offer) in SPDR S&P 500 ETF Trust (NYSE: SPY), one of the largest ETFs that track the S&P 500 index, via Bookmap. The readings are supportive of responsive trade (i.e., rotational trade that suggests current prices offer favorable entry and exit; the market is in balance).
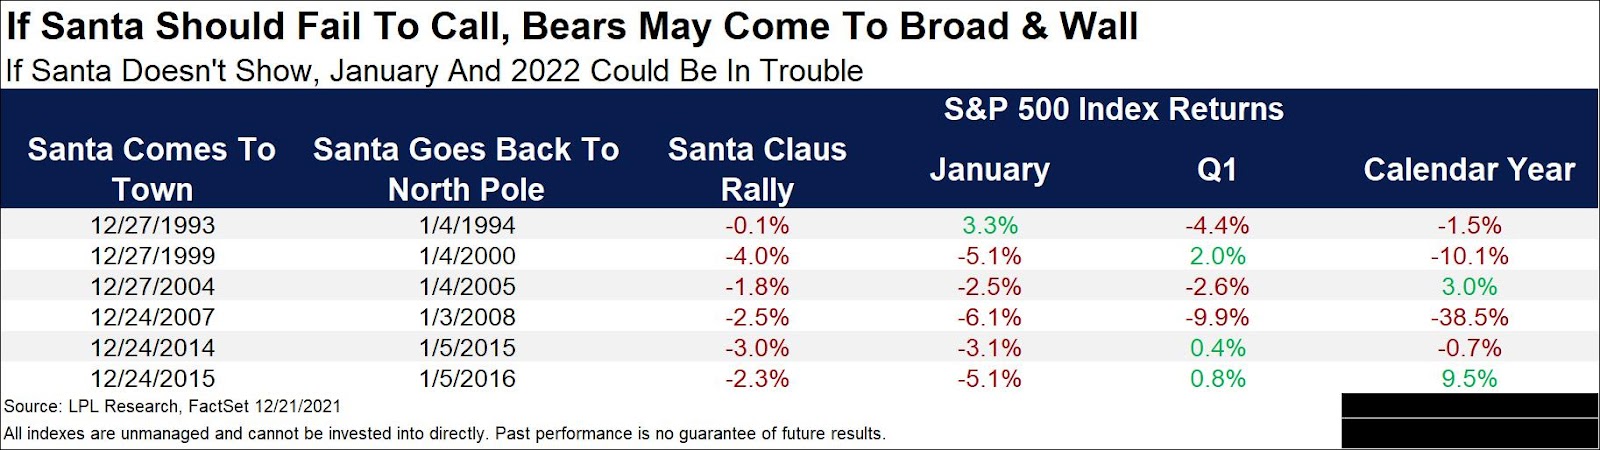
Context: According to Ryan Detrick of LPL Financial, the “official Santa Claus Rally starts this Monday (last 5 days of the year and the first two of the following year).”
The 7 days (after this Monday) are up nearly 79% of the time.
However, in the past 5 occurrences, “Jan was also in the red and Q1 been weak as well.”
Graphic: LPL Financial on the so-called Santa Claus rally.
This activity comes after last week’s weighty “quad-witching” and ahead of the December “Quarterlys” expiry.
The exposure that rolled (and is to roll) off was “put-heavy.”
Participants’ commitment to capital at strikes lower in price and out in time – in the face of weak breadth and bearish fundamental developments – in single stocks, fed into the indices, also.
According to SpotGamma, the December 17 expiration cleared quite a bit of negative delta (e.g., the ARK Innovation ETF [NYSE: ARKK] had $1.5 billion in notional put delta expire).
This opened a window of strength and realized volatility, wherein positive fundamental forces and dealers’ covering of hedges could bolster any recovery.
Its often positioning – particularly around OPEX that drives price.
So, it is this week’s collapse in implied volatility (and associated collapse in term structure), coupled with the pending management of large S&P positions, and relentless, seasonally-aligned “passive buying support,” which brought positive flows bolstering this “Santa Claus rally.”
Graphic: Shift Search data suggests participants are likely initiating box spreads and rolling their call exposure out in time (as much as 6 months).
Notwithstanding, as mentioned, yesterday, Goldman Sachs Group (NYSE: GS) saw “options selling strategies as attractive in the near term,” estimating “a 12% probability of a 1-month 5% down-move in the SPX in this economic environment based on [the] GS-EQMOVE model.”
“Options are pricing a 22% probability of that size move indicating that puts are overvalued.”
As noted Tuesday, the commitment of capital on lower volatility results in counterparties taking on more exposure to positive gamma. The growth in positive gamma (as the data is showing) will be offset through the dealers’ supply of liquidity, pressuring the price discovery process.
Note: As a position’s delta rises with stock or index price rises, gamma (or how an option’s delta is expected to change given a change in the underlying) is added to the delta.
This is while many products are in lower liquidity and short-gamma (wherein an options delta decreases with stock prices rises and increases when stock prices drop) in which moves are more erratic.
Therefore, coming into weighty options expirations, correlations may be off (as that is the only reconciliation in an environment where, at the index level, hedging pressures are sticky, whereas elsewhere they aren’t).
Thereafter, participants ought to monitor the sides and levels capital is committed for clues as to where we go next. Continued compression of volatility, as well as a commitment to options higher in prices and further out in time, supports upward price discovery.
Graphic: Via The Market Ear, “There have been five prior years since 1953 (when we went to the 5-day trading week) that have seen December as the most volatile month: 1973, 1978, 1985, 1995, and 2018. The January following these five prior years was BIG positive four out of five times, with January 2019 seeing the biggest gain.”
Weakness (alongside a commitment to strikes lower in price and out in time) likely sets the market up for another round of instability, as realized in late November and early December.
Graphic: A compression in the VIX term structure would provide markets with a boost.
Expectations: As of 6:30 AM ET, Thursday’s regular session (9:30 AM – 4:00 PM ET), in the S&P 500, will likely open in the upper part of a positively skewed overnight inventory, outside of prior-range and -value, suggesting a potential for immediate directional opportunity.
Spike Rules In Play: Spike’s mark the beginning of a break from value. Spikes higher (lower) are validated by trade at or above (below) the spike base (i.e., the origin of the spike).

The spike base is $4,678.50. Below bearish (change in tone). Above bullish (status quo).
In the best case, the S&P 500 trades sideways or higher; activity above the $4,690.75 micro composite point of control (MCPOC) puts in play the $4,709.00 untested point of control (VPOC). Initiative trade beyond the VPOC could reach as high as the $4,732.50 high volume area (HVNode) and $4,743.00 regular trade high (RTH High), or higher.
In the worst case, the S&P 500 trades lower; activity below the $4,690.25 MCPOC puts in play the $4,673.00 VPOC. Initiative trade beyond the VPOC could reach as low as the $4,647.25 HVNode and $4,623.00 POC, or lower.
Click here to load today’s key levels into the web-based TradingView charting platform. Note that all levels are derived using the 65-minute timeframe. New links are produced, daily.
Graphic: 65-minute profile chart of the Micro E-mini S&P 500 Futures. Learn about the profile.
Definitions
Volume Areas: A structurally sound market will build on areas of high volume (HVNodes). Should the market trend for long periods of time, it will lack sound structure, identified as low volume areas (LVNodes). LVNodes denote directional conviction and ought to offer support on any test.
If participants were to auction and find acceptance into areas of prior low volume (LVNodes), then future discovery ought to be volatile and quick as participants look to HVNodes for favorable entry or exit.
POCs: POCs are valuable as they denote areas where two-sided trade was most prevalent in a prior day session. Participants will respond to future tests of value as they offer favorable entry and exit.
MCPOCs: POCs are valuable as they denote areas where two-sided trade was most prevalent over numerous day sessions. Participants will respond to future tests of value as they offer favorable entry and exit.
Significance Of Prior ATHs, ATLs: Prices often encounter resistance (support) at prior highs (lows) due to the supply (demand) of old business. These areas take time to resolve. Breaking and establishing value (i.e., trading more than 30-minutes beyond this level) portends continuation.
Price Discovery (One-Timeframe Or Trend): Elongation and range expansion denotes a market seeking new prices to establish value, or acceptance (i.e., more than 30-minutes of trade at a particular price level).
Volume-Weighted Average Prices (VWAPs): A metric highly regarded by chief investment officers, among other participants, for quality of trade. Additionally, liquidity algorithms are benchmarked and programmed to buy and sell around VWAPs.
About
After years of self-education, strategy development, and trial-and-error, Renato Leonard Capelj began trading full-time and founded Physik Invest to detail his methods, research, and performance in the markets.
Additionally, Capelj is a Benzinga finance and technology reporter interviewing the likes of Shark Tank’s Kevin O’Leary, JC2 Ventures’ John Chambers, and ARK Invest’s Catherine Wood, as well as a SpotGamma contributor, helping develop insights around impactful options market dynamics.
Disclaimer
At this time, Physik Invest does not carry the right to provide advice. In no way should the materials herein be construed as advice. Derivatives carry a substantial risk of loss. All content is for informational purposes only.
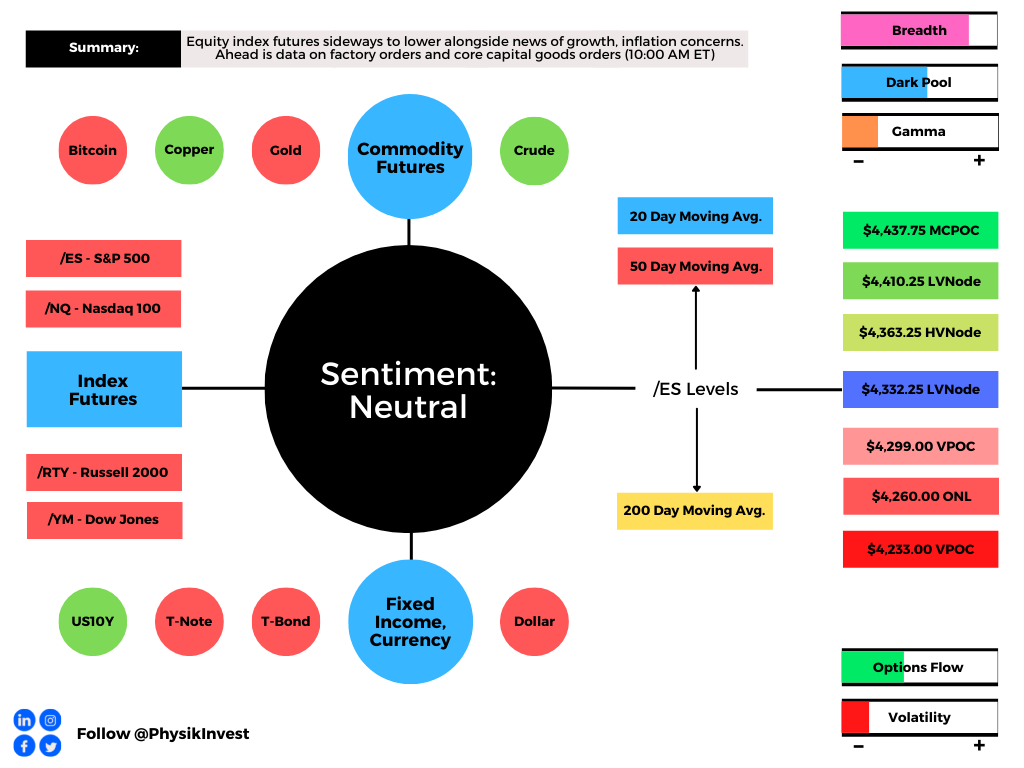
Equity index futures were sideways to lower with bonds and the dollar.
Nordea: Macro backdrop worsens.
Ahead is a relatively light calendar.
October is volatile while Q4 bullish.
What Happened: U.S. stock index futures auctioned sideways to lower overnight alongside reports that China was showing little interest in a direct bailout of Evergrande and U.S. political leaders remain at odds on the debt limit.
Ahead is data on factory orders and core capital goods orders (10:00 AM ET).
Graphic updated 6:30 AM ET. Sentiment Neutral if expected /ES open is inside of the prior day’s range. /ES levels are derived from the profile graphic at the bottom of the following section. SqueezeMetrics Dark Pool Index (DIX) and Gamma (GEX) calculations are based on where the prior day’s reading falls with respect to the MAX and MIN of all occurrences available. A higher DIX is bullish. At the same time, the lower the GEX, the more (expected) volatility. SHIFT data used for S&P 500 (INDEX: SPX) options activity. Note that options flow is sorted by the call premium spent; if more positive then more was spent on call options. Breadth reflects a reading of the prior day’s NYSE Advance/Decline indicator. VIX reflects a current reading of the CBOE Volatility Index (INDEX: VIX) from 0-100.
What To Expect: As of 6:30 AM ET, Monday’s regular session (9:30 AM – 4:00 PM EST) in the S&P 500 will likely open inside of prior-range and -value, suggesting a limited potential for immediate directional opportunity.
Adding, during the prior day’s regular trade, on a strengthening of intraday breadth, among other metrics including positioning measures, the best case outcome occurred, evidenced by a recovery of Thursday’s $4,365.00 untested point of control (VPOC).
Given the overnight response at the top of Friday’s value area – the bulk of where trade was conducted – it looks as though participants are interested in slowing the pace of downside discovery.
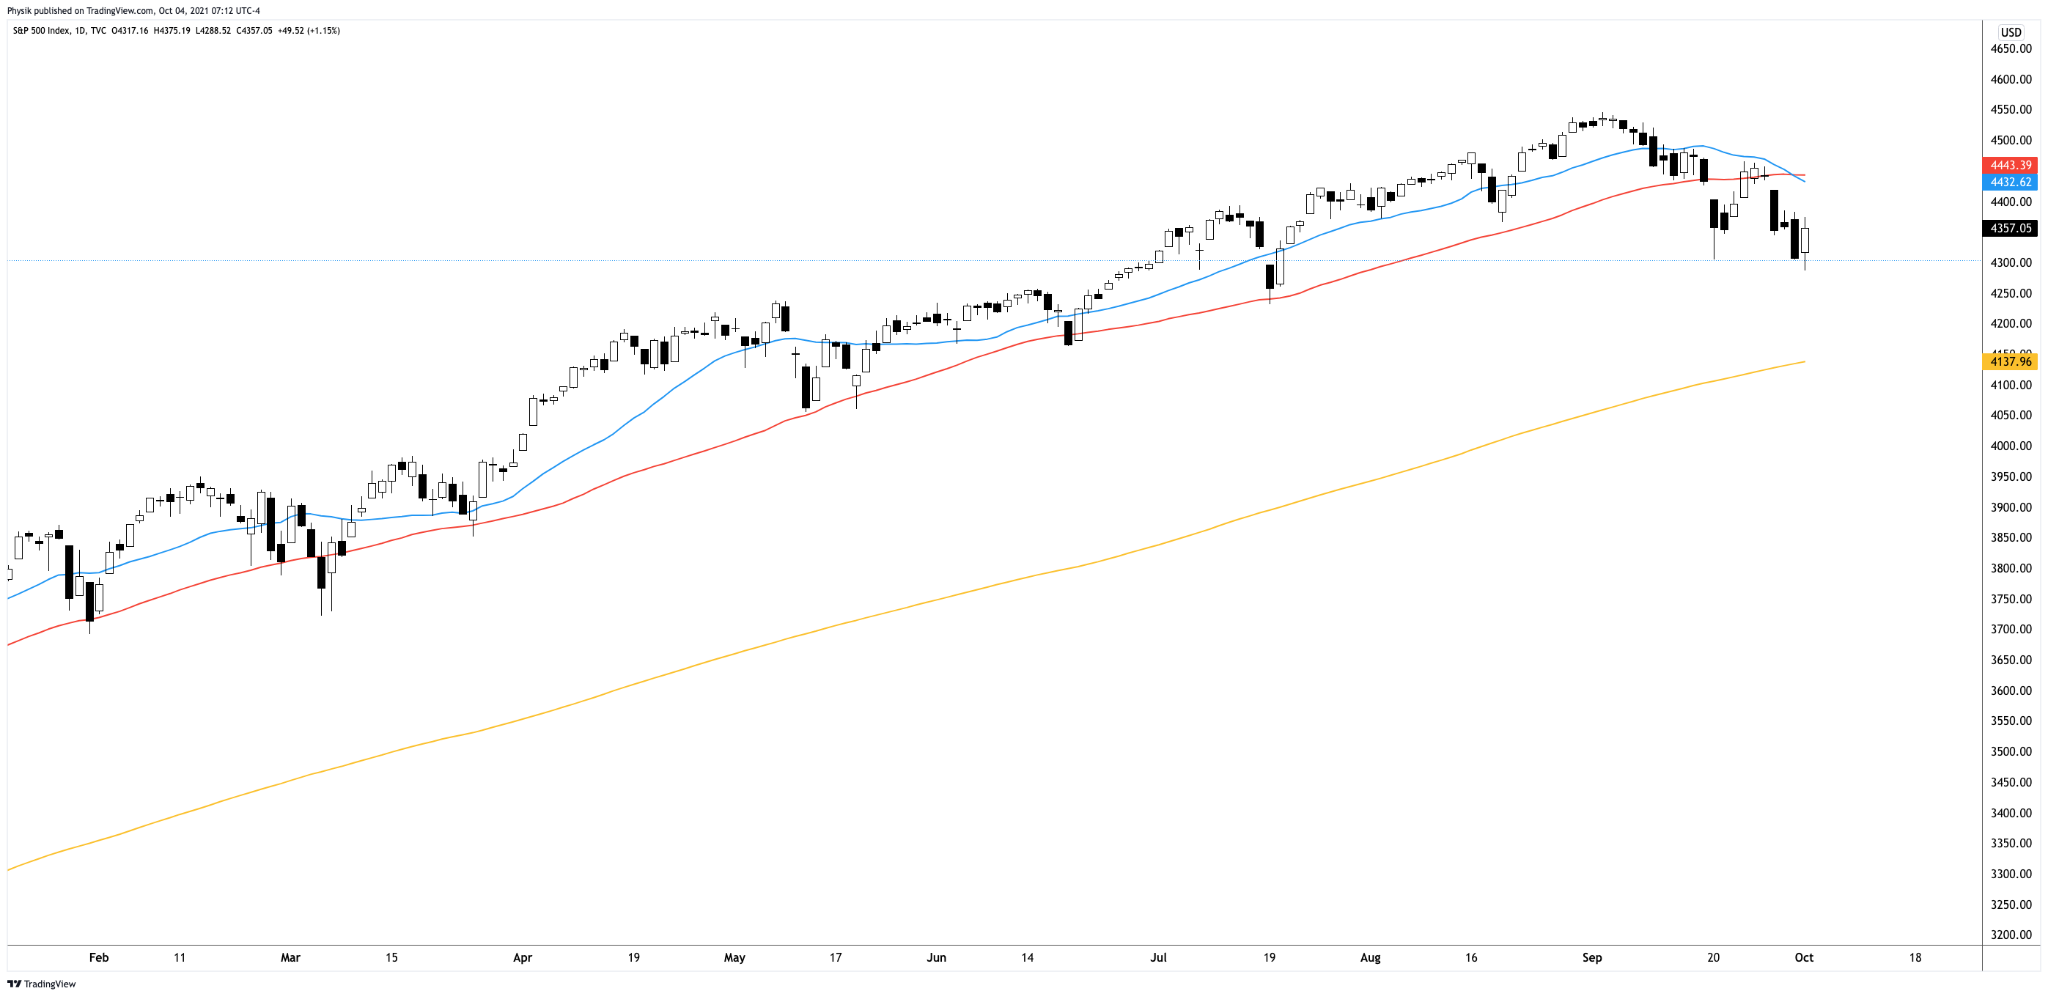
Still, the S&P 500 is well below its 20- and 50-day simple moving averages and multiple distribution profile structures denote emotion, as well as a lack of commitment.
Graphic: S&P 500 daily chart with 20-, 50-, and 200-day simple moving average.
Further, the aforementioned trade is happening in the context of a traditionally volatile October and a fraying in the buy-the-dip psychology.
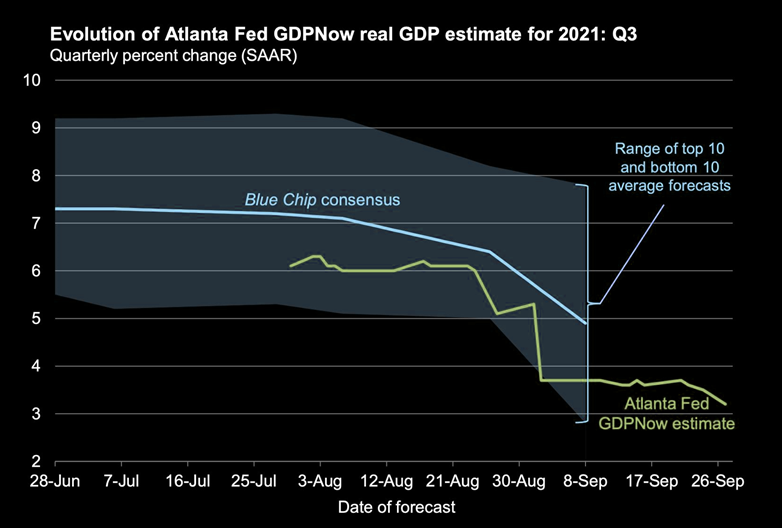
According to Nordea, despite a calm, upward-sloping term structure, there has been “a slightly upward tilting trend” in futures tracking the S&P 500 volatility index, likely warranted by several macro reasons including a worsening in liquidity, a slowdown in growth, cost/margin problems, and risks to the Fed put.
Graphic: Fed’s GDPNow estimate lowers expectations for U.S. economic growth, via The Market Ear.
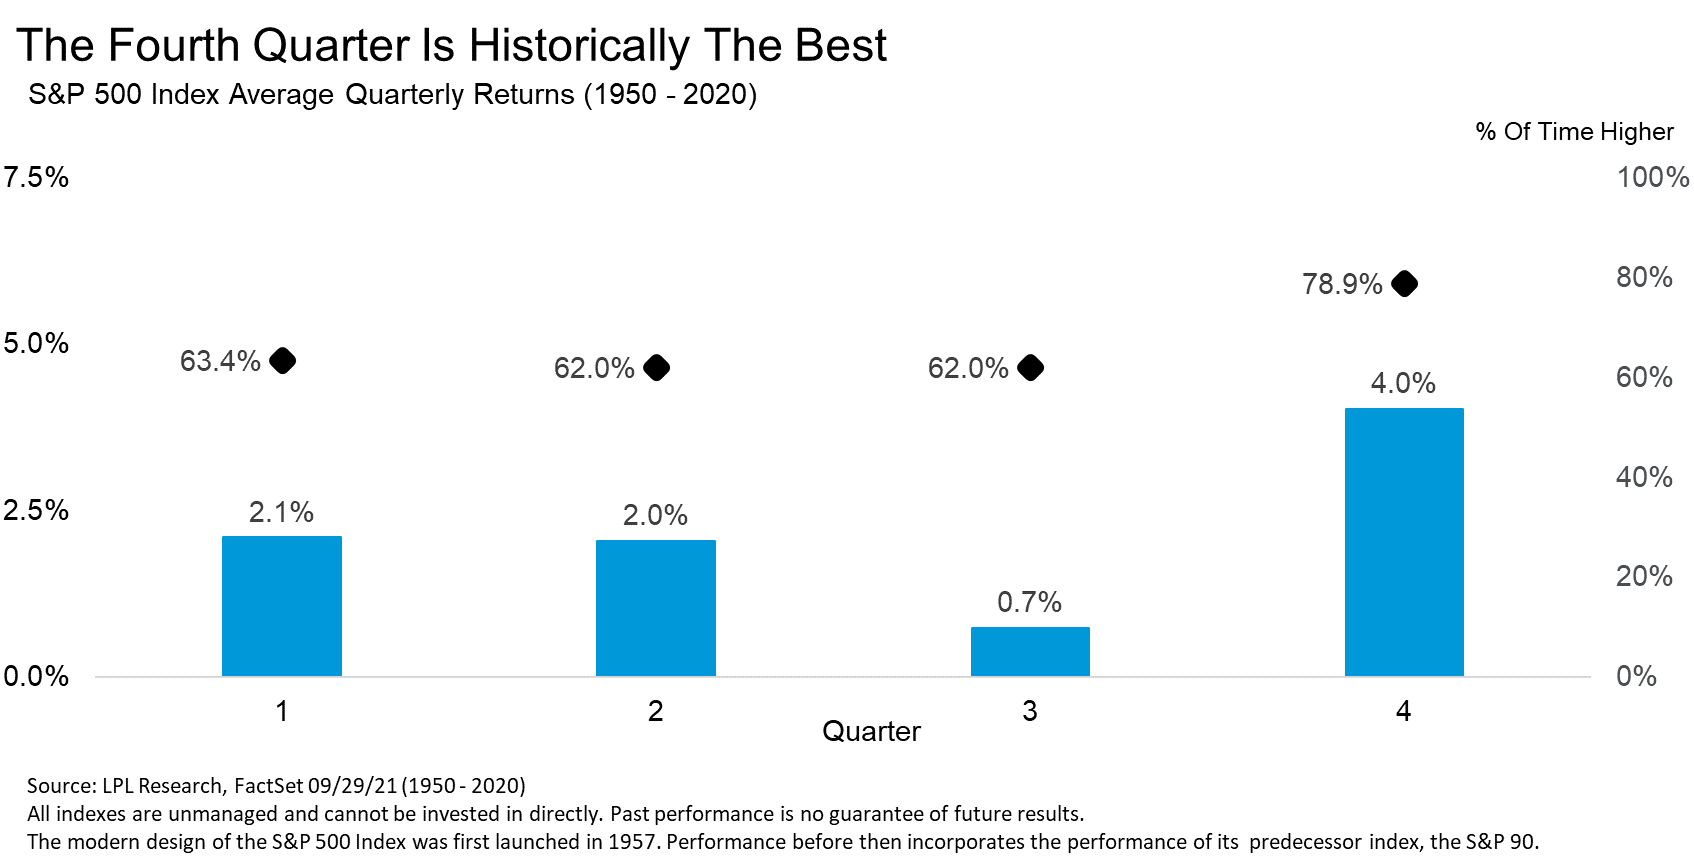
LPL Research adds that aside from October, no other month has seen more 1% moves, and the fourth quarter is “historically the best for stocks, with the third quarter the worst.”
Graphic: LPL Research unpacks S&P 500 seasonality.
Moreover, for today, given expectations of heightened volatility, participants may make use of the following frameworks.
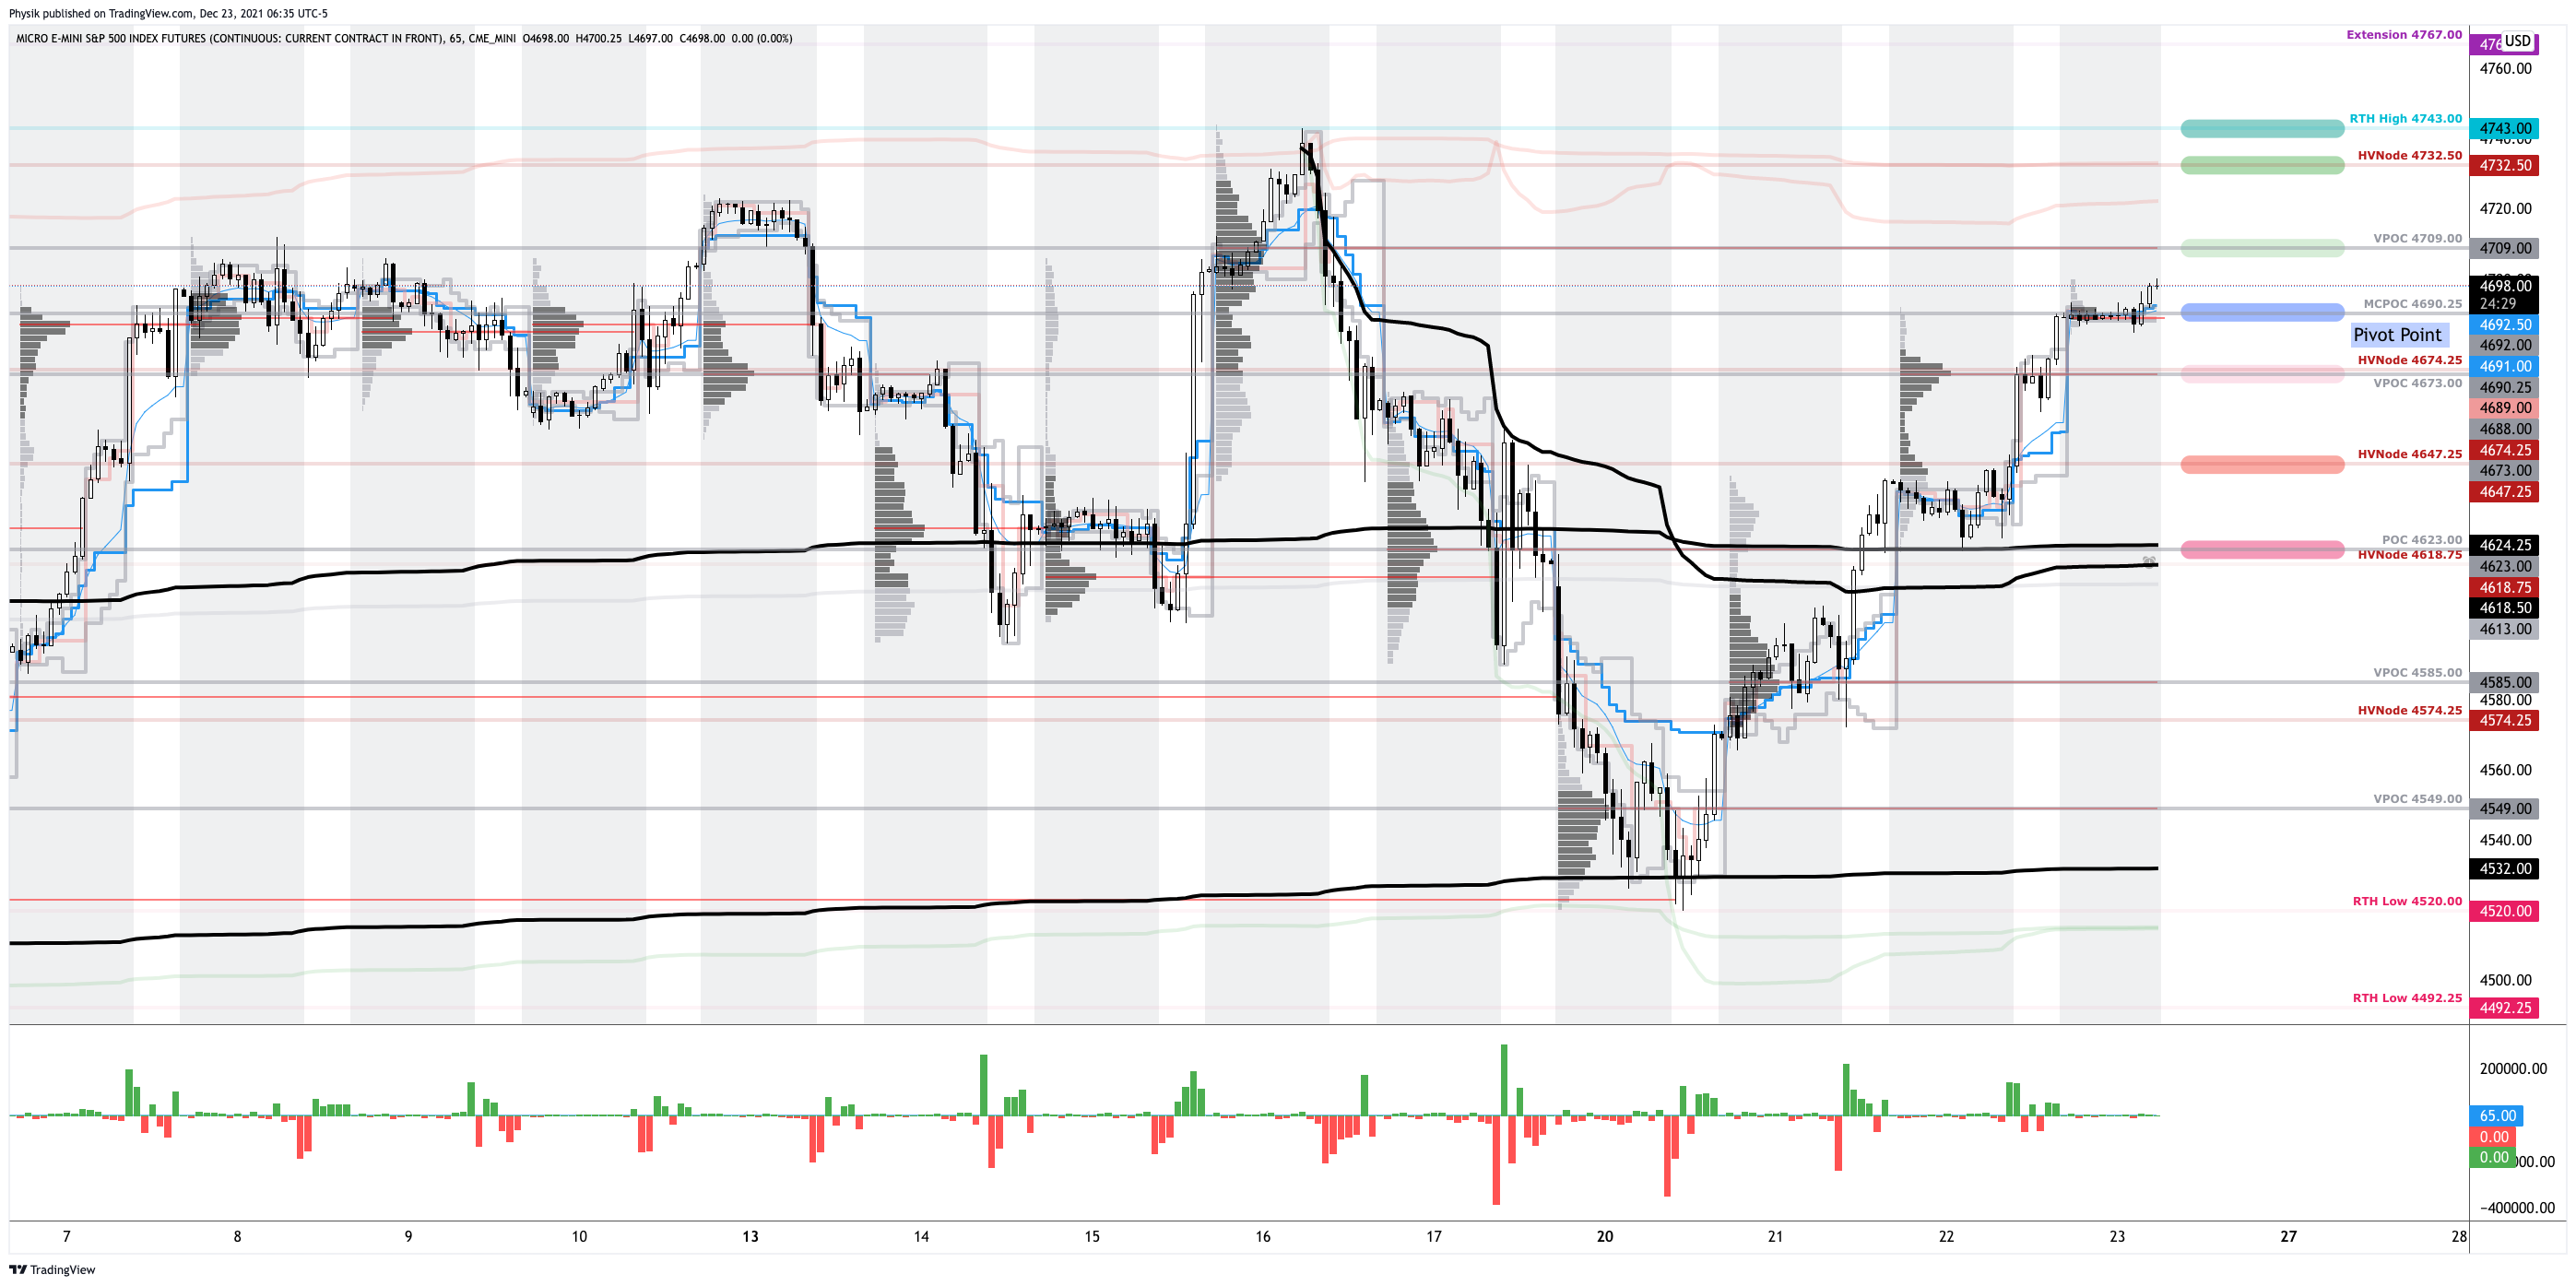
In the best case, the S&P 500 trades sideways or higher; activity above the $4,332.25 low volume area (LVNode) puts in play the $4,363.25 high volume area (HVNode). Initiative trade beyond the HVNode could reach as high as the $4,410.25 LVNode and $4,437.75 micro composite point of control (MCPOC), or higher.
In the worst case, the S&P 500 trades lower; activity below the $4,332.25 LVNode puts in play the $4,299.00 VPOC. Initiative trade beyond the VPOC could reach as low as $4,260.00 overnight low (ONL) and $4,233.00 VPOC, or lower.
Graphic: 65-minute profile chart of the Micro E-mini S&P 500 Futures updated 6:30 AM ET.
Definitions
Overnight Rally Highs (Lows): Typically, there is a low historical probability associated with overnight rally-highs (lows) ending the upside (downside) discovery process.

Volume Areas: A structurally sound market will build on areas of high volume (HVNodes). Should the market trend for long periods of time, it will lack sound structure, identified as low volume areas (LVNodes). LVNodes denote directional conviction and ought to offer support on any test.

If participants were to auction and find acceptance into areas of prior low volume (LVNodes), then future discovery ought to be volatile and quick as participants look to HVNodes for favorable entry or exit.

POCs: POCs are valuable as they denote areas where two-sided trade was most prevalent in a prior day session. Participants will respond to future tests of value as they offer favorable entry and exit.

MCPOCs: POCs are valuable as they denote areas where two-sided trade was most prevalent over numerous day sessions. Participants will respond to future tests of value as they offer favorable entry and exit.

Responsive Buying (Selling): Buying (selling) in response to prices below (above) an area of recent price acceptance.

Price Discovery (One-Timeframe Or Trend): Elongation and range expansion denotes a market seeking new prices to establish value, or acceptance (i.e., more than 30-minutes of trade at a particular price level).
After years of self-education, strategy development, and trial-and-error, Renato Leonard Capelj began trading full-time and founded Physik Invest to detail his methods, research, and performance in the markets.
Additionally, Capelj is a finance and technology reporter. Some of his biggest works include interviews with leaders such as John Chambers, founder and CEO, JC2 Ventures, Kevin O’Leary, businessman and Shark Tank host, Catherine Wood, CEO and CIO, ARK Invest, among others.
Disclaimer
At this time, Physik Invest does not manage outside capital and is not licensed. In no way should the materials herein be construed as advice. Derivatives carry a substantial risk of loss. All content is for informational purposes only.
What Happened: U.S. stock index futures closed higher, last week.
This came alongside (1) the enactment of a massive, $1.9 trillion coronavirus relief plan, (2) convergence in the 10-year Treasury rate and S&P 500 dividend yield, as well as (3) a material divergence in bond and equity market volatility.
What Does It Mean: The pandemic disrupted the global economy, hitting the hardest airlines, leisure facilities, energy, manufacturing, and restaurants, among other industries.
The stock market tumbled, as a result, and the subsequent recovery was lead by technology, which delivered its strongest annual average return since the Global Financial Crisis (GFC).
Now, as virus case counts fall, the pace of vaccinations accelerates, and massive coronavirus relief bills are passed, shares of stocks in beaten-down industries are becoming favorites.
This reopening trade, as it’s called, comes alongside projections the U.S. will lead the 2021 global economic recovery.
Amidst the bullishness, the yield on a 10-year Treasury, a risk-free asset, which was — per Axios — “artificially depressed by the flight-to-quality trade during the coronavirus pandemic, as well as by large-scale purchases by the Federal Reserve,” converged with S&P 500’s dividend yield.
Graphic 1: Goldman Sachs Group Inc (NYSE: GS) projects yields to rise and the curve to steepen.
Typically, the S&P 500’s dividend yield is less than the risk-free rate because investors expect to earn less in dividends than they would holding the same amount in bonds, absent rising stock prices.
Values are derived using the discounted cash flow calculation; as interest and discount rates go up, the present value of future earnings goes down, which will drag stock prices, especially in growth categories, as evidenced by the Nasdaq-100’s relative weakness.
Graphic 2: Nordea Group expects inflation to print above the Federal Reserve’s target, soon.
Still, historically speaking, rising yields aren’t that harmful. Looking as far back as the 1960s, there are 13 periods in which the yield on a 10-year Treasury rose by at least 1.5%.
“In nearly 80% (10 of 13) of the prior periods, the S&P 500 Index posted gains as rates rose, as it has so far in the current rising-rate period,” a statement by LPL Financial said. “In fact, the average yearly gain for the index during the previous rising-rate periods, at 6.4%, is just a little lower than the historical average over the entire period of 7.1%, while rising rates have been particularly bullish for stocks since the mid-1990s.”
Further, despite an attempted pricing in of rising debt levels and inflation, a divergence in bond and equity market volatility persists.
Historically, fear across markets tends to move in tandem. That’s not the case today.
Graphic 3: Divergence in volatility across the bond and equity market.
What To Expect: Balance, or two-sided trade as participants look for more information to base their next move on after last week’s rapid recovery.
Coming into the weekend, market liquidity suggested (1) buying pressure was leveling out and/or (2) buyers were absorbing resting liquidity (opportunistic selling or selling into strength), while speculative options activity was concentrated on the put-side.
Graphic 4: Physik Invest maps out the purchase of call and put options in the SPDR S&P 500 ETF Trust (NYSE: SPY), for the week ending March 12, 2021. Activity in the options market was primarily concentrated in short- and long-dated tenors, in strikes as low as $353, which corresponds with $3,530.00 in the cash-settled S&P 500 Index (INDEX: SPX).
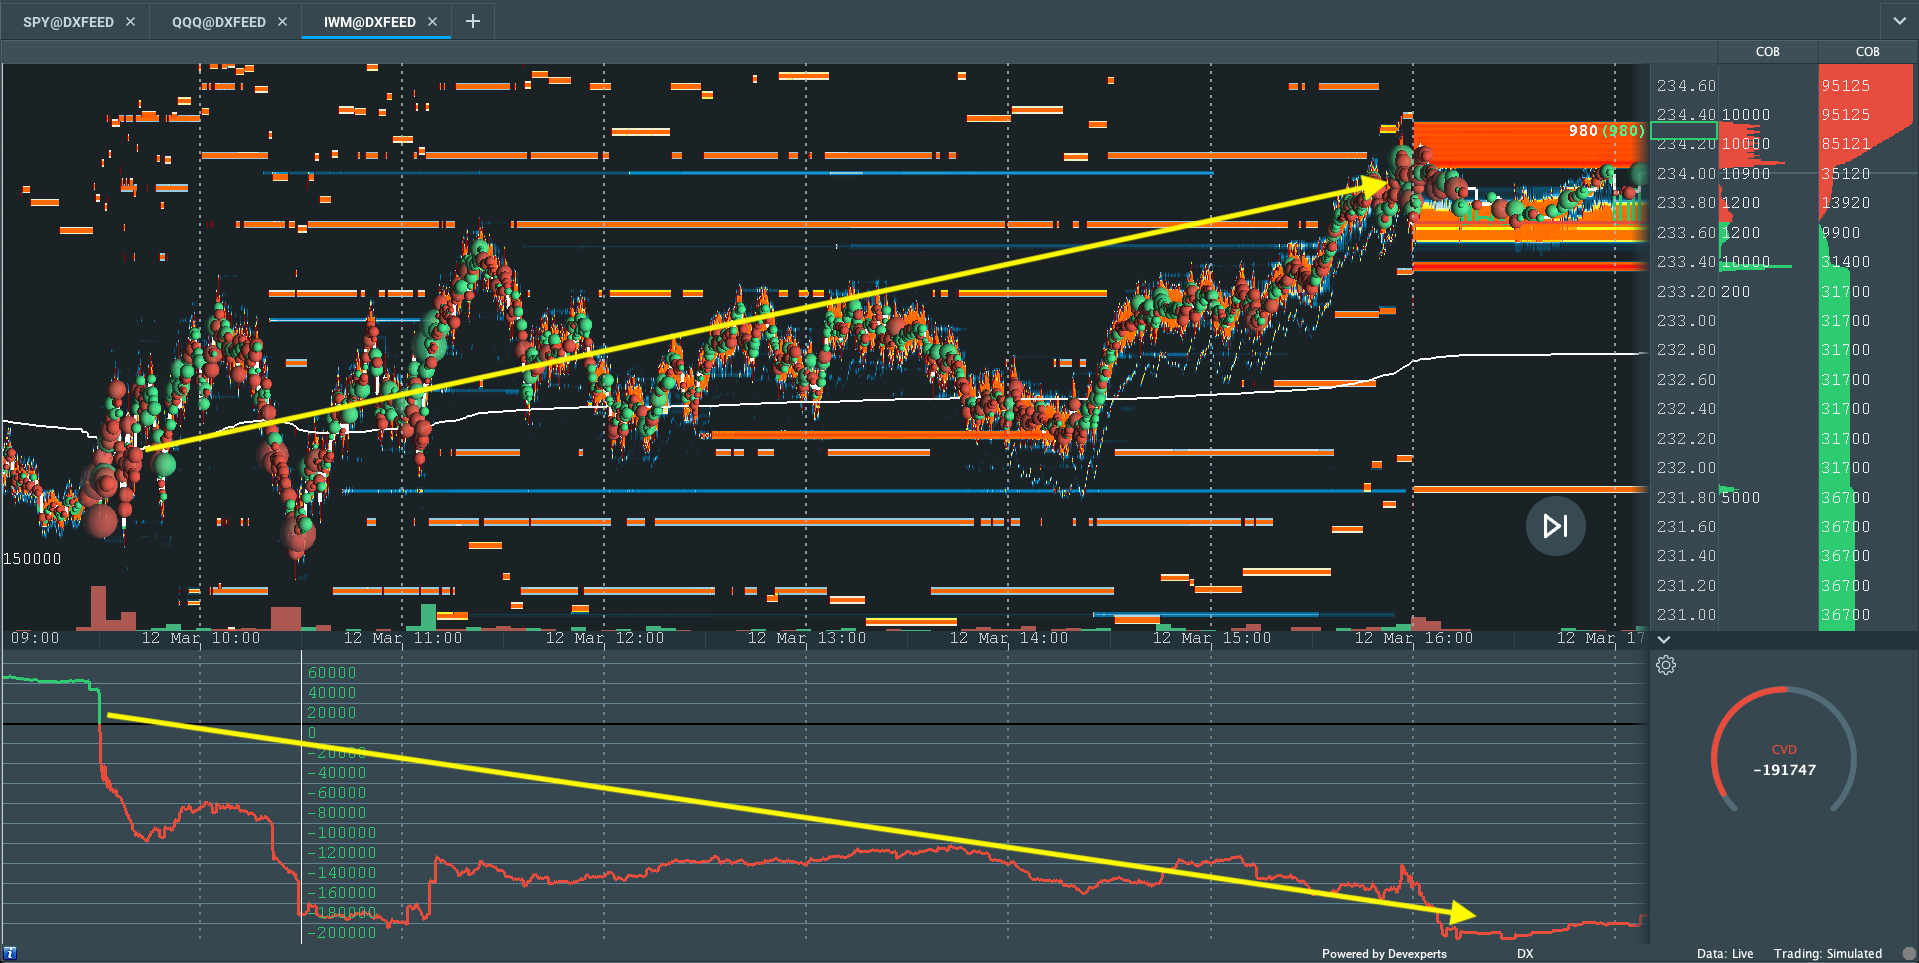
IWM Market Liquidity
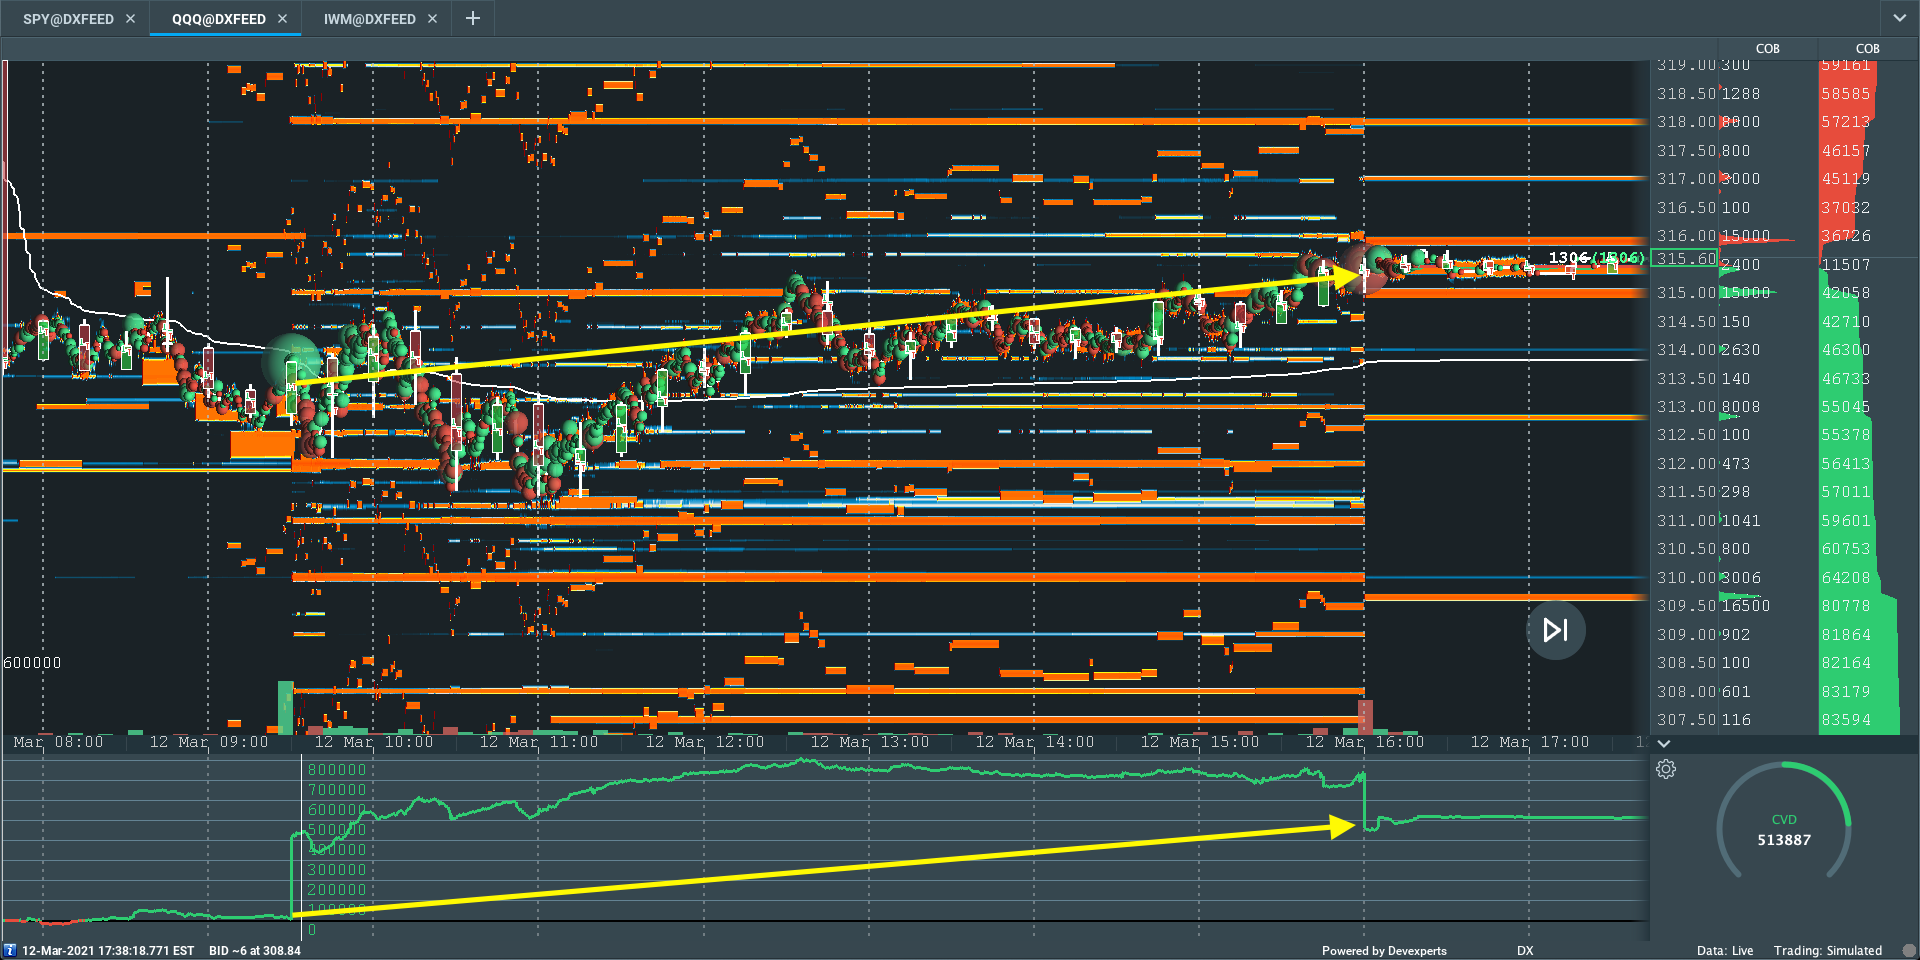
QQQ Market Liquidity
SPY Market Liquidity
What To Do:In the coming sessions, participants will want to pay attention to the VWAP anchored from the $3,959.25 overnight rally-high, as well as the $3,840.00 high-volume area (HVNode).
Volume-Weighted Average Prices (VWAPs): Metrics highly regarded by chief investment officers, among other participants, for quality of trade. Additionally, liquidity algorithms are benchmarked and programmed to buy and sell around VWAPs.More On Volume Areas: A structurally sound market will build on past areas of high-volume (HVNode). Should the market trend for long periods of time, it will lack sound structure (identified as a low-volume area (LVNode) which denotes directional conviction and ought to offer support on any test).
If participants were to auction and find acceptance into areas of prior low-volume, then future discovery ought to be volatile and quick as participants look to areas of high-volume for favorable entry or exit.More On Overnight Rally Highs (Lows): Typically, there is a low historical probability associated with overnight rally-highs (lows) ending the upside (downside) discovery process.
In the best case, the S&P 500 remains above the $3,840.00 volume area, and VWAP anchored from the $3,959.25 peak. This would suggest buyers, on average, are in control and winning since the February 15 rally-high.
Any activity below the VWAP anchored from the $3,959.25 peak may (1) leave the $3,840.00 HVNode as an area of supply, offering initiative sellers favorable entry and responsive buyers favorable exit.
Graphic 5: Profile overlays on a 30-minute candlestick chart of the Micro E-mini S&P 500 Futures.Graphic 6: 4-hour profile chart of the Micro E-mini S&P 500 Futures.
Conclusions: The go/no-go level for next week’s trade is $3,840.00.
Any activity at this level suggests market participants are looking for more information to base their next move. Anything above (below) this level increases the potential for higher (lower).
Notice: To view this week’s big picture outlook, click here.
What Happened: As President Donald Trump moved to sign into law a $2.3 trillion pandemic aid bill, U.S. index futures auctioned to record highs.
What Does It Mean: Friday’s session found responsive selling surface near the $3,691.00 S&P 500 profile level. Since then, participants initiated past the level with conviction, and took out the $3,724.25 prior all-time high, before auctioning back into range and finding acceptance near $3,720.00.
What To Expect: The low-volume area (marked as the LVNode at $3,711.50) is representative of upside conviction after a break of the $3,691.00 boundary. This same low-volume area should offer support on a future test. Acceptance within the low-volume area, beneath $3,711.50, may portend a test of the $3,691.00 break point. Auctioning beneath the breakpoint would be the most negative outcome, negating the transition from balance to trend.
Noting: In most cases, a break-out (i.e., gap or auction failure) from balance is usually the start of a short-term auction. Therefore, placing trades in the direction of the gap is the normal course of action. Further, gaps tend to fill within the first half-hour of regular trade (9:30 AM – 4:00 PM ET). The longer a gap holds, however, the higher odds of continuation. Should responsive sellers auction through the entire gap, then conditions have changed.
Adding, the days leading up to the New Year, after Christmas, are historically bullish, dubbed the Santa Claus Rally. Here’s an excerpt from a Yahoo Finance article on the topic:
“Well, there isn’t a single seven-day combo out of the full year that is more likely to be higher than the 77.9% of the time higher we’ve seen previously during the Santa Claus Rally,” LPL Financial’s analysts observed after analyzing data going back to 1950. “Additionally, these seven days are up an average of 1.33%, which is the second-best seven-day combo of the year.“
Levels Of Interest: $3,711.50 LVNode and $3,726.50 all-time overnight high. Today’s go/no-go level in the S&P 500 is $3,691.00; remaining above is bullish.