The Daily Brief is a free glimpse into the prevailing fundamental and technical drivers of U.S. equity market products. Join the 200+ that read this report daily, below!
What Happened
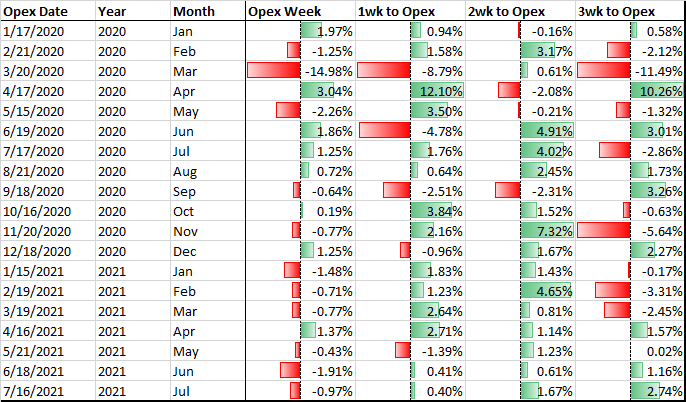
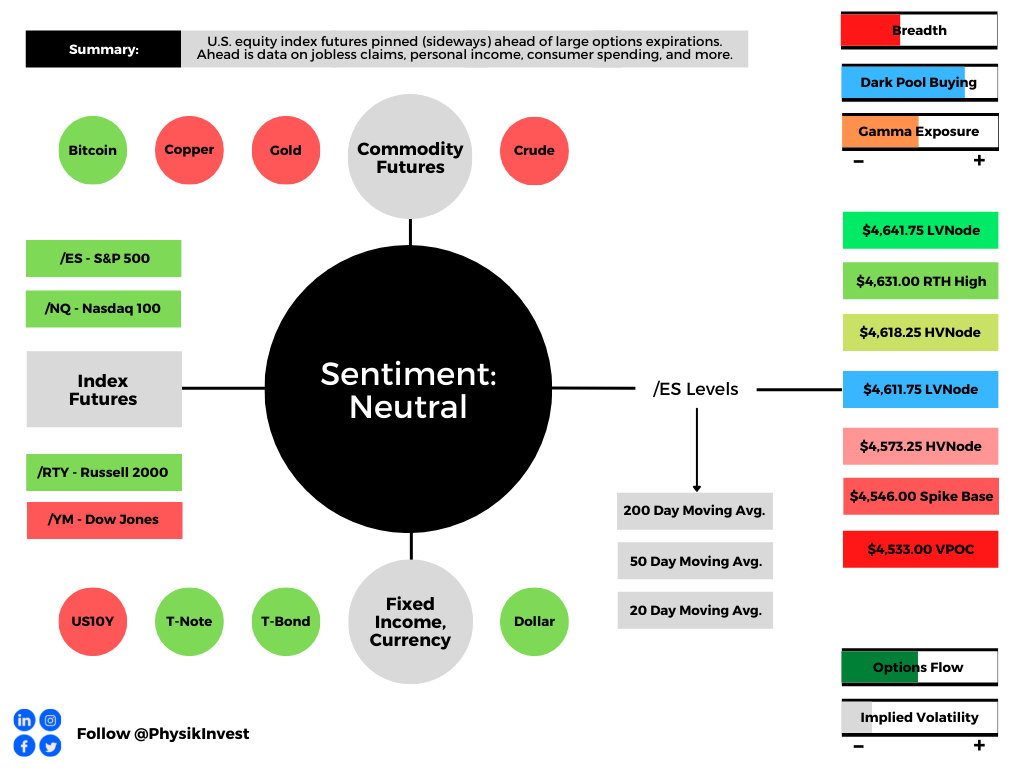
A mixed bag, overnight, with U.S. equity indexes pinned at their most recent swing highs ahead of large options expirations (OPEX).
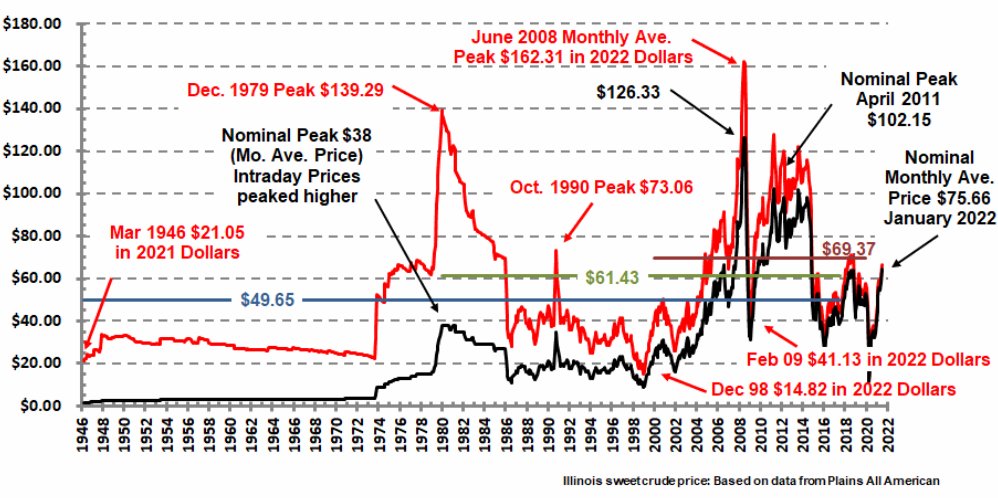
News, too, was mixed. Notable was the United States’ potential release of oil reserves amounting to nearly a million extra barrels of oil a day. Oil sold alongside this update.
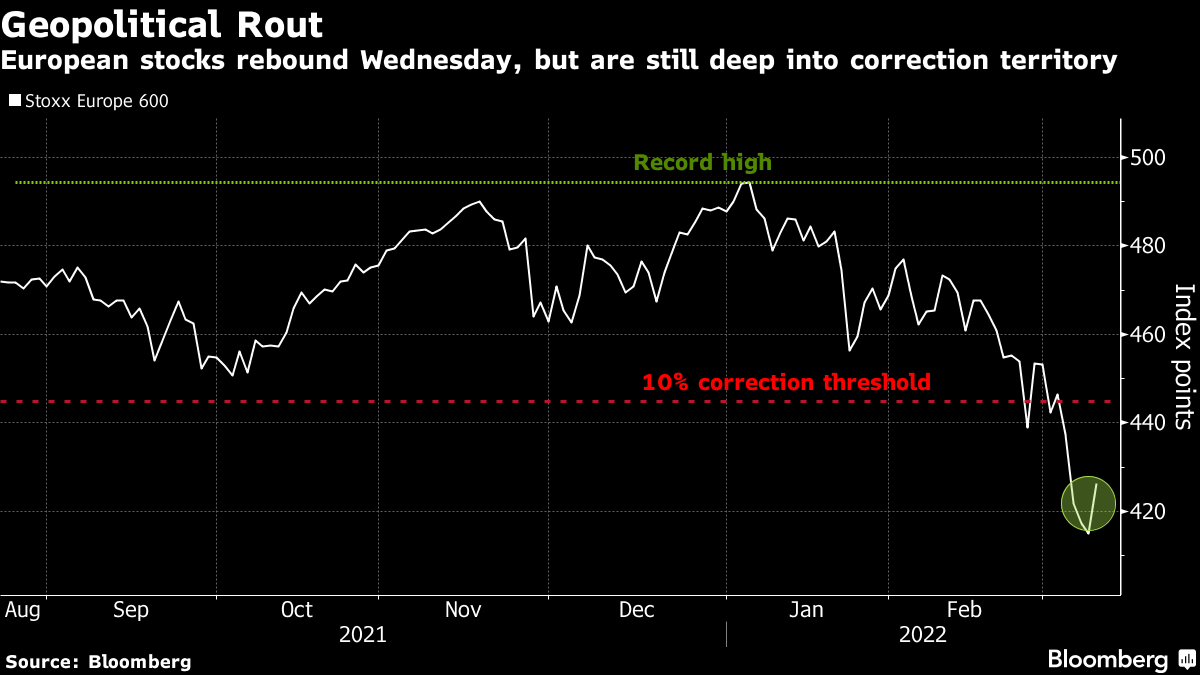
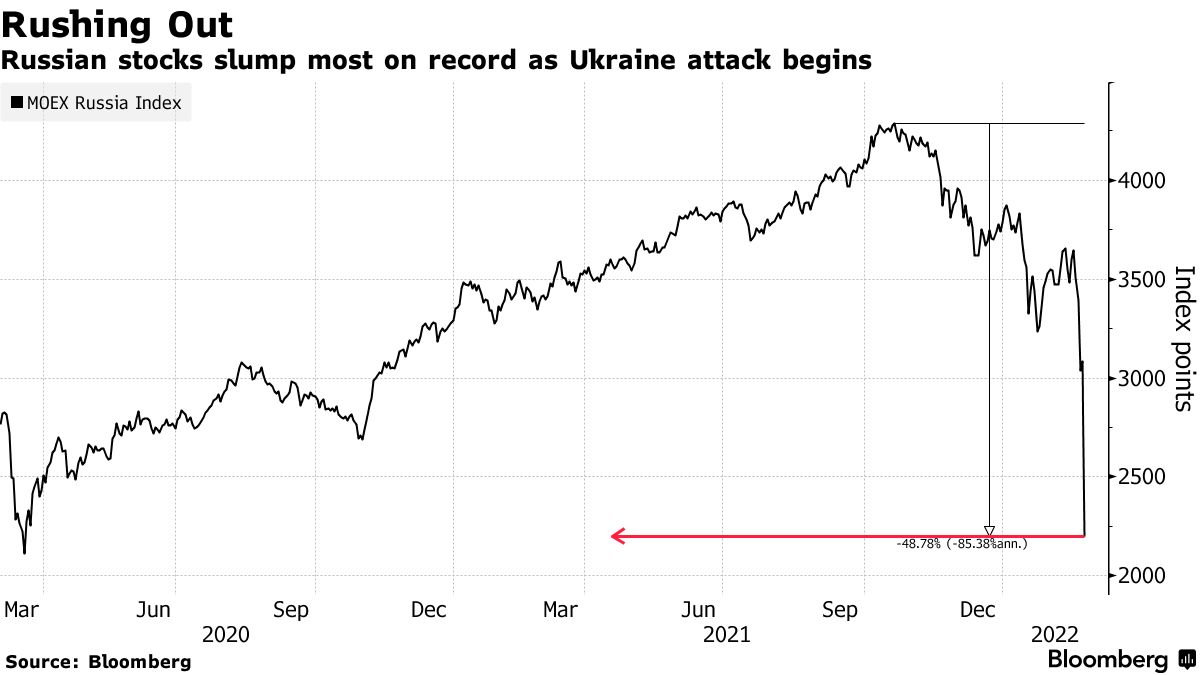
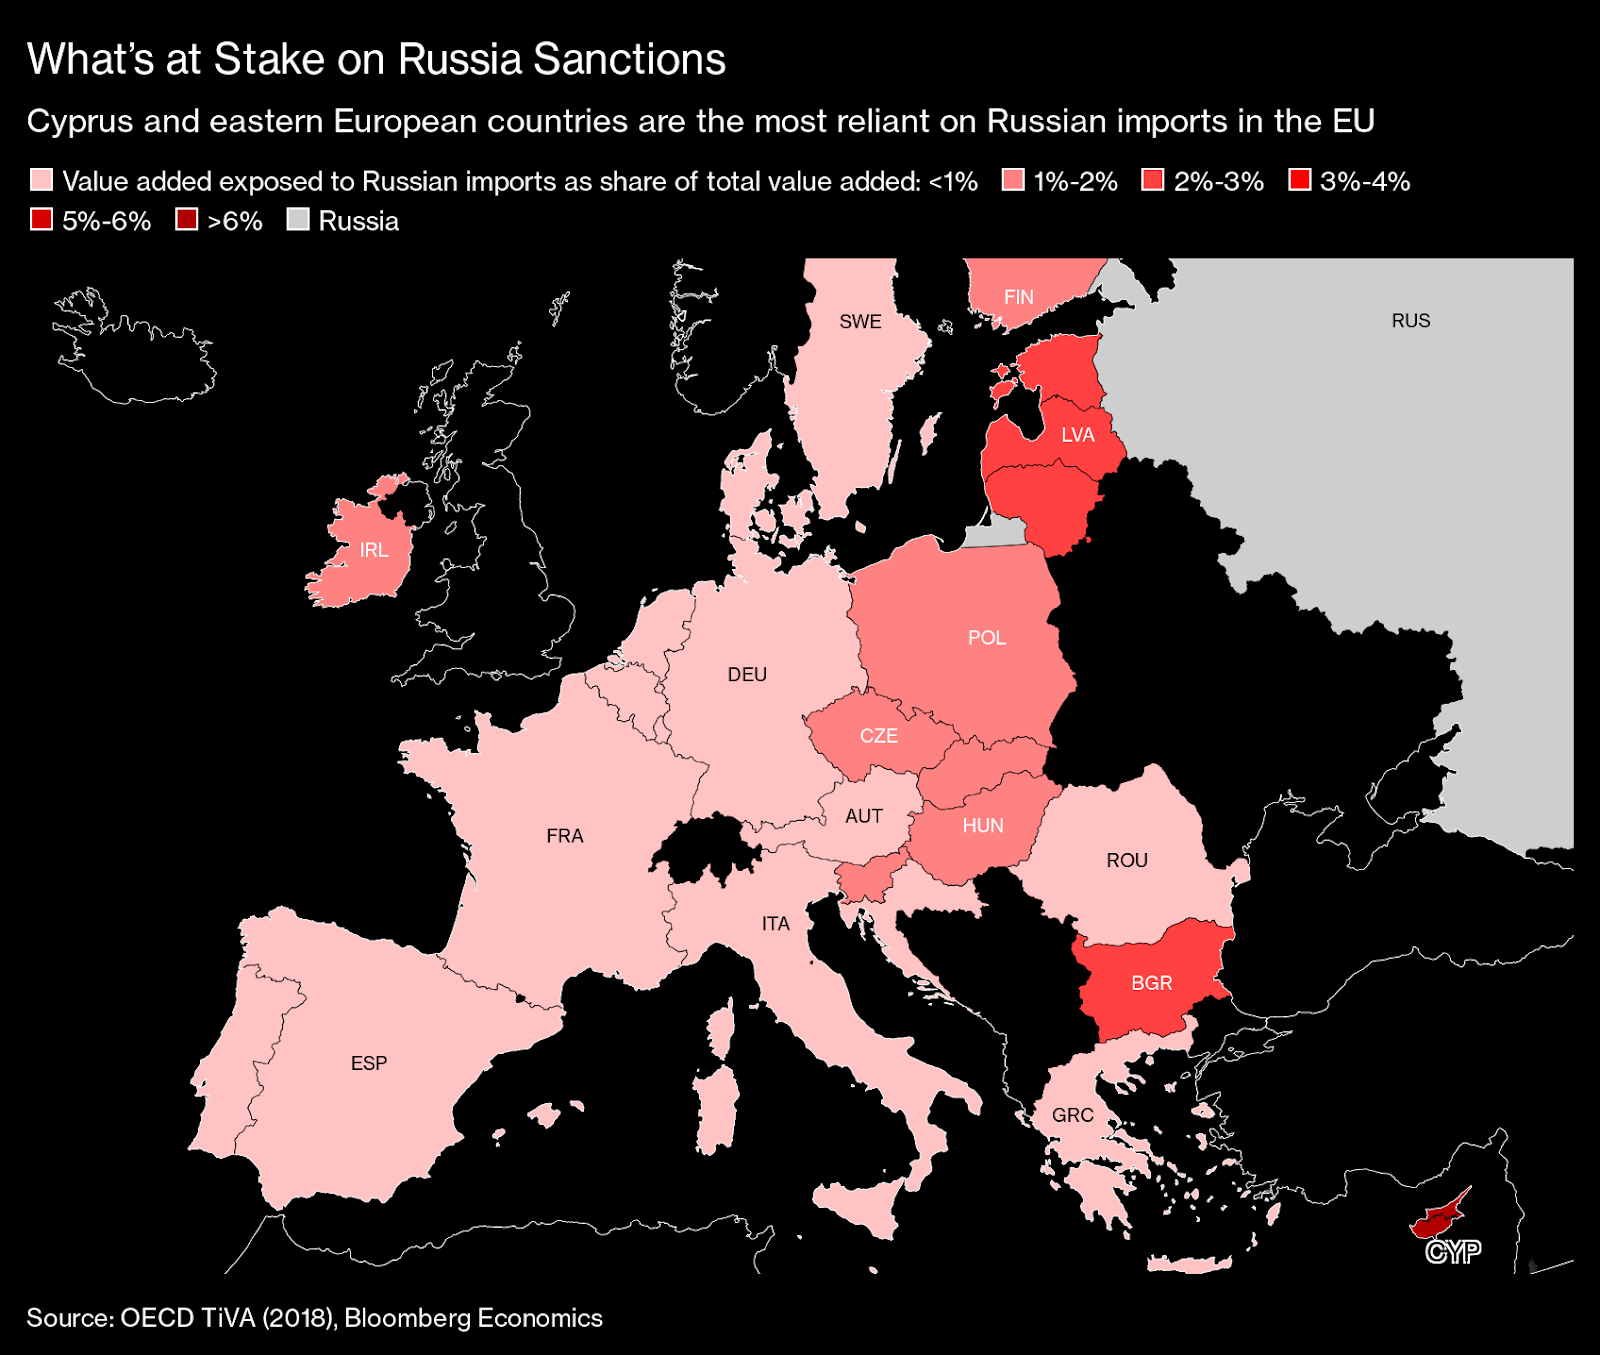
Geopolitical tensions remain. Mainly, Russia and Ukraine tensions are ongoing and there’s a lack of clarity on what’s going on with the negotiations between the two parties.
Additionally, China is weighing the raise of billions to stabilize its economy and cut off the spread of the crisis. The money would stem risks from small, weakened banks and developers.
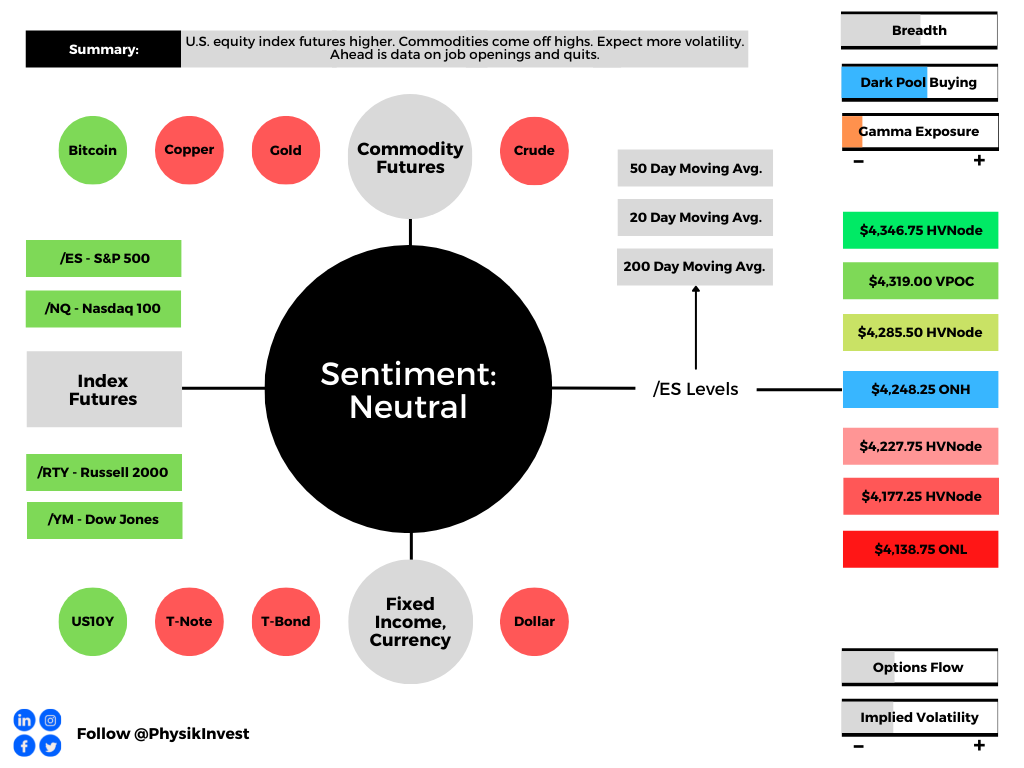
Ahead is data on jobless claims, personal income and consumer spending, PCE price index, as well as real disposable income and consumer spending (8:30 AM ET). Later, Chicago PMI is posted (9:45 AM ET).
What To Expect
Fundamental: Carry trades (i.e., the act of borrowing at low rates and investing where there are higher rates to make money so long as nothing [bad] happens) are receiving attention, again.
In recent days, it’s been the sale of the Japanese yen and the purchase of the Aussie dollar.
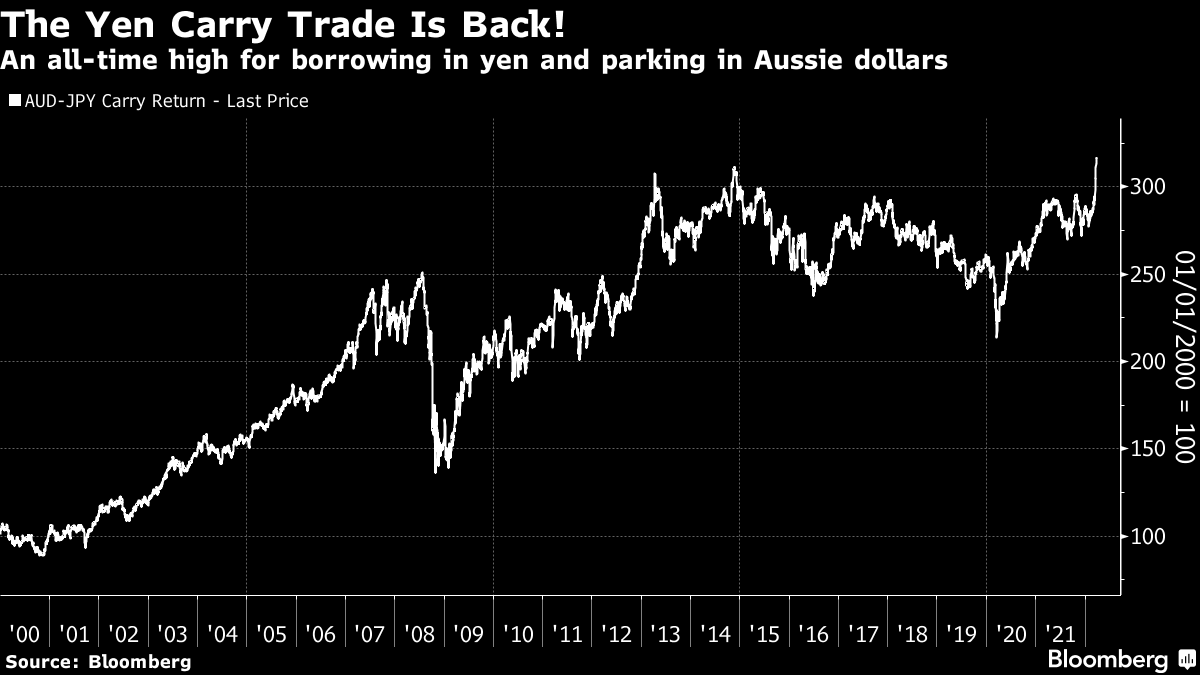
Prior to 2008, this carry trade, according to a commentary by Bloomberg’s John Authers, which “became very correlated with speculative equity investing, … suffered an almighty crash as the yen appreciated dramatically against the Aussie dollar in 2008.”
Basically, Bank of Japan (BoJ) interventions are dovish and consistent, as Authers explains, buying bonds at a massive scale and “making the country an irresistible source of [cheap] funds.”
The risk of the trade is that the yen appreciates. In such a case, the opposite of what is going on now (similar to what happened during the Global Financial Crisis or GFC) occurs.
A great book on this – “The Rise of Carry: The Dangerous Consequences of Volatility Suppression and the New Financial Order of Decay Growth and Recurring Crisis – discusses many of the different forms of carry, their attractiveness, and the implications of their failure.
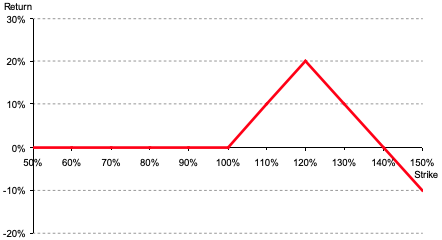
Mainly, such strategies are characterized by a sawtooth wave returns pattern (i.e., steady positive returns followed by sharp drops).
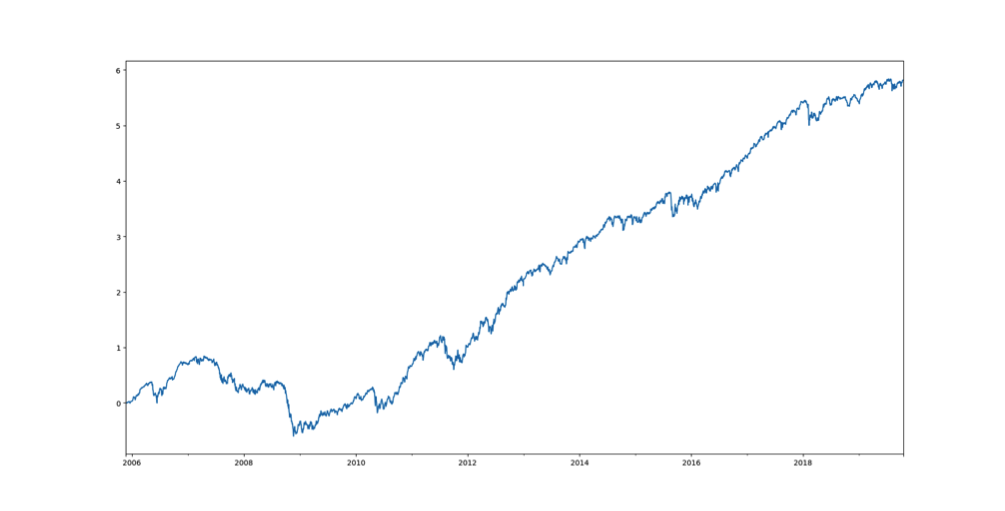
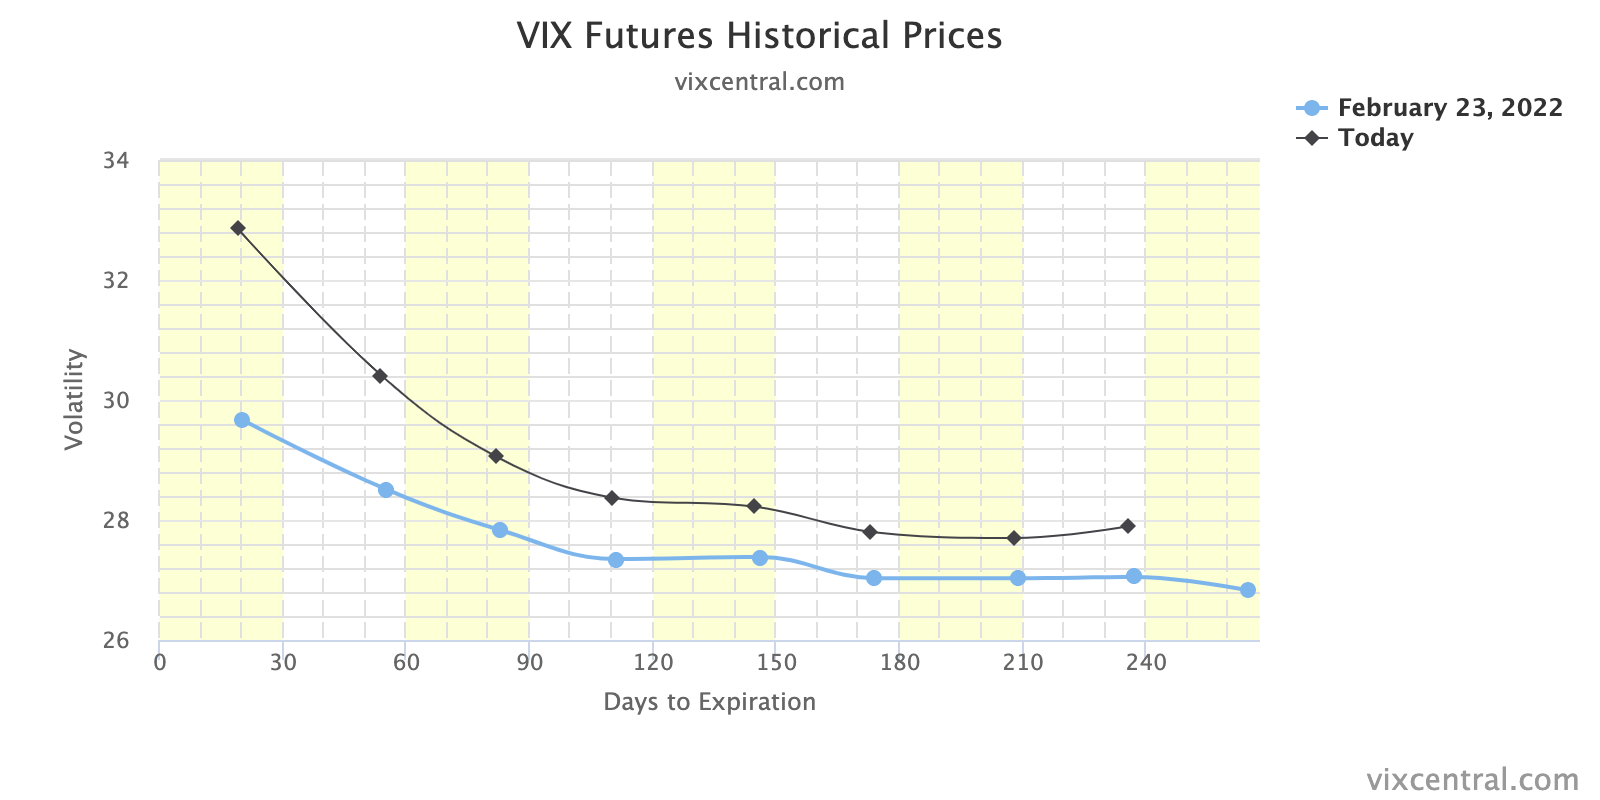
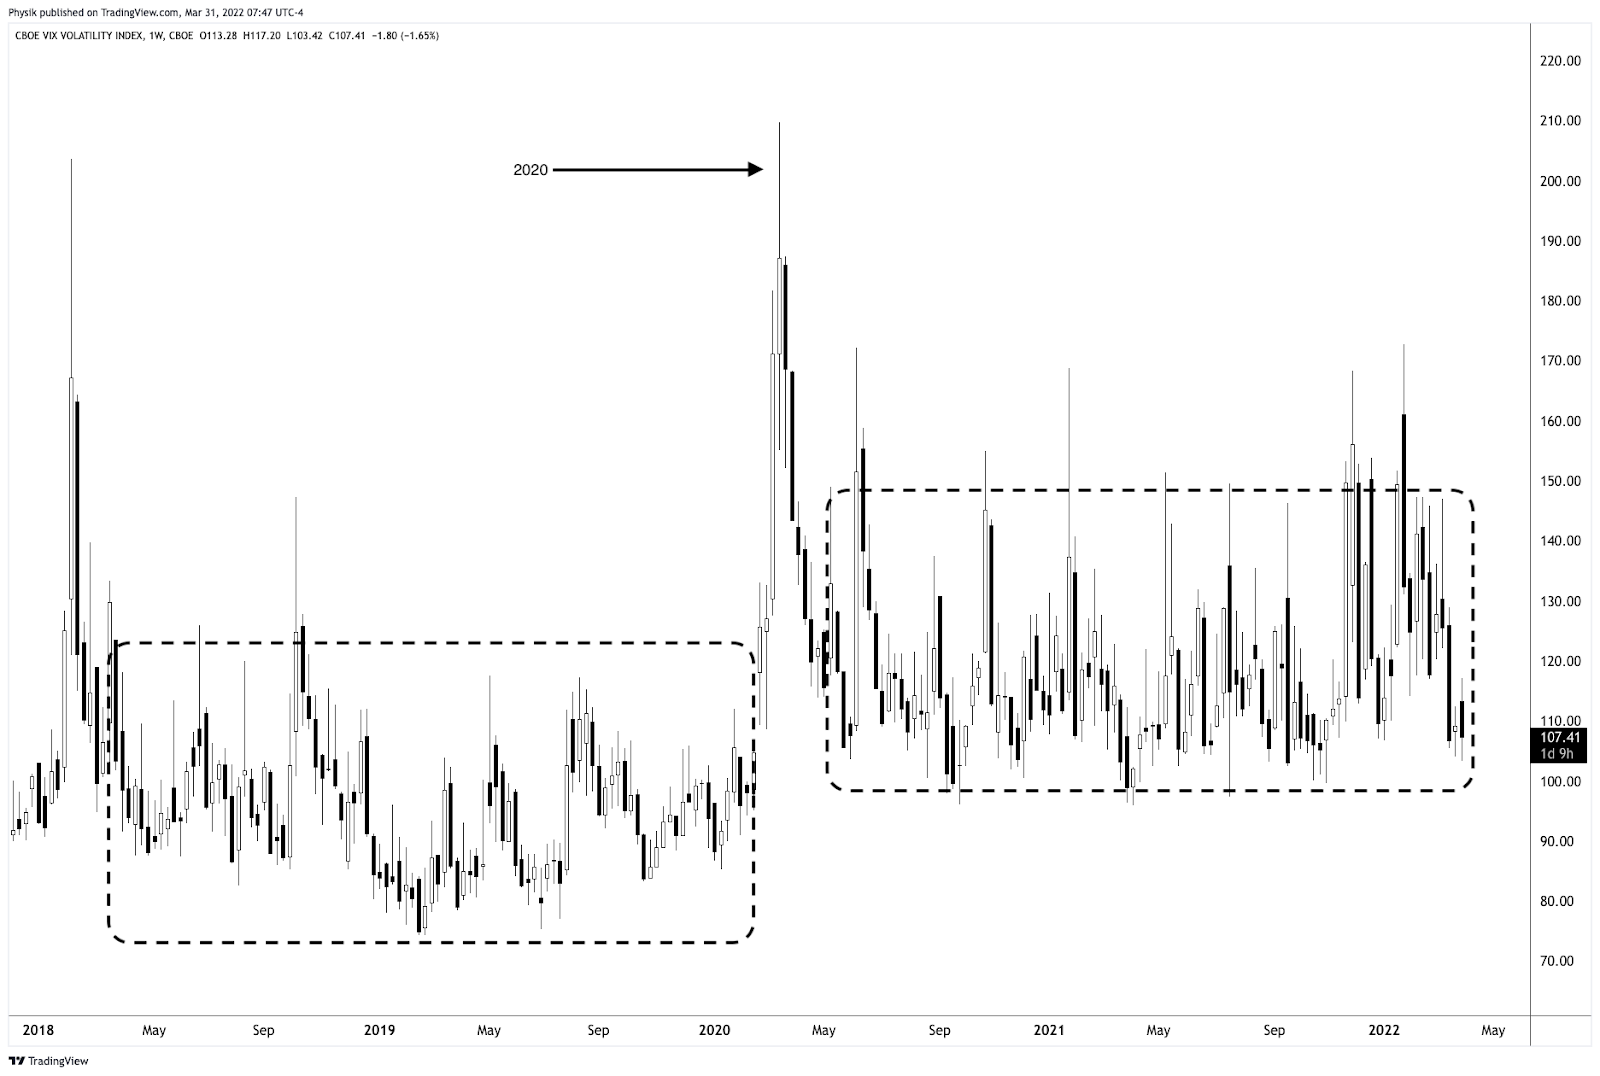
One such trade is that which captures the VIX futures curve roll yield.
Basically, the VIX futures curve is (usually) in contango (i.e., sloping upward) as farther-dated contracts are priced up (since portfolio insurance [should] cost more over longer periods).
As those contracts near expiration, they converge with spot.
If volatility is flat (all else equal), the sale of farter-dated contracts allows you to capture the difference between the future and spot (or shorter-dated contracts).
It’s a bit more complex, but that’s a general idea. Such trades attract lots of capital (and leverage) as they work (most of the time); positioning turns one-sided and complacency builds.
Eventually, markets move and this hurts those with not much wherewithal such as during 2020 when yield-seeking participants (who were forced out the risk curve given the reduction in rates and market stabilization programs) deleveraged en masse.
Since 2020, hardcore volatility selling (especially that which is short-dated), if you will, hasn’t returned and, as stated in yesterday’s commentary, this “has us a little less concerned (about some sort of armageddon situation).”
According to Banco Santander SA’s (NYSE: SAN) cross-asset research, “[t]he supply of volatility remains very subdued in a trend that has continued since the pandemic. For example, there are still virtually zero sales in short-term index variance swaps.”
“We did observe some activity in 4Q21 and 1Q this year, but almost all of that was unwinding of existing positions from earlier, and these were not new trades.”
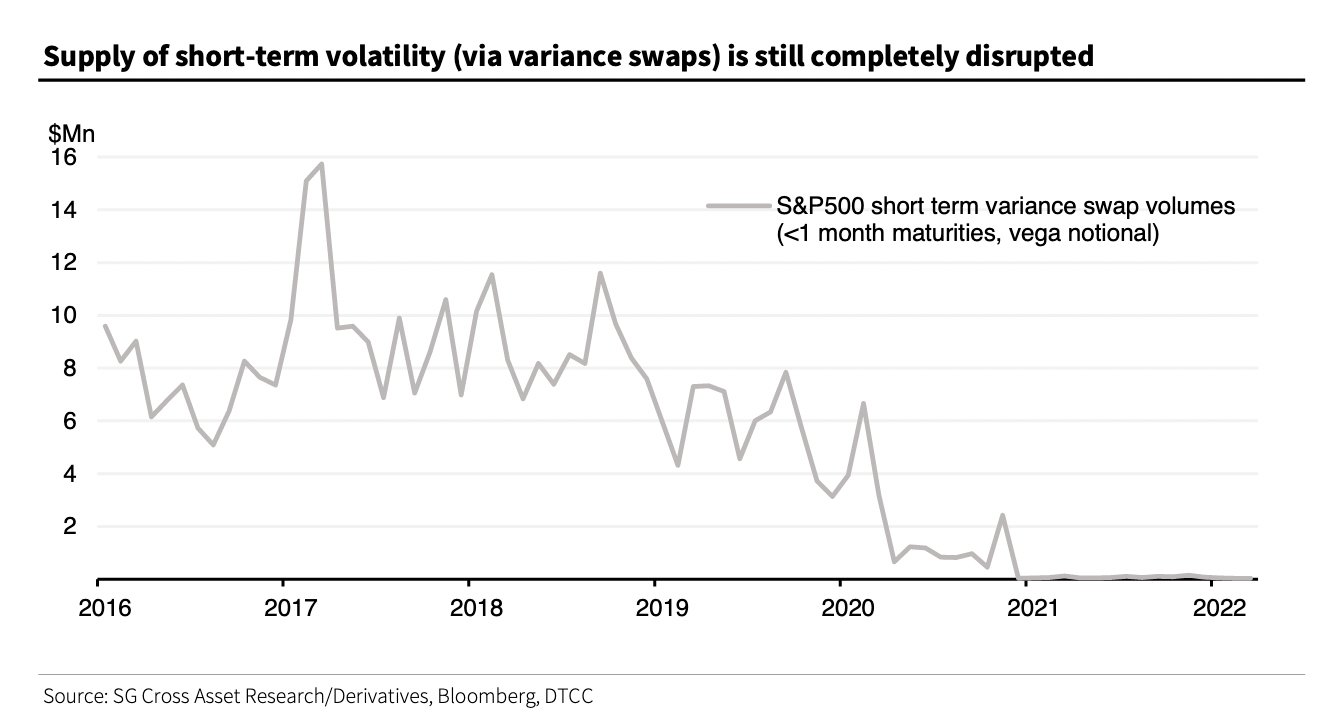
Notwithstanding, Santander’s research says that the demand for volatility (to hedge) remains strong “amidst the elevated uncertainty from geopolitics and central banks.”
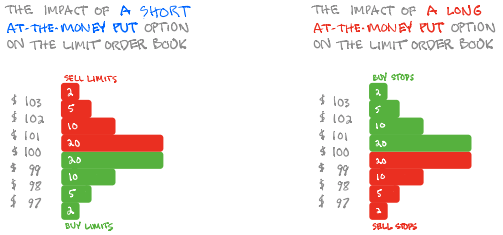
With there being less of a supply of something, demand is not as easily absorbed and may have greater implications for the pricing of that something (such as the volatility of volatility itself).
Hence, we see sharper moves in measures of volatility itself as the counterparts to this demand seek to absorb and hedge their risks (in the underlying), in accordance with prevailing regulatory frameworks, among other things.
Though we’ll, once again, explore this phenomenon in later commentaries, as well as the potential implications of its return in size, below is an interesting conversation featuring Kevin Coldiron, co-author of the “Rise of Carry” book pointed to earlier. Check it out!
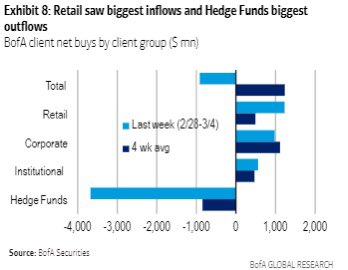
Positioning: Yesterday’s commentary explained well the implications of recent positioning. If you haven’t checked it out, click here.
Conditions, today, are similar. OPEX’s clearing of existing options exposure, in the coming days, likely opens the door to underlying breadth which has improved markedly since early March.
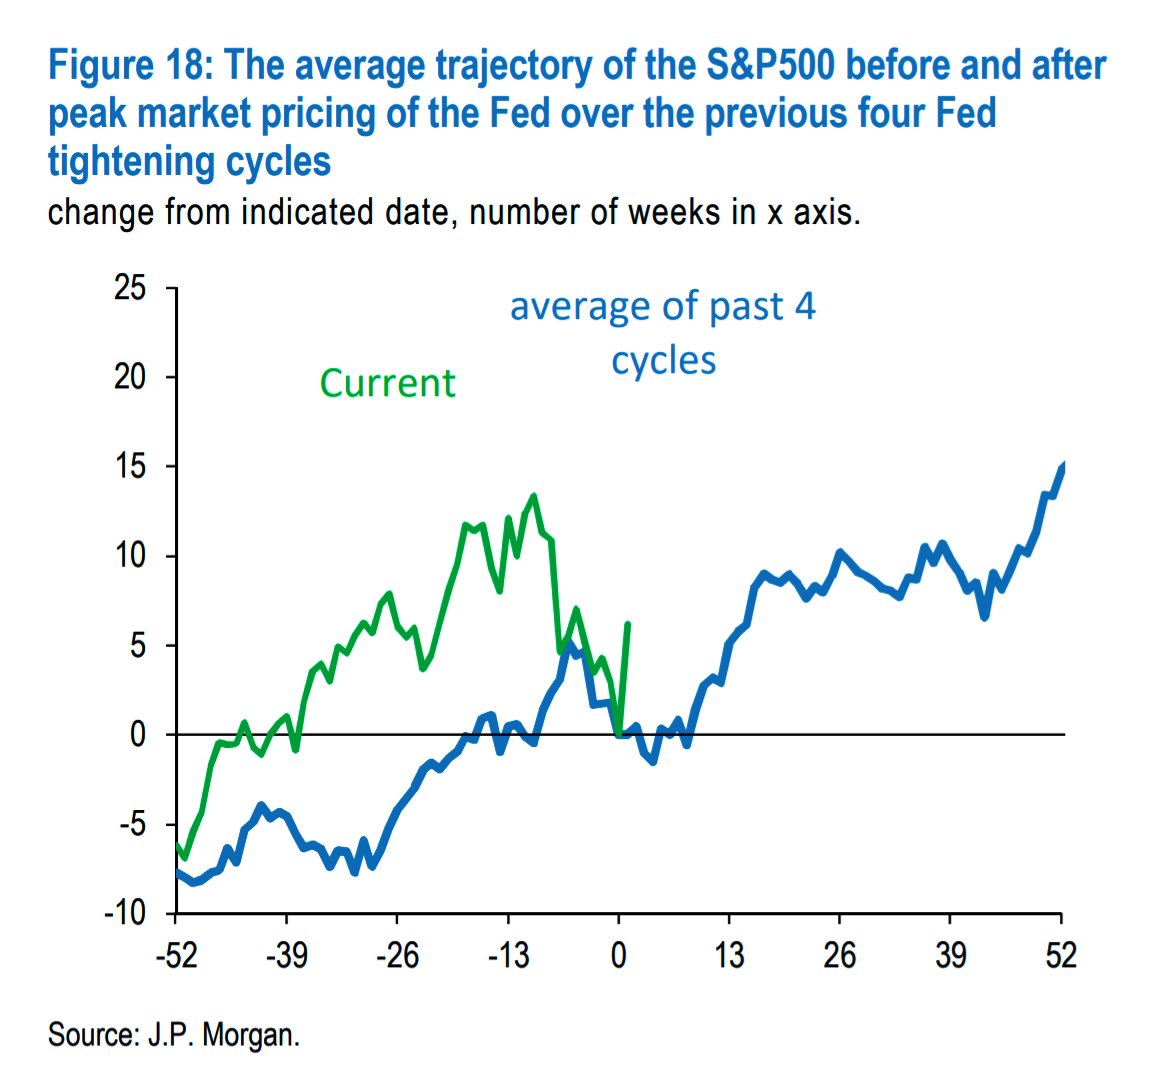
Though today’s market is unprecedented, so to speak, improvements in breadth support a historical case for sideways-to-higher through tightening cycles.
Should there be some exogenous event or weakness on fundamentals, any new demand for protection (in size) likely adds velocity to a leg lower. Caution new buyers.
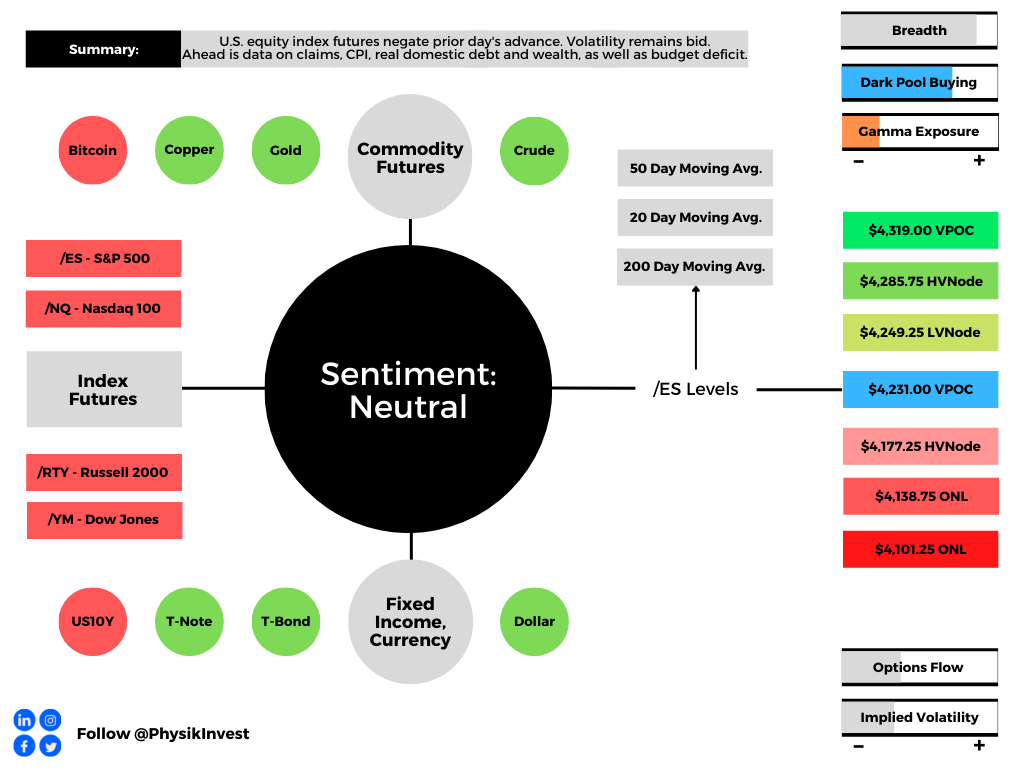
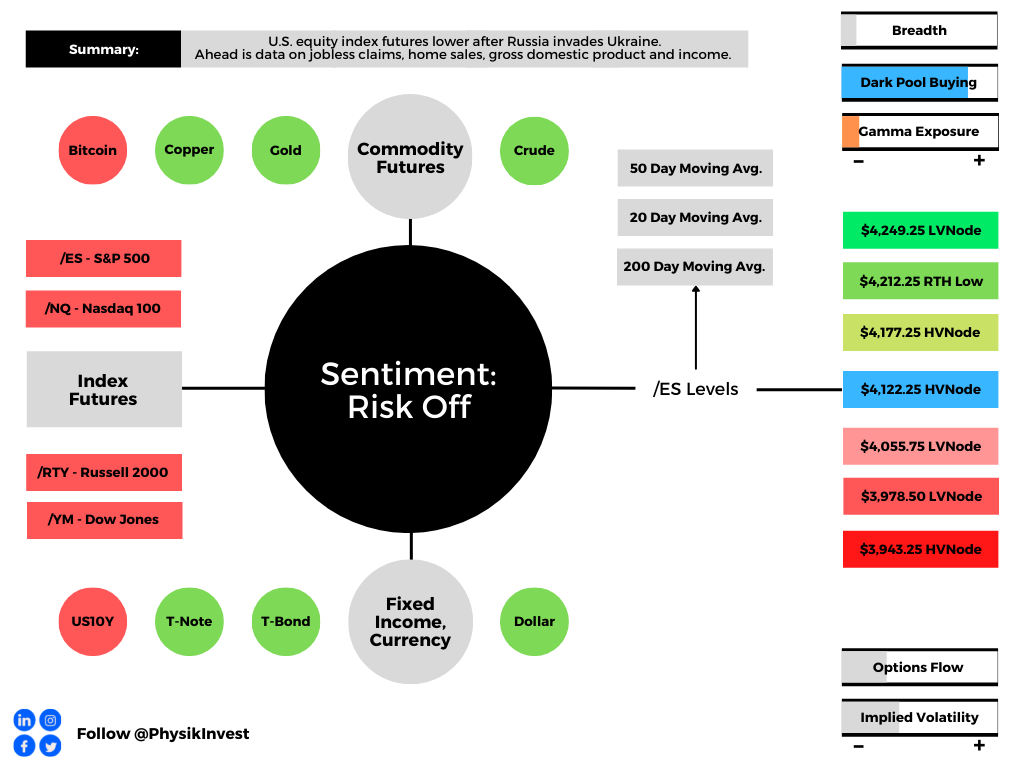
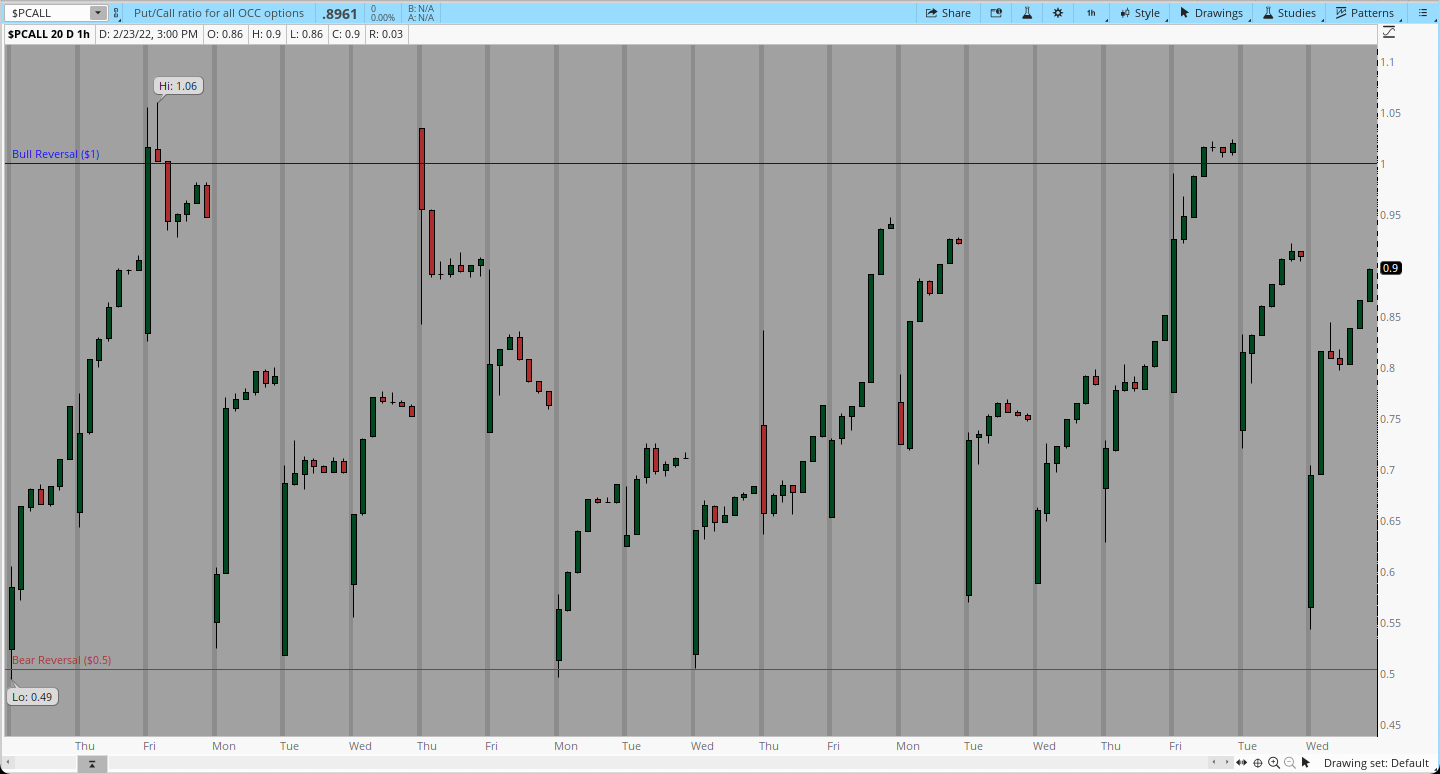
Technical: As of 6:30 AM ET, Thursday’s regular session (9:30 AM – 4:00 PM ET), in the S&P 500, will likely open in the middle part of a balanced overnight inventory, inside of prior-range and -value, suggesting a limited potential for immediate directional opportunity.
In the best case, the S&P 500 trades higher; activity above the $4,611.75 low volume area (LVNode) puts in play the $4,618.25 high volume area (HVNode). Initiative trade beyond the HVNode could reach as high as the $4,631.00 regular trade high and $4,641.75 LVNode, or higher.
In the worst case, the S&P 500 trades lower; activity below the $4,611.75 LVNode puts in play the $4,573.25 HVNode. Initiative trade beyond the HVNode could reach as low as the $4,546.00 spike base and $4,533.00 untested point of control (VPOC), or lower.
Considerations: The market is in balance. This is rotational trade that denotes current prices offer favorable entry and exit. Balance areas make it easy to spot a change in the market (i.e., the transition from two-time frame trade, or balance, to one-time frame trade, or trend).
Modus operandi is responsive trade (i.e., fade the edges), rather than initiative trade (i.e., play the break).
Click here to load today’s key levels into the web-based TradingView charting platform. Note that all levels are derived using the 65-minute timeframe. New links are produced, daily.

Definitions
Spikes: Spikes mark the beginning of a break from value. Spikes higher (lower) are validated by trade at or above (below) the spike base (i.e., the origin of the spike).
Volume Areas: A structurally sound market will build on areas of high volume (HVNodes). Should the market trend for long periods of time, it will lack sound structure, identified as low volume areas (LVNodes). LVNodes denote directional conviction and ought to offer support on any test.
If participants were to auction and find acceptance into areas of prior low volume (LVNodes), then future discovery ought to be volatile and quick as participants look to HVNodes for favorable entry or exit.
POCs: POCs are valuable as they denote areas where two-sided trade was most prevalent in a prior day session. Participants will respond to future tests of value as they offer favorable entry and exit.
About
After years of self-education, strategy development, mentorship, and trial-and-error, Renato Leonard Capelj began trading full-time and founded Physik Invest to detail his methods, research, and performance in the markets.
Capelj also develops insights around impactful options market dynamics at SpotGamma and is a Benzinga reporter.
Some of his works include conversations with ARK Invest’s Catherine Wood, investors Kevin O’Leary and John Chambers, FTX’s Sam Bankman-Fried, Kai Volatility’s Cem Karsan, The Ambrus Group’s Kris Sidial, among many others.
Disclaimer
In no way should the materials herein be construed as advice. Derivatives carry a substantial risk of loss. All content is for informational purposes only.