Physik Invest’s Daily Brief is read free by thousands of subscribers. Join this community to learn about the fundamental and technical drivers of markets.
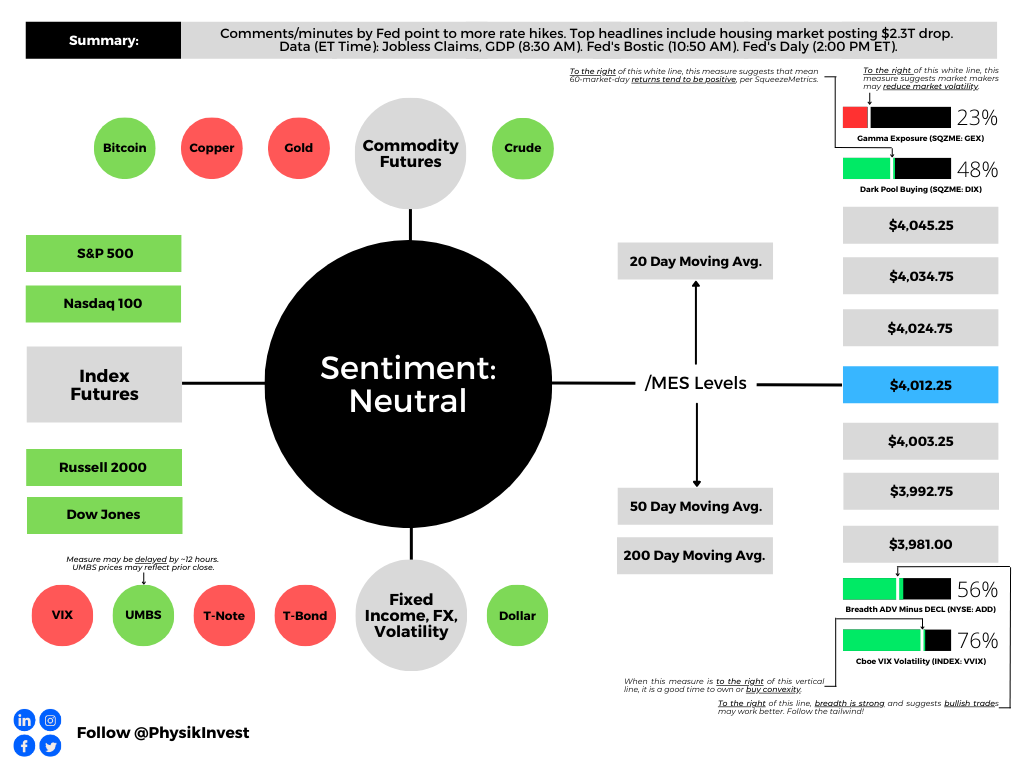
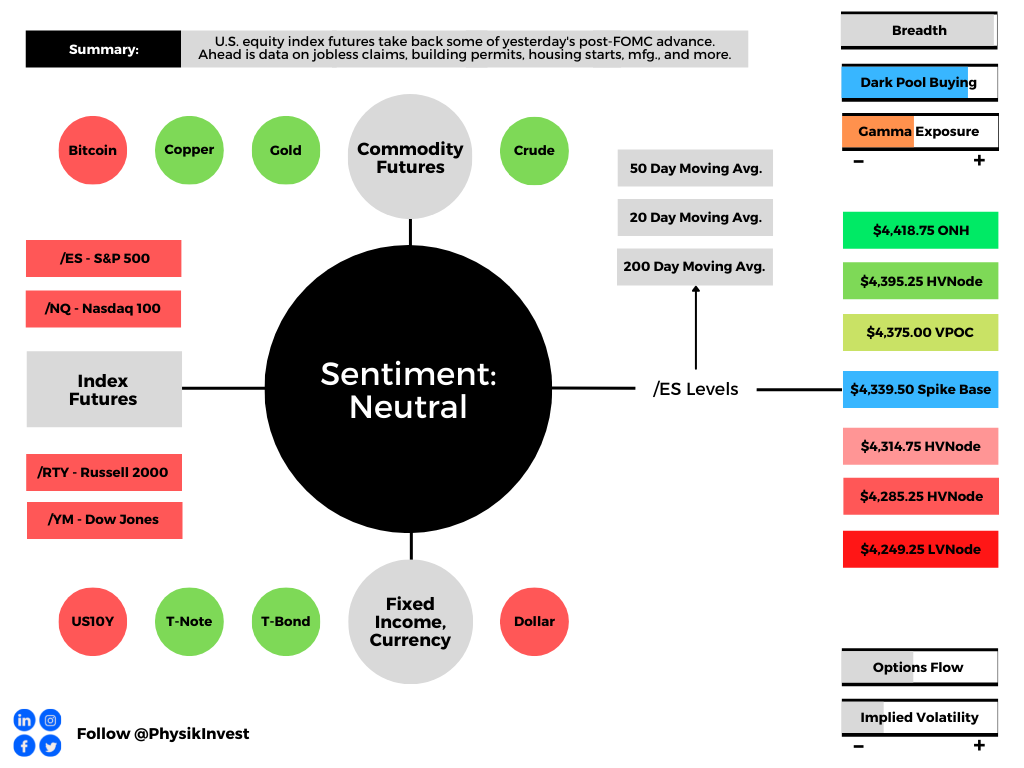
Graphic updated 6:30 AM ET. Sentiment Neutral if expected /MES open is inside of the prior day’s range. /MES levels are derived from the profile graphic at the bottom of this letter. Click here for the latest levels. SqueezeMetrics Dark Pool Index (DIX) and Gamma (GEX) with the latter calculated based on where the prior day’s reading falls with respect to the MAX and MIN of all occurrences available. A higher DIX is bullish. The lower the GEX, the more (expected) volatility. Click to learn the implications of volatility, direction, and moneyness. Breadth reflects a reading of the prior day’s NYSE Advance/Decline indicator. The CBOE VIX Volatility Index (INDEX: VVIX) reflects the attractiveness of owning volatility. UMBS prices via MND. Click here for the economic calendar.
Fundamental
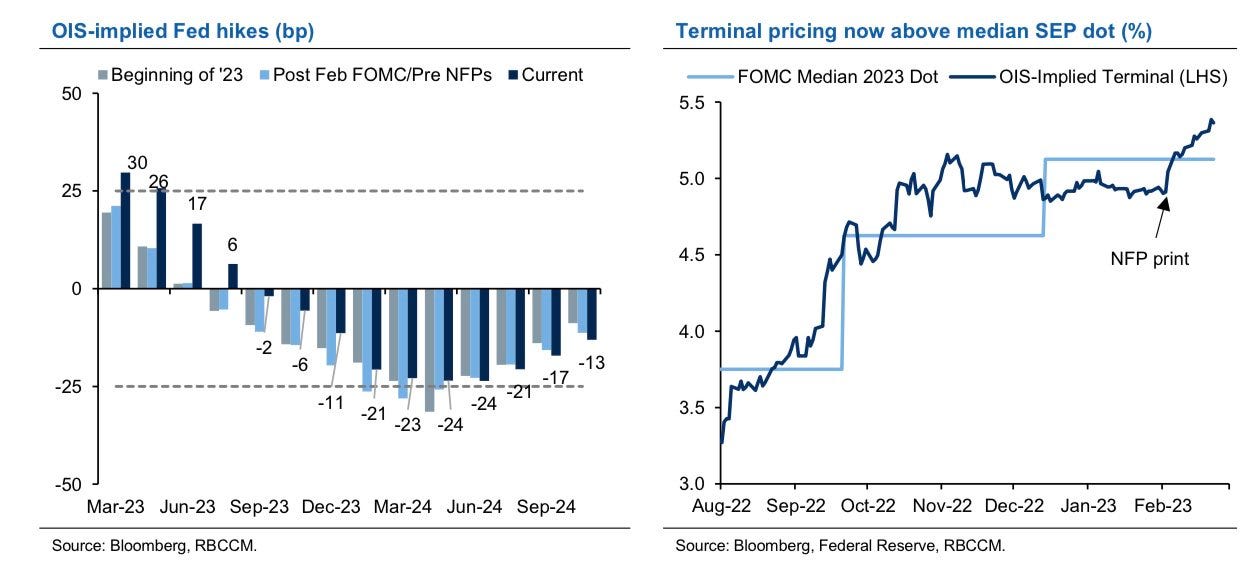
Bloomberg’s John Authers summarized well the release of the Federal Open Market Committee (FOMC) meeting minutes. He said that almost all officials “supported a step down in the pace of tightening by 25 basis points, while a ‘few’ favored or could have supported a bigger 50 basis-point hike. Nobody wanted to stop straightaway.”
“Participants observed that a restrictive policy stance would need to be maintained until the incoming data provided confidence that inflation was on a sustained downward path to 2%, which was likely to take some time,” the minutes said.
Graphic: Retrieved from Royal Bank of Canada (NYSE: RY).
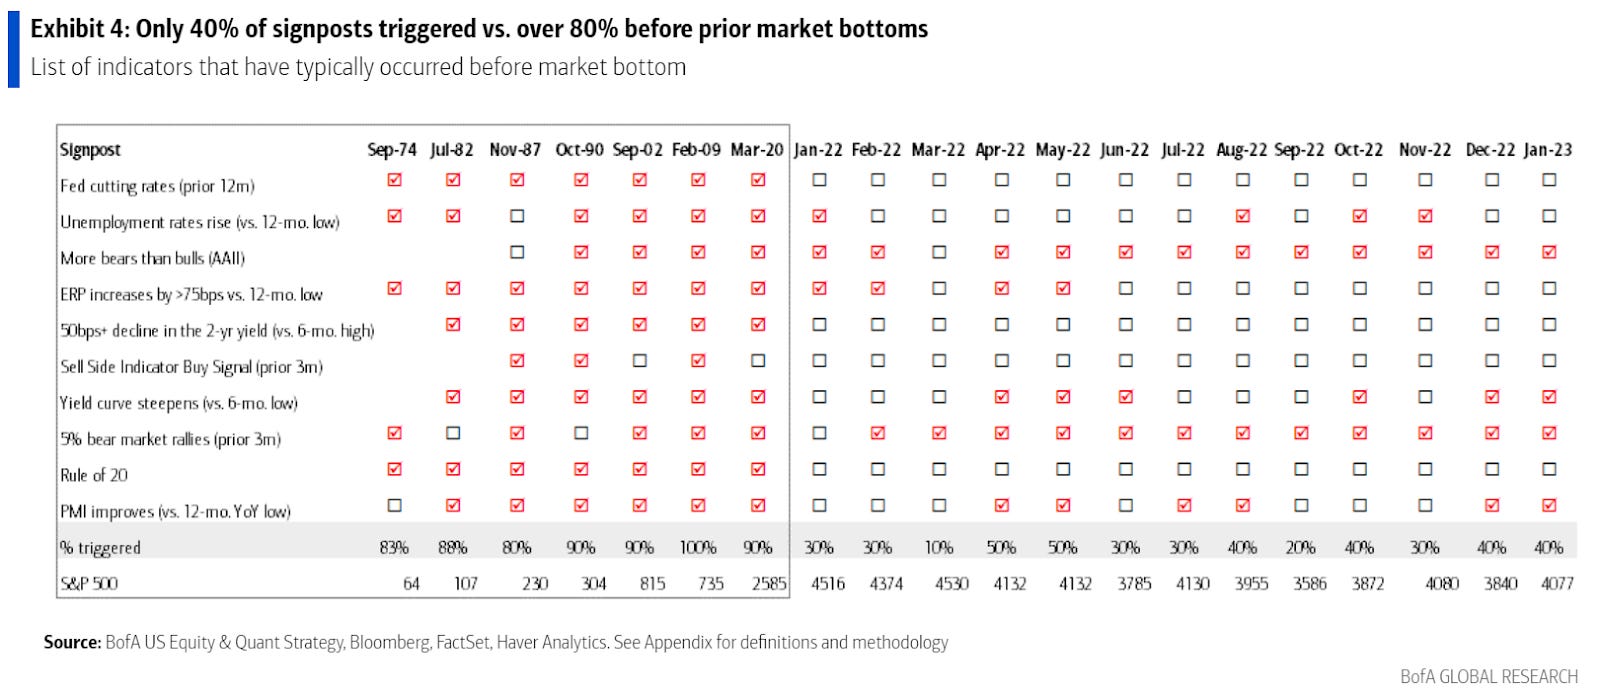
Notwithstanding hits to markets like housing, which news has concentrated on, the S&P 500 (INDEX: SPX) is trading about 18x forward price-to-earnings, Bank of America Corporation (NYSE: BAC) said, the highest since March 2022 and 20% above the last decade’s average P/E.
Graphic: Retrieved from Bloomberg.
Per Savita Subramanian, “the traditional Rule of 20 … holds that the multiple should be whatever number results by subtracting the inflation rate from 20 — which with inflation at 6.4% would imply that the P/E needs to fall to 13.6.”
Graphic: Retrieved from Bank of America Corporation (NYSE: BAC) via Bloomberg.
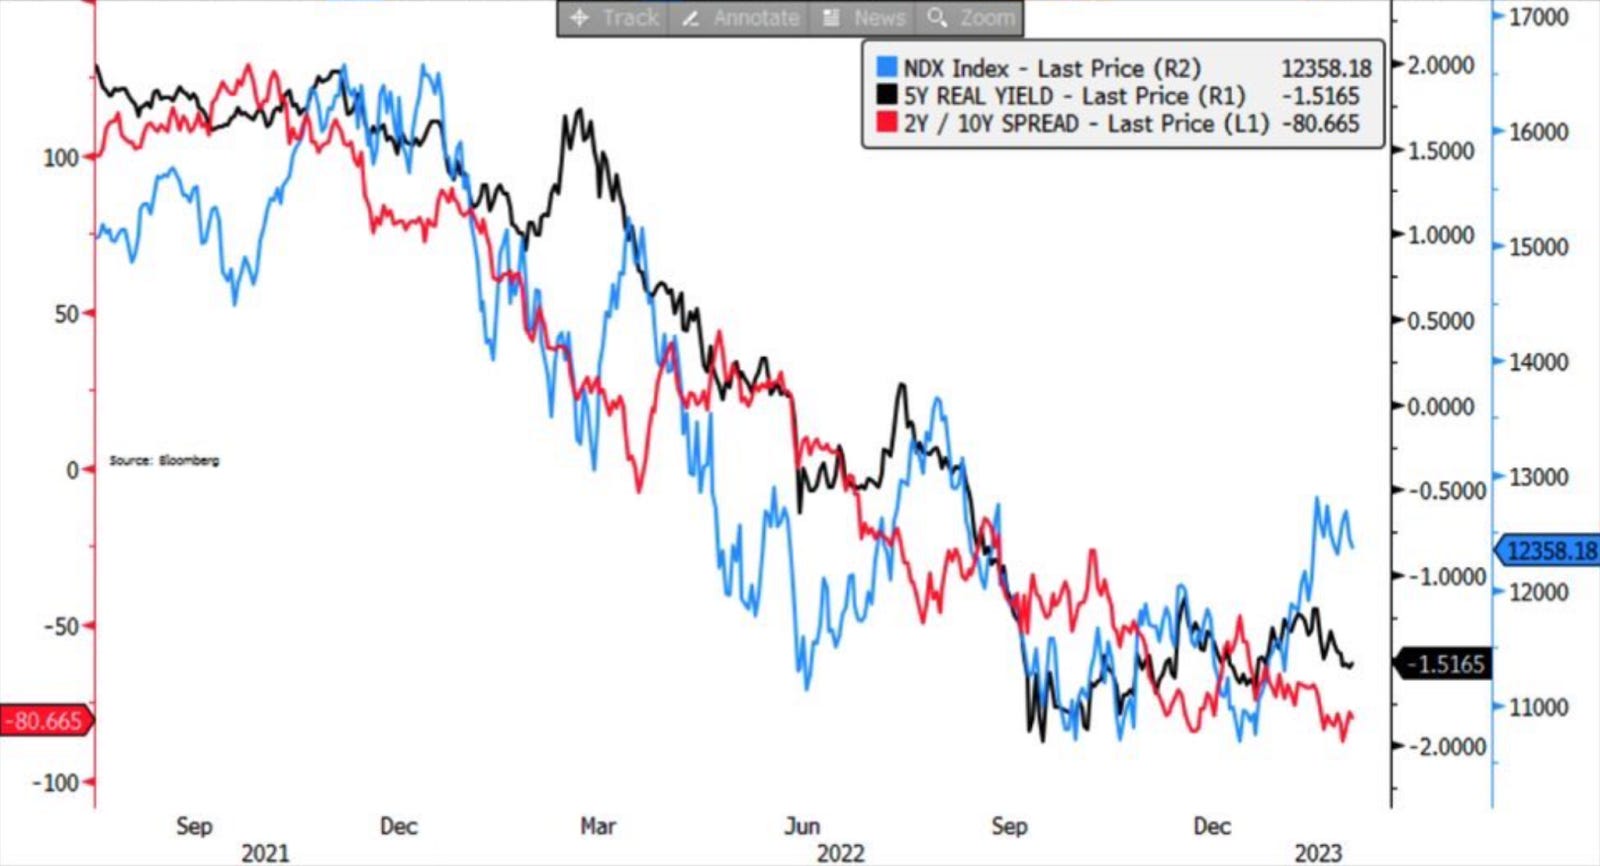
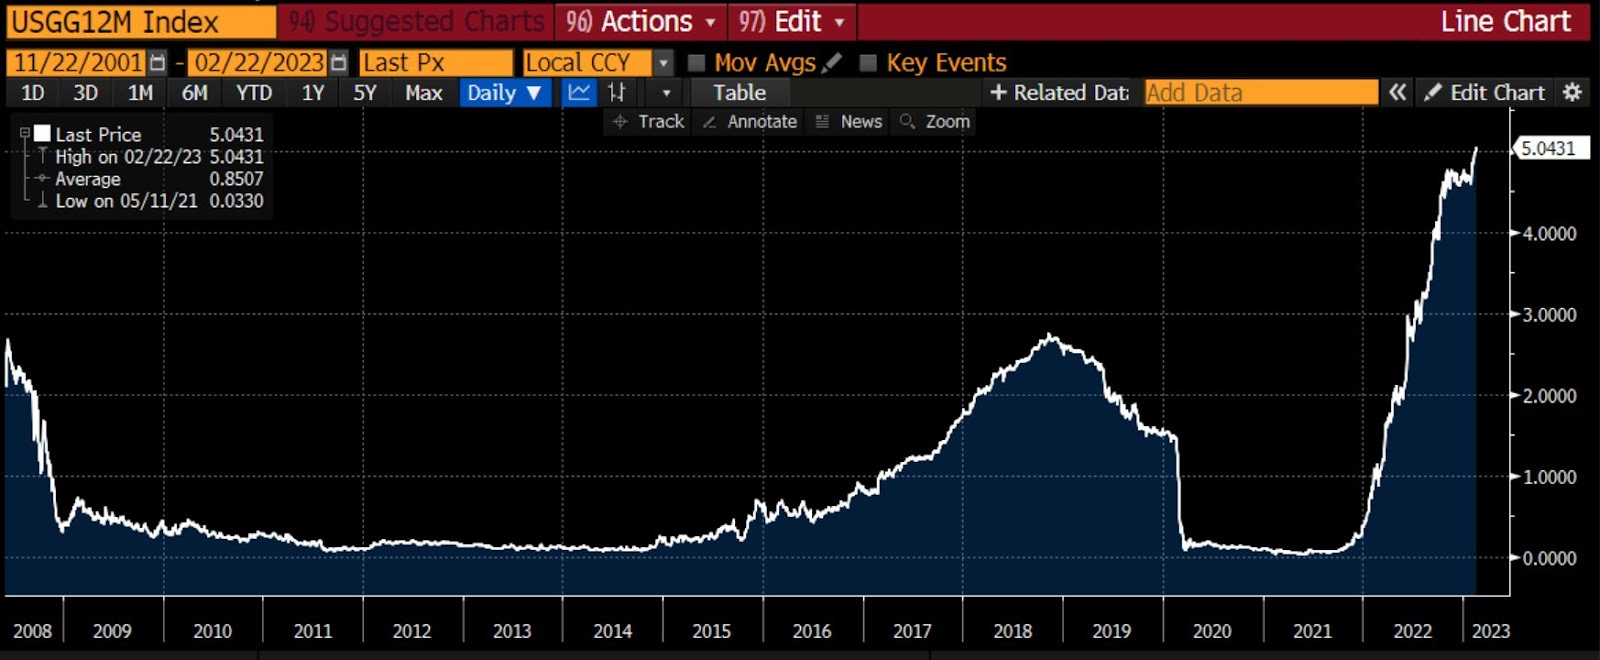
Recall yesterday’s letter discussing the “risk-reward of holding bonds [looking] betterthan equity (earnings yield).”
Graphic: Retrieved from Bloomberg’s Lisa Abramowicz. “Yields on 12-month T-bills have risen to their highest since 2001. Most of this has to do with Fed rate hike expectations.”
Positioning
The SPX’s decline is orderly and contained.
However, the break below $4,000.00 SPX did open the door to a “liquidity hole,” SpotGamma explained. New information has traders anticipating more equity market downside; traders are “reset[ing] to lower equity valuations” on the higher-for-longer rate narrative all the while “vanna and gamma hedging serve to pull markets lower.”
The contexts for a far-reaching rally are weak. A change in the context is likely to coincide with charged options values (i.e., wound implied volatility or big put delta).
Technical
As of 6:30 AM ET, Thursday’s regular session (9:30 AM – 4:00 PM ET), in the S&P 500, is likely to open in the middle part of a positively skewed overnight inventory, inside of the prior day’s range, suggesting a limited potential for immediate directional opportunity.
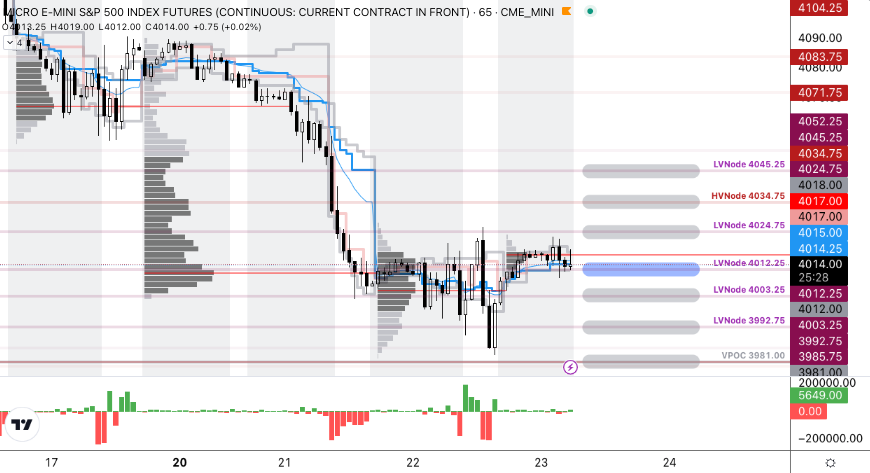
The S&P 500 (FUTURE: /MES) pivot for today is $4,012.25.
Key levels to the upside include $4,024.75, $4,034.75, and $4,045.25.
Key levels to the downside include $4,003.25, $3,992.75, and $3,981.00.
Disclaimer: Click here to load the updated key levels via the web-based TradingView platform. New links are produced daily. Quoted levels likely hold barring an exogenous development.
Graphic: 65-minute profile chart of the Micro E-mini S&P 500 Futures.
Definitions
Volume Areas: Markets will build on areas of high-volume (HVNodes). Should the market trend for a period of time, this will be identified by a low-volume area (LVNodes). The LVNodes denote directional conviction and ought to offer support on any test.
If participants auction and find acceptance in an area of a prior LVNode, then future discovery ought to be volatile and quick as participants look to the nearest HVNodes for more favorable entry or exit.
Delta: An option’s exposure to the direction or underlying asset movement.
Gamma: The sensitivity of an option’s delta to changes in the underlying asset’s price.
Vanna: The rate at which the delta of an option changes with respect to implied volatility.
POCs: Areas where two-sided trade was most prevalent in a prior day session. Participants will respond to future tests of value as they offer favorable entry and exit.
About
The author, Renato Leonard Capelj, works in finance and journalism.
Capelj spends the bulk of his time at Physik Invest, an entity through which he invests and publishes free daily analyses to thousands of subscribers. The analyses offer him and his subscribers a way to stay on the right side of the market. Separately, Capelj is an options analyst at SpotGamma and an accredited journalist.
You may view this letter’s content calendar at this link.
Disclaimer
Do not construe this newsletter as advice. All content is for informational purposes. Capelj and Physik Invest manage their own capital and will not solicit others for it.
Editor’s Note: The Daily Brief is a free glimpse into the prevailing fundamental and technical drivers of U.S. equity market products. Join the 200+ that read this report daily, below!
Overnight, equity index futures took back part of Wednesday’s advance after the Federal Open Market Committee (FOMC) made the decision to tighten, albeit at a more aggressive pace than previously expected.
Moreover, according to some reports, last night’s decline comes as the Kremlin rejected claims that Ukraine peace talks were making progress. Subsequently, most commodity products rose.
Ahead is data on jobless claims, building permits, housing starts, and the Philadelphia Fed manufacturing survey (8:30 AM ET). Later, participants receive data on industrial production and capacity utilization (9:15 AM ET).
Graphic updated 6:40 AM ET. Sentiment Neutral if expected /ES open is inside of the prior day’s range. /ES levels are derived from the profile graphic at the bottom of the following section. Levels may have changed since initially quoted; click here for the latest levels. SqueezeMetrics Dark Pool Index (DIX) and Gamma (GEX) calculations are based on where the prior day’s reading falls with respect to the MAX and MIN of all occurrences available. A higher DIX is bullish. At the same time, the lower the GEX, the more (expected) volatility. Learn the implications of volatility, direction, and moneyness. SHIFT data used for S&P 500 (INDEX: SPX) options activity. Note that options flow is sorted by the call premium spent; if more positive, then more was spent on call options. Breadth reflects a reading of the prior day’s NYSE Advance/Decline indicator. VIX reflects a current reading of the CBOE Volatility Index (INDEX: VIX) from 0-100.
What To Expect
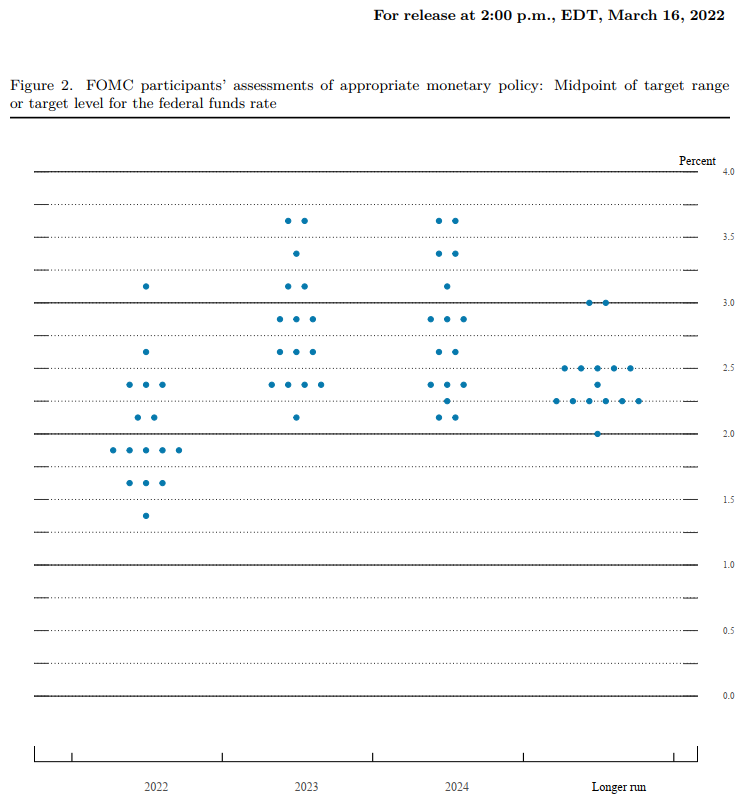
Fundamental: In the face of a strong economy (at home) plagued by supply and demand imbalances, as well as geopolitical tensions and economic turmoil (abroad), the Federal Reserve (Fed) raised borrowing costs by a quarter percentage point and signaled six more in 2022 putting the policy rate at ~2.8% before 2024.
Graphic: Via Bloomberg. The Fed’s updated dot plot.
Bloomberg’s John Authers explains well what transpired. Essentially, not one FOMC member thought rates would exceed 2.25% by the end of 2023. Now, most members think rates may need to go as high as 3.75% to help rein in inflation and promote price stability.
“In addition to giving up on ‘lower for longer’ rates, the Fed also seems to be capitulating on its forecasts for inflation to come under control relatively swiftly,” Authers explains.
“There is no consensus. That is alarming, and prompted some to fear that the Fed was admitting it didn’t know what was going on.”
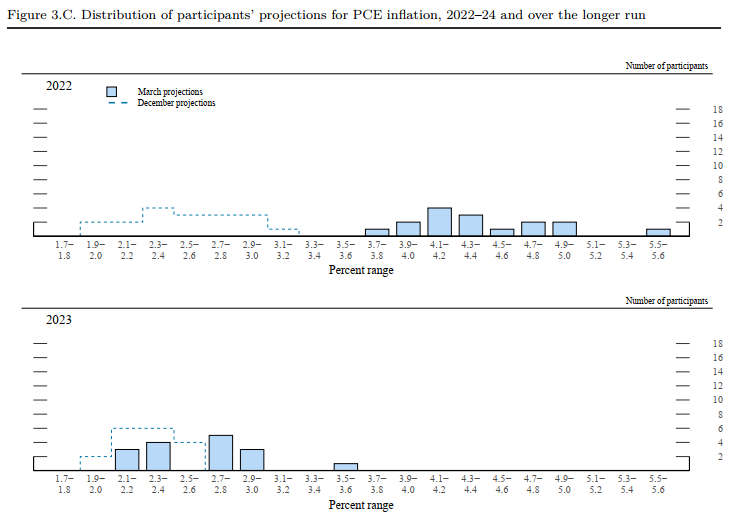
Graphic: Via Bloomberg. “This chart shows how expectations for inflation at the end of this year and next have moved between the two [FOMC] meetings.”
Ultimately, the FOMC thinks inflation will return to their 2% long-term target, and the fed funds rate may top out at 2.4%, “the lowest projection for long-term rates on record.”
In terms of asset purchases, the FOMC will have an updated quantitative tightening (QT) schedule as soon as May.
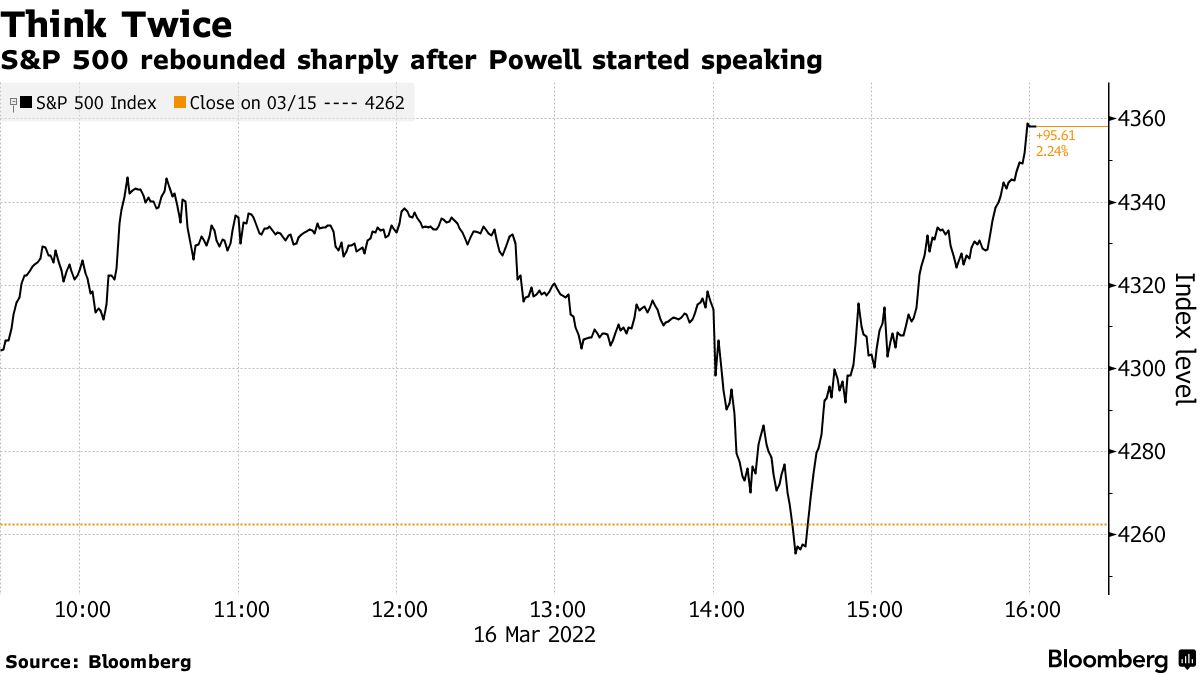
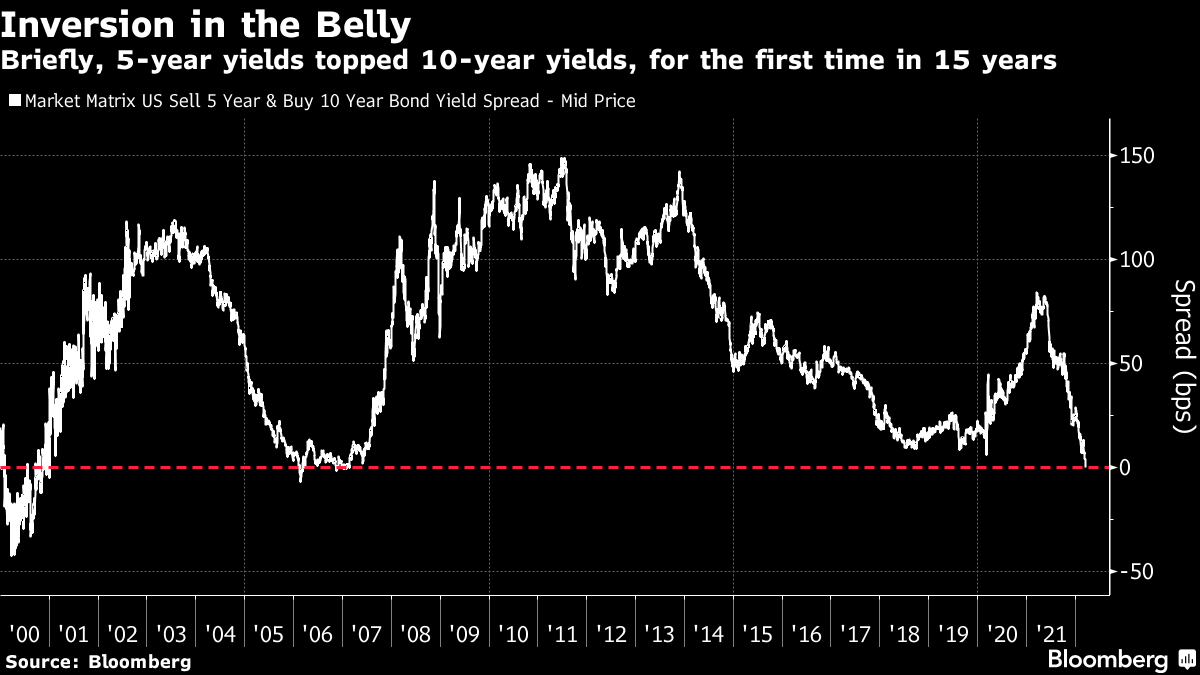
After the announcement, the U.S. equity market closed higher while 5-year yields topped 10-year yields for the first time in 15 years.
Graphic: Via Bloomberg. Stocks rise after the Fed’s Powell started speaking. “Jobs are stronger than ever. The unemployment rate is lower than pre-Covid, basically. Consumer spending is quite healthy. Consumer savings remains at all-time highs at $2.7 trillion,” said Sylvia Jablonski, CEO and CIO of Defiance ETFs. “It’s really hard to think about how we would go into a recession.”
“It was the first time this relationship had inverted since early 2007, shortly before the beginning of the credit crisis,” Authers explained in statements as to the factors that may lead to the Fed abandoning its tightening schedule.
Graphic: Via Bloomberg. “Whenever the yield curve inverts, it tends to function as an early warning for a recession, suggesting that in the medium-term rates will have to fall.”
“Any inversion is a worrying sign, although one between five and 10 years, in the so-called ‘belly’ of the curve, is not as alarming as an inversion between three-month or two-year yields and the 10-year yield.”
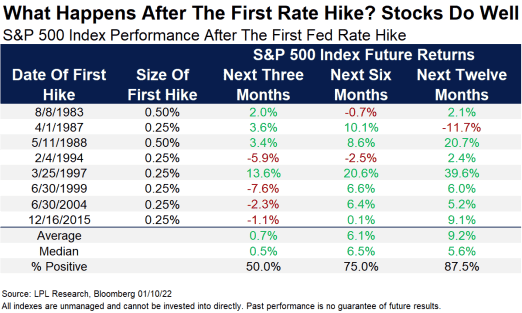
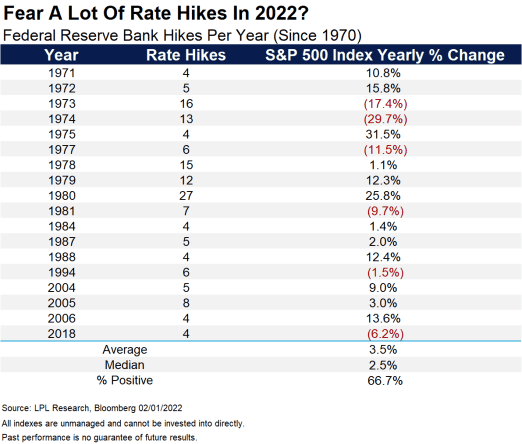
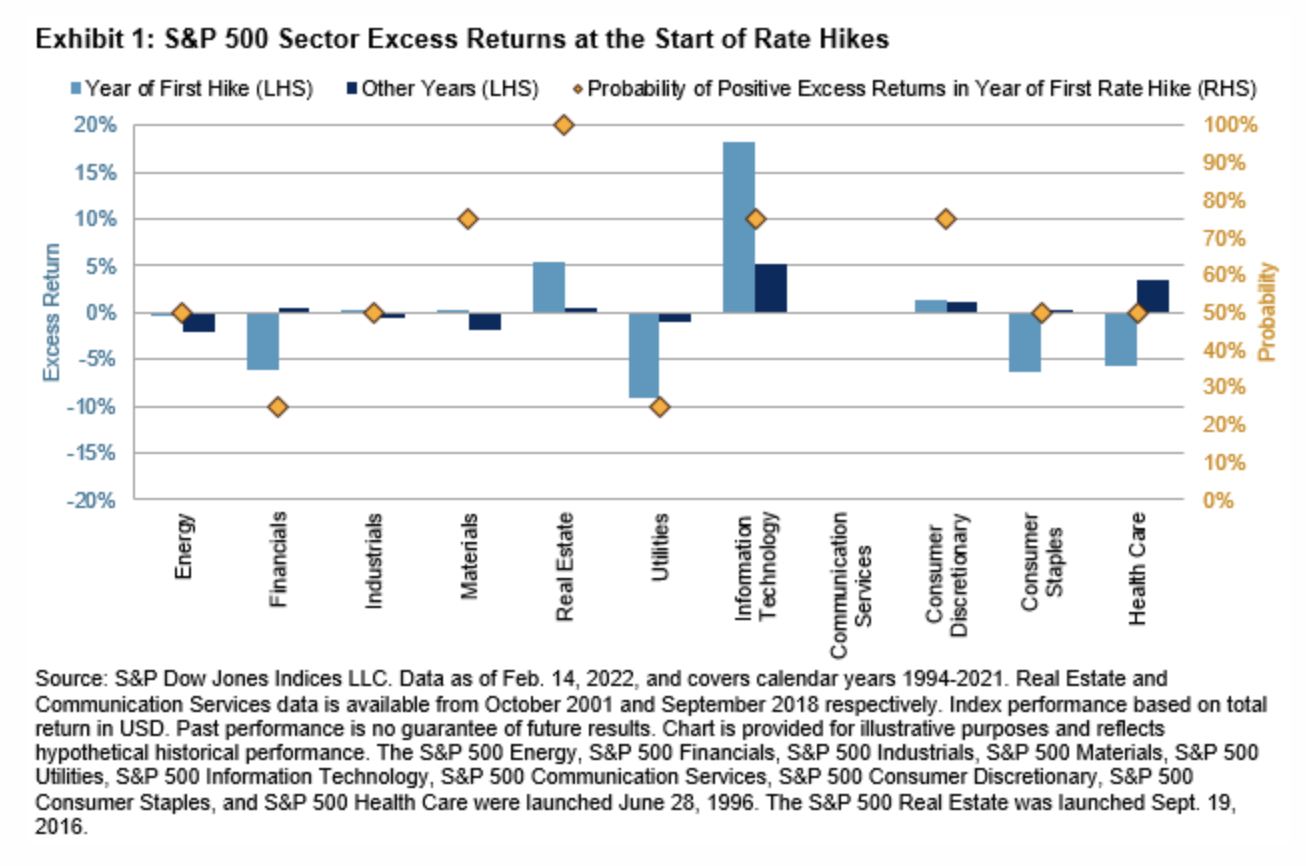
Moreover, according to stats compiled by LPL Research, stocks tend to do well after the Fed starts hiking rates.
“Fed rate hikes usually happen near the middle of the economic cycle, with potentially years left of gains in stocks and the economy,” explained LPL Financial’s Ryan Detrick.
“In fact, a year after the first hike in a cycle has been fairly strong, higher a year later the past six times.”
Graphic: Via LPL Research. “Lastly, here’s how stocks have done in years with a lot of rate hikes. The mid-2000s cycle is what has our attention, as there were 17 total rate hikes in 2004, 2005, and 2006, yet the S&P 500 managed to gain in every year.”
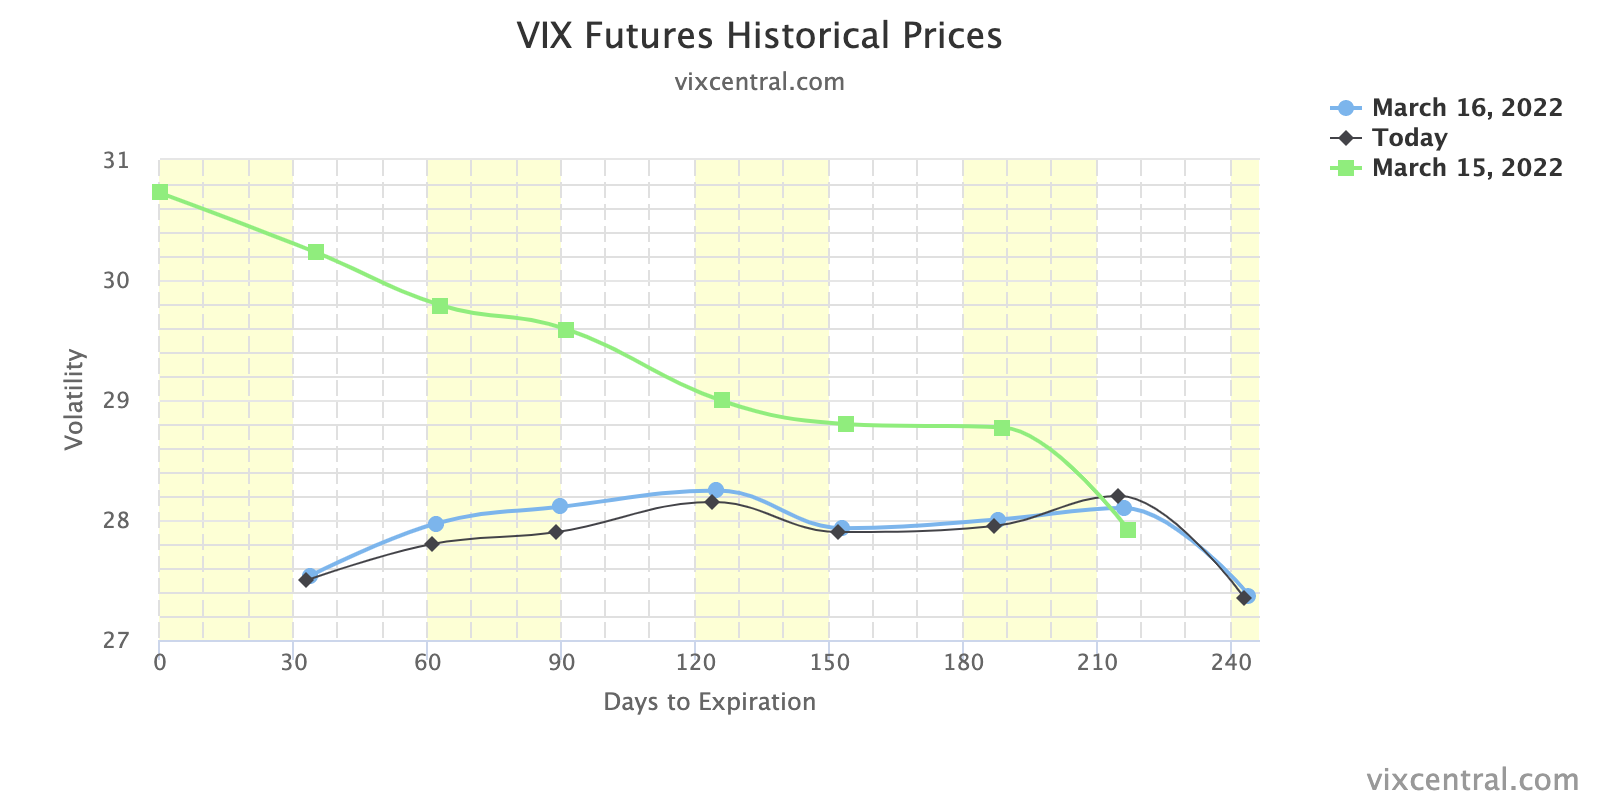
Positioning: Implied volatility metrics compressed markedly, yesterday, and this bolstered a near-vertical price rise in the equity market, as suggested would happen in past letters.
Graphic: Implied volatility term structure shifts inward. This solicits positive hedging (vanna) flows as counterparty exposure to positive delta declines. In other words, short stock and futures hedges (against options) are bought back.
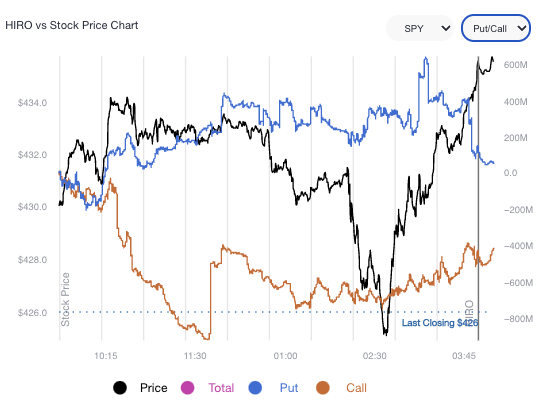
Checking out SpotGamma’s Hedging Impact of Real-Time Options (HIRO) indicator, we see little commitment by S&P 500 participants in this rally. Instead, the response was quite neutral.
Graphic: SpotGamma’s Hedging Impact of Real-Time Options (HIRO) indicator.
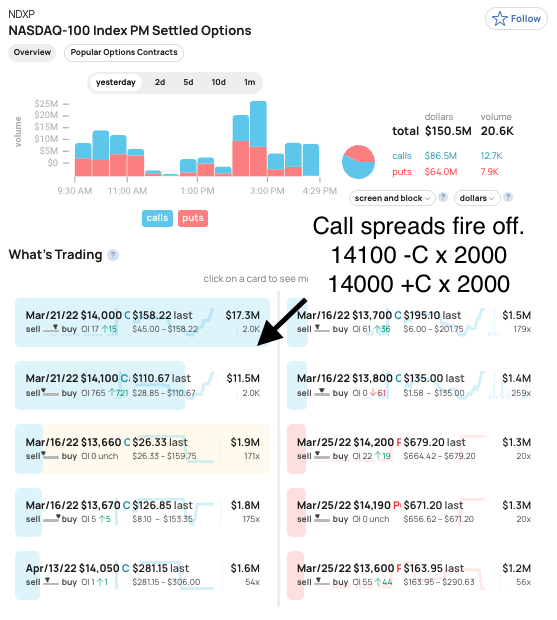
Taking a look at some of the cash-settled indexes, like the growth- and tech-heavy Nasdaq 100 (INDEX: NDX), there was some notable buying of call spreads (i.e., positions that make money if the underlying moves higher, all else equal), though.
Graphic: Via SHIFT. Notice the duration of the spread. Though this may have been a new trade, one must not discount the potential for it to have been a closing trade. In either case, there is potential that the de-rate in the tech and growth areas of the market has played its course.
“Moreover, heading into Wednesday’s FOMC, we saw the market well-hedged,” SpotGamma explained. “Participants’ demand for protection is concentrated in options with little time to expiry (given the monthly options expiration and roll-off a significant size of S&P delta).”
“Adding, the compression of volatility today, coupled with trade higher, solicits less counterparty hedging of put protection … [and] less positive delta = less selling to hedge = less pressure.”
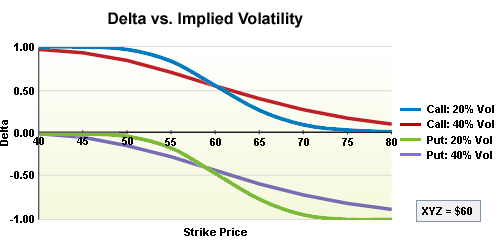
Graphic: Via SpotGamma. “For education only. As implied volatility falls, options delta falls. This solicits positive delta hedging flows (with respect to volatility) or vanna.”
Ultimately, this post-FOMC price rise may put the market in an underhedged position. In such a case, as talked about yesterday, new demand for protection would add fuel to weakness (later).
Regardless, comparing buying and options positioning metrics, the returns distribution remains skewed positive (albeit much less so than before).
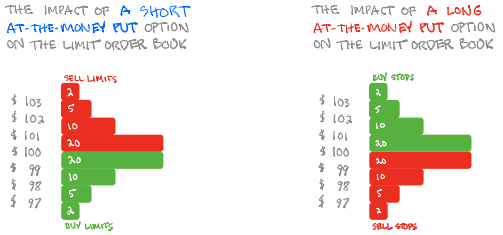
Graphic: SqueezeMetrics details the implications of customer activity in the options market, on the underlying’s order book. For instance, in selling a put, customers add liquidity and stabilize the market. How? The market maker long the put will buy (sell) the underlying to neutralize directional risk as price falls (rises).
Technical: As of 6:30 AM ET, Thursday’s regular session (9:30 AM – 4:00 PM ET), in the S&P 500, will likely open in the middle-to-lower part of a negatively skewed overnight inventory, inside of prior-range and -value, suggesting a limited potential for immediate directional opportunity.
Spike Scenarios In Play: Spikes mark the beginning of a break from value. Spikes higher (lower) are validated by trade at or above (below) the spike base (i.e., the origin of the spike).
In the best case, the S&P 500 trades higher; activity above the $4,339.50 spike base puts in play the $4,375.00 untested point of control (VPOC). Initiative trade beyond the VPOC could reach as high as the $4,395.25 high volume area (HVNode) and $4,418.75 overnight high (ONH), or higher.
In the worst case, the S&P 500 trades lower; activity below the $4,339.50 spike base puts in play the $4,314.75 HVNode. Initiative trade beyond the $4,314.75 could reach as low as the $4,285.25 HVNode and $4,249.25 low volume area (LVNode), or lower.
Considerations: Push-and-pull, as well as responsiveness near key-technical areas (that are discernable visually on a chart), suggests technically-driven traders with short time horizons are very active.
Such traders often lack the wherewithal to defend retests and, additionally, the type of trade may be indicative of the other time frame participants waiting for more information to initiate trades.
Click here to load today’s key levels into the web-based TradingView charting platform. Note that all levels are derived using the 65-minute timeframe. New links are produced, daily.
Graphic: 65-minute profile chart of the Micro E-mini S&P 500 Futures.
Definitions
Overnight Rally Highs (Lows): Typically, there is a low historical probability associated with overnight rally-highs (lows) ending the upside (downside) discovery process.
Volume Areas: A structurally sound market will build on areas of high volume (HVNodes). Should the market trend for long periods of time, it will lack sound structure, identified as low volume areas (LVNodes). LVNodes denote directional conviction and ought to offer support on any test.
If participants were to auction and find acceptance into areas of prior low volume (LVNodes), then future discovery ought to be volatile and quick as participants look to HVNodes for favorable entry or exit.
POCs: POCs are valuable as they denote areas where two-sided trade was most prevalent in a prior day session. Participants will respond to future tests of value as they offer favorable entry and exit.
About
After years of self-education, strategy development, mentorship, and trial-and-error, Renato Leonard Capelj began trading full-time and founded Physik Invest to detail his methods, research, and performance in the markets.
Capelj is also a Benzinga finance and technology reporter interviewing the likes of Shark Tank’s Kevin O’Leary, JC2 Ventures’ John Chambers, FTX’s Sam Bankman-Fried, and ARK Invest’s Catherine Wood, as well as a SpotGamma contributor developing insights around impactful options market dynamics.
Disclaimer
Physik Invest does not carry the right to provide advice.
In no way should the materials herein be construed as advice. Derivatives carry a substantial risk of loss. All content is for informational purposes only.
Editor’s Note: The Daily Brief is a free glimpse into the prevailing fundamental and technical drivers of U.S. equity market products. Join the 200+ that read this report daily, below!
A lot to unpack, today. Part of the newsletter may be cut off, as a result, in your inbox. Just click to view in another window.
Overnight, equity index futures auctioned sideways-to-higher, masking turmoil in products listed abroad, as well as commodities and fixed income.
In regards to bonds, they slumped (globally) in light of participants’ pricing in monetary action given heightened inflation. The Federal Reserve, Bank of England, and Bank of Japan are to issue policy updates this week.
Commodity markets are still roiling after a price spike in some products “created a systemic risk” that prompted exchanges to cancel trades, while equity markets in Asia saw their worst-selling in years.
The Hang Seng China Enterprises Index (INDEX: HSCEI) closed down 7.2%, the biggest drop since 2008. This was after Russia asked for China’s assistance in Ukraine (which could result, later, in sanctions from the U.S.), thus compounding uncertainties with respect to an ongoing regulatory crackdown.
Ahead is data on 1- and 3-year inflation expectations (11:00 AM ET).
Graphic updated 6:11 AM ET. Sentiment Neutral if expected /ES open is inside of the prior day’s range. /ES levels are derived from the profile graphic at the bottom of the following section. Levels may have changed since initially quoted; click here for the latest levels. SqueezeMetrics Dark Pool Index (DIX) and Gamma (GEX) calculations are based on where the prior day’s reading falls with respect to the MAX and MIN of all occurrences available. A higher DIX is bullish. At the same time, the lower the GEX, the more (expected) volatility. Learn the implications of volatility, direction, and moneyness. SHIFT data used for S&P 500 (INDEX: SPX) options activity. Note that options flow is sorted by the call premium spent; if more positive, then more was spent on call options. Breadth reflects a reading of the prior day’s NYSE Advance/Decline indicator. VIX reflects a current reading of the CBOE Volatility Index (INDEX: VIX) from 0-100.
What To Expect
Fundamental: We may attribute participants’ uncertainty to how far monetary policymakers want to tighten, slower economic growth, the implications of geopolitical tensions, imminent Russian defaults, a resurgence in COVID-19 abroad, and more.
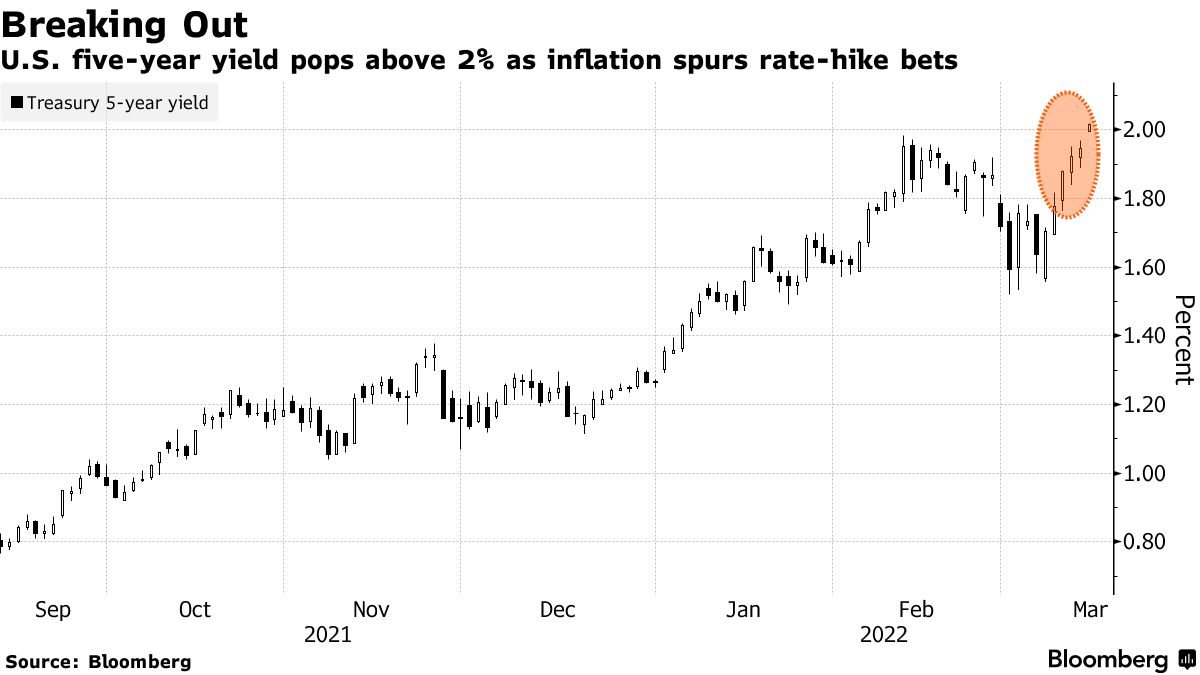
Graphic: Via Bloomberg. As Treasury yields rise, participants price in Fed tightening.
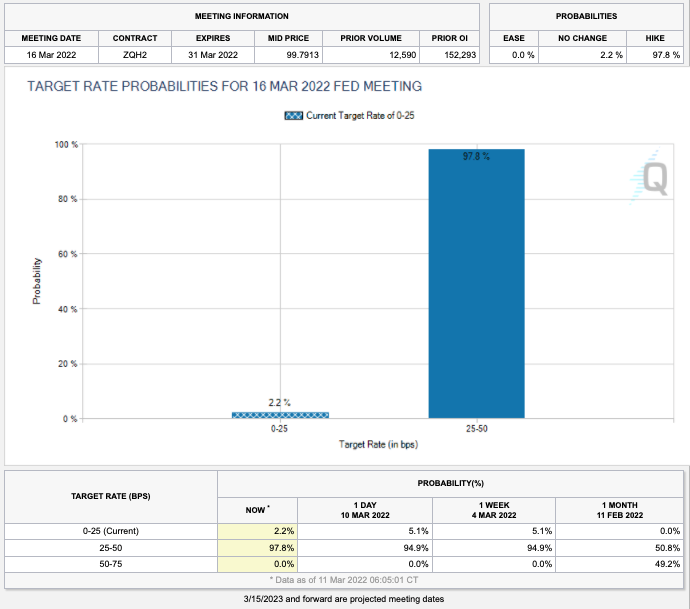
As revealed by metrics like CME Group Inc’s (NASDAQ: CME) FedWatch Tool, for instance, participants are pricing a high certainty of an increase in rates.
Graphic: Via CME Group Inc (NASDAQ: CME). Participants price in an increased probability of a shift in the target rate. Click here to access the FedWatch Tool.
“Yields are reflecting a surprise higher shift upward in inflation expectations,” said Morgan Stanley’s (NYSE: MS) Jim Caron. “Many thought inflation would peak in the first quarter and fall. Now, with oil prices, inflation may stay high.”
At the same time, there are some indications of market stresses.
Graphic: Via McClellan Financial Publications. “The Daily A-D Line for corporate high yield bonds continues to look quite ugly. That is a concern for the overall stock market because high yield bonds drink from the same liquidity pool as stocks do, and these bonds are arguably more sensitive than stocks are to liquidity problems.”
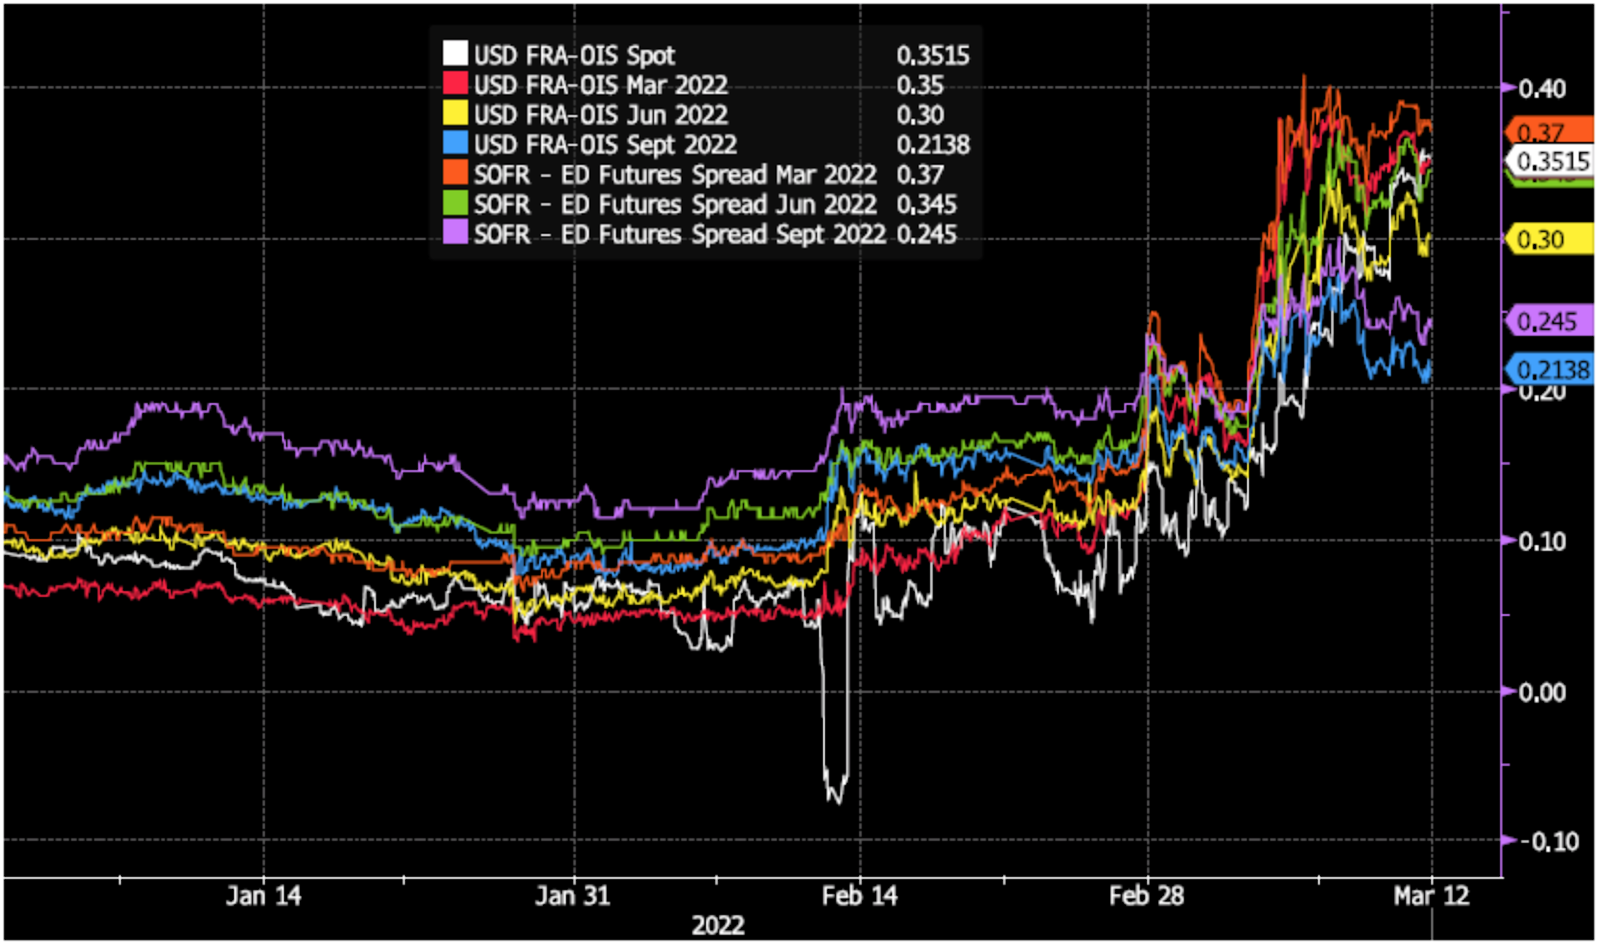
As explained in DC’s Chartbook discussion, however, “stress in money markets is for now mostly contained and not an imminent risk to financial sustainability.”
Graphic: Via DC’s Chartbook. Funding spreads “have stabilized over the past week, not making new highs after the gap-up open on March 7. These are encouraging signs that the stress in money markets is for now mostly contained and not an imminent risk to financial stability.”
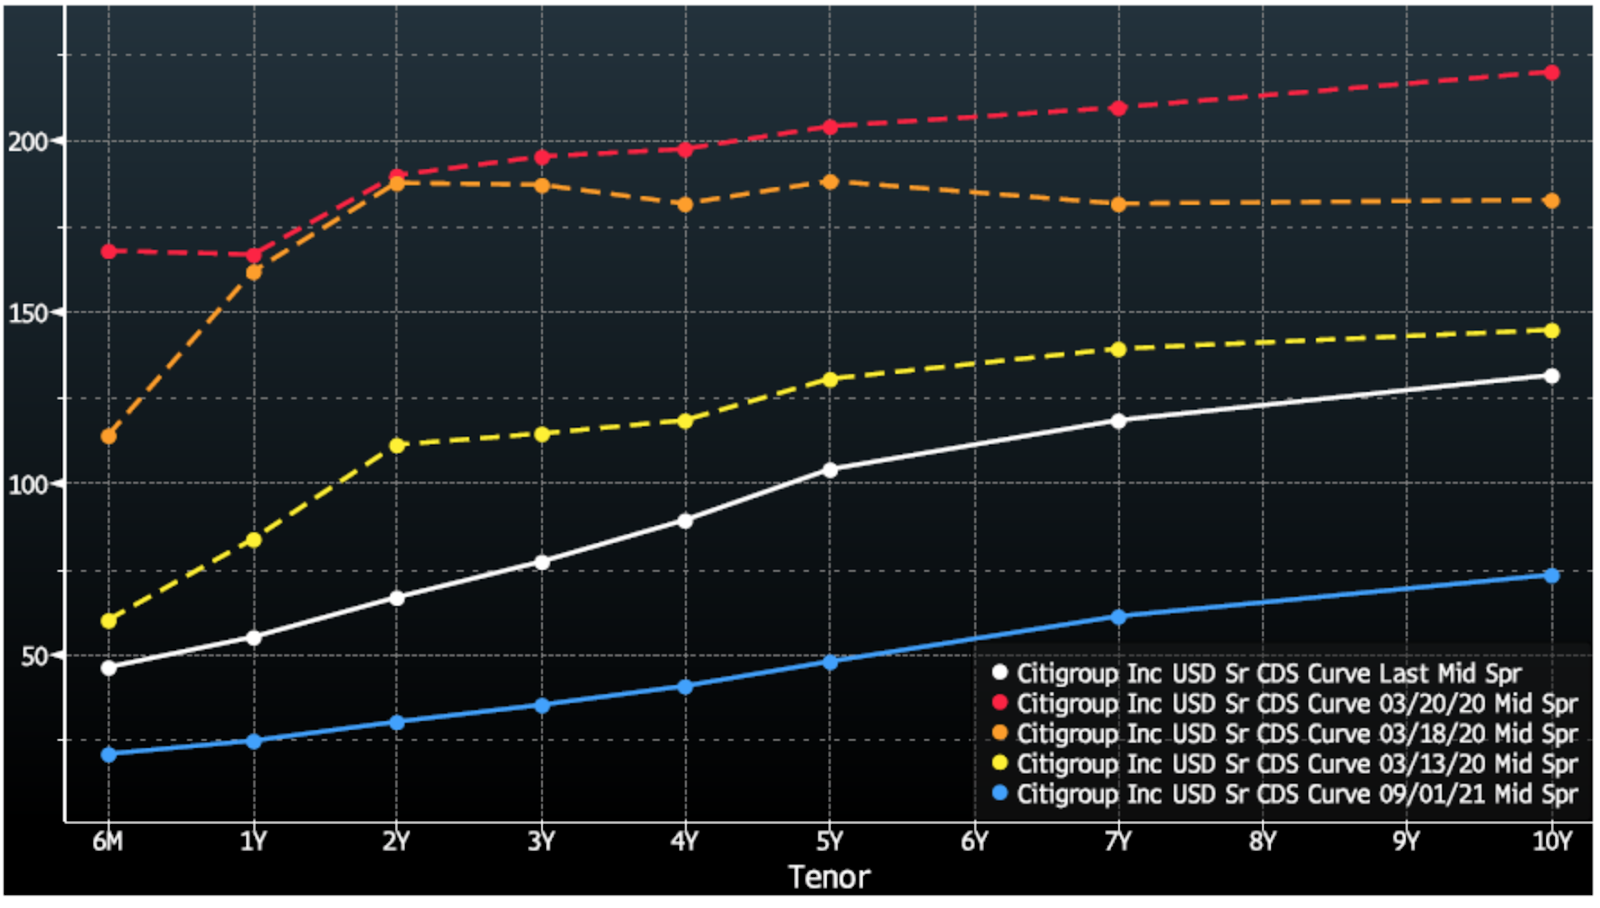
In regards to credit default swap spreads, though they are wider than in recent history, “they are still far below where they were during times of material solvency risk such as March of 2020, and the term structure of CDS spreads suggests this is more due to mechanical de-risking.”
Graphic: Via DC’s Chartbook. Cost of credit insurance for Citigroup Inc (NYSE: C). Hedging with CDS results in mechanical steepening which raises the curve. “This is in sharp contrast to the curve in March 2020 (yellow, orange, and red), when the short end of the CDS curve rose quickly and flattened the curve.”
Okay. So, the “financial system is functioning smoothly.” How do you trade slowing growth in the face of heightened inflation?
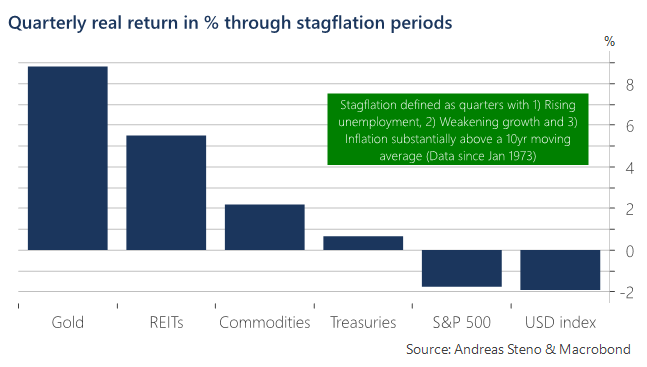
As Andreas Steno Larsen of Heimstaden explains, the “best way to assess this question is via a historical study of empirical returns during times of actual stagflation dating back to the early 1970s.”
Graphic: Via Andreas Steno Larsen. “Heatmap on quarterly inflation-adjusted returns across asset classes during stagflation periods (1973 – today).”
“Assets that tend to keep the value intact or even increase in real terms through stagflation are typically negatively correlated to low or negative real rates, which is why gold and real estate (REITs) are some of the best places to hide during stagflation,” Steno Larsen says.
“Equities overall struggle to perform in real terms and so do bonds, which might be even worse this time around due to the outset of bond yields into this potential stagflationary environment.”
To note, pursuant to the idea that participants have “priced in” the aforementioned, S&P Global Inc (NYSE: SPGI) data suggests “the initial stages of a monetary tightening cycle have not been disastrous for the U.S. stock market historically.”
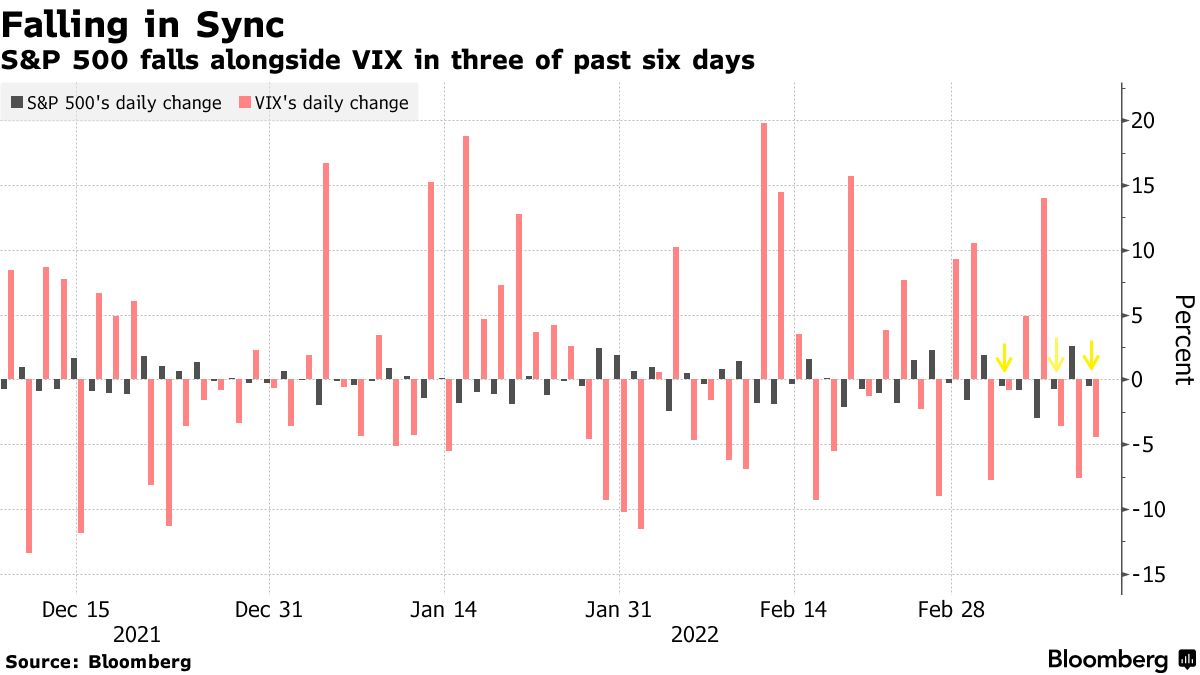
Positioning: Based on a comparison of present options positioning and buying metrics, the returns distribution is skewed positive.
This is in the face of an S&P 500 (INDEX: SPX) and Cboe Volatility Index (INDEX: VIX) down environment.
Graphic: Via Bloomberg. S&P 500 (INDEX: SPX) down, CBOE Volatility Index (INDEX: VIX) down.
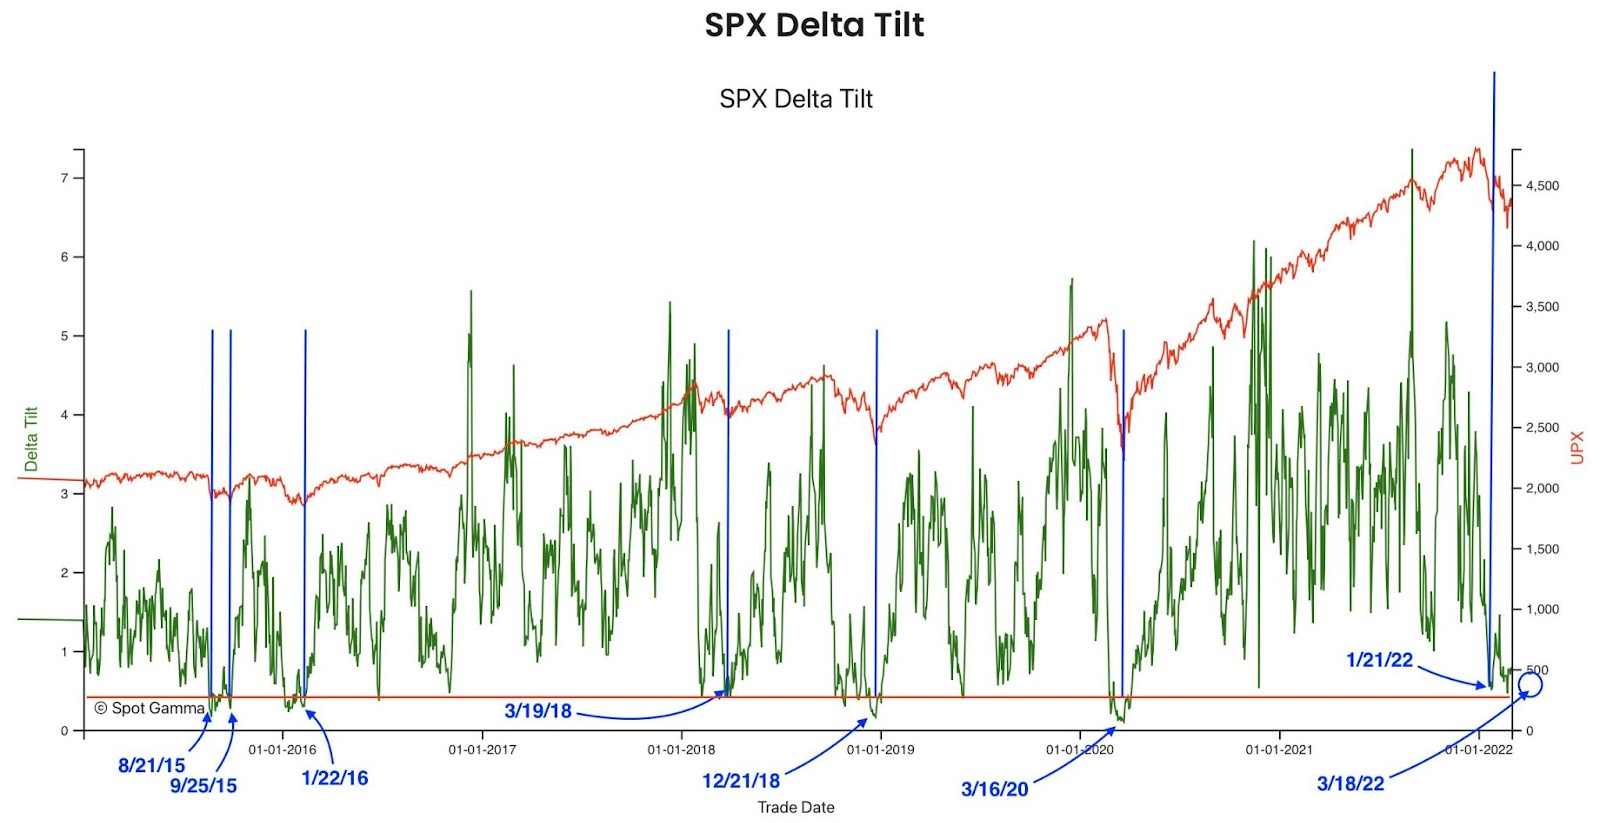
In part, this has to do with the supply and demand of protection; mainly, the market is “well hedged and well-positioned,” Amy Wu Silverman of Royal Bank of Canada’s (NYSE: RY) says.
Graphic: Via SpotGamma. “Netting call & put delta, you can see we’re near extremes in terms of put:call positions. Often large put positions are removed by expirations, which seems to coincide with market lows. Many of these are quarterly expirations which coincide w/FOMC meetings – such as next week.”
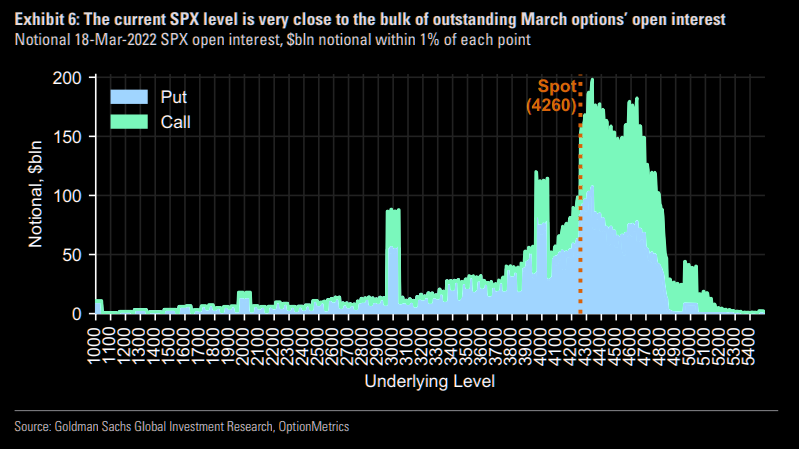
Given this, as JPMorgan Chase & Co (NYSE: JPM) analysts explain, “we could be closer to the end” of discretionary de-risking, and the compression of volatility (via passage of FOMC), as well as the removal of counterparty negative exposure (via OPEX) may serve to alleviate pressure.
Graphic: Via Goldman Sachs Group Inc (NYSE: GS). Taken from The Market Ear. “18-Mar has more expiring near-the-money SPX open interest than any expiration since 2019.”
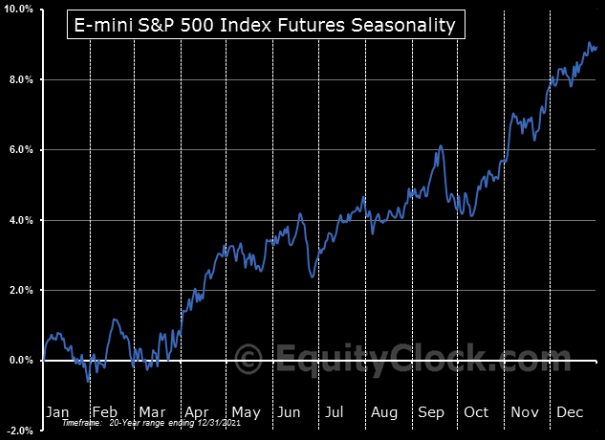
As SpotGamma, explains, “As it stands, without further geopolitical events causing, even more, fear, the markets are due for a relief rally,” on improving seasonality, among other things.
“Following the FOMC meeting, as well as the reduction in put-heavy exposures post-OPEX (options expiration), the need for put ownership (protection) and relative short positions is reduced (less positive delta = less selling to hedge = less pressure).”
Graphic: Via EquityClock. Taken from The Market Ear.
Technical: As of 6:30 AM ET, Monday’s regular session (9:30 AM – 4:00 PM ET), in the S&P 500, will likely open in the middle part of a positively skewed overnight inventory, inside of prior-range and -value, suggesting a limited potential for immediate directional opportunity.
In the best case, the S&P 500 trades higher; activity above the $4,227.75 high volume area (HVNode) puts in play the $4,249.25 low volume area (LVNode). Initiative trade beyond the LVNode could reach as high as the $4,285.25 and $4,314.75 HVNode, or higher.
In the worst case, the S&P 500 trades lower; activity below the $4,227.75 HVNode puts in play the $4,189.00 regular trade low (RTH Low). Initiative trade beyond the RTH Low could reach as low as the $4,138.75 and $4,101.25 overnight low (ONL), or lower.
Considerations: Participants resolve a pinch of two anchored volume-weighted average price indicators (VWAPs). A VWAP is a metric highly regarded by chief investment officers, among other participants, for quality of trade. Additionally, liquidity algorithms are benchmarked and programmed to buy and sell around VWAPs.
We look to buy above a flat/rising VWAP pinch. We look to sell below a flat/declining VWAP pinch.
Click here to load today’s key levels into the web-based TradingView charting platform. Note that all levels are derived using the 65-minute timeframe. New links are produced, daily.
Graphic: 65-minute profile chart of the Micro E-mini S&P 500 Futures.
Definitions
Overnight Rally Highs (Lows): Typically, there is a low historical probability associated with overnight rally-highs (lows) ending the upside (downside) discovery process.
Volume Areas: A structurally sound market will build on areas of high volume (HVNodes). Should the market trend for long periods of time, it will lack sound structure, identified as low volume areas (LVNodes). LVNodes denote directional conviction and ought to offer support on any test.
If participants were to auction and find acceptance into areas of prior low volume (LVNodes), then future discovery ought to be volatile and quick as participants look to HVNodes for favorable entry or exit.
POCs: POCs are valuable as they denote areas where two-sided trade was most prevalent in a prior day session. Participants will respond to future tests of value as they offer favorable entry and exit.
About
After years of self-education, strategy development, mentorship, and trial-and-error, Renato Leonard Capelj began trading full-time and founded Physik Invest to detail his methods, research, and performance in the markets.
Capelj is also a Benzinga finance and technology reporter interviewing the likes of Shark Tank’s Kevin O’Leary, JC2 Ventures’ John Chambers, FTX’s Sam Bankman-Fried, and ARK Invest’s Catherine Wood, as well as a SpotGamma contributor developing insights around impactful options market dynamics.
Disclaimer
Physik Invest does not carry the right to provide advice.
In no way should the materials herein be construed as advice. Derivatives carry a substantial risk of loss. All content is for informational purposes only.