Categories
Commentary

Daily Brief For April 1, 2022

The Daily Brief is a free glimpse into the prevailing fundamental and technical drivers of U.S. equity market products. Join the 200+ that read this report daily, below!

What Happened

Overnight, equity index futures auctioned sideways to higher after their late-day liquidation and break from a multi-day consolidation area on technical factors (e.g., options expirations) among other things, potentially, like the increase in personal consumption expenditures.

Broadly speaking, the narrative that investors are showing some concern over the economic outlook, with respect to geopolitical tension and monetary policy, continues to emanate. 

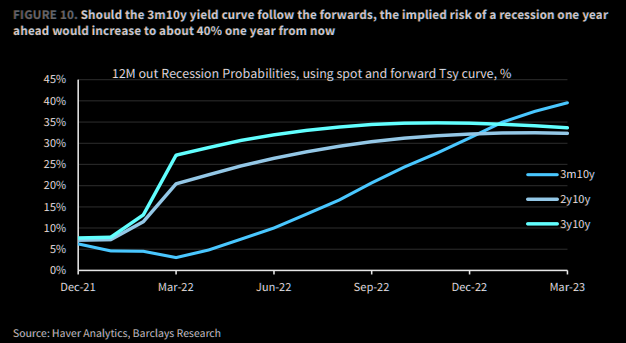
U.S. high-grade bonds shed over 5%, booking the worst quarterly performance since the ‘80s. This is as recession risks have risen more than two-fold. 

Notwithstanding, the Federal Reserve’s (Fed) favorite yield curve metric remains steep; per a Bloomberg commentary, “the gap between the three-month bill rates and 10-year yields is the ‘most useful term spread for forecasting recessions,’ … [and] it currently stands at 186 basis points, versus negative 2 basis points on 2s10s.”

In terms of news, the U.K. will join the U.S. in releasing oil from its reserves to lower prices and reduce its reliance on external partners. This helped ease futures calendar spreads on oil, Reuters’ John Kemp said in a newsletter to followers; the “six-month spread [narrowing] to a backwardation of $9 per barrel, the lowest since before Russia’s invasion of Ukraine.”

Ahead is data on nonfarm payrolls, the unemployment rate and average hourly earnings, as well as labor-force participation (8:30 AM ET). Thereafter, the Chicago Fed’s Charles Evans is scheduled to speak (9:05 AM ET). 

Later is Markit manufacturing PMI (9:45 AM ET), as well as ISM manufacturing index and consumer spending data (10:00 AM ET).

Graphic updated 6:30 AM ET. Sentiment Neutral if expected /ES open is inside of the prior day’s range. /ES levels are derived from the profile graphic at the bottom of the following section. Levels may have changed since initially quoted; click here for the latest levels. SqueezeMetrics Dark Pool Index (DIX) and Gamma (GEX) calculations are based on where the prior day’s reading falls with respect to the MAX and MIN of all occurrences available. A higher DIX is bullish. At the same time, the lower the GEX, the more (expected) volatility. Learn the implications of volatility, direction, and moneyness. SHIFT data used for S&P 500 (INDEX: SPX) options activity. Note that options flow is sorted by the call premium spent; if more positive, then more was spent on call options. Breadth reflects a reading of the prior day’s NYSE Advance/Decline indicator. VIX reflects a current reading of the CBOE Volatility Index (INDEX: VIX) from 0-100.

What To Expect

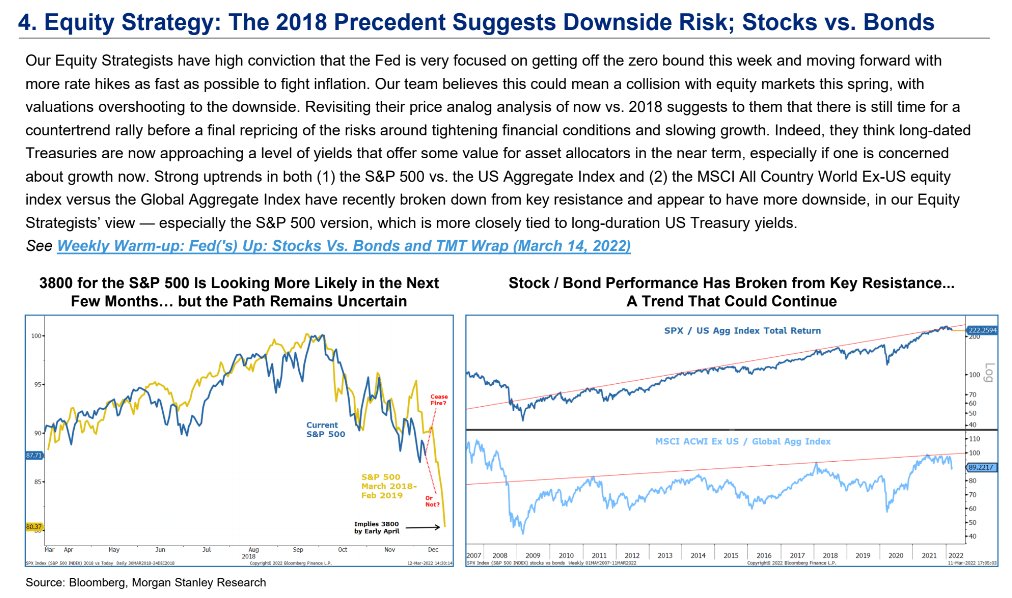
Fundamental: The S&P 500 bagged its first quarterly loss in two years as recession probabilities, implied by some yield curves, have risen.

Graphic: Via Barclays. Taken from The Market Ear. “[T]he 1y ahead recession probability implied by the 3m10y curve rises to about 40% a year from now (so for an early 2024 recession), slightly higher than implied by other curves.”

This is as the stock performance, relative to bonds against the lagged spread of 10- and 2-year bond yields, is expected to be weak, according to insights by Pictet Asset Management.

Graphic; Via Pictet Asset Management Ltd. Taken from Bloomberg. “On this basis, stocks’ great outperformance this quarter may end up looking like a head-fake.”

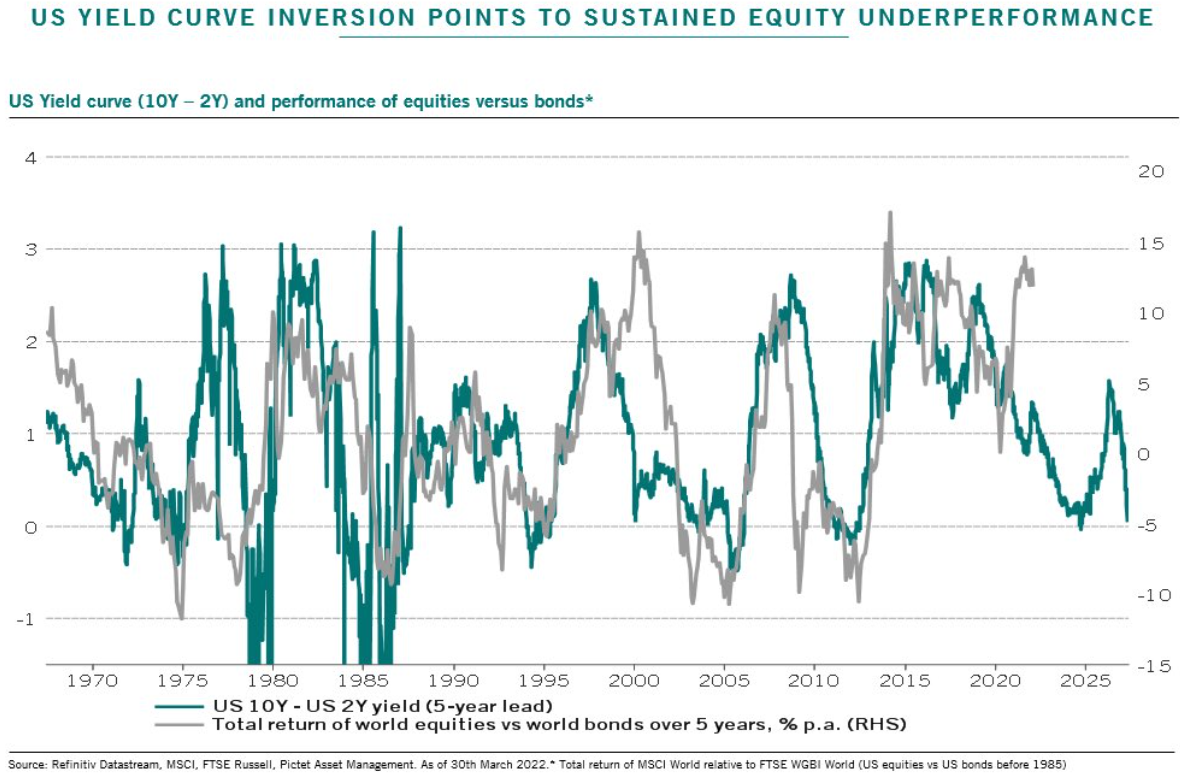
Pictet’s narrative further validates some of the theses shared by institutions like Brevan Howard Asset Management, which is having one of its best years, Morgan Stanley (NYSE: MS), Goldman Sachs Group Inc (NYSE: GS), and Bank of America Corporation (NYSE: BAC).

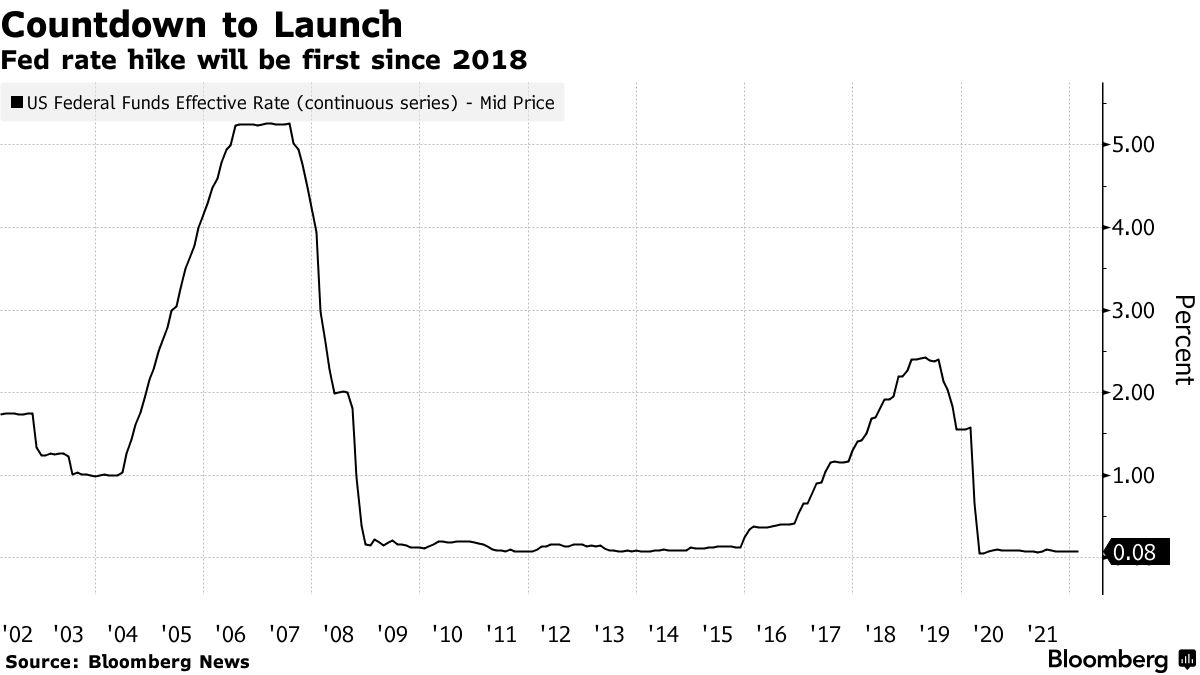
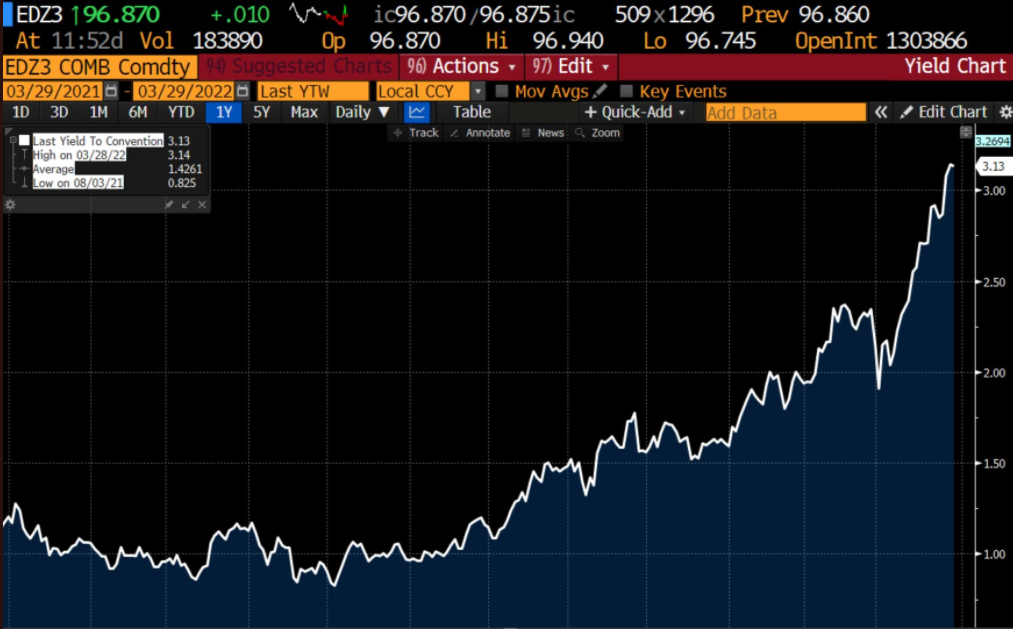
Adding to the prospects for weaker earnings amid higher costs, among other things, some of these institutions see the potential for the Fed’s terminal rate to reach between 3% and 3.25%.

Graphic: Via Andreas Steno Larsen. “The Fed is now priced to hike to levels above 3% by Dec-2023, … which is the main reason why we have seen a sell-off in all assets with an intensive duration profile over the past 12-15 months … [and has] duration intensive assets … starting to look attractive again from a risk/reward perspective.”

This would hit valuations as higher yields both reduce the present value of future earnings and “hurt those carrying the highest leverage,” potentially playing into a slowdown or recession. 

Graphic: Via S&P Global Inc (NYSE: SPGI) “expects the economic damage [of geopolitics and pricing pressures] to lower U.S. GDP growth to 3.2% this year, matching its preliminary forecast in early March but a full 70 bps lower than its November forecast of 3.9%.”

“Now rates volatility can drive growth volatility and that actually becomes a vicious cycle between the two,” said Christian Mueller-Glissmann of Goldman Sachs. 

“That’s a big difference to the last cycle where growth volatility drove rates volatility.”

Graphic: Via Vanda. Taken from The Market Ear. “The bond market is pricing the 2022 cycle to be remarkably fast. Macro Alf: ‘Remember: sharp changes in borrowing conditions often cause non-linear reactions in a highly leveraged system.’”

However, this is as the dominance of rate-sensitive tech stocks is set to shrink next year amid sector reclassifications, as well as still-stimulative policy and beats of economic expectations that may feed into earnings surprises, later.

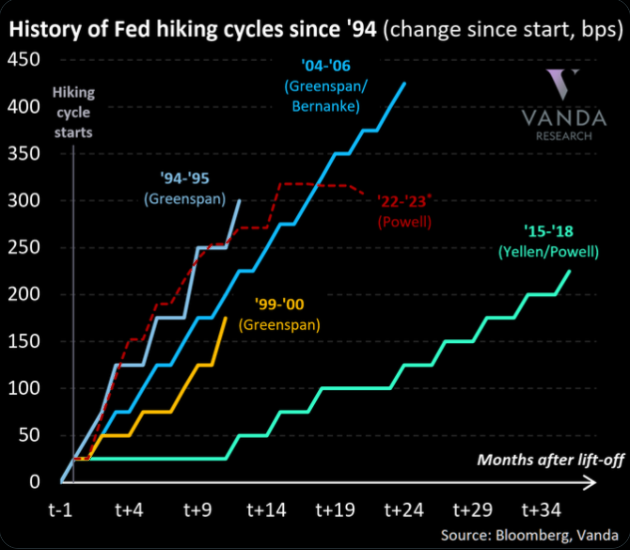
JPMorgan’s Marko Kolanoivc explains that (1) “both equity and credit markets have historically fared well at the start of monetary tightening cycles,” (2) “the real policy rate is extremely negative and thus stimulative,” and (3) “not all central banks are tightening.”

Morgan Stanley’s Michael Wilson vehemently disagrees suggesting the recent equity market turnaround “was nothing more than a vicious bear market rally,” and offers participants a clear opportunity to sell at better prices.

Taking all of the above comments and perspectives together, one thing is for certain: this period in history is like no other. It makes sense to pick a timeframe and stick with it. 

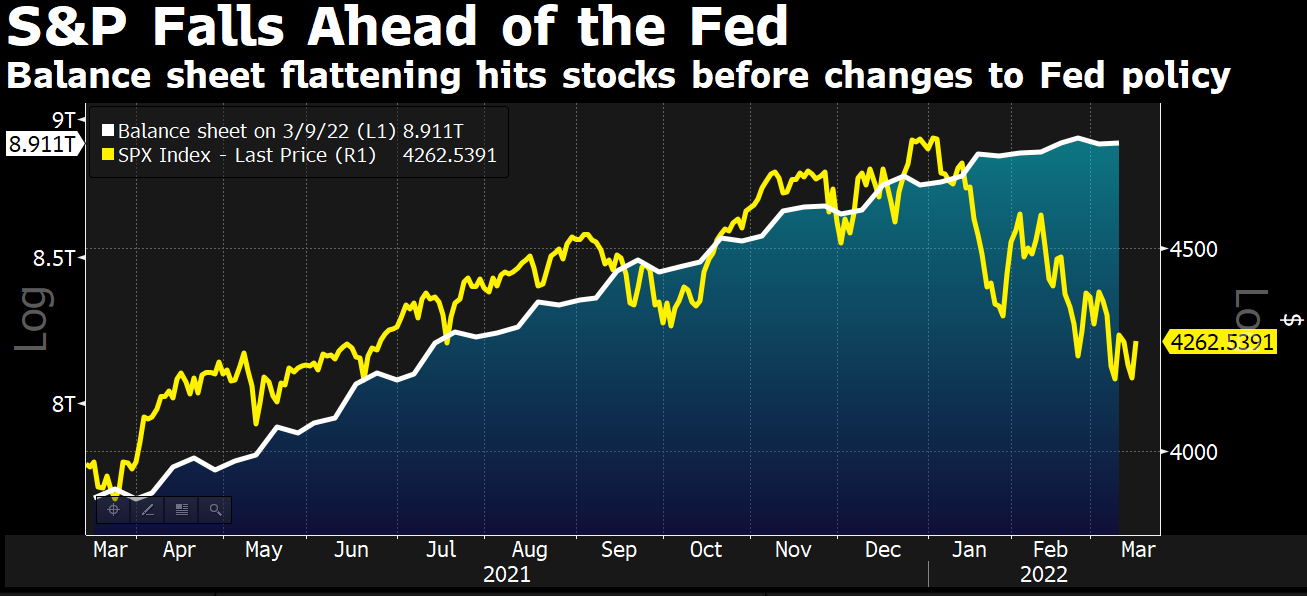
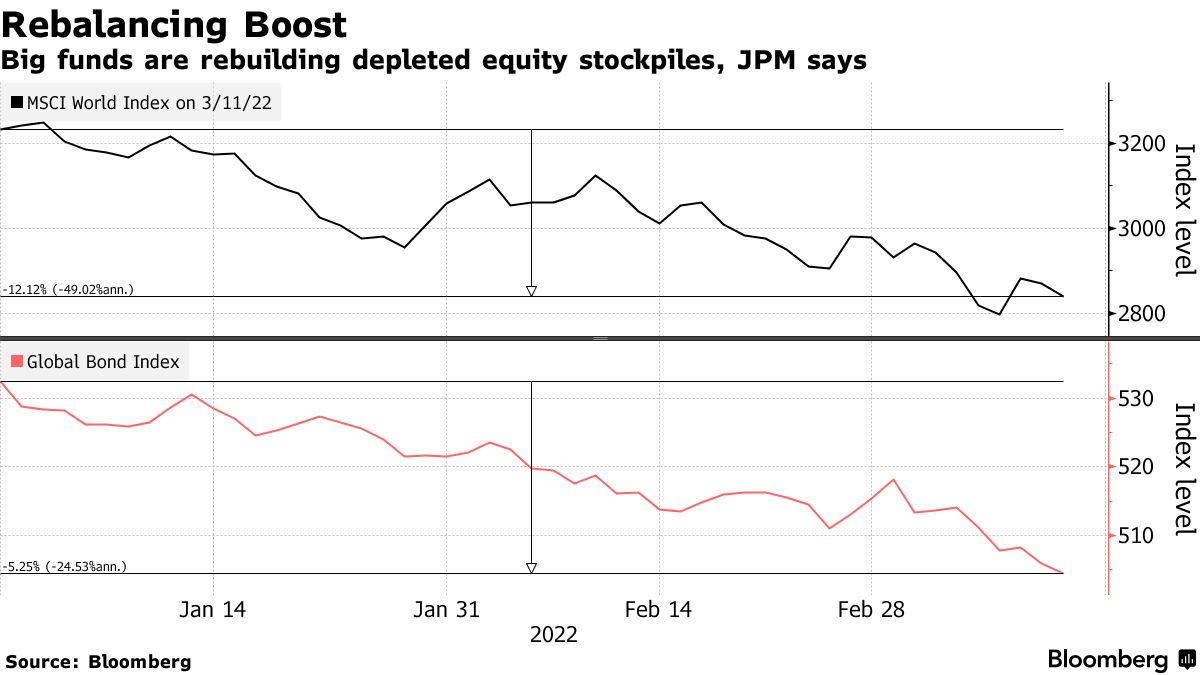
Positioning: In the past weeks, according to JPMorgan Chase & Co’s Nikolaos Panigirtzoglou, the supportive “rebalancing flows away from bonds into equities” are no more and, therefore, equities are subject to increased vulnerabilities “if bond yields continue to rise.”

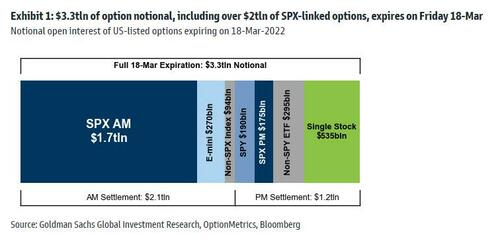
This is after measures of equity implied volatility were crushed heading through the mid-March FOMC and monthly options expiry (OPEX) events, and the options hedging impact of this, at least, was very supportive, as we’ve talked about many times in this newsletter.

Graphic: Via Bloomberg. “The CBOE-VIX index, measuring stock volatility from the options market, unsurprisingly spiked immediately after Russia’s attack. It reached another high three weeks ago. Then the VIX started to fall, and in the two weeks since the Fed unveiled its first rate hike in years, the decline has been almost linear. The ‘fear gauge,’ as it is often known, is now significantly lower than it was a week before the invasion, when markets were priced on the assumption that there would be no war.”

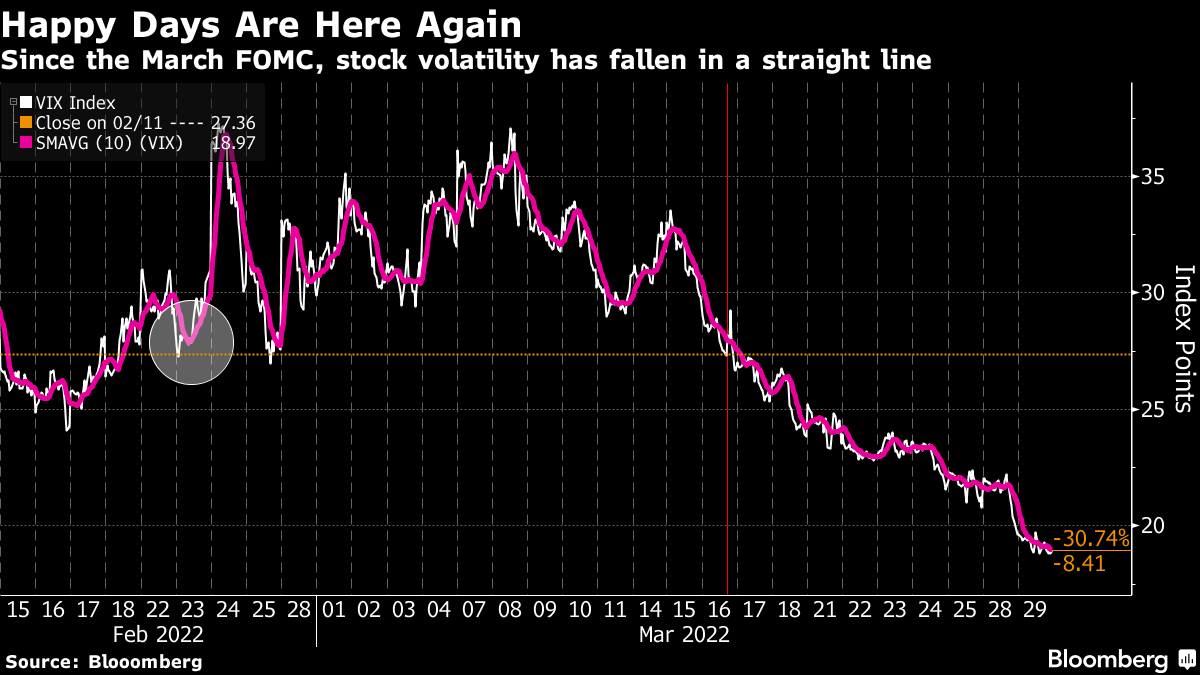
On the contrary, measures of volatility for other assets, like the Merrill Lynch Options Volatility Estimate (INDEX: MOVE), a useful measure of bond market sentiment, are doing the opposite. 

We discussed early last month, what we saw was an increased supply of equity market volatility, as a potential reason for some of these divergences. 

As Bloomberg’s John Authers explained well, it, too, could have been “an aggressive central bank” that prompted a move out of bonds and into equities, and subdued target-date fund rebalancing flows which usually sell stocks and buy bonds.

Graphic: Via Bloomberg.

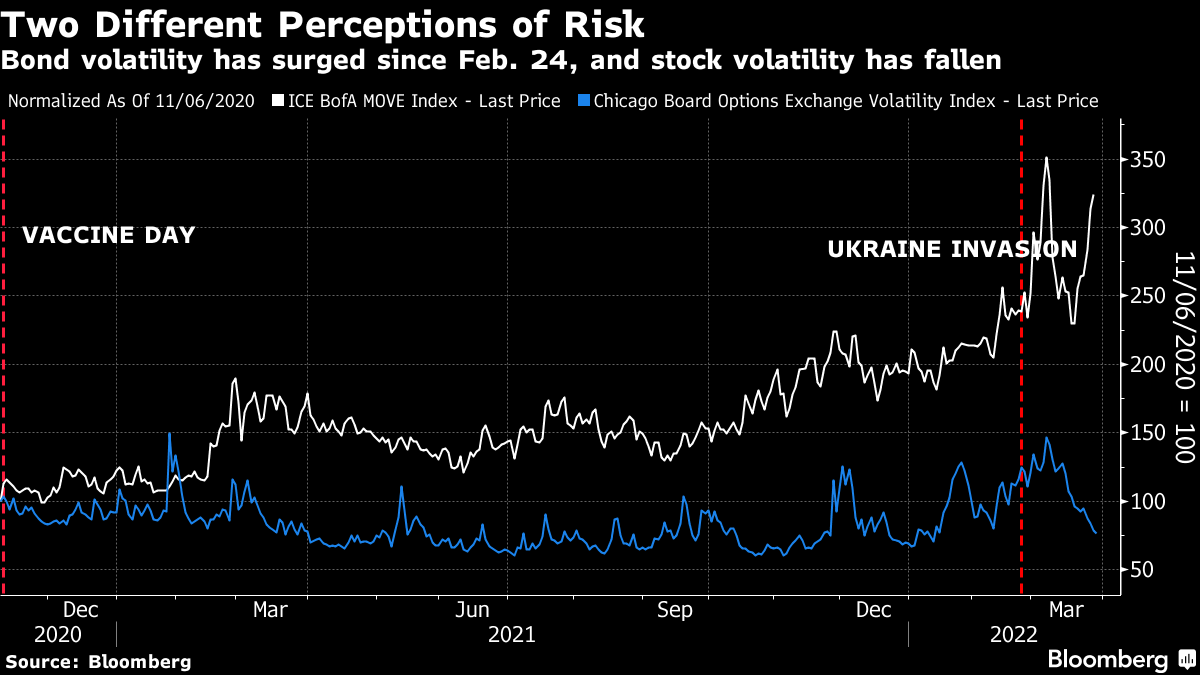
“[I]t looks as though the contradictions that had built up in the market over the last two years, and in the decade before that, are being put under extreme stress by the double whammy of a newly aggressive Federal Reserve, and the worst geopolitical shock in decades,” Authers adds.

Still, realized volatility continues to trend down which ought to force those (e.g., computer-driven traders) who position (and size equity exposure) based on underlying volatility to load up, again.

Nomura Holdings Inc’s (NYSE: NMR) Charlie McElligott explains that “volatility-targeting funds and trend-following commodity trading advisers, purchased” billions of equity futures which bolstered the price rise of the last weeks.

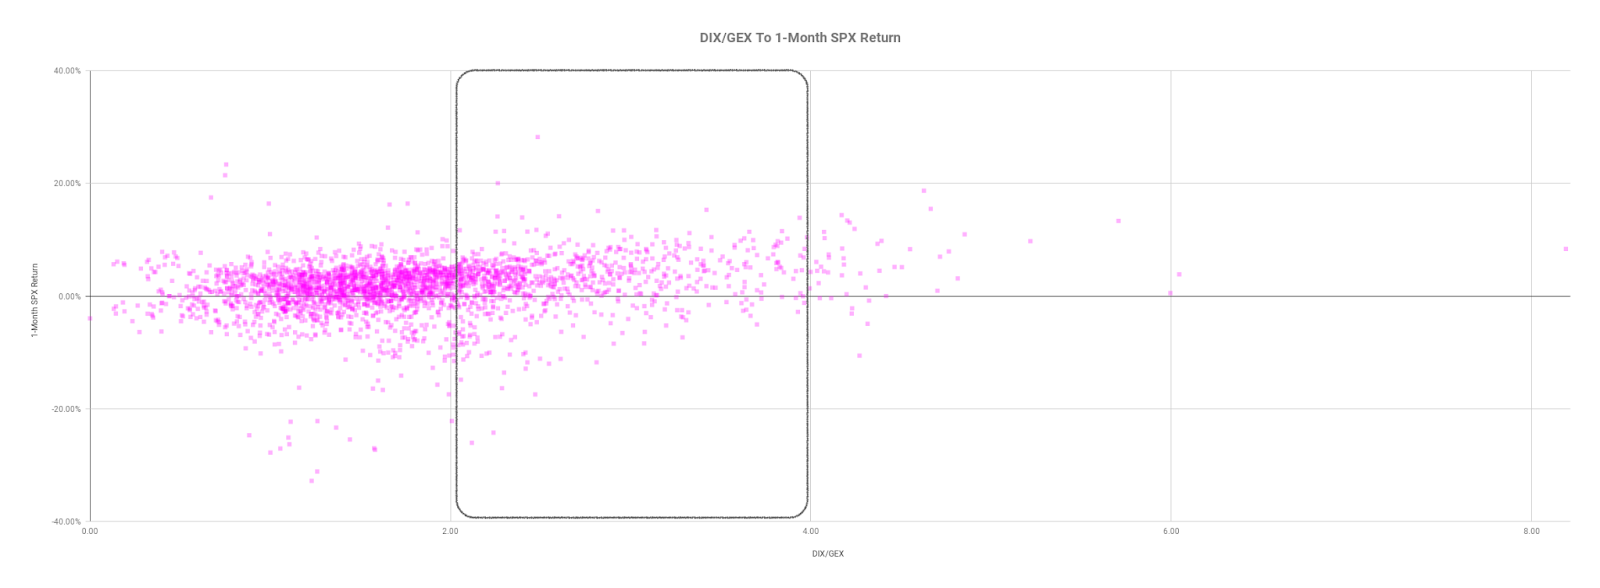
From a positioning versus buying support perspective, the forward returns distribution is skewed positive but not by a lot; a lot of the supportive options exposure is rolling-off and this could free up (i.e., unpin) indexes for the next leg up or down.

Graphic: SpotGamma’s Hedging Impact of Real-Time Options Indicator shows negative delta trade in the S&P 500 SPY ETF, and this pressured the underlying index.

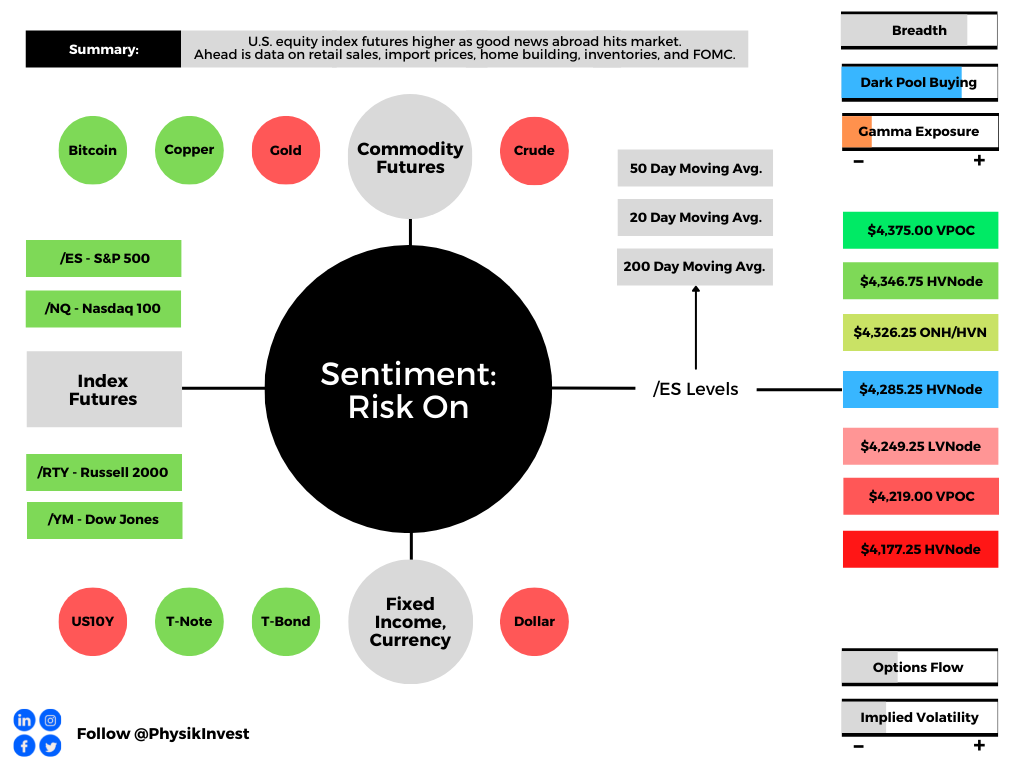
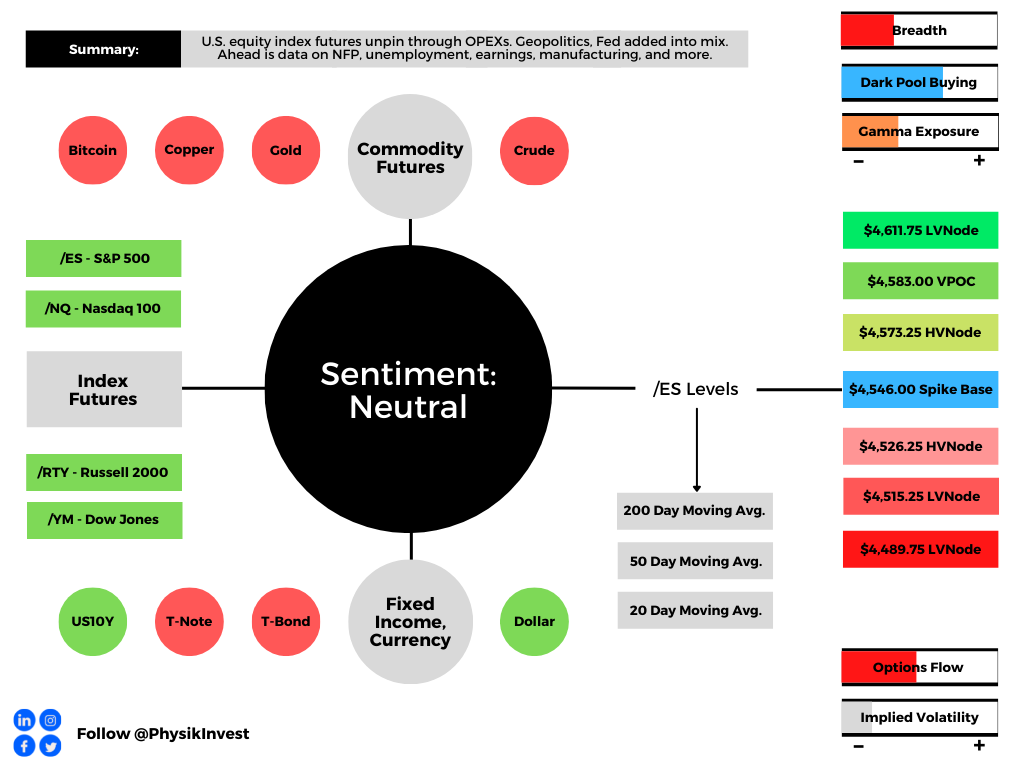
Technical: As of 6:30 AM ET, Friday’s regular session (9:30 AM – 4:00 PM ET), in the S&P 500, will likely open in the upper part of a positively skewed overnight inventory, inside of prior-range and -value, suggesting a limited potential for immediate directional opportunity.

In the best case, the S&P 500 trades higher; activity above the $4,546.00 spike base puts in play the $4,573.25 high volume area (HVNode). Initiative trade beyond the HVNode could reach as high as the $4,583.00 untested point of control (VPOC) and $4,611.75 low volume area (LVNode), or higher.

In the worst case, the S&P 500 trades lower; activity below the $4,546.00 spike base puts in play the $4,526.25 HVNode. Initiative trade beyond the HVNode could reach as low as the $4,515.25 and $4,489.75 LVNodes, or lower.

Considerations: A change in the market (i.e., the transition from two-time frame trade, or balance, to one-time frame trade, or trend) occurred.

Continue to monitor for acceptance outside of the balance area. Rejection (i.e., return inside of balance) portends a move to the opposite end of the balance. See the below graphic for more.

Click here to load today’s key levels into the web-based TradingView charting platform. Note that all levels are derived using the 65-minute timeframe. New links are produced, daily.
Graphic: 65-minute profile chart of the Micro E-mini S&P 500 Futures.

What People Are Saying

Definitions

Volume Areas: A structurally sound market will build on areas of high volume (HVNodes). Should the market trend for long periods of time, it will lack sound structure, identified as low volume areas (LVNodes). LVNodes denote directional conviction and ought to offer support on any test. 

If participants were to auction and find acceptance into areas of prior low volume (LVNodes), then future discovery ought to be volatile and quick as participants look to HVNodes for favorable entry or exit.

Gamma: Gamma is the sensitivity of an option to changes in the underlying price. Dealers that take the other side of options trades hedge their exposure to risk by buying and selling the underlying. When dealers are short-gamma, they hedge by buying into strength and selling into weakness. When dealers are long-gamma, they hedge by selling into strength and buying into weakness. The former exacerbates volatility. The latter calms volatility.

POCs: POCs are valuable as they denote areas where two-sided trade was most prevalent in a prior day session. Participants will respond to future tests of value as they offer favorable entry and exit.

Options Expiration (OPEX): Marks change in dealer gamma exposure. 

Volume-Weighted Average Prices (VWAPs): A metric highly regarded by chief investment officers, among other participants, for quality of trade. Additionally, liquidity algorithms are benchmarked and programmed to buy and sell around VWAPs.

About

After years of self-education, strategy development, mentorship, and trial-and-error, Renato Leonard Capelj began trading full-time and founded Physik Invest to detail his methods, research, and performance in the markets.

Capelj also develops insights around impactful options market dynamics at SpotGamma and is a Benzinga reporter.

Some of his works include conversations with ARK Invest’s Catherine Wood, investors Kevin O’Leary and John Chambers, FTX’s Sam Bankman-Fried, Kai Volatility’s Cem Karsan, The Ambrus Group’s Kris Sidial, among many others.

Disclaimer

In no way should the materials herein be construed as advice. Derivatives carry a substantial risk of loss. All content is for informational purposes only.

Categories
Commentary

Daily Brief For March 16, 2022

Editor’s Note: The Daily Brief is a free glimpse into the prevailing fundamental and technical drivers of U.S. equity market products. Join the 200+ that read this report daily, below!

What Happened

Stock index futures were higher after positive developments, abroad.

According to some reports, the talks between Russia and Ukraine are making progress. This is while China vows to stabilize markets with a promise “to ease a regulatory crackdown, support property, and technology companies and stimulate the economy.”

On the China news, the Hang Seng China Enterprises Index (INDEX: HSCEI) rose ~13% (in the context of a ~30% 1-month drawdown).

At home, in the U.S., the Federal Reserve is expected to increase rates by a quarter-point, the first since 2018. Markets are pricing up to seven hikes this year.

Ahead is data on retail sales and import prices (8:30 AM ET). The NAHB home builders index and business inventories (10:00 AM ET). As well as the Federal Open Market Committee (FOMC) announcement (2:00 PM ET) and press conference (2:30 PM ET).

Graphic updated 6:30 AM ET. Sentiment Risk-On if expected /ES open is above the prior day’s range. /ES levels are derived from the profile graphic at the bottom of the following section. Levels may have changed since initially quoted; click here for the latest levels. SqueezeMetrics Dark Pool Index (DIX) and Gamma (GEX) calculations are based on where the prior day’s reading falls with respect to the MAX and MIN of all occurrences available. A higher DIX is bullish. At the same time, the lower the GEX, the more (expected) volatility. Learn the implications of volatility, direction, and moneyness. SHIFT data used for S&P 500 (INDEX: SPX) options activity. Note that options flow is sorted by the call premium spent; if more positive, then more was spent on call options. Breadth reflects a reading of the prior day’s NYSE Advance/Decline indicator. VIX reflects a current reading of the CBOE Volatility Index (INDEX: VIX) from 0-100.

What To Expect

Fundamental: The 60/40 portfolio is headed for its worst performance since the financial crisis of 2008 as assets are hurt by a mix of slowing economic growth and inflation.

Graphic: Via Morgan Stanley (NYSE: MS). Stocks and bond relationship upended. Adding, per a Bank of America Corporation (NYSE: BAC) survey, participants believe the markets would have to fall 24% (from peak to trough) – $3,636.00 SPX – to solicit a Fed pivot.

Further, this letter has talked about the “bonds down, equities down” phenomenon before. To borrow from letters published over the past two months, in short, over the past 40 or so years, monetary policy was used as a crutch to support the economy. 

Graphic: Via tastytrade. Asset correlations matrix.

This promoted deflation, innovation, and the subsequent rise in valuations.

With rates lifting, that’s a headwind; coupled with participants’ increased exposure to rate and equity market risk, which can play into cross-market hedging and de-leveraging cascades, 60/40 turns into somewhat of a poor hedge.

Why? Let’s back up for a moment.

For an investor to take on additional risk for return, they must receive in excess of the risk-free rate (as provided by the Treasury). This excess is the risk premium.

As Investopedia details well, therefore, “the total return on a stock is the sum of two parts: the risk-free rate and the risk premium.”

Moreover, higher rates and risk premiums increase the required rate of return.

Higher interest rates, basically, decrease the present value of future cash flows, making stocks, especially those that are high growth, less attractive.

So, at higher rates, shares should fall. At lower rates, shares should rise. Some strategists estimate that annual returns for 60/40 will be less than 5% over the next decade, as a result.

Graphic: Via Bloomberg. The FOMC is likely to signal more hikes.

This conversation has me bringing up a conversation I had with Karan Sood, the CEO and Managing Director, Head of Product Development at Cboe Vest Financial LLC.

“Bonds have been giving you really good returns because interest rates have been going down since the 1970s when they peaked at about 11%,” Sood explained to me. 

“That’s changing now; we’re at the zero bound, and it’s unlikely that will be as a strong of a tailwind. Worse, it could be a headwind if interest rates start to rise.”

Graphic: Via Bloomberg. Federal Reserve to raise rates for the first time in years.

In regards to the Federal Reserve’s balance sheet, Bloomberg explains that participants ought to receive updates on the pace of buying, as well as the sale of assets.

“That may include setting out caps on how many billions of dollars worth of Treasuries and mortgage-backed securities will be allowed to mature every month without reinvestment, something that Powell told Congress earlier this month would be discussed at this meeting.”

Graphic: Via Bloomberg. S&P 500 participants proactively price in the Federal Reserve’s intent to cut support. It is monetary frameworks and max liquidity that enabled markets to diverge from fundamentals.

Positioning: Based on a comparison of present options positioning and buying metrics, the returns distribution remains skewed positive.

Graphic: Via Physik Invest. Data via SqueezeMetrics.

Pursuant to the buying support remark, JPMorgan Chase & Co (NYSE: JPM) strategists say pension and sovereign wealth funds, in rebuilding risk-on positions, may boost markets by as much as 10%. 

“It’s the biggest rebalancing since 2020 in terms of buying equities,” JPMorgan strategist Nikolaos Panigirtzoglou said. An inflow of at least $100 billion and as much as $230 billion could trigger gains of between 5% and 10% to global stocks, he said.

Graphic: Via Bloomberg. “[D]eclines have driven down the value of targeted allocations for the world’s biggest funds, many of which hew to a traditional mix of 60% stocks and 40% bonds. To address the shortfall, they have to buy equities.”

At the same time, expected is further compression of volatility (via the passage of FOMC), as well as the removal of customer puts (and associated hedging pressures) via OPEX (options expiration).

Graphic: Via Goldman Sachs Group Inc (NYSE: GS). 

To note, there is the potential, according to SpotGamma, for some “path dependency,” as “the expiration and/or covering of a large swath of these put hedges may place the market back into an ‘underhedged’ position.” 

In such a case, new demand would add fuel to weakness.

Technical: As of 6:30 AM ET, Wednesday’s regular session (9:30 AM – 4:00 PM ET), in the S&P 500, will likely open in the upper part of a positively skewed overnight inventory, outside of prior-range and -value, suggesting a potential for immediate directional opportunity.

Gap Scenarios: Gaps ought to fill quickly. Should they not, that’s a signal of strength; do not fade. Leaving value behind on a gap-fill or failing to fill a gap (i.e., remaining outside of the prior session’s range) is a go-with indicator.

Auctioning and spending at least 1-hour of trade back in the prior range suggests a lack of conviction; in such a case, do not follow the direction of the most recent initiative activity.

In the best case, the S&P 500 trades higher; activity above the $4,285.25 high volume area (HVNode) puts in play the $4,326.25 overnight high (ONH). Initiative trade beyond the ONH could reach as high as the $4,346.75 HVNode and $4,375.00 untested point of control (VPOC), or higher.

In the worst case, the S&P 500 trades lower; activity below the $4,285.25 HVNode puts in play the $4,249.25 low volume area (LVNode). Initiative trade beyond the LVNode could reach as low as the $4,219.00 VPOC and $4,177.25 HVNode, or lower.

Considerations: Push-and-pull, as well as responsiveness near key-technical areas (that are discernable visually on a chart), suggests technically-driven traders with short time horizons are very active. 

Such traders often lack the wherewithal to defend retests and, additionally, the type of trade may be indicative of the other time frame participants waiting for more information to initiate trades.

Click here to load today’s key levels into the web-based TradingView charting platform. Note that all levels are derived using the 65-minute timeframe. New links are produced, daily.
Graphic: 65-minute profile chart of the Micro E-mini S&P 500 Futures.

Definitions

Overnight Rally Highs (Lows): Typically, there is a low historical probability associated with overnight rally-highs (lows) ending the upside (downside) discovery process.

Volume Areas: A structurally sound market will build on areas of high volume (HVNodes). Should the market trend for long periods of time, it will lack sound structure, identified as low volume areas (LVNodes). LVNodes denote directional conviction and ought to offer support on any test. 

If participants were to auction and find acceptance into areas of prior low volume (LVNodes), then future discovery ought to be volatile and quick as participants look to HVNodes for favorable entry or exit.

About

After years of self-education, strategy development, mentorship, and trial-and-error, Renato Leonard Capelj began trading full-time and founded Physik Invest to detail his methods, research, and performance in the markets.

Capelj is also a Benzinga finance and technology reporter interviewing the likes of Shark Tank’s Kevin O’Leary, JC2 Ventures’ John Chambers, FTX’s Sam Bankman-Fried, and ARK Invest’s Catherine Wood, as well as a SpotGamma contributor developing insights around impactful options market dynamics.

Disclaimer

Physik Invest does not carry the right to provide advice.

In no way should the materials herein be construed as advice. Derivatives carry a substantial risk of loss. All content is for informational purposes only.

Categories
Commentary

Daily Brief For February 17, 2022

Editor’s Note: The Daily Brief is a free glimpse into the prevailing fundamental and technical drivers of U.S. equity market products. Join the 200+ that read this report daily, below!

What Happened

Overnight, equity index futures were range-bound inside of a larger developing balance area. 

Volatility remains heightened in the face of conflicting narratives surrounding Russka-Ukraine and action by the Federal Reserve.

Ahead is data on jobless claims, building permits, housing starts, and the Philadelphia Fed Manufacturing Index (8:30 AM ET). 

Fed-speak follows. James Bullard will speak at 11:00 AM ET and Loretta Mester at 5:00 PM ET.

Below we discuss the implications of unprecedented Fed action and a “new Volcker moment,” positioning, and more.

Graphic updated 6:50 AM ET. Sentiment Neutral if expected /ES open is inside of the prior day’s range. /ES levels are derived from the profile graphic at the bottom of the following section. Levels may have changed since initially quoted; click here for the latest levels. SqueezeMetrics Dark Pool Index (DIX) and Gamma (GEX) calculations are based on where the prior day’s reading falls with respect to the MAX and MIN of all occurrences available. A higher DIX is bullish. At the same time, the lower the GEX, the more (expected) volatility. Learn the implications of volatility, direction, and moneyness. SHIFT data used for S&P 500 (INDEX: SPX) options activity. Note that options flow is sorted by the call premium spent; if more positive, then more was spent on call options. Breadth reflects a reading of the prior day’s NYSE Advance/Decline indicator. VIX reflects a current reading of the CBOE Volatility Index (INDEX: VIX) from 0-100.

What To Expect

Fundamental: Minutes of the January 25-26 Federal Open Market Committee meeting were released, yesterday. 

Per Bloomberg, “persistent real wage growth in excess of productivity growth that could trigger inflationary wage-price dynamics,” among other risks, participants responded positively to what seems to be overall “less-hawkish” narratives.

The yield curve steepened (i.e., the spread between long- and short-rates widened), shortly after, given sentiment that the Fed may be less inclined to raise rates than once priced in.

Graphic: Via Bloomberg.

The minutes said, however, that “if inflation does not move down as they expect, it would be appropriate for the Committee to remove policy accommodation at a faster pace than they currently anticipate. Some participants commented on the risk that financial conditions might tighten unduly in response to a rapid removal of policy accommodation.”

Moreover, Fed action today is in opposition to what has been done before

In the past, “the Fed used rate hikes to engineer recessions that generated the slack needed to keep inflation in check (‘opportunistic disinflation’),” Credit Suisse Group AG’s (NYSE: CS) Zoltan Pozsar says.

“With the Fed’s ‘updated dual mandate’ of inclusive low unemployment and the political imperative of redistribution through firmer wage growth at the bottom of the income distribution, the Fed aiming to slow inflation via a recession is unimaginable. Hikes today then are meant to slow inflation without a recession … which is not something that the Fed has ever managed.”

With that, the Fed has “no control over goods prices unless they curb demand through a recession,” the note adds. However, “they have a lot of control over services inflation – which, unlike goods inflation, is mainly a function of domestic nominal factors.”

Components of services inflation include OER and “all other services,” with the former a function of house prices, the latter a function of labor supply.

Both respond to financial conditions which are driven by long-term interest rates or term premia and less so by short rates. Thus far, the market is pricing little impact on long-term interest and mortgage rates, as well as richly-valued equities.

“More is needed,” Pozsar explains. “To slow OER inflation, mortgage rates need to be higher and house prices flat or outright lower. To slow all other services – driven by a shortage of labor – we need more supply of labor, not less demand for it through a recession.”

“We need to slow services inflation by slowing, not killing, wage growth.”

With this policy talk of increasing labor supply with lower asset prices (cutting into the riches of those involved in the equity and alternative asset markets over the recent years), a Fed first, Pozsar thinks we need “a Volcker moment.”

In other terms, as stated yesterday and before, prevailing monetary frameworks and max liquidity promoted a large divergence in price from fundamentals

Graphic: Taken from Lyn Alden. “US economic growth is softening, and that’s when everyone suddenly gets more critical on valuations.”

The growth in passive investing – the effect of increased moneyness among nonmonetary assets – and derivatives trading imply a lot of left-tail risks.

The (pending) removal of this liquidity cuts into “the processes that enforce these bubbles” found in the volatility market and beyond, therefore upping the judgment of valuations.

“A new Volcker moment should also mean a radical change in the Fed’s strategy and involve going from targeting rates to targeting quantities once again – not the quantity of reserves in the banking system, but the quantity of duration in the market-based shadow banking system to jolt all sorts or risk premia higher.”

Positioning: Pursuant to comments in prior newsletters regarding “accumulation” and the rotation out of money market funds, according to Barclays PLC (NYSE: BCS), retail poured $48 billion into U.S. Equity ETFs last week.

Graphic: Via EPFR, Barclays, and Bloomberg. Taken from The Market Ear.

That is as, per The Market Ear, “vol[atility] targeting players, the crowd adjusting their positions as volatility is moving, have decreased their longs as [volatility has] moved higher.”

Graphic: Via Barclays and Bloomberg. Taken from The Market Ear.

In the face of this accumulation and prospects of buying in cases where volatility compresses, per JPMorgan Chase & Co’s (NYSE: JPM) Nikolaos Panigirtzoglou, however, “There is a good chance that 2022, in terms of equity fund flows, will look like 2018.”

Graphic: Per Panigirtzoglou, flows “started very strong in continuation of the previous year, but at some point that flow picture will be wilting.”

“As the Fed raises rates and other central banks are following the Fed, the risk is that at some point equity fund flows dissipate, or even turn negative,” he added. “I would not be surprised if we could have some sort of a repeat of 2018.”

On a micro level, in response to the FOMC minutes, participants sold puts and bought calls. Into the end-of-day, call buyers likely monetized their bets, while put selling continued. 

Graphic: SpotGamma’s Hedging Impact of Real-Time Options (HIRO) indicator.

The compression of volatility, coupled with that aforementioned trade, bolsters attempts higher.

Moreover, in the slightly bigger (week- and month-long picture), according to SpotGamma, “post-OPEX, the removal of linear short (-delta) hedges [to put-heavy exposures] may further bolster attempts higher.” 

On the other hand, “The removal of downside (put) protection may also open the door for weakness in a case where some outside (fundamental) event solicits real-money selling and a new demand for protection.”

Graphic: The “Biggest tail risk to SPX isn’t any macro data/virus/war but its own options market.”

Technical: As of 6:30 AM ET, Thursday’s regular session (9:30 AM – 4:00 PM ET), in the S&P 500, will likely open in the middle part of a negatively skewed overnight inventory, inside of prior-range and -value, suggesting a limited potential for immediate directional opportunity.

Balance (Two-Timeframe Or Bracket): Rotational trade that denotes current prices offer favorable entry and exit. Balance-areas make it easy to spot a change in the market (i.e., the transition from two-time frame trade, or balance, to one-time frame trade, or trend). 

Modus operandi is responsive trade (i.e., fade the edges), rather than initiative trade (i.e., play the break).

In the best case, the S&P 500 trades higher; activity above the $4,438.00 key response area (BAL/ONL/HVNode) puts in play the $4,485.00 regular trade high (RTH High). Initiative trade beyond the RTH High could reach as high as the $4,499.00 untested point of control (VPOC) and $4,526.25 high volume area (HVNode), or higher.

In the worst case, the S&P 500 trades lower; activity below the $4,438.00 key response area (BAL/ONL/HVNode) puts in play the $4,421.75 low volume area (LVNode). Initiative trade beyond the LVNode could reach as low as the $4,393.75 HVNode and $4,365.00 POC, or lower.

Click here to load today’s key levels into the web-based TradingView charting platform. Note that all levels are derived using the 65-minute timeframe. New links are produced, daily.
Graphic: 65-minute profile chart of the Micro E-mini S&P 500 Futures.

Definitions

Overnight Rally Highs (Lows): Typically, there is a low historical probability associated with overnight rally-highs (lows) ending the upside (downside) discovery process.

Volume Areas: A structurally sound market will build on areas of high volume (HVNodes). Should the market trend for long periods of time, it will lack sound structure, identified as low volume areas (LVNodes). LVNodes denote directional conviction and ought to offer support on any test. 

If participants were to auction and find acceptance into areas of prior low volume (LVNodes), then future discovery ought to be volatile and quick as participants look to HVNodes for favorable entry or exit.

POCs: POCs are valuable as they denote areas where two-sided trade was most prevalent in a prior day session. Participants will respond to future tests of value as they offer favorable entry and exit.

About

After years of self-education, strategy development, mentorship, and trial-and-error, Renato Leonard Capelj began trading full-time and founded Physik Invest to detail his methods, research, and performance in the markets.

Capelj is also a Benzinga finance and technology reporter interviewing the likes of Shark Tank’s Kevin O’Leary, JC2 Ventures’ John Chambers, FTX’s Sam Bankman-Fried, and ARK Invest’s Catherine Wood, as well as a SpotGamma contributor developing insights around impactful options market dynamics.

Disclaimer

Physik Invest does not carry the right to provide advice.

In no way should the materials herein be construed as advice. Derivatives carry a substantial risk of loss. All content is for informational purposes only.

Categories
Commentary

Daily Brief For September 23, 2021

Market Commentary

Equity index futures trade higher with yields. VIX and most commodities sideways to lower.

  • Buy-the-dip mantra slowly fading.
  • Fed is eyeing a taper, raise rates.
  • SPX to 4.7-5K at end of the year.
  • Positioning: Still at a key juncture.

What Happened: U.S. stock index futures auctioned higher alongside news the Federal Reserve held advanced talks on paring back its asset purchase program and raising rates. 

In other news, JPMorgan Chase & Co (NYSE: JPM) strategists suggest the buy-the-dip mantra is at risk.

Ahead is data on jobless claims (8:30 AM ET), Markit manufacturing and services PMI (9:45 AM ET), leading economic indicators (10:00 AM ET), as well as real household net worth and nonfinancial debt (12:00 PM ET).

Graphic updated 6:30 AM ET. Sentiment Neutral if expected /ES open is inside of the prior day’s range. /ES levels are derived from the profile graphic at the bottom of the following section. SqueezeMetrics Dark Pool Index (DIX) and Gamma (GEX) calculations are based on where the prior day’s reading falls with respect to the MAX and MIN of all occurrences available. A higher DIX is bullish. At the same time, the lower the GEX, the more (expected) volatility. SHIFT data used for S&P 500 (INDEX: SPX) options activity. Note that options flow is sorted by the call premium spent; if more positive then more was spent on call options. Breadth reflects a reading of the prior day’s NYSE Advance/Decline indicator. VIX reflects a current reading of the CBOE Volatility Index (INDEX: VIX) from 0-100.

What To Expect: As of 6:30 AM ET, Thursday’s regular session (9:30 AM – 4:00 PM EST) in the S&P 500 may open inside of prior-range and -value, suggesting a limited potential for immediate directional opportunity.

Adding, during the prior day’s regular trade, on strong intraday breadth and divergent market liquidity metrics, the best case outcome occurred, evidenced by mostly sideways trade and higher value areas.

This is significant because sideways-to-higher trade and an intent to separate value (i.e., break from balance, higher) reflects a willingness to check and resolve some unfinished business (e.g, $4,425.00 untested point of control or VPOC).

We’re carrying forward the overhead supply; the 20- and 50-day simple moving averages, as well as the anchored volume-weighted average prices (VWAP), north of the $4,425.00 VPOC, are some key dynamic levels that must be taken to change the tone. 

Balance (Two-Timeframe Or Bracket) Is The Status Quo: Rotational trade that denotes current prices offer favorable entry and exit. Balance-areas make it easy to spot a change in the market (i.e., the transition from two-time frame trade, or balance, to one-time frame trade, or trend). 

Modus operandi is responsive trade (i.e., fade the edges), rather than initiative trade (i.e., play the break).

Further, the aforementioned trade is happening in the context of a fraying in the buy-the-dip psychology, as well as a belief that companies will continue to do good into year-end. The implications of these themes on price are contradictory

On one hand, as discussed yesterday, JPMorgan Chase & Co’s Marko Kolanovic stated that despite “technical selling flows (CTAs and option hedgers) in an environment of poor liquidity, and overreaction of discretionary traders to perceived risks,” the equity market would continue higher with the S&P 500 ending 2021 at 4,700, with the potential to break 5,000 next year.

On the other hand, strategists led by JPMorgan Chase & Co’s Nikolaos Panigirtzoglou wrote that the psychology of buying the dip is fraying; “Observing flows for signs that this change in behavior would prove more persistent is important over the coming days” as the S&P 500 continues to trade below its 50-day simple moving average alongside concerns over waning stimulus, inflation, the debt ceiling, and China’s debt crisis.

Adding, Goldman Sachs Group Inc’s (NYSE: GS) Peter Oppenheimer, alongside HSBC Holdings Plc (NYSE: HSBC) strategists, believes dip-buying is a go as “we’re still in the relatively early stages of this economic cycle.” 

In terms of positioning, SpotGamma data suggests the S&P 500 is still at an intersection (i.e., short gamma) that portends increased volatility, should the index continue lower.

Moreover, for today, participants may make use of the following frameworks.

In the best case, the S&P 500 trades sideways or higher; activity above the $4,393.75 high volume area (HVNode) puts in play the $4,425.00 VPOC and balance area low (BAL). Initiative trade beyond the VPOC could reach as high as the $4,481.75 HVNode and $4,510.00 low volume area (LVNode), or higher.

In the worst case, the S&P 500 trades lower; activity below the $4,393.75 HVNode puts in play the $4,365.25 LVNode. Initiative trade beyond the LVNode could reach as low as the $4,294.00 regular trade low (RTH Low) and $4,233.00 VPOC, or lower.

Graphic: 65-minute profile chart of the Micro E-mini S&P 500 Futures updated 6:30 AM ET.

Definitions

Volume Areas: A structurally sound market will build on areas of high volume (HVNodes). Should the market trend for long periods of time, it will lack sound structure, identified as low volume areas (LVNodes). LVNodes denote directional conviction and ought to offer support on any test. 

If participants were to auction and find acceptance into areas of prior low volume (LVNodes), then future discovery ought to be volatile and quick as participants look to HVNodes for favorable entry or exit.

Gamma: Gamma is the sensitivity of an option to changes in the underlying price. 

Dealers that take the other side of options trades hedge their exposure to risk by buying and selling the underlying. 

When dealers are short-gamma, they hedge by buying into strength and selling into weakness. When dealers are long-gamma, they hedge by selling into strength and buying into weakness. 

The former exacerbates volatility. The latter calms volatility.

POCs: POCs are valuable as they denote areas where two-sided trade was most prevalent in a prior day session. Participants will respond to future tests of value as they offer favorable entry and exit.

Value-Area Placement: Perception of value unchanged if value overlapping (i.e., inside day). Perception of value has changed if value not overlapping (i.e., outside day). Delay trade in the former case.

Volume-Weighted Average Prices (VWAPs): A metric highly regarded by chief investment officers, among other participants, for quality of trade. Additionally, liquidity algorithms are benchmarked and programmed to buy and sell around VWAPs.

News And Analysis

U.S. default this fall would cost 6M jobs, wipe $15T.

Central banks aim to limit digital currency disruption.

New York faces more than water-related climate risk.

Fed signals the possibility of 6 to 7 rate hikes, taper. 

Building the future depends on building more homes.

Fed officials believe ‘transitory’ inflation lasts longer.

Platform backed by Fidelity, Goldman digitizes IPOs.

Slower car production hit the pricing of commodities.

Founder of volatility-hedging program eyeing a drop.

The Emerging Ecosystem: Digitalization of markets.

JPMorgan team says flows show buy-the-dip fading.

China pumped $17B, tells Evergrande to not default.

ARK Invest’s Wood to sell Tesla if it reached $3,000.

Goldman’s Oppenheimer said a 10% dip is buyable.

What People Are Saying

About

After years of self-education, strategy development, and trial-and-error, Renato Leonard Capelj began trading full-time and founded Physik Invest to detail his methods, research, and performance in the markets. 

Additionally, Capelj is a finance and technology reporter. Some of his biggest works include interviews with leaders such as John Chambers, founder and CEO, JC2 Ventures, Kevin O’Leary, businessman and Shark Tank host, Catherine Wood, CEO and CIO, ARK Invest, among others.

Disclaimer

At this time, Physik Invest does not manage outside capital and is not licensed. In no way should the materials herein be construed as advice. Derivatives carry a substantial risk of loss. All content is for informational purposes only.