Editor’s Note: Our newsletter service provider is not working, today. Our apologies if you were not able to receive the note via email, as usual.
What Happened
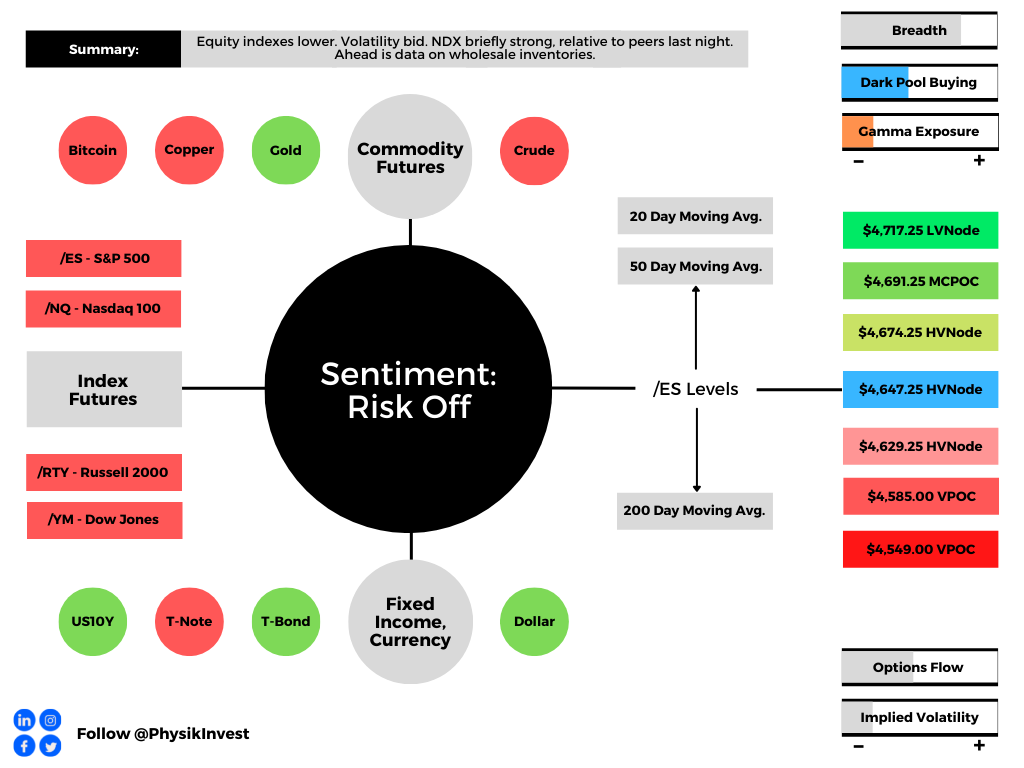
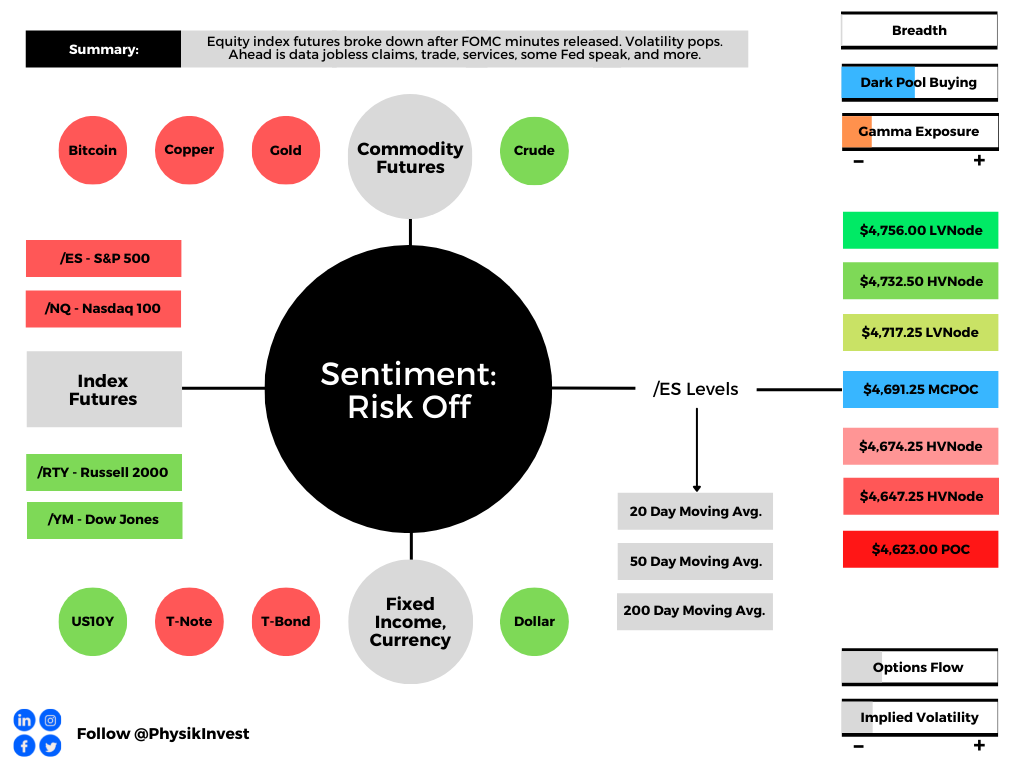
After exploring lower prices, Monday, major U.S. equity market indices rallied, sharply, closing higher on the day. Thereafter, trade was two-sided and volatility remained bid.
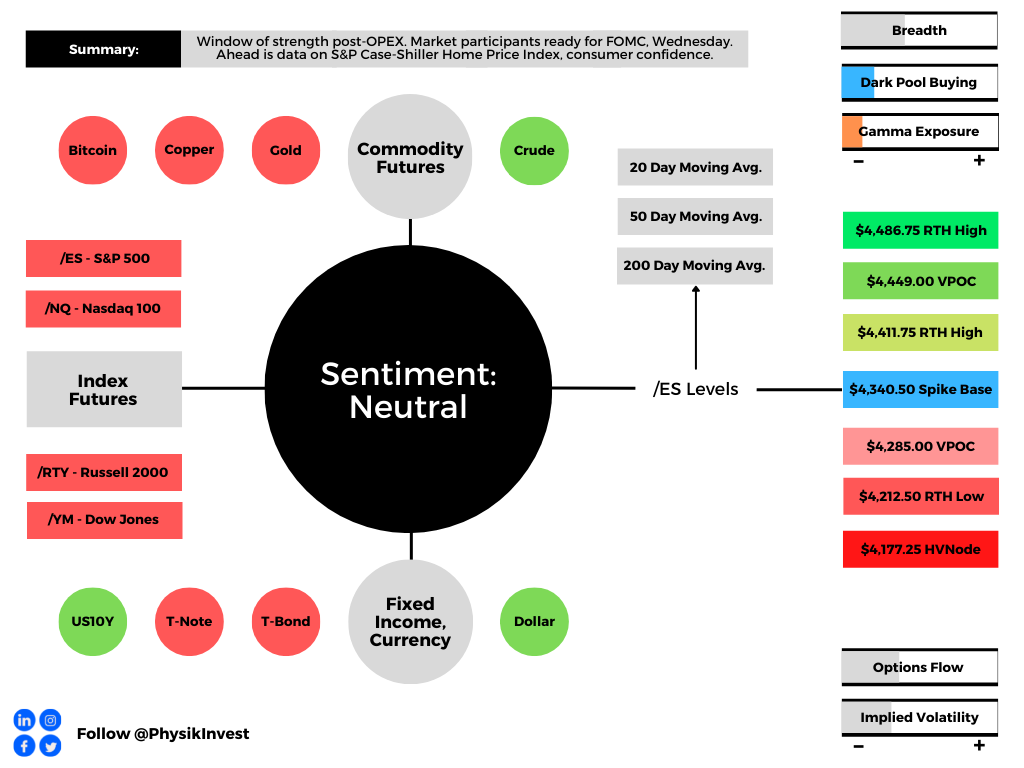
Ahead is data on the S&P Case-Shiller National Home Price Index and FHFA National Home Price Index (9:00 AM ET), as well as consumer confidence (10:00 AM ET).
What To Expect
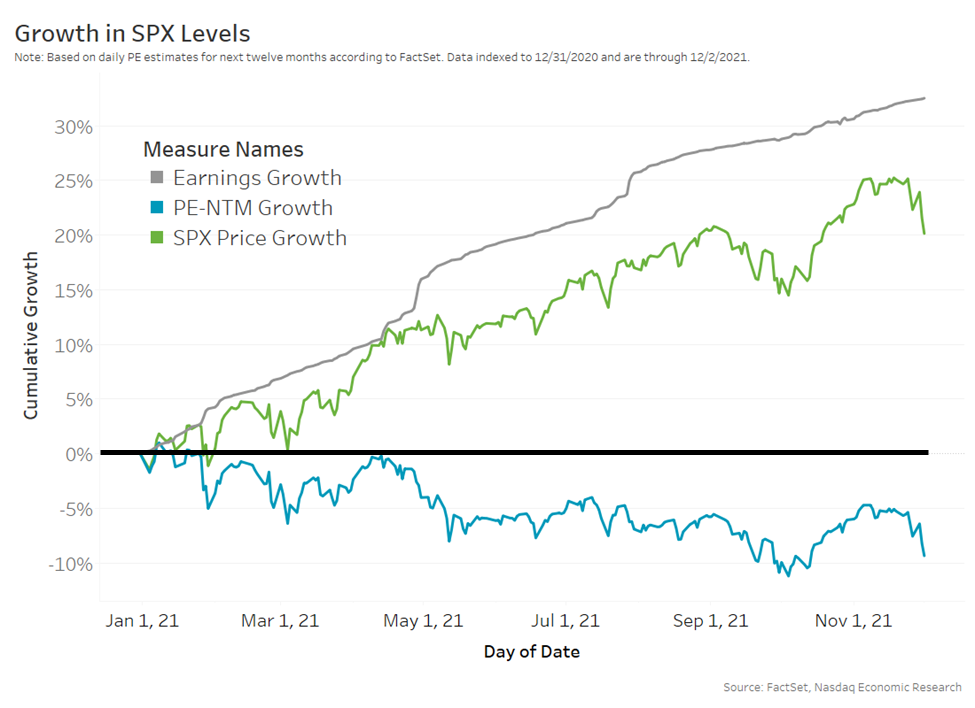
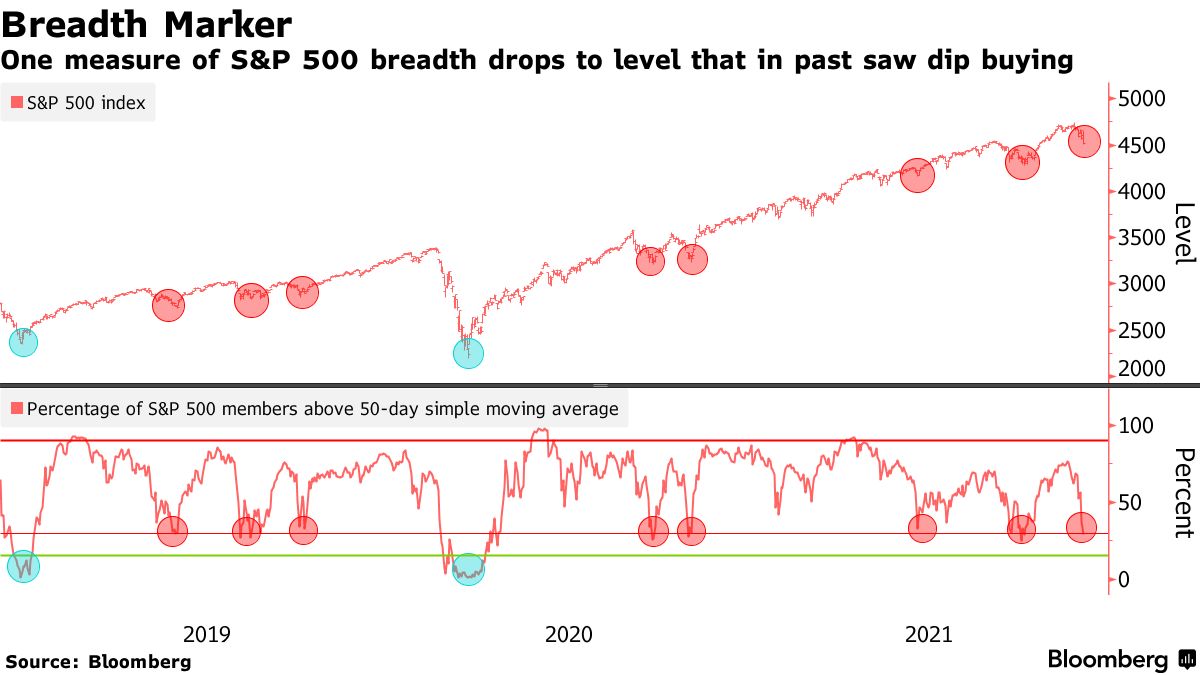
Fundamental: Monday’s liquidation was a combination of capitulation and “forced selling” in the face of months of divergent breadth by lesser weighted index constituents, geopolitical tensions, the prospects of reduced stimulus to combat high inflation, poor responses to earnings results, and disappointments in real demand and growth.
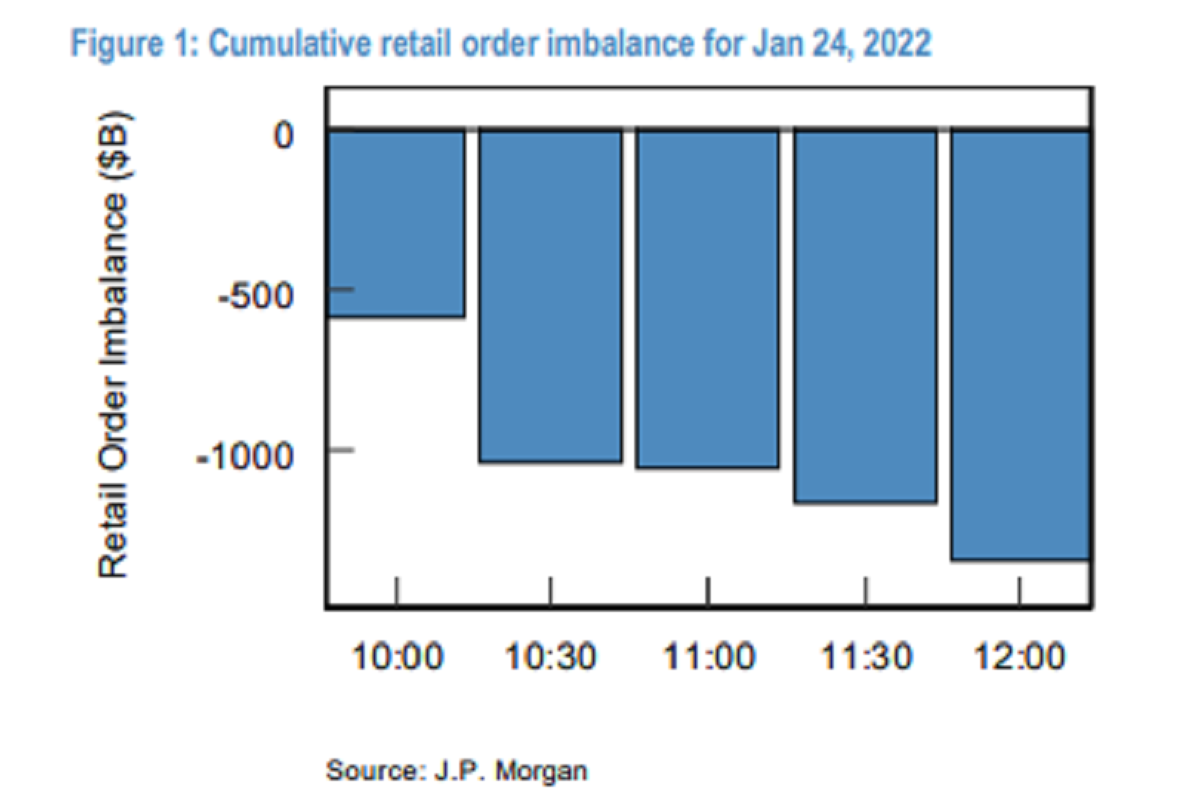
In data compiled by JPMorgan Chase & Co (NYSE: JPM), “retail investors offloaded a net $1.36 billion worth of stock by noon, most of it in the first hour” of trade, a 3.9 standard deviation share disposal. This is as “fund managers have yet to actively unwind their positions.”
According to statements by JPMorgan Chase & Co’s Marko Kolanvoic, “worries around rates and corporate margins are overdone,” and “we expected the earnings season to reassure, and in a worst-case scenario could see a return of the ‘Fed put.’”
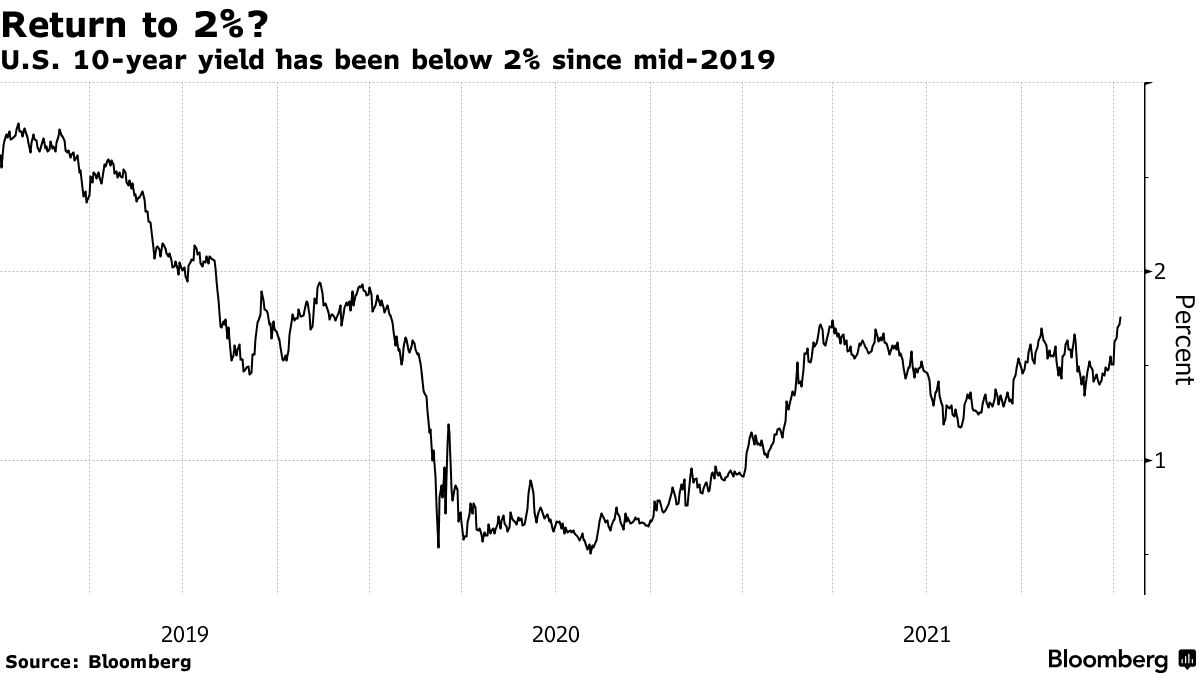
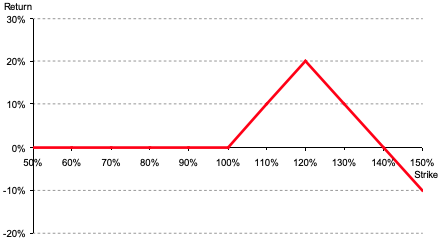
When examining extraordinary actions by the Federal Reserve (Fed), “the average ‘exercise price’ is a -23.8% peak to trough (equating currently to SPX 3,670.00),” Evercore ISI explains.
“The Fed is likely to ‘exercise the Fed put’ should the average -23.8% strike price come into view.”
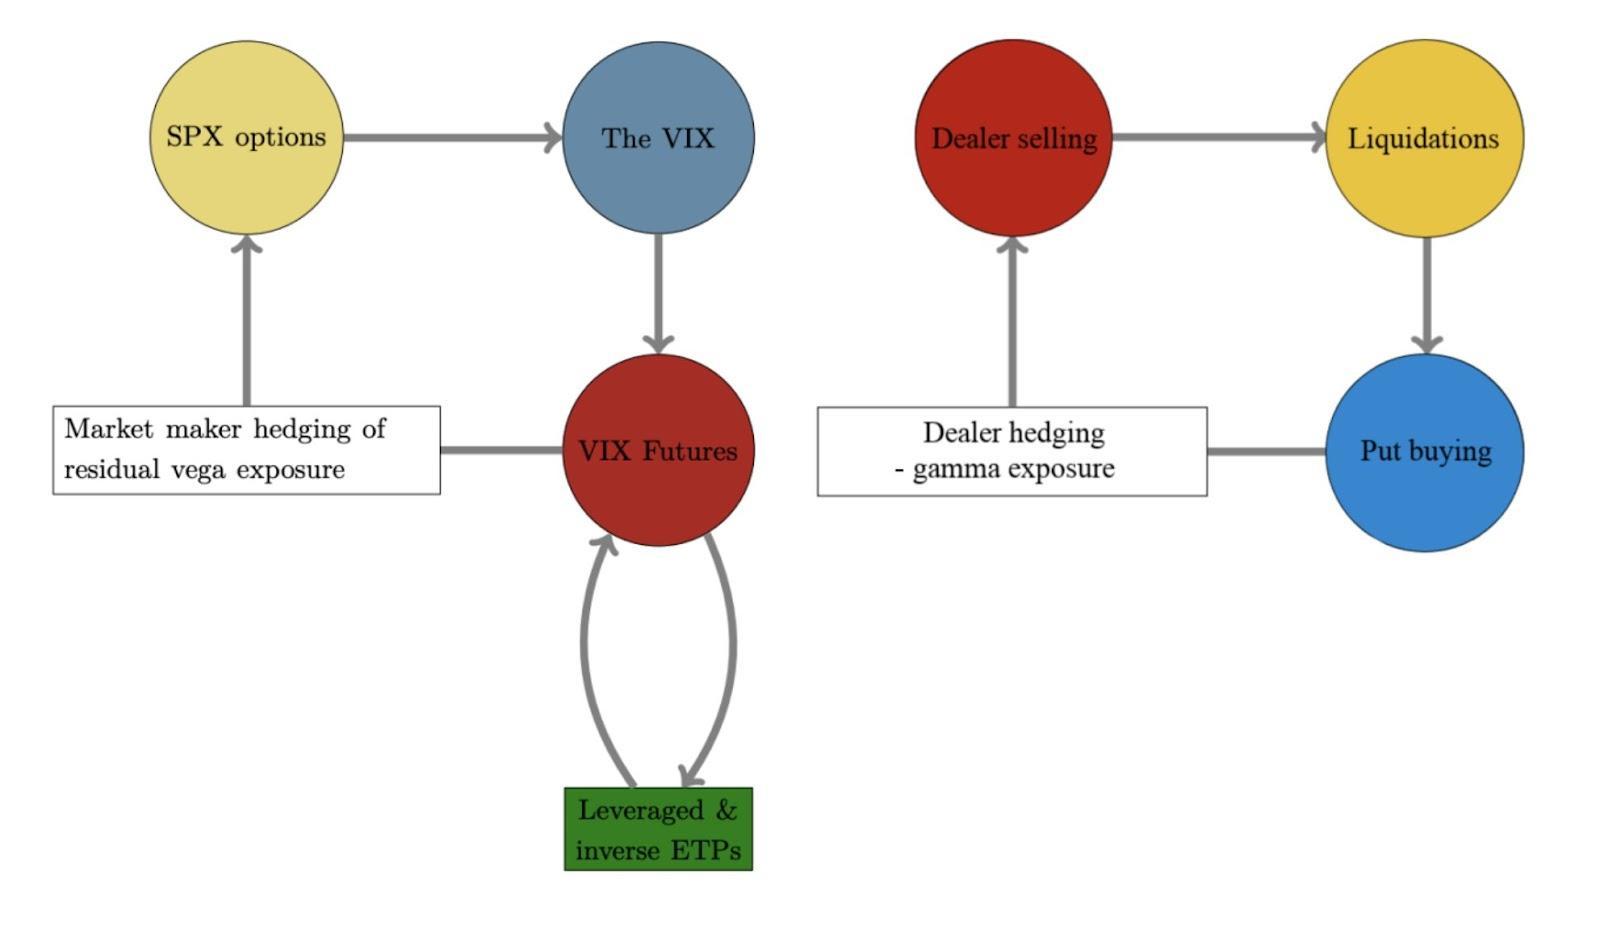
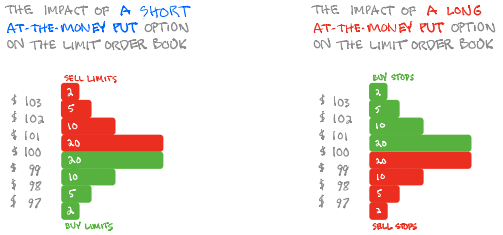
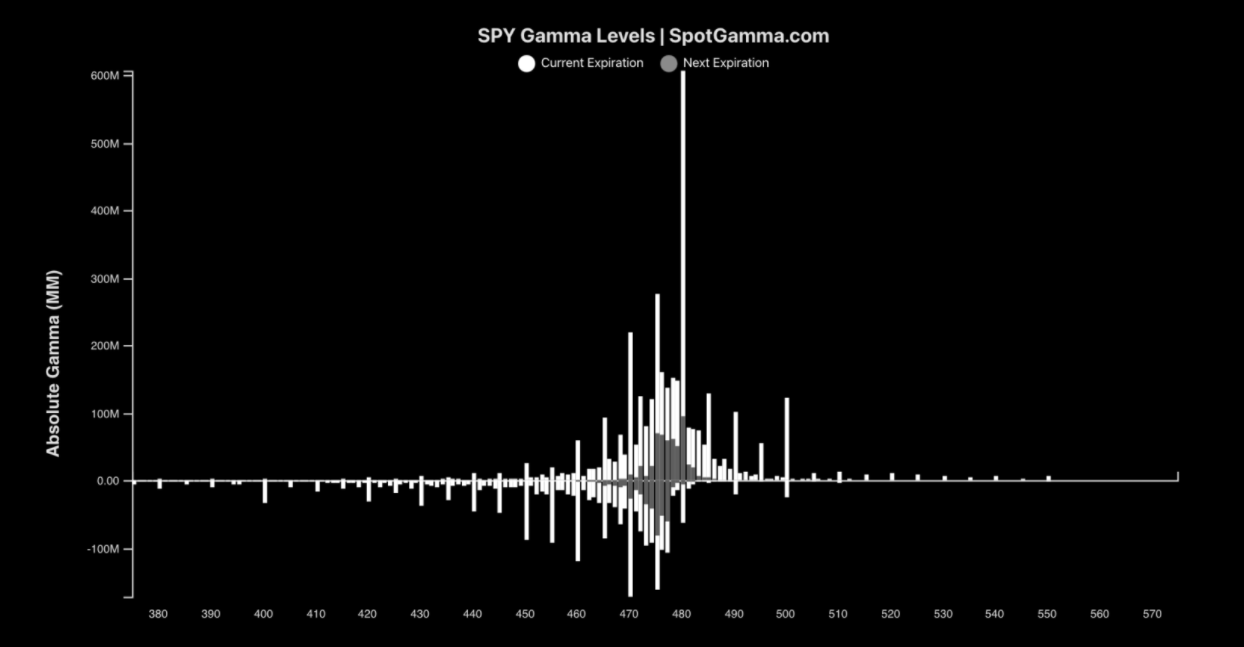
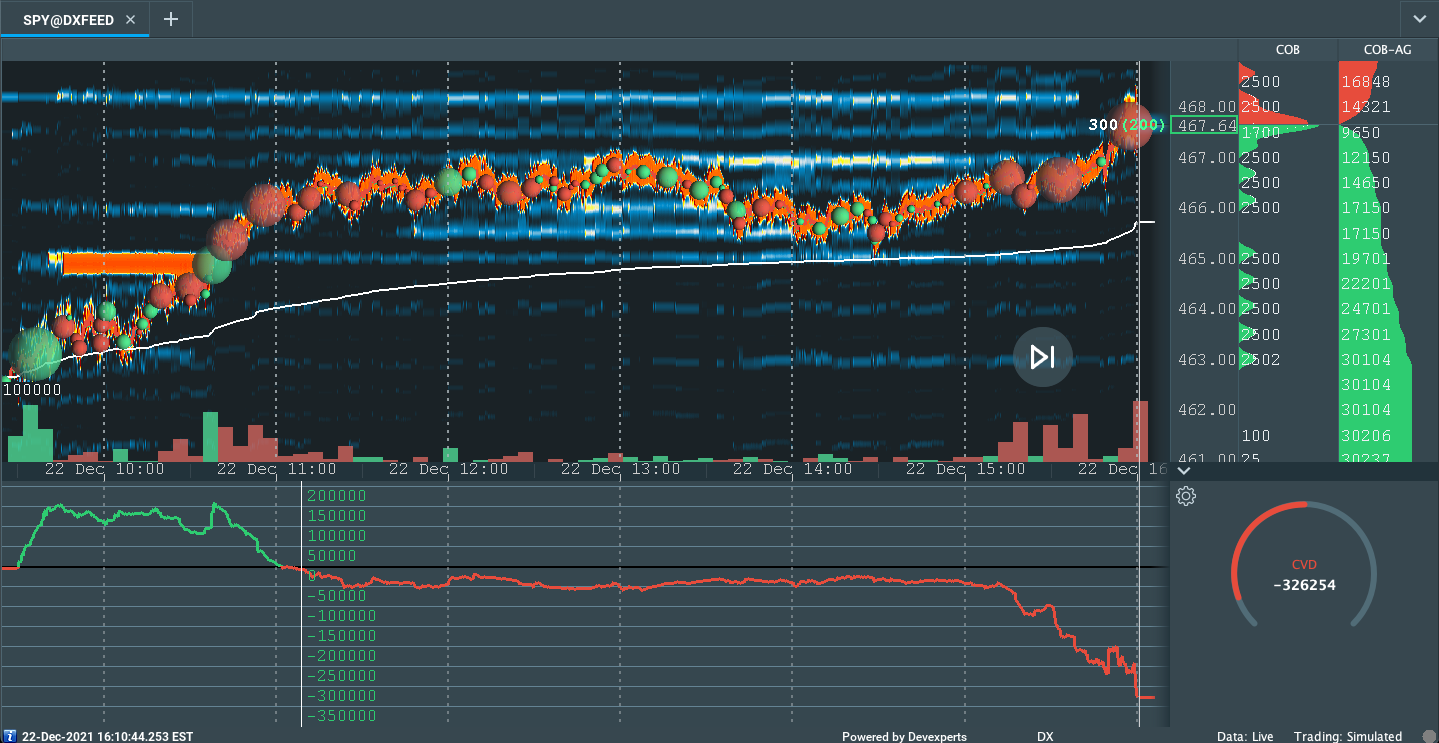
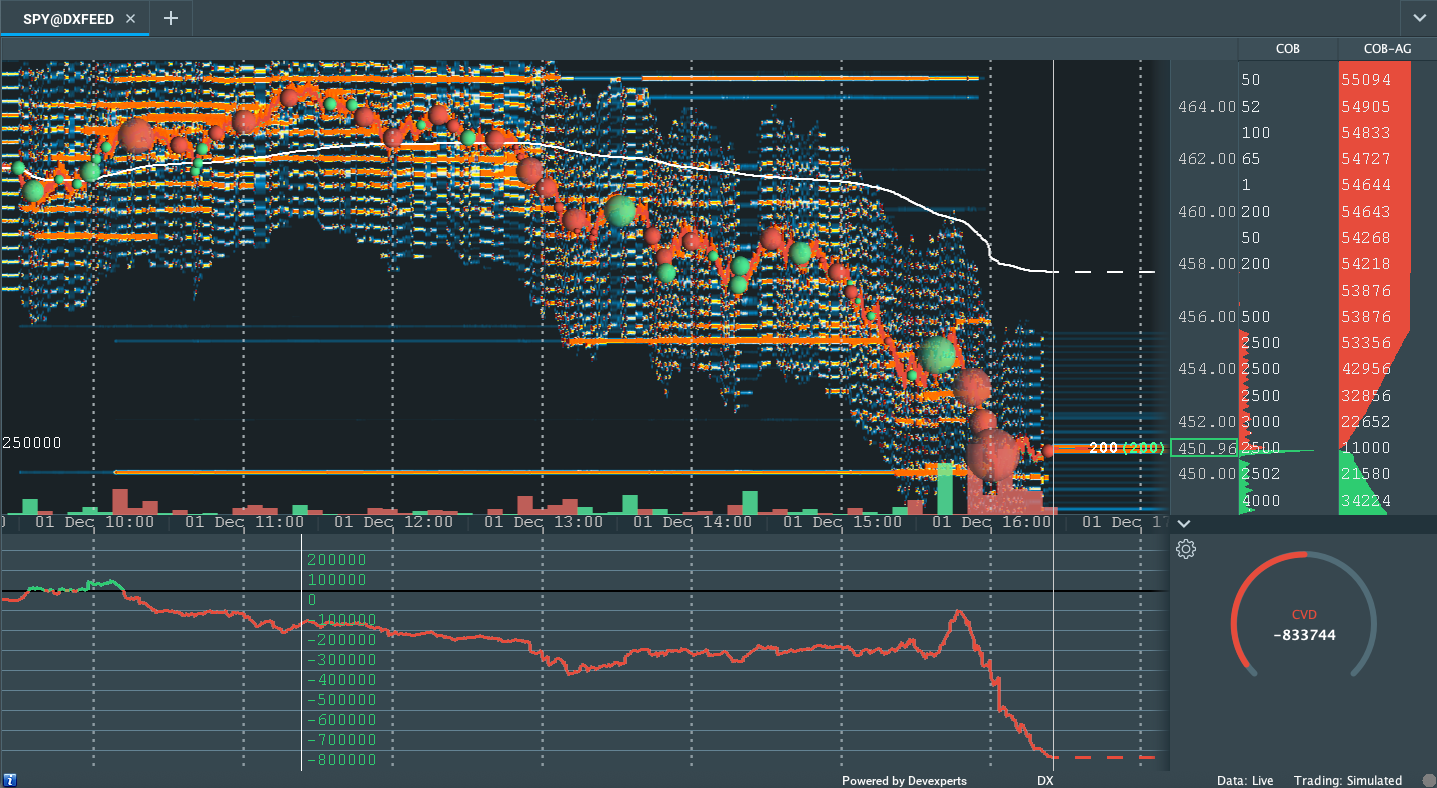
Positioning: “A negative gamma regime was to blame, in part, for the fast move lower and subsequent close higher,” according to options modeling and data service SpotGamma.
The negative gamma – in reference to the options counterparties reaction “when a position’s delta falls (rises) with stock or index price rises (falls)” – is what compounds the selling.
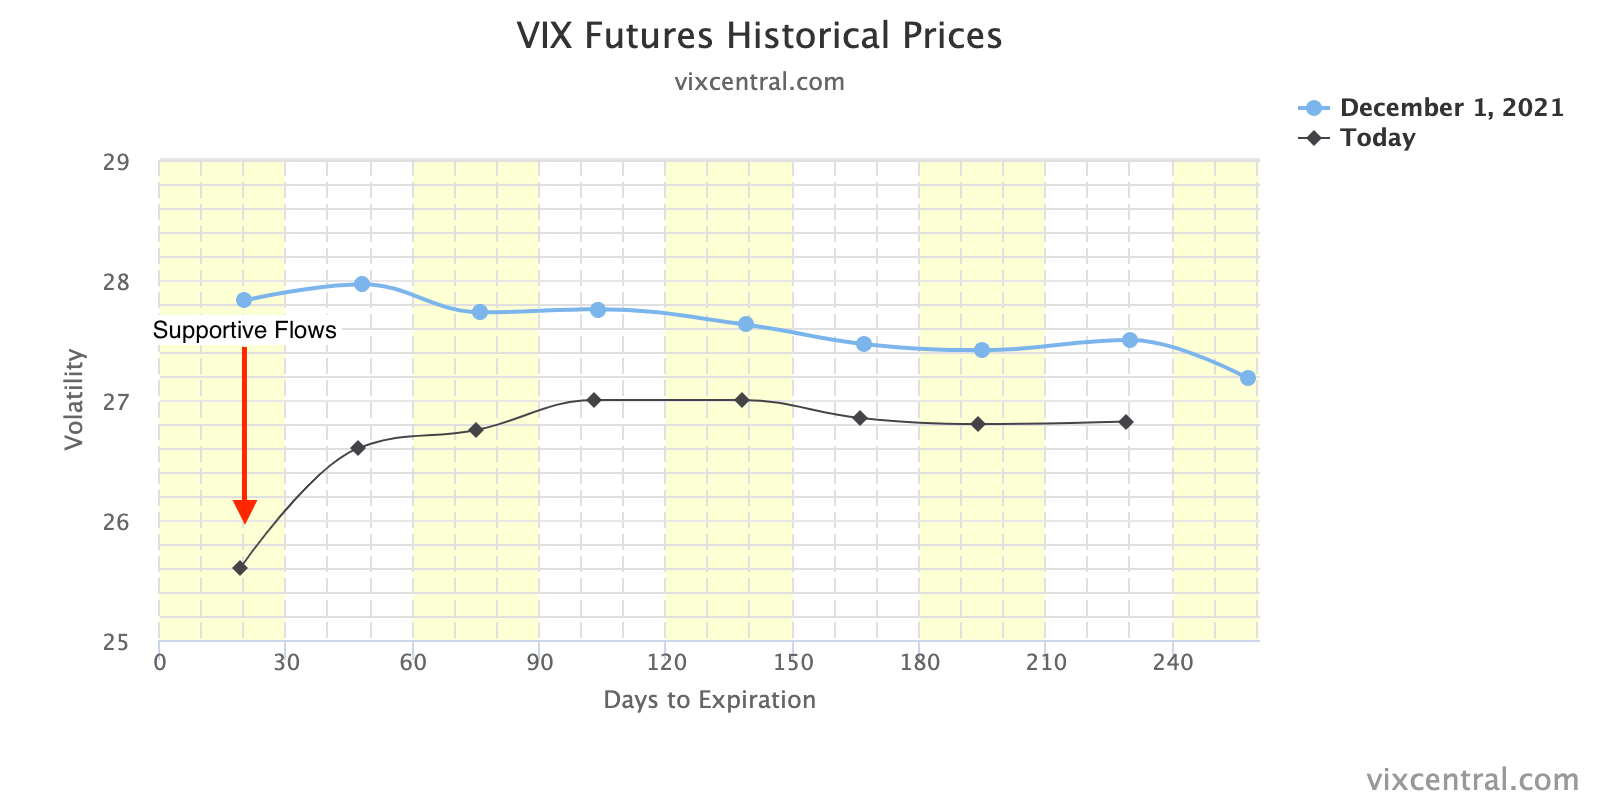
With measures of implied volatility expanding, as is the case when there is heightened demand for downside put protection (a positive-delta trade for the dealers), protection is bid and the dealer’s exposure to positive delta rises, which solicits more selling in the underlying (addition of short-delta hedges).

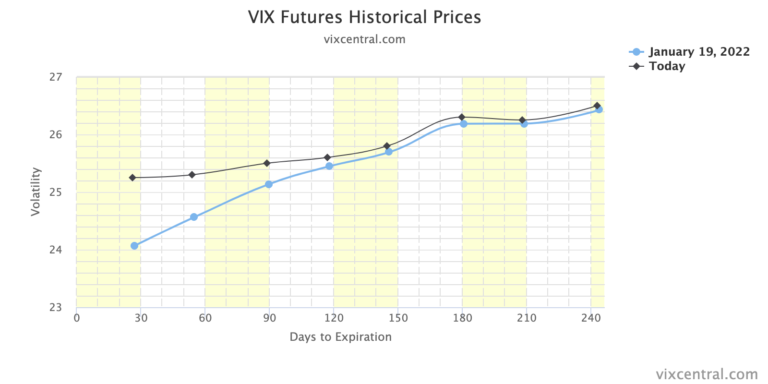
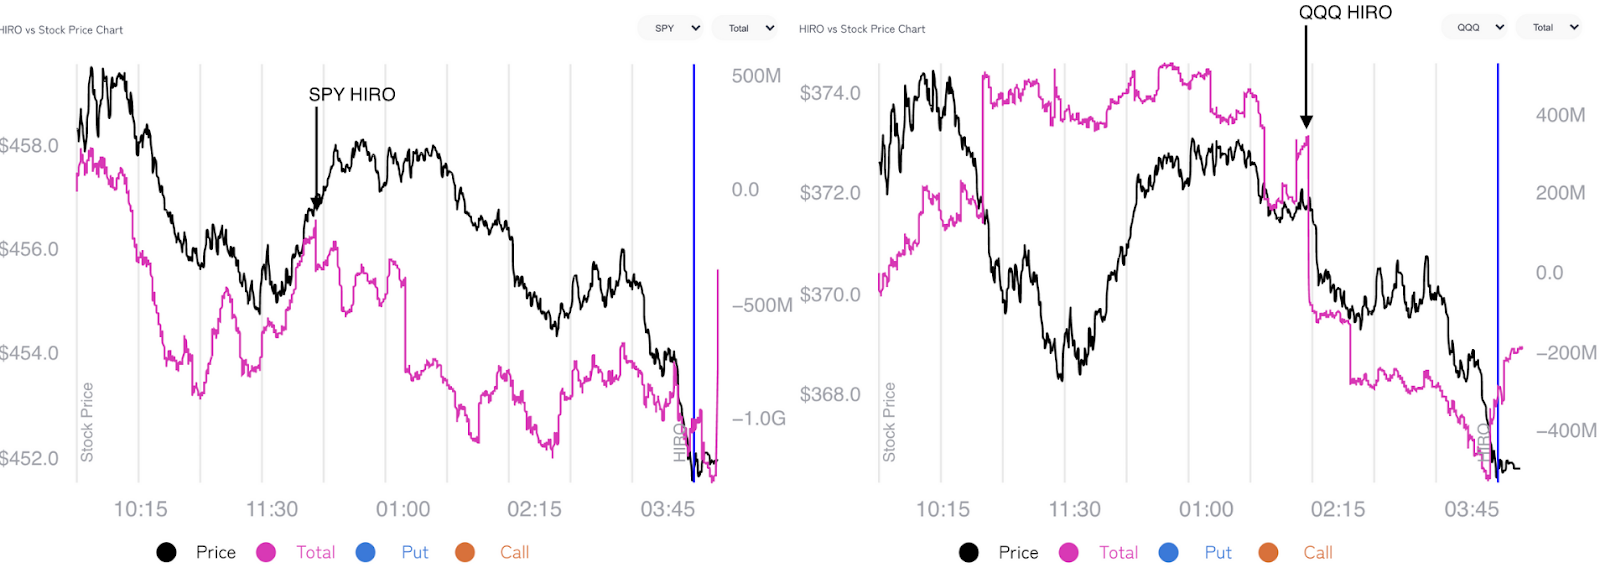
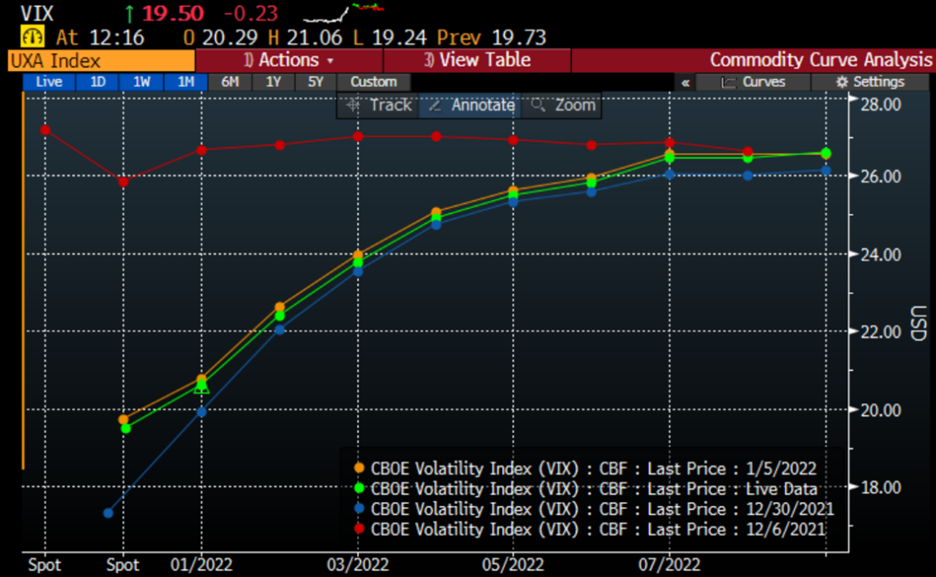
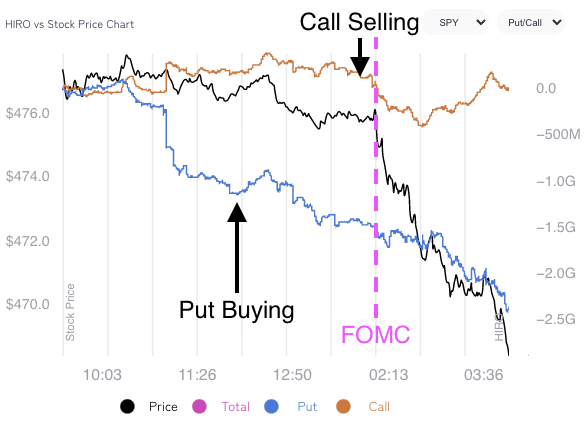
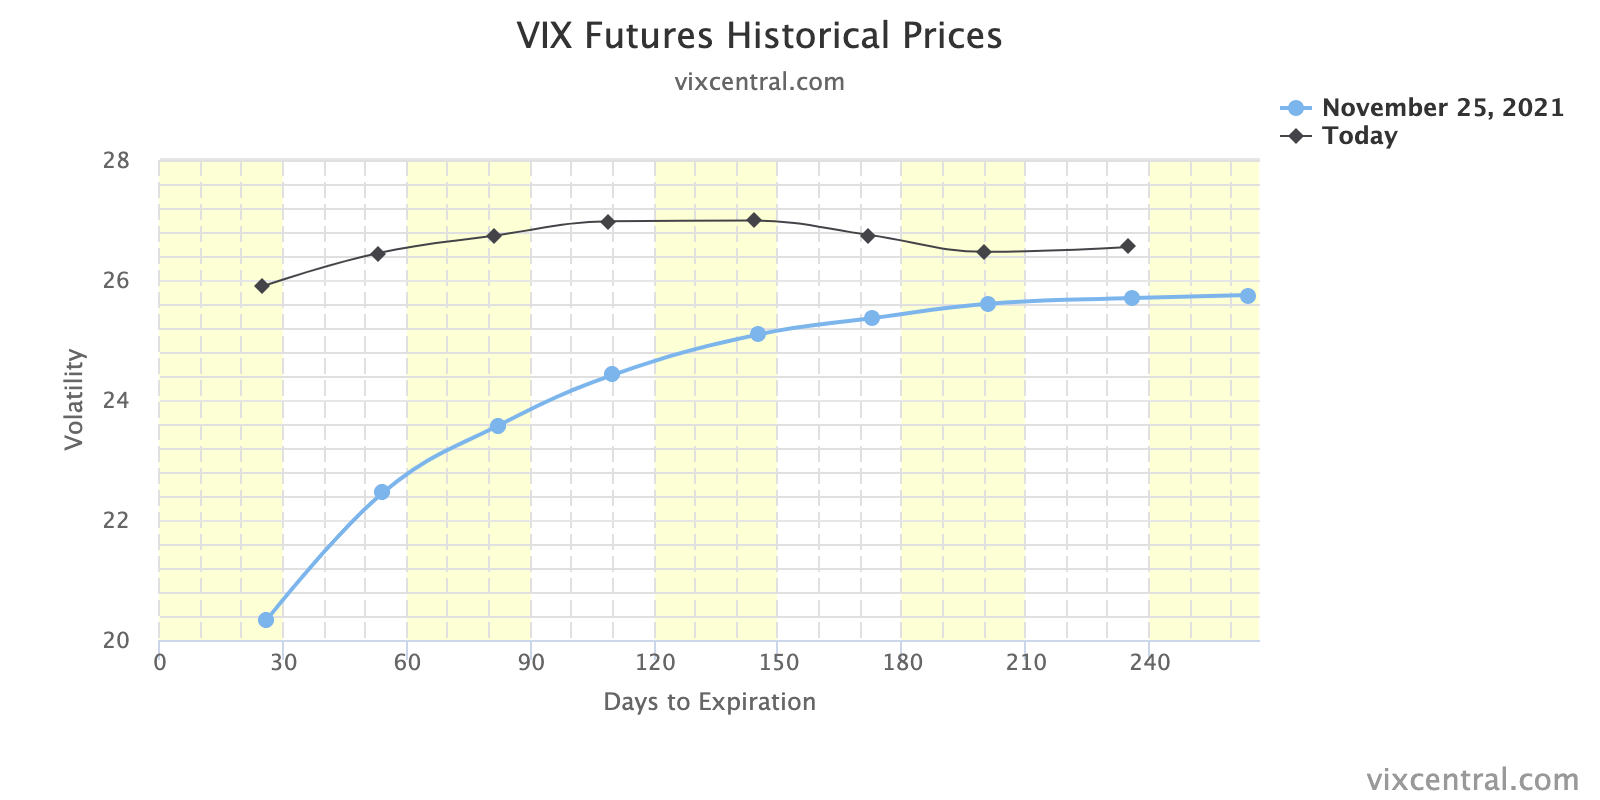
Heading into mid-day, there was a clear demand for protection (put buying), as evidenced by the VIX moving up nearly 11.00 in regular trade.
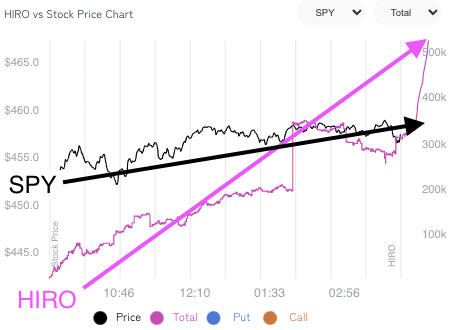
After 12:00 or so, the tone changed, markedly, as participants sold puts and bought calls, a positive delta trade the dealers likely hedged by buying the underlying.
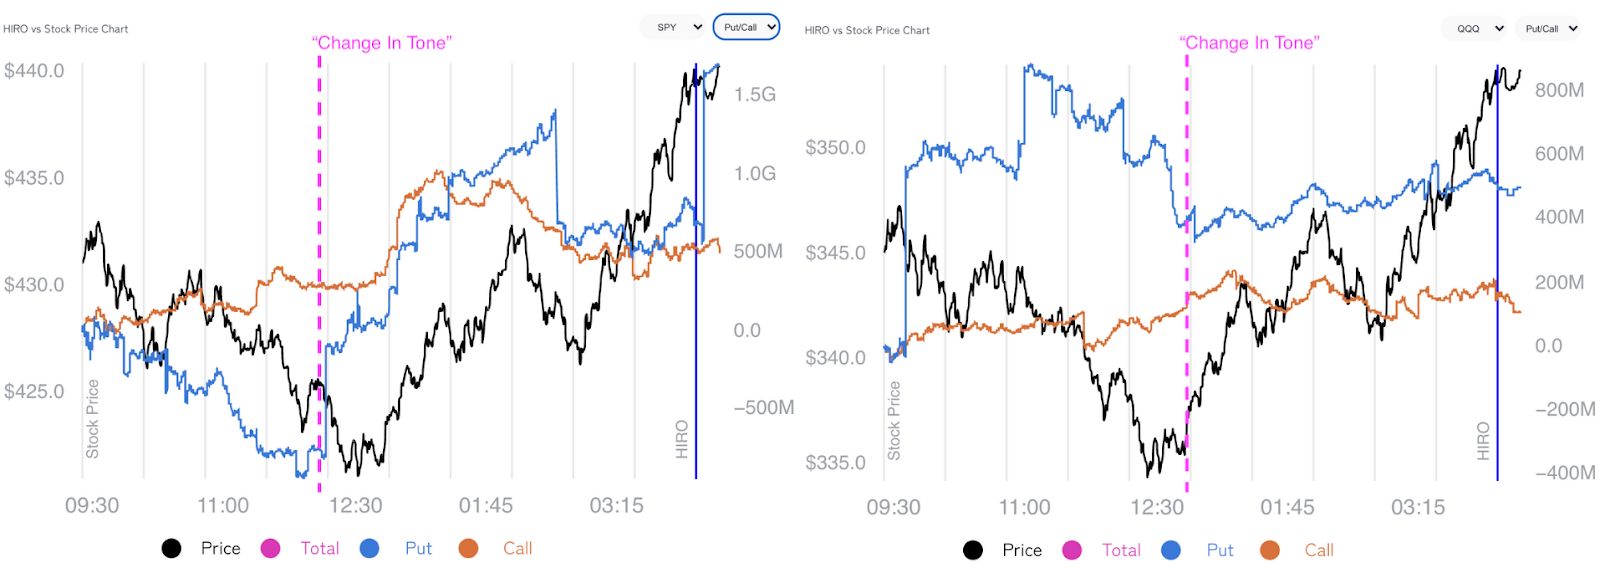
The associated compression in implied volatility reduced the dealer’s exposure to positive delta (via puts they are short) and that resulted in a covering of hedges that compounded the move higher.
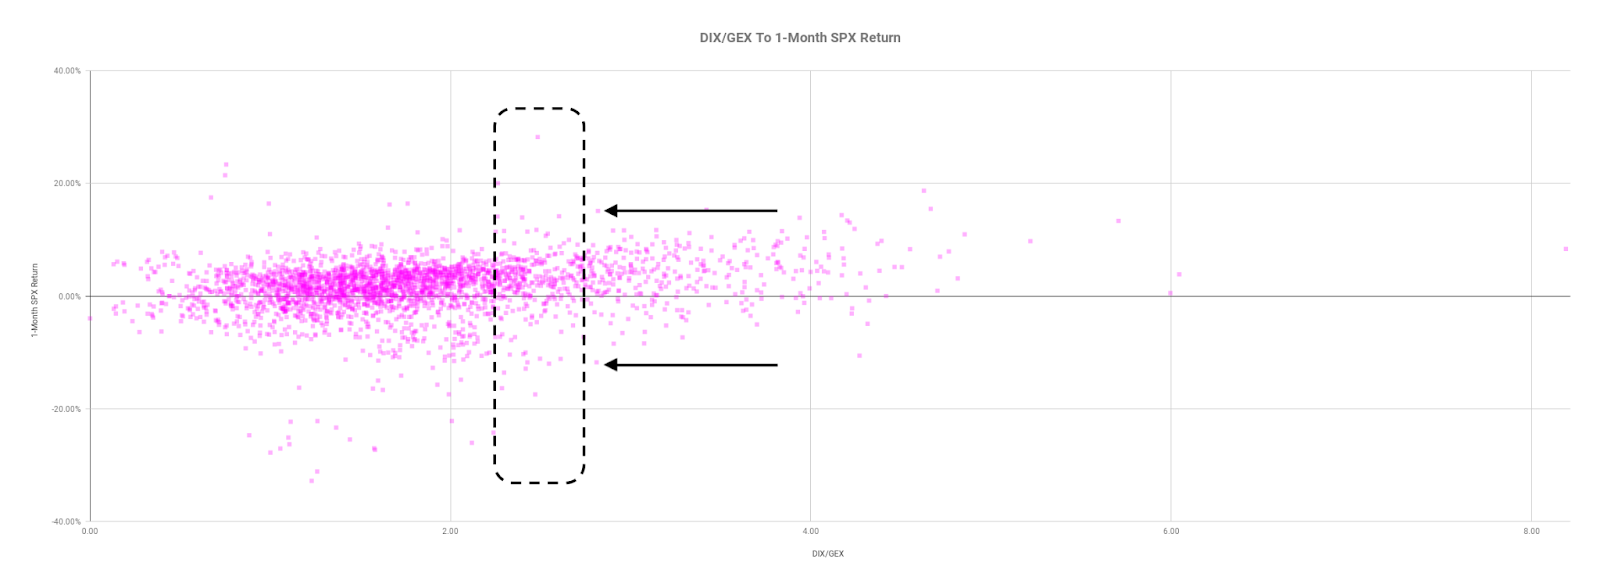
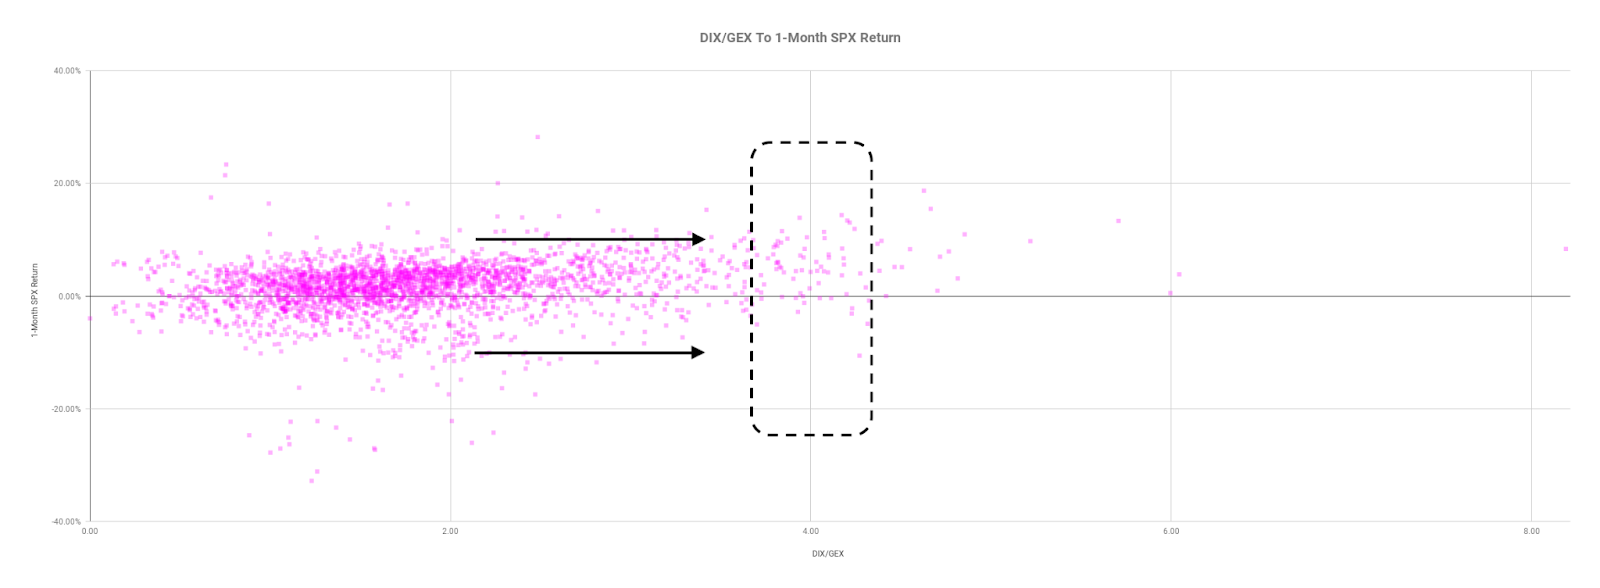
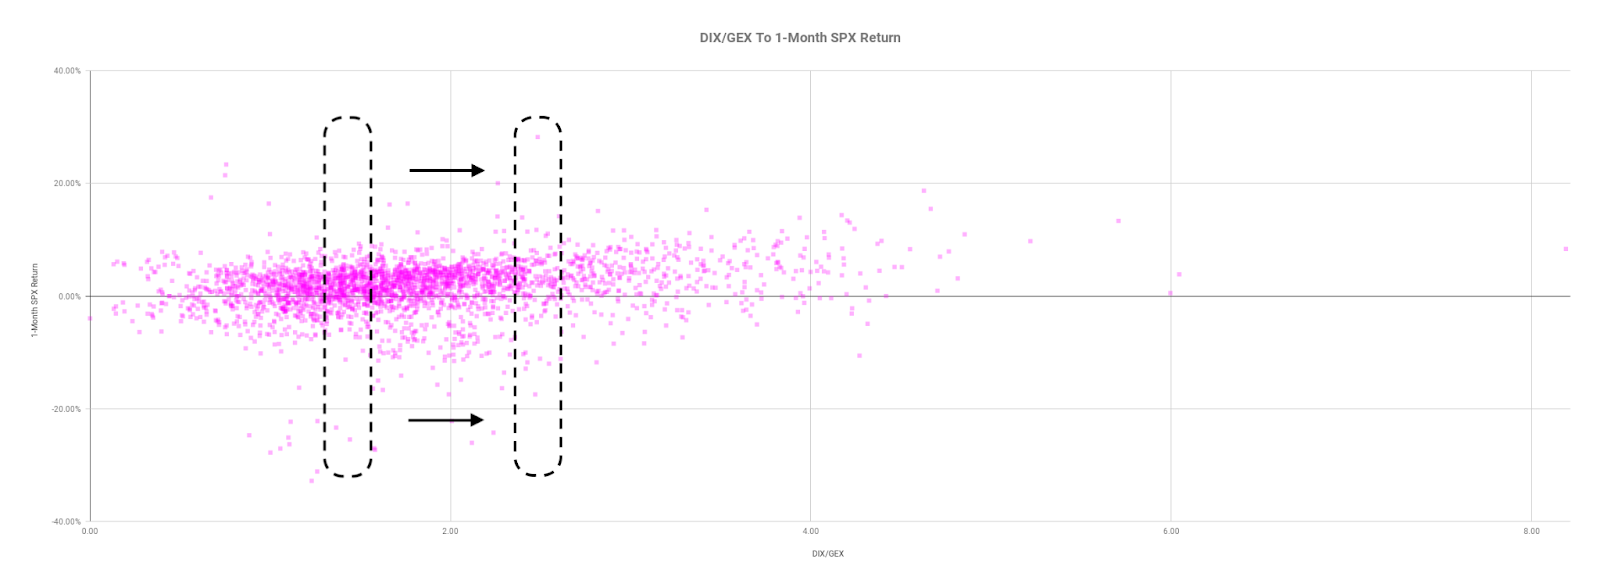
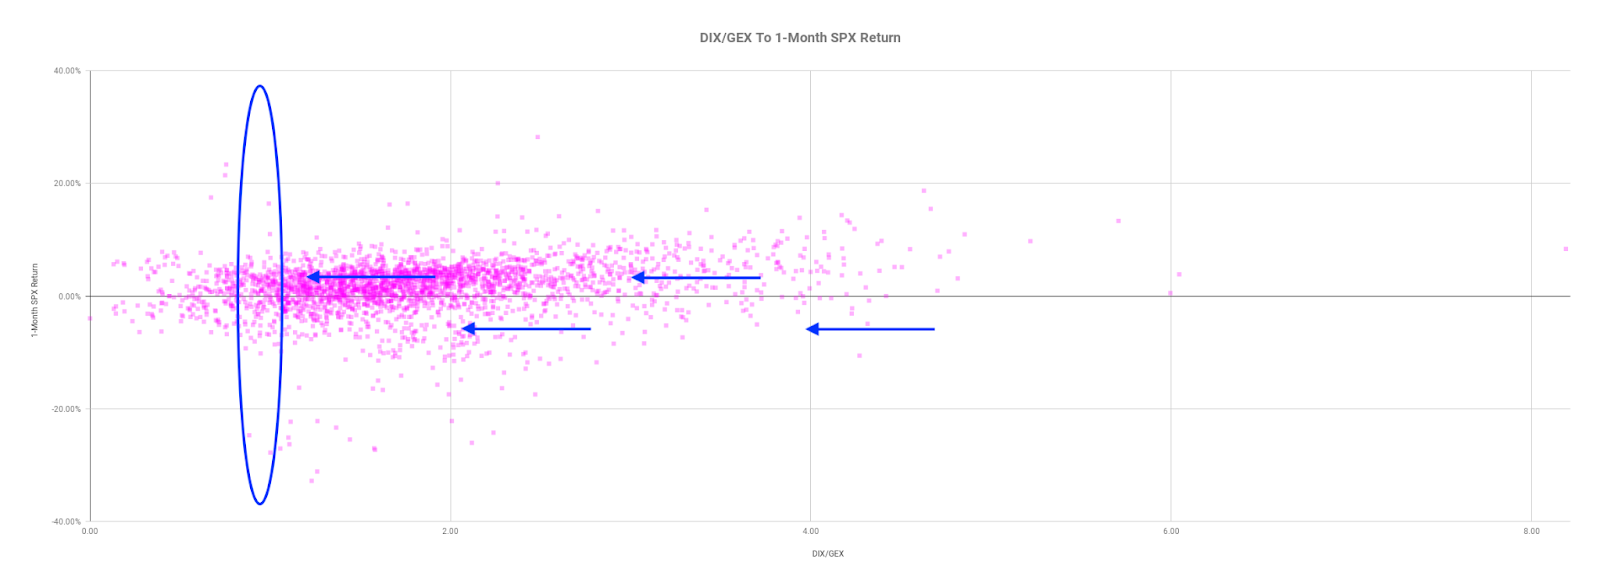
Taking into account options positioning, versus buying pressure (measured via short sales or liquidity provision on the market-making side), metrics are positively skewed, but much less so than before.

“This is quite similar to the behavior that we saw at both the 12/26/18 and 3/23/20 trading lows that saw the S&P 500 get slammed on a Friday options expiration only to find a trading bottom the following Monday before noon,” adds Brian Rauscher of Fundstrat Global Advisors on the potential for a counter-trend rally.
“So, it looks likely there is some opportunity for aggressive traders as well as for strategic investors to use the expected bounce to look for higher quality stocks that have been overly sold off.”
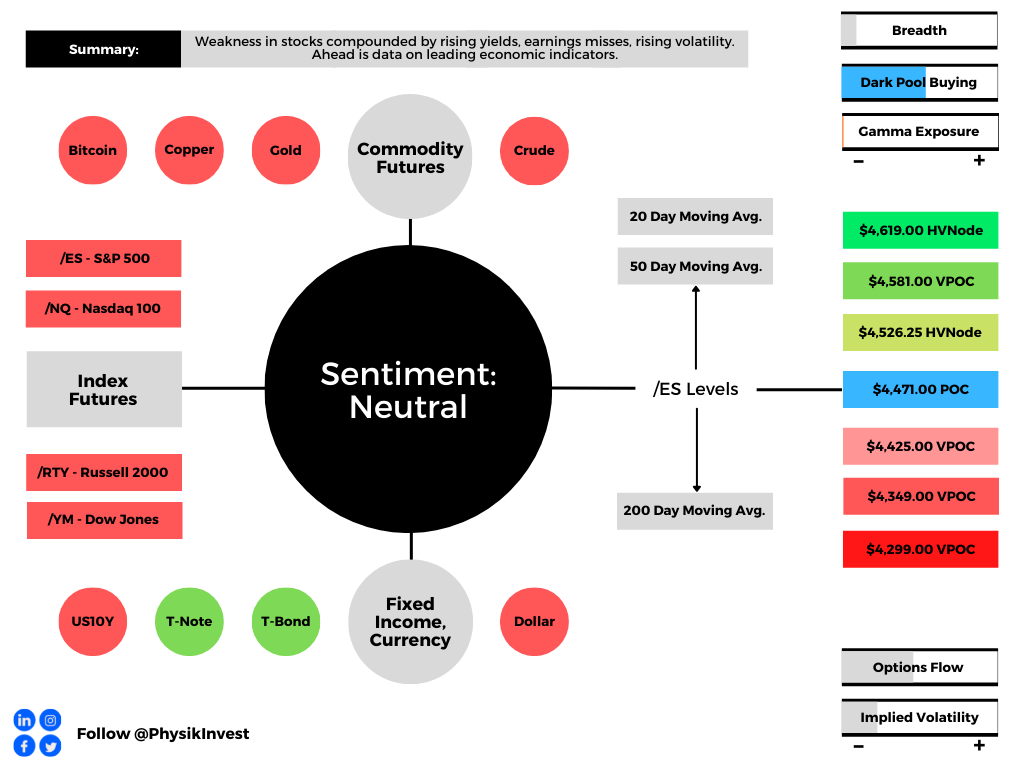
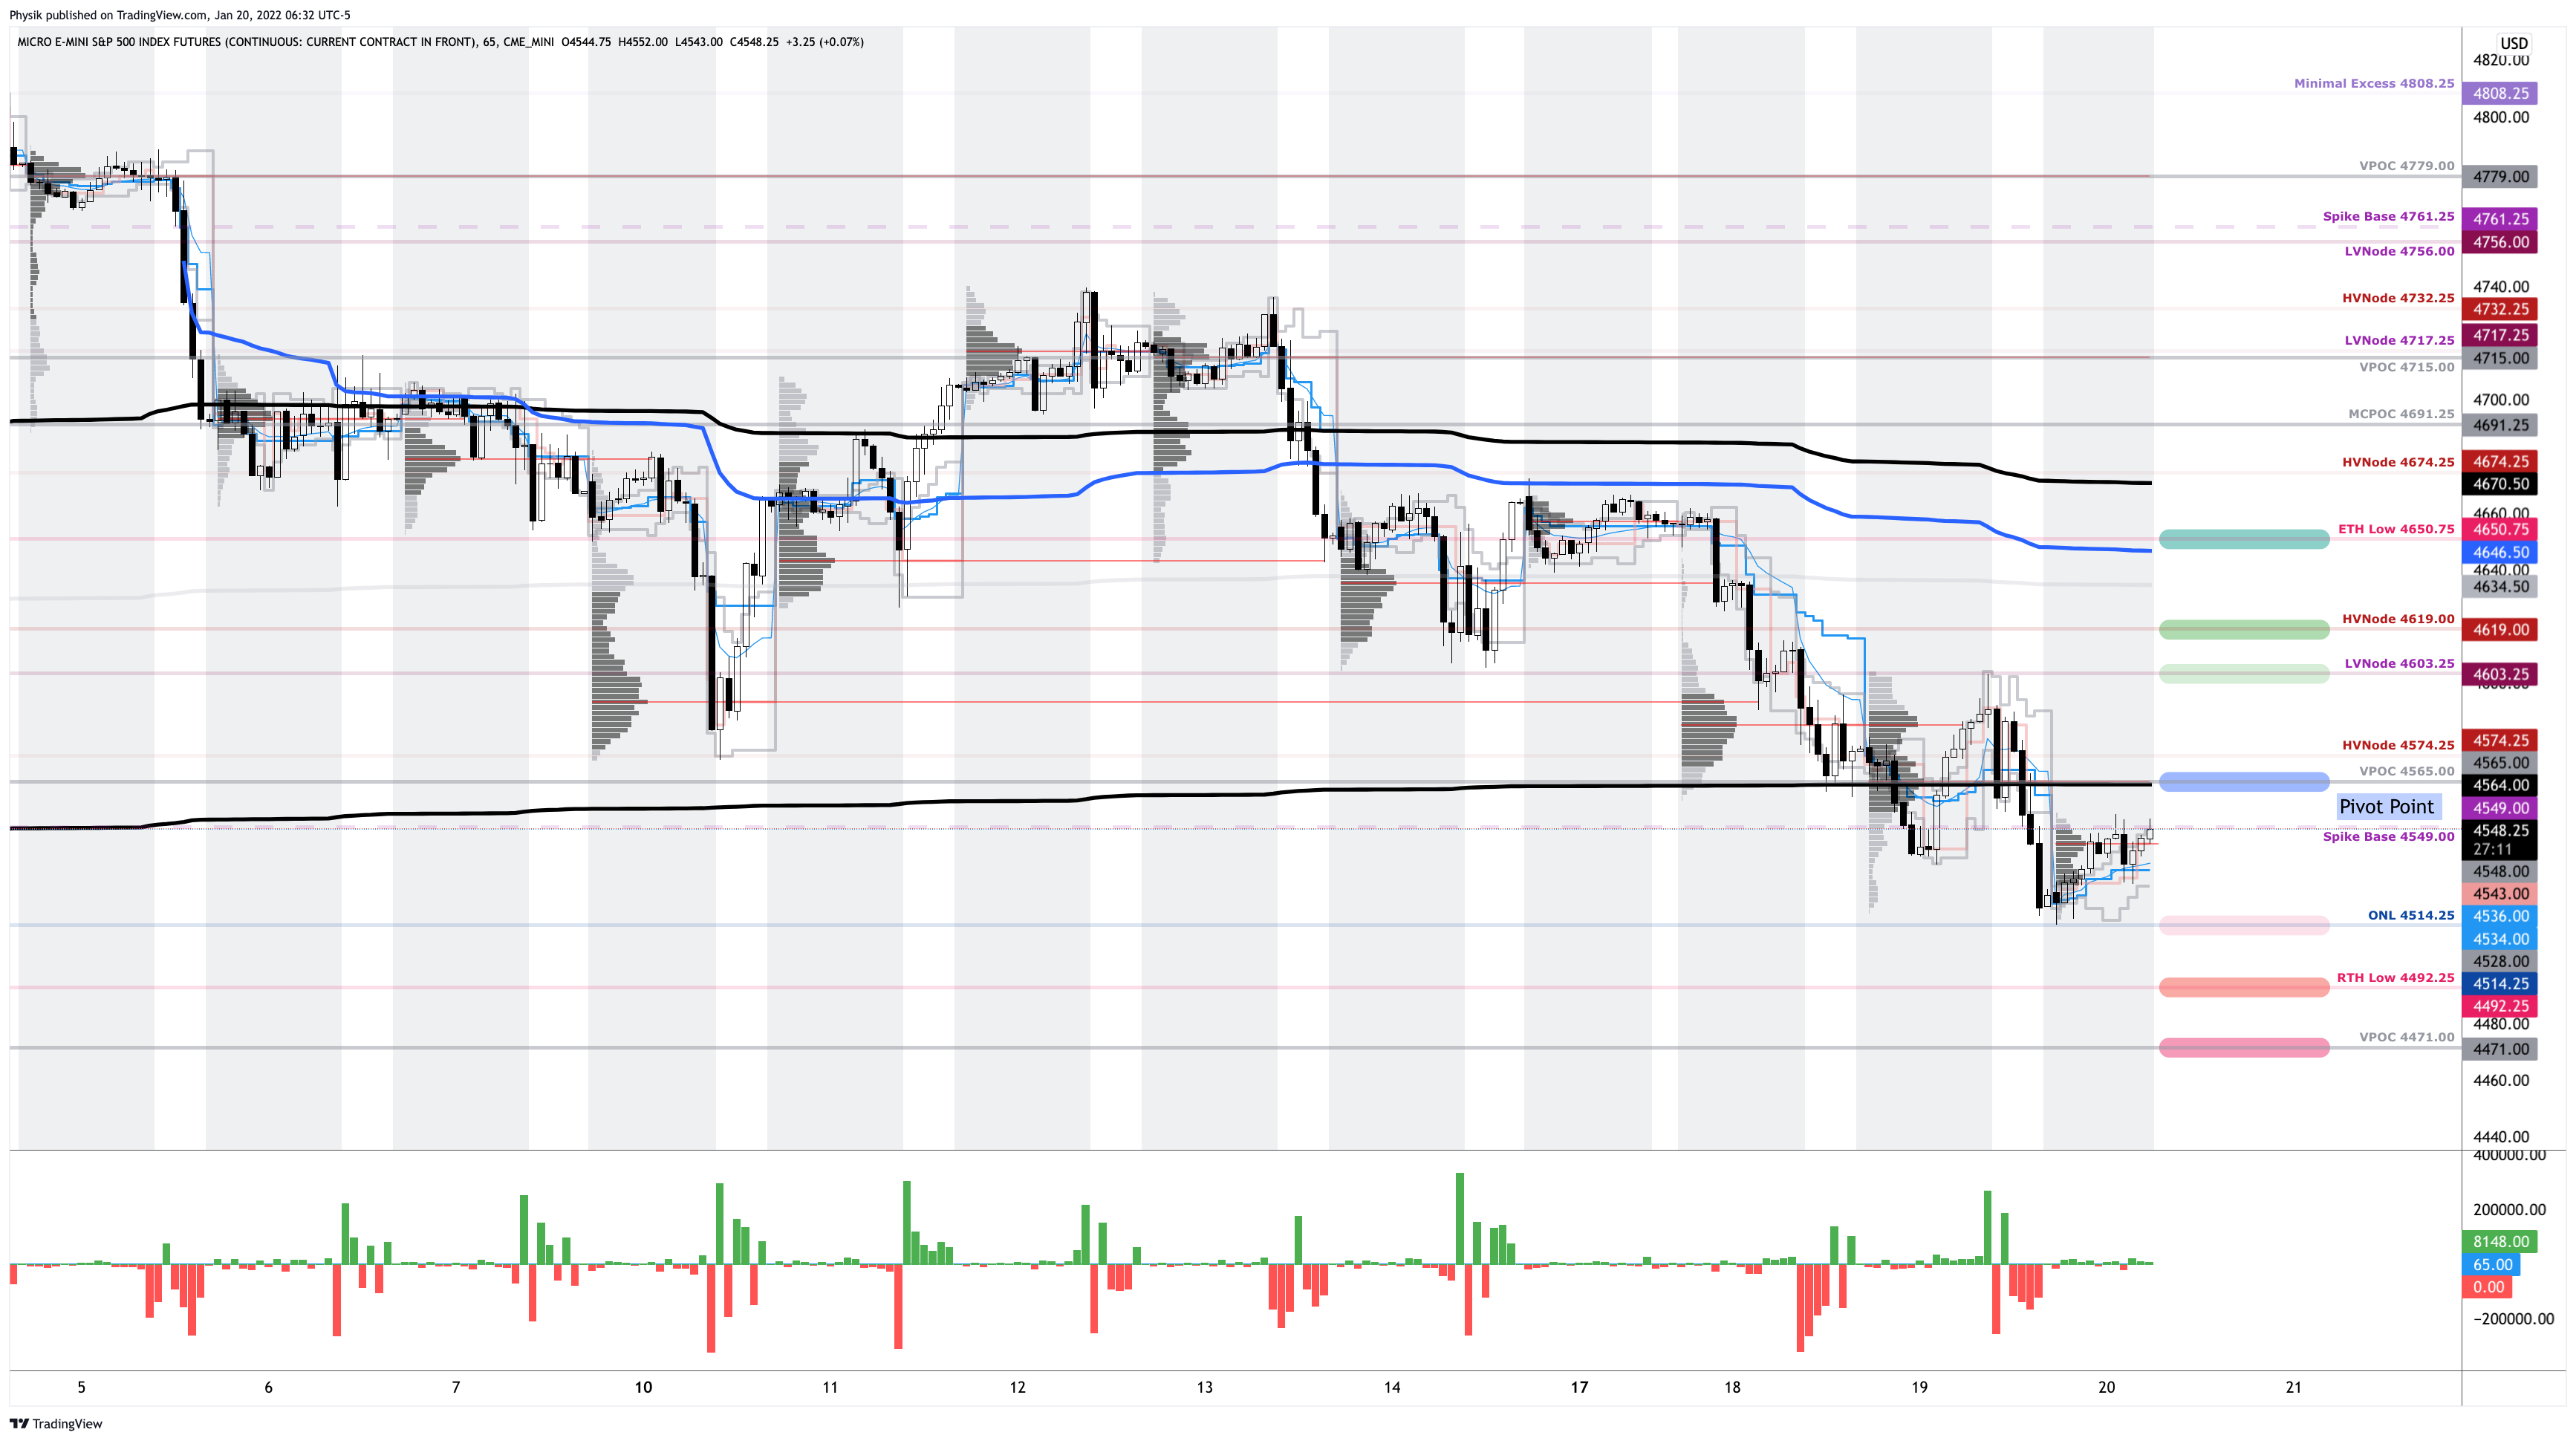
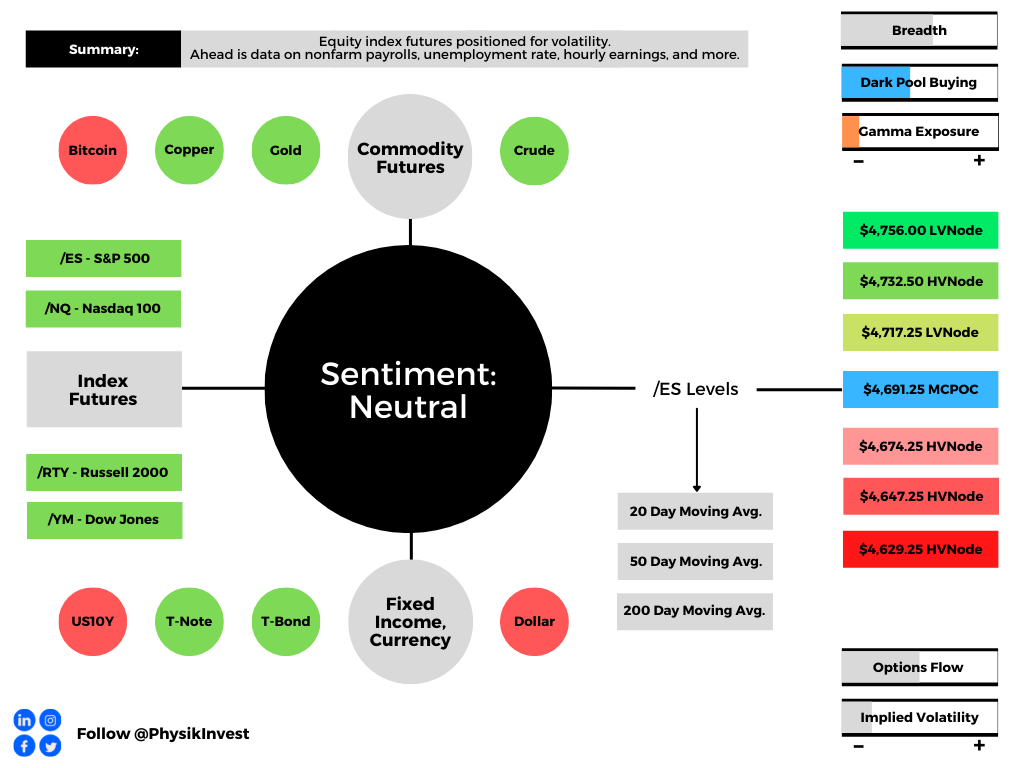
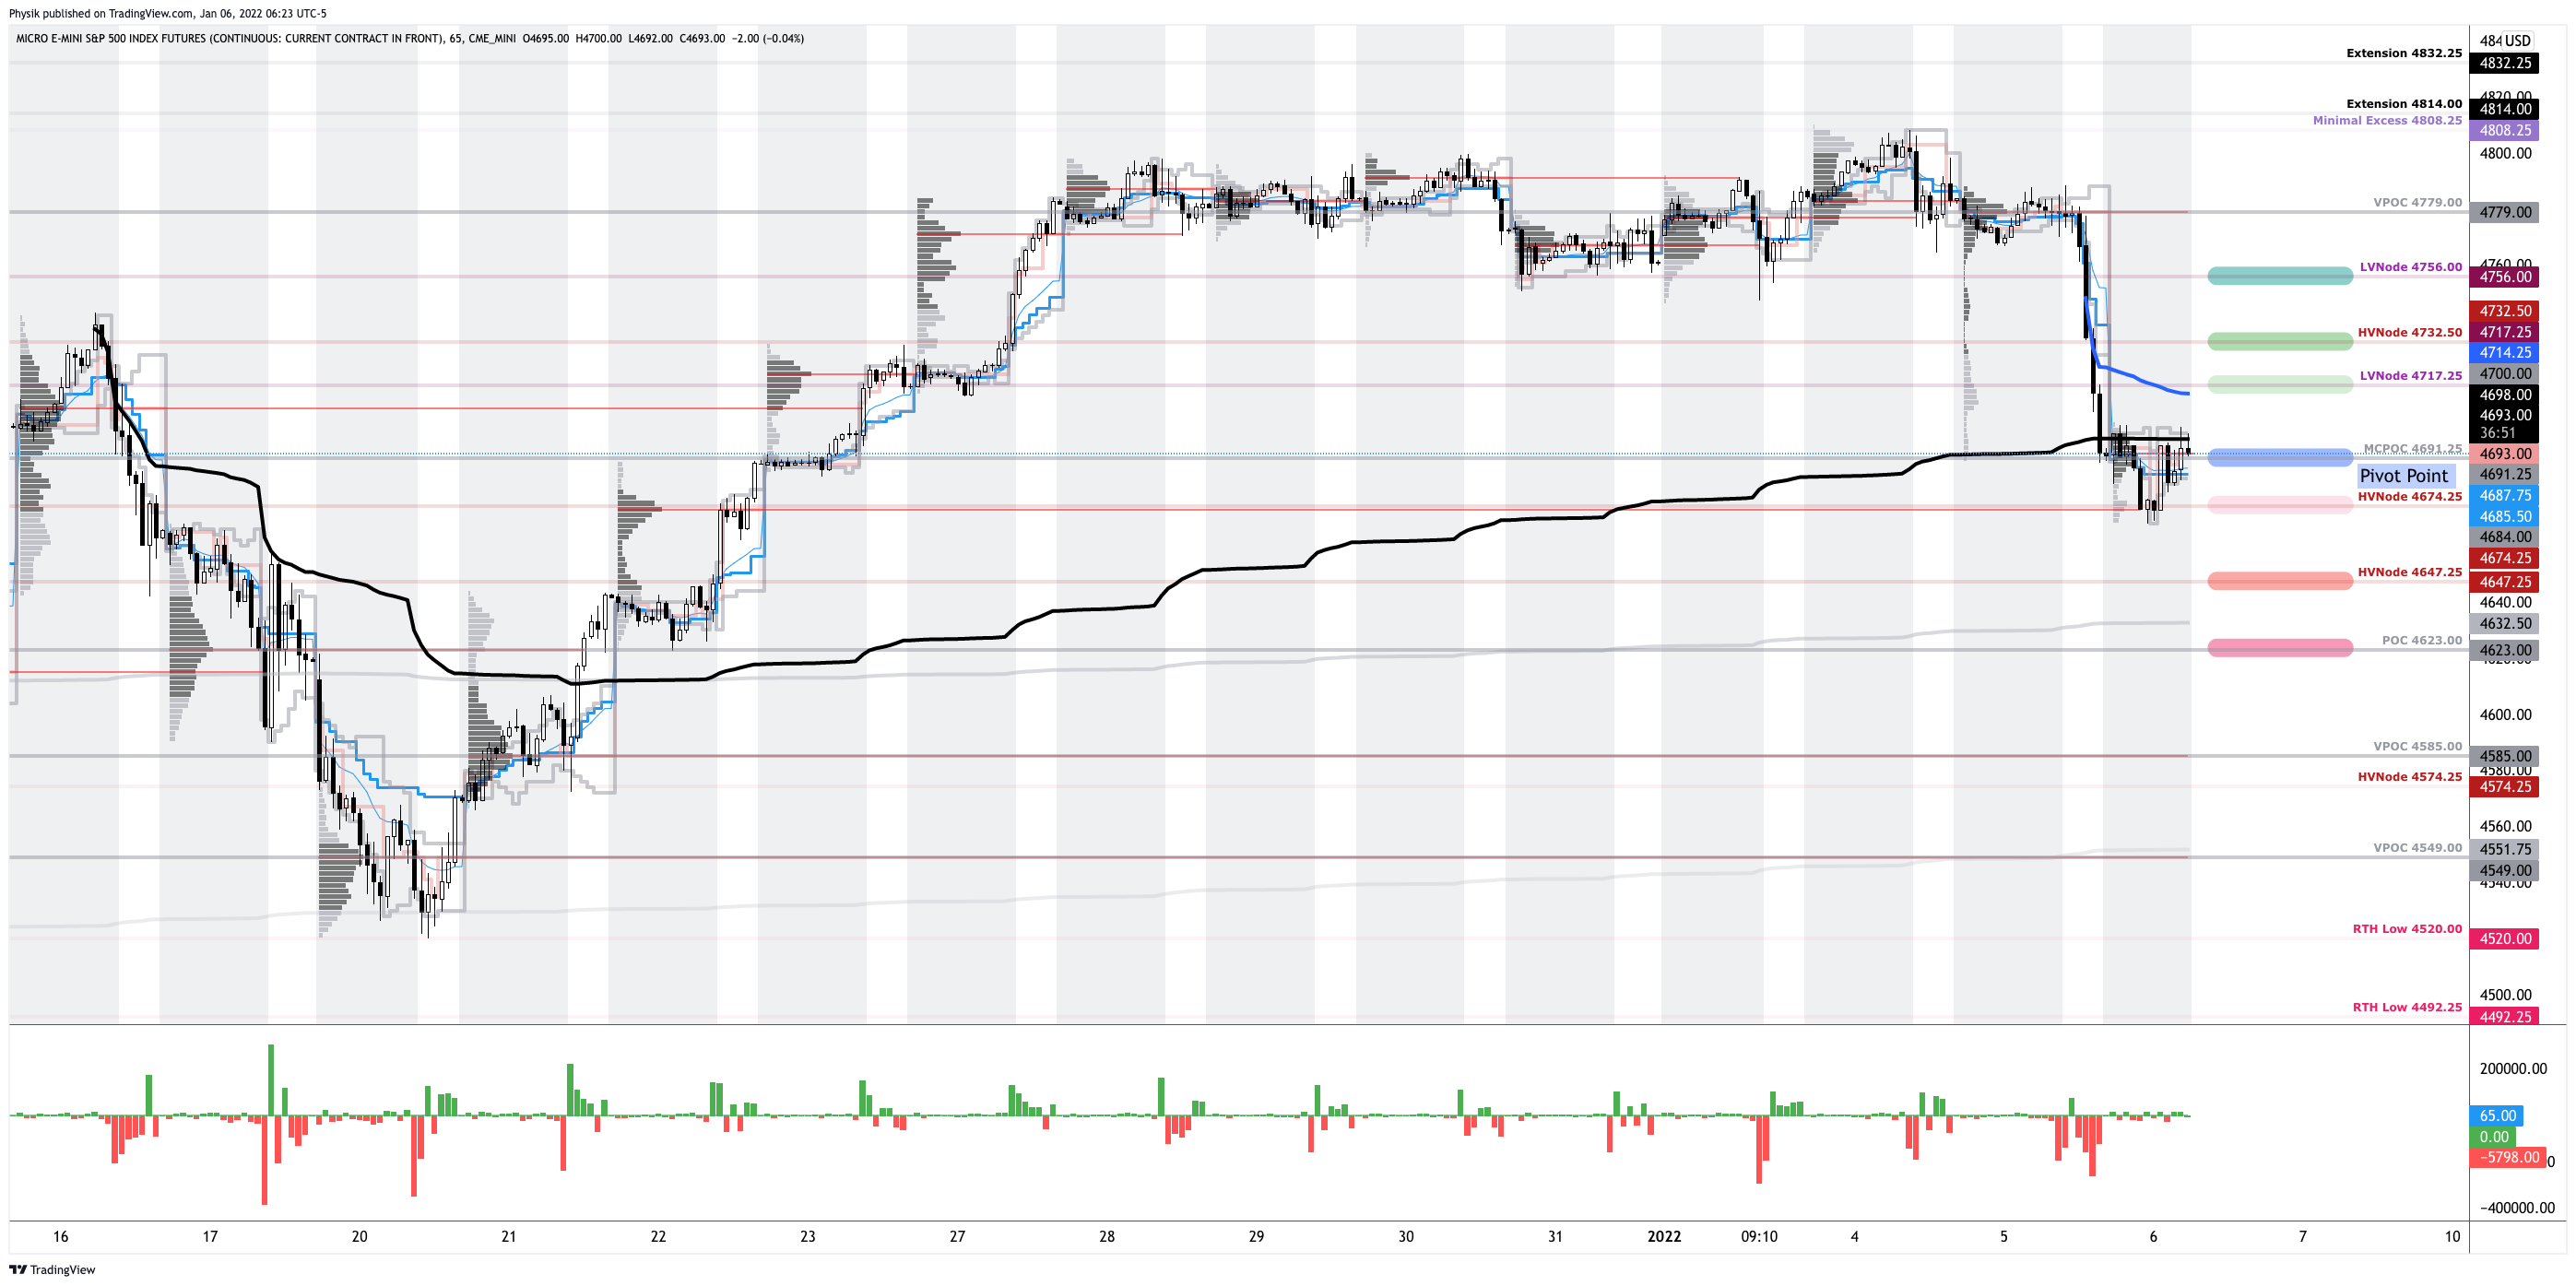
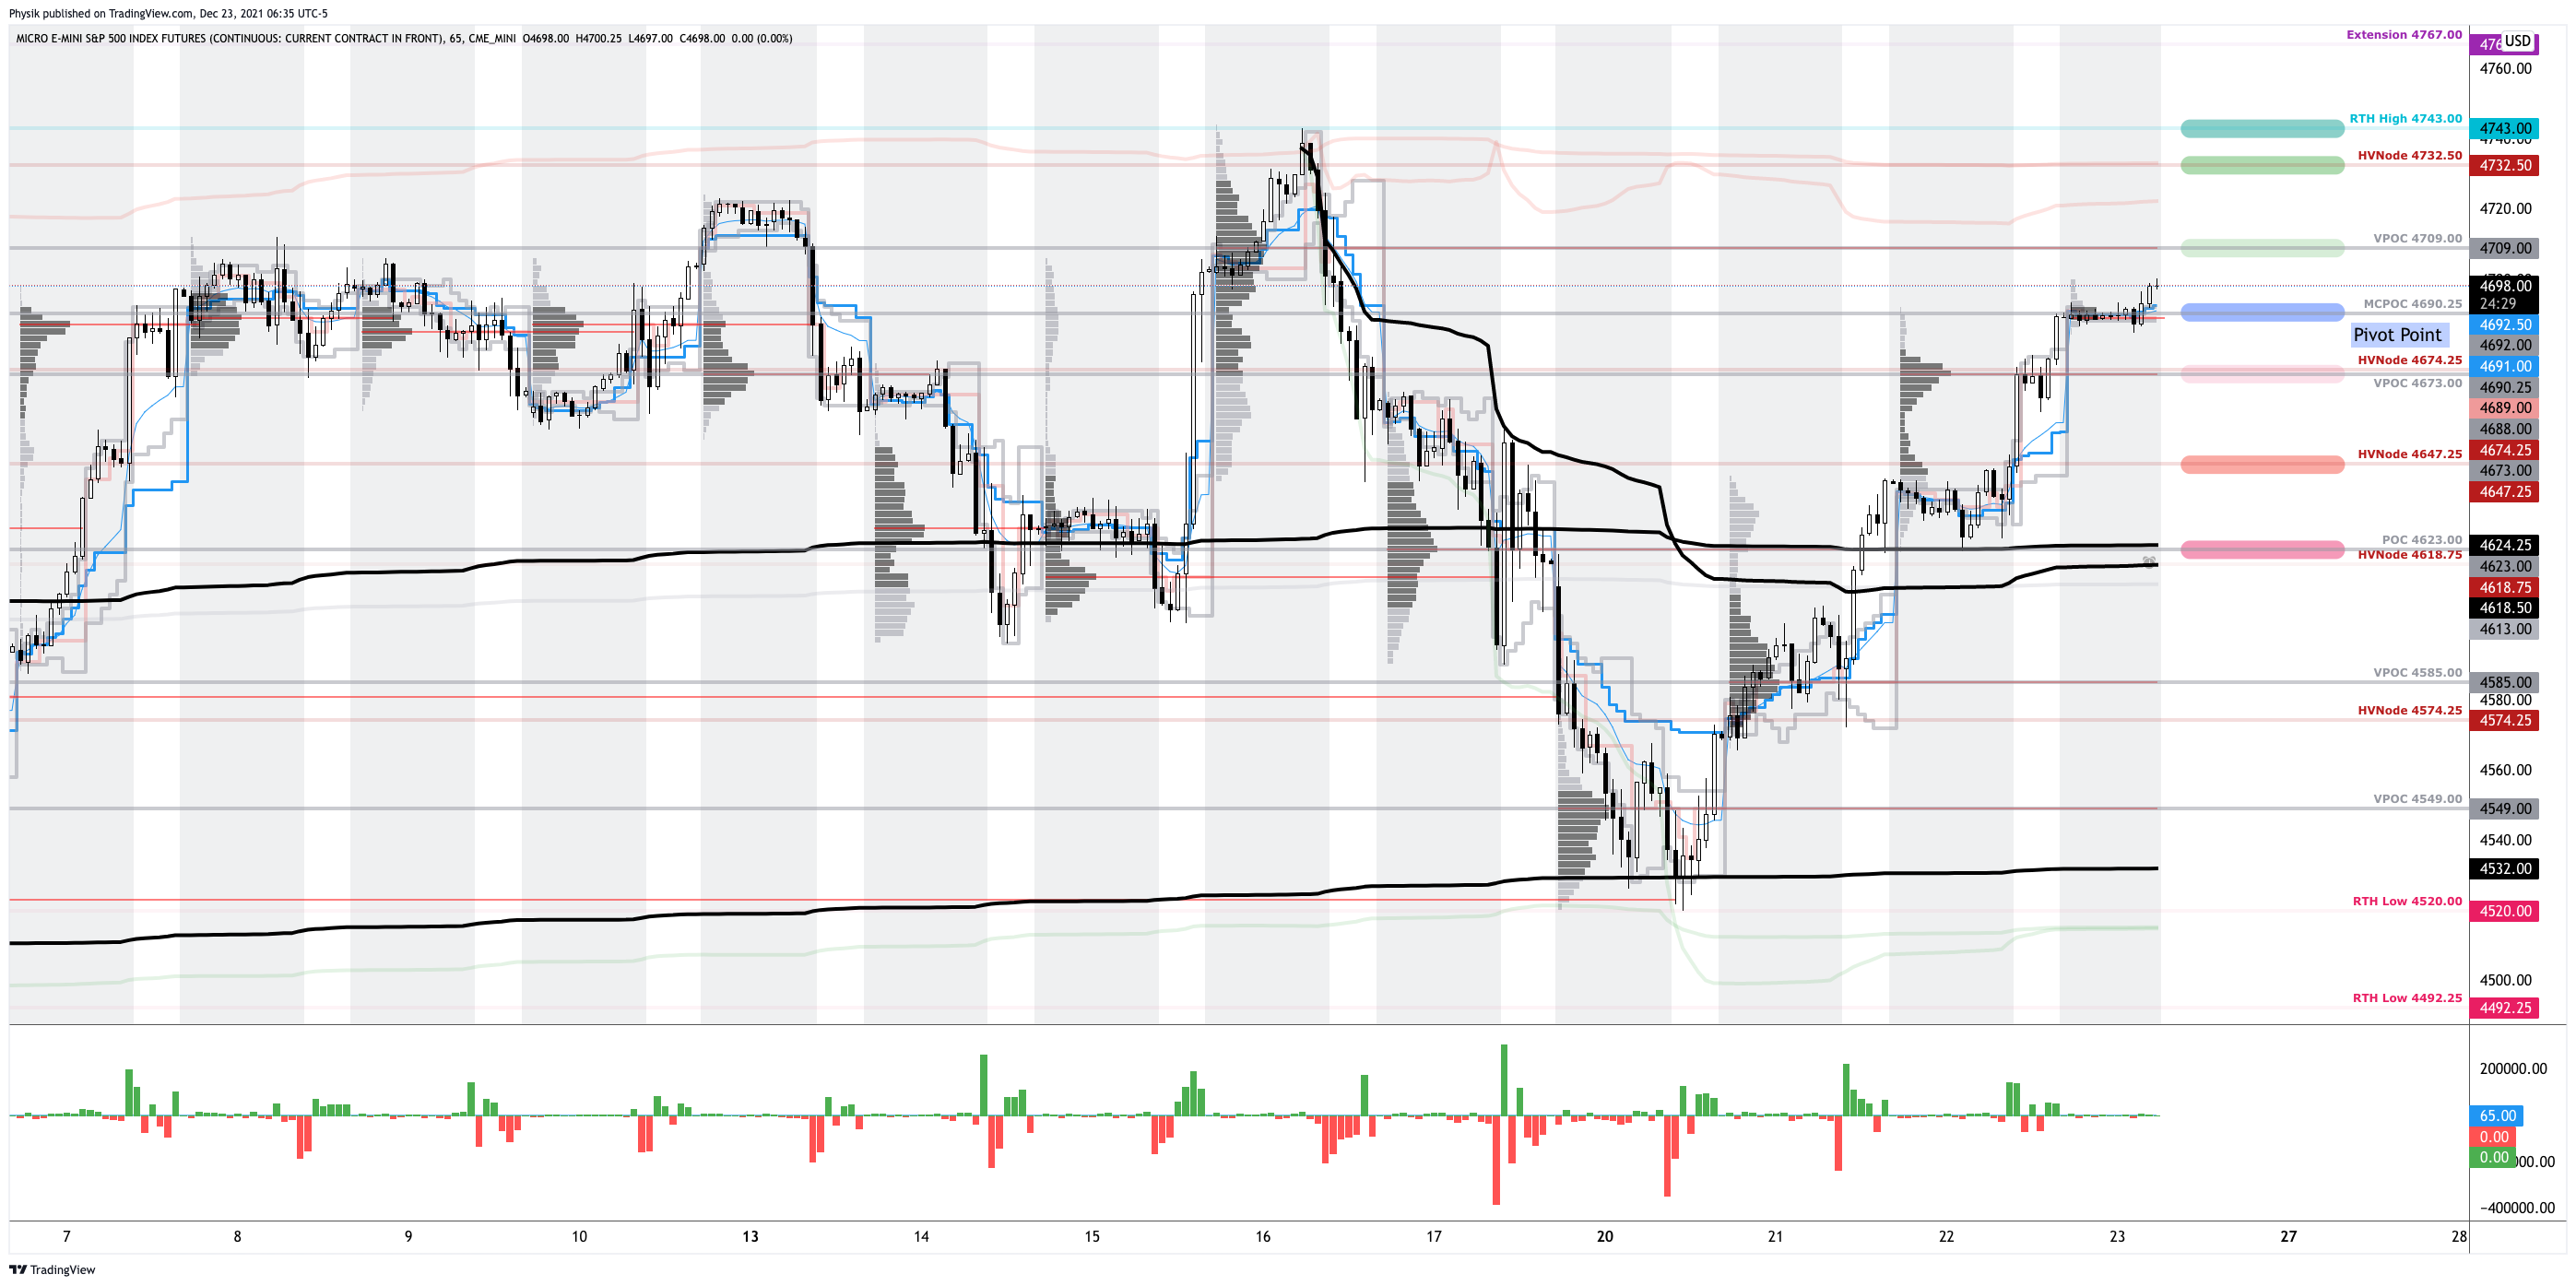
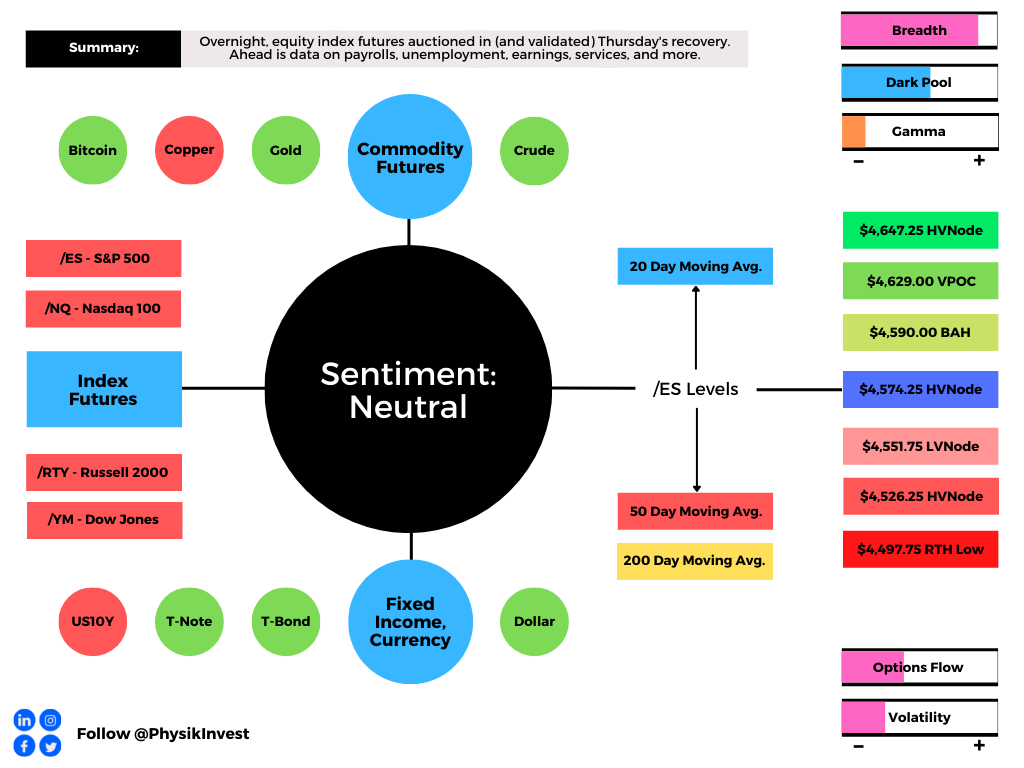
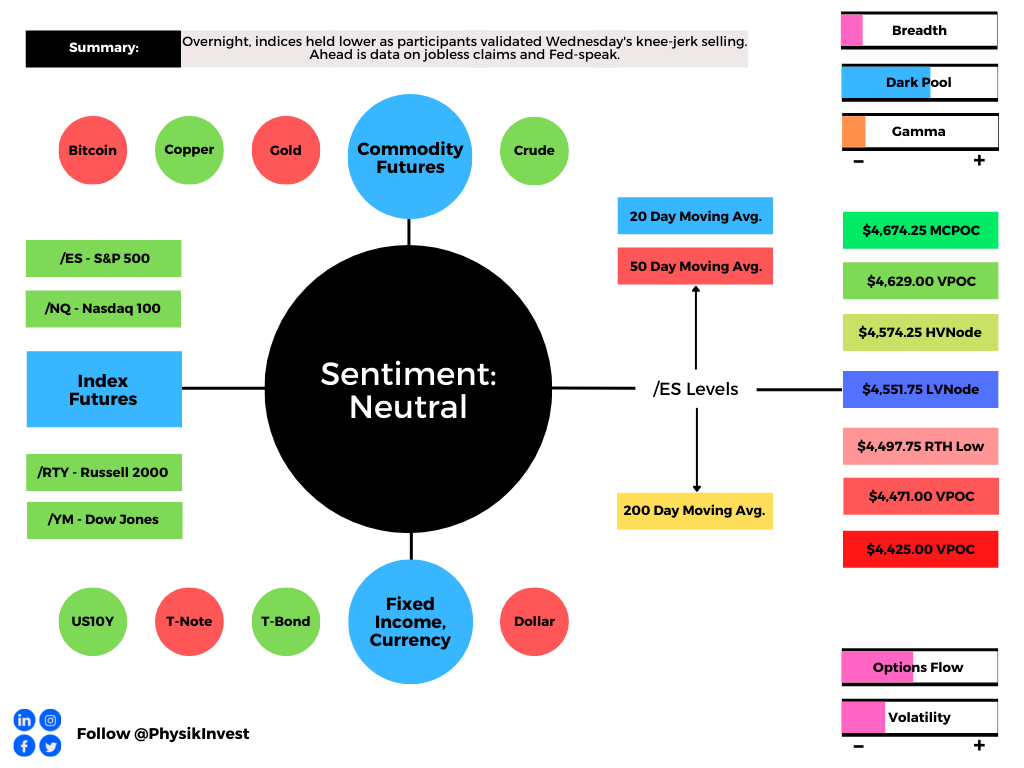
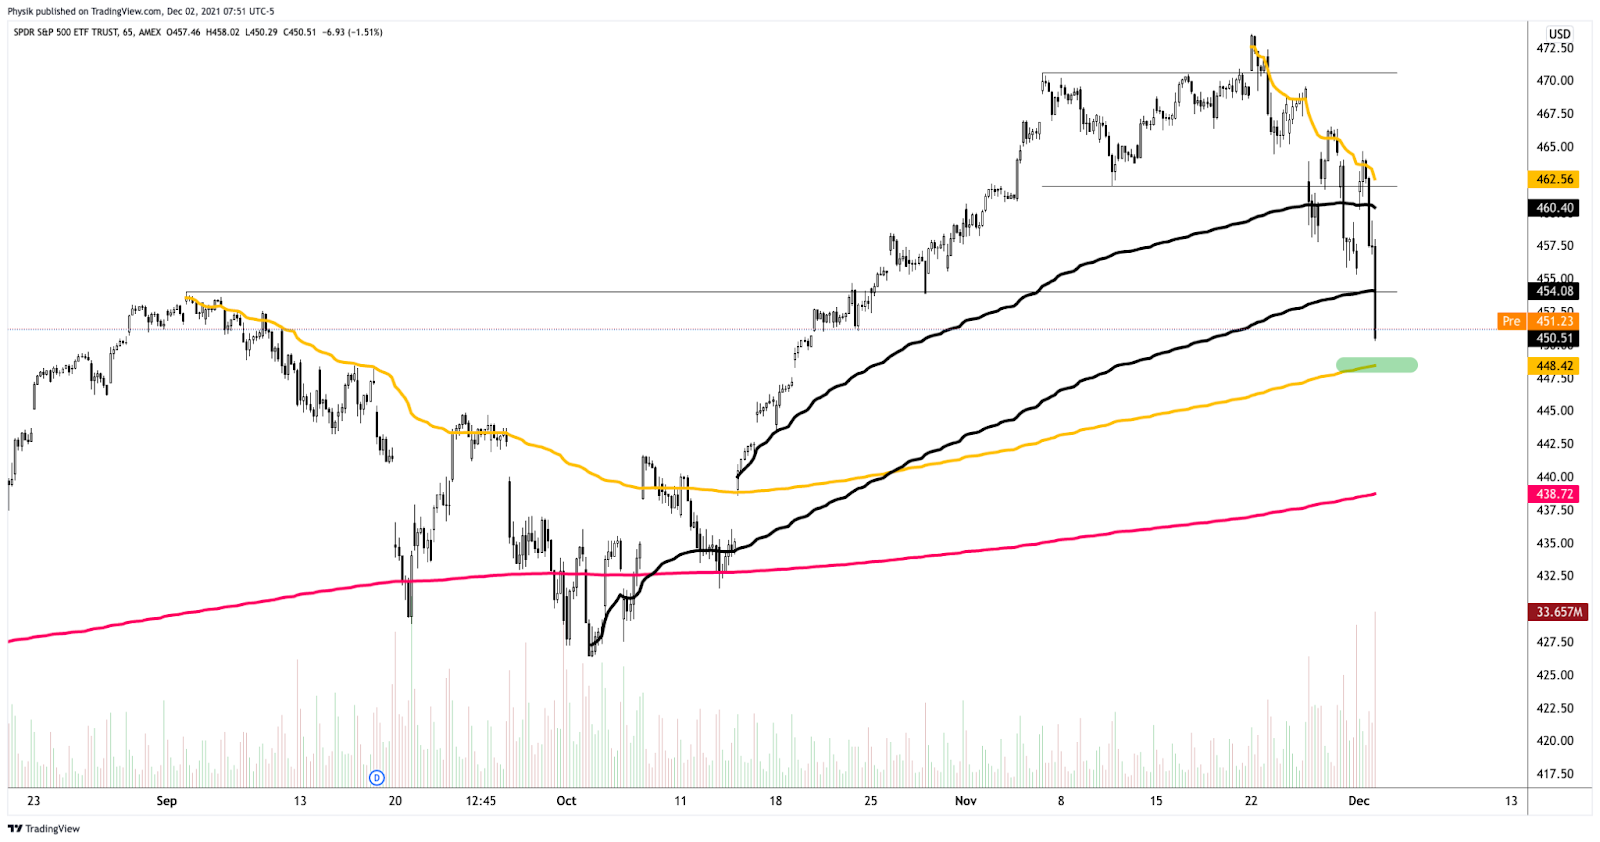
Technical: As of 6:30 AM ET, Tuesday’s regular session (9:30 AM – 4:00 PM ET), in the S&P 500, will likely open in the lower part of a negatively skewed overnight inventory, inside of prior-range and -value, suggesting a limited potential for immediate directional opportunity.
Spikes: Spikes mark the beginning of a break from value. Spikes higher (lower) are validated by trade at or above (below) the spike base (i.e., the origin of the spike).
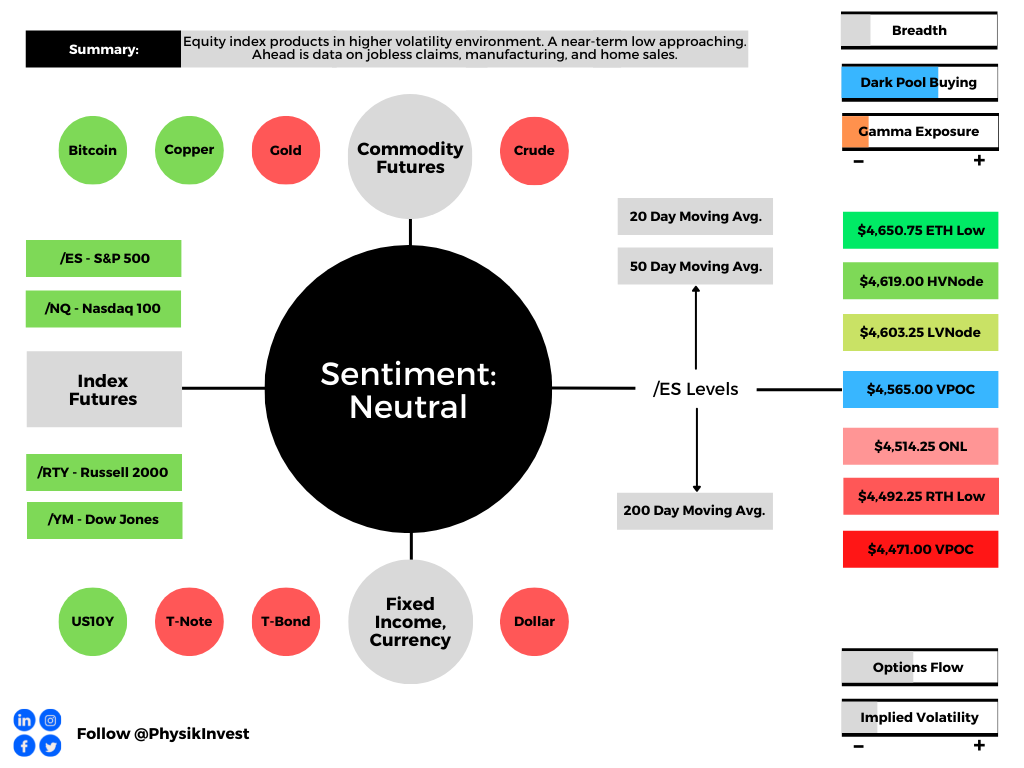
In the best case, the S&P 500 trades higher; activity above the $4,340.50 spike base puts in play the $4,411.75 regular trade high (RTH High). Initiative trade beyond the RTH High could reach as high as the $4,449.00 untested point of control (VPOC) and $4,486.75 RTH High, or higher.
In the worst case, the S&P 500 trades lower; activity below the $4,340.50 spike base puts in play the $4,285.00 VPOC. Initiative trade beyond the $4,285.00 VPOC could reach as low as the $4,212.50 RTH Low and $4,177.25 HVNode, or lower.
Considerations: The loss of trend across higher timeframes suggests a clear change in tone. This does not discount the potential for fast, but short-lived counter-trend rallies.
Click here to load today’s key levels into the web-based TradingView charting platform. Note that all levels are derived using the 65-minute timeframe. New links are produced, daily.

What People Are Saying
Definitions
Volume Areas: A structurally sound market will build on areas of high volume (HVNodes). Should the market trend for long periods of time, it will lack sound structure, identified as low volume areas (LVNodes). LVNodes denote directional conviction and ought to offer support on any test.
If participants were to auction and find acceptance into areas of prior low volume (LVNodes), then future discovery ought to be volatile and quick as participants look to HVNodes for favorable entry or exit.
Gamma: Gamma is the sensitivity of an option to changes in the underlying price. Dealers that take the other side of options trades hedge their exposure to risk by buying and selling the underlying. When dealers are short-gamma, they hedge by buying into strength and selling into weakness. When dealers are long-gamma, they hedge by selling into strength and buying into weakness. The former exacerbates volatility. The latter calms volatility.
POCs: POCs are valuable as they denote areas where two-sided trade was most prevalent in a prior day session. Participants will respond to future tests of value as they offer favorable entry and exit.
Options Expiration (OPEX): Traditionally, option expiries mark an end to pinning (i.e, the theory that market makers and institutions short options move stocks to the point where the greatest dollar value of contracts will expire) and the reduction dealer gamma exposure.
About
After years of self-education, strategy development, mentorship, and trial-and-error, Renato Leonard Capelj began trading full-time and founded Physik Invest to detail his methods, research, and performance in the markets.
Capelj is also a Benzinga finance and technology reporter interviewing the likes of Shark Tank’s Kevin O’Leary, JC2 Ventures’ John Chambers, FTX’s Sam Bankman-Fried, and ARK Invest’s Catherine Wood, as well as a SpotGamma contributor developing insights around impactful options market dynamics.
Disclaimer
Physik Invest does not carry the right to provide advice.
In no way should the materials herein be construed as advice. Derivatives carry a substantial risk of loss. All content is for informational purposes only.