Categories
Commentary

Daily Brief For March 14, 2022

Editor’s Note: The Daily Brief is a free glimpse into the prevailing fundamental and technical drivers of U.S. equity market products. Join the 200+ that read this report daily, below!

What Happened

A lot to unpack, today. Part of the newsletter may be cut off, as a result, in your inbox. Just click to view in another window.

Overnight, equity index futures auctioned sideways-to-higher, masking turmoil in products listed abroad, as well as commodities and fixed income.

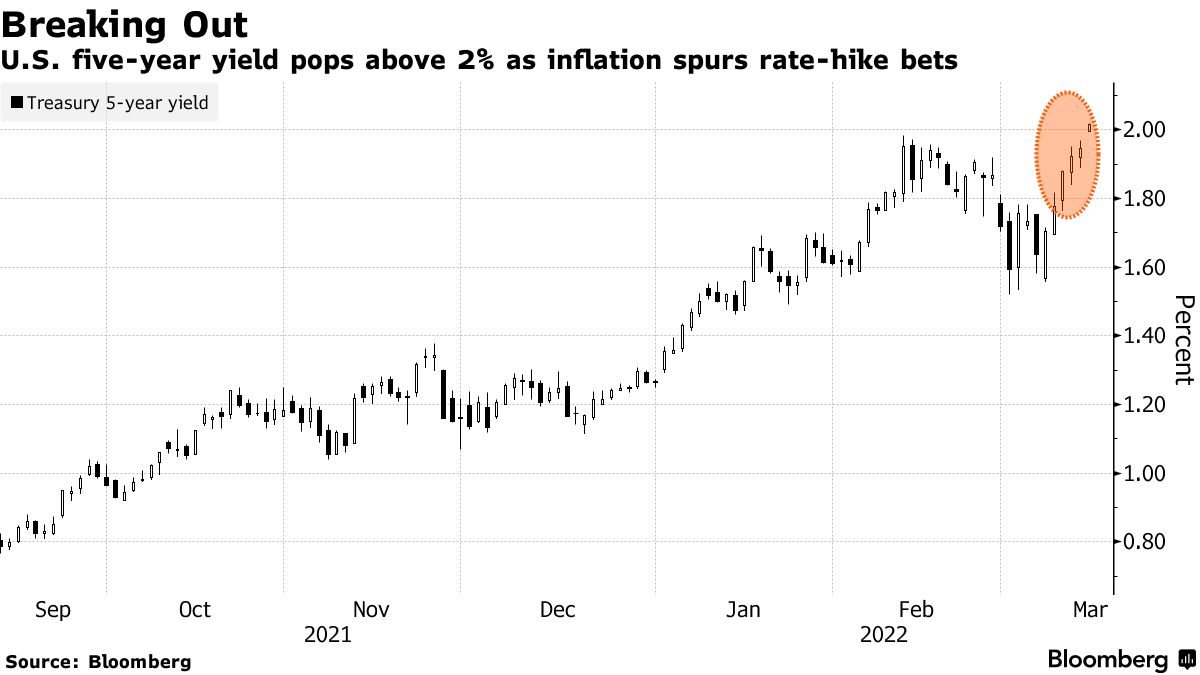
In regards to bonds, they slumped (globally) in light of participants’ pricing in monetary action given heightened inflation. The Federal Reserve, Bank of England, and Bank of Japan are to issue policy updates this week.

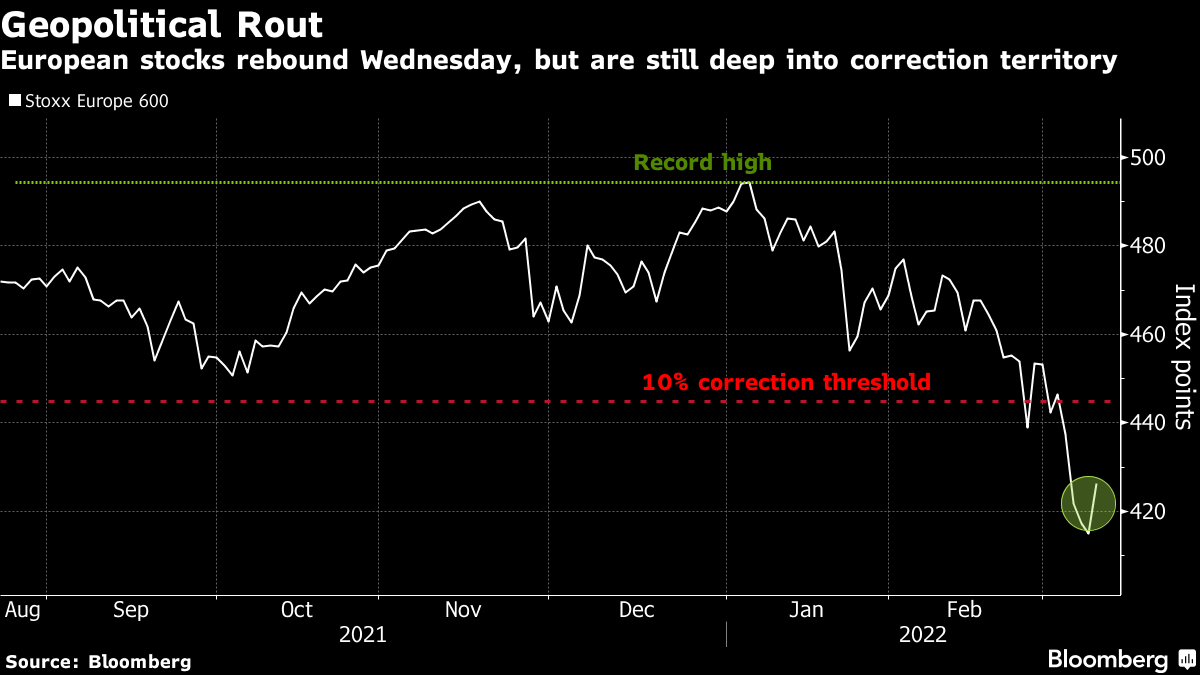
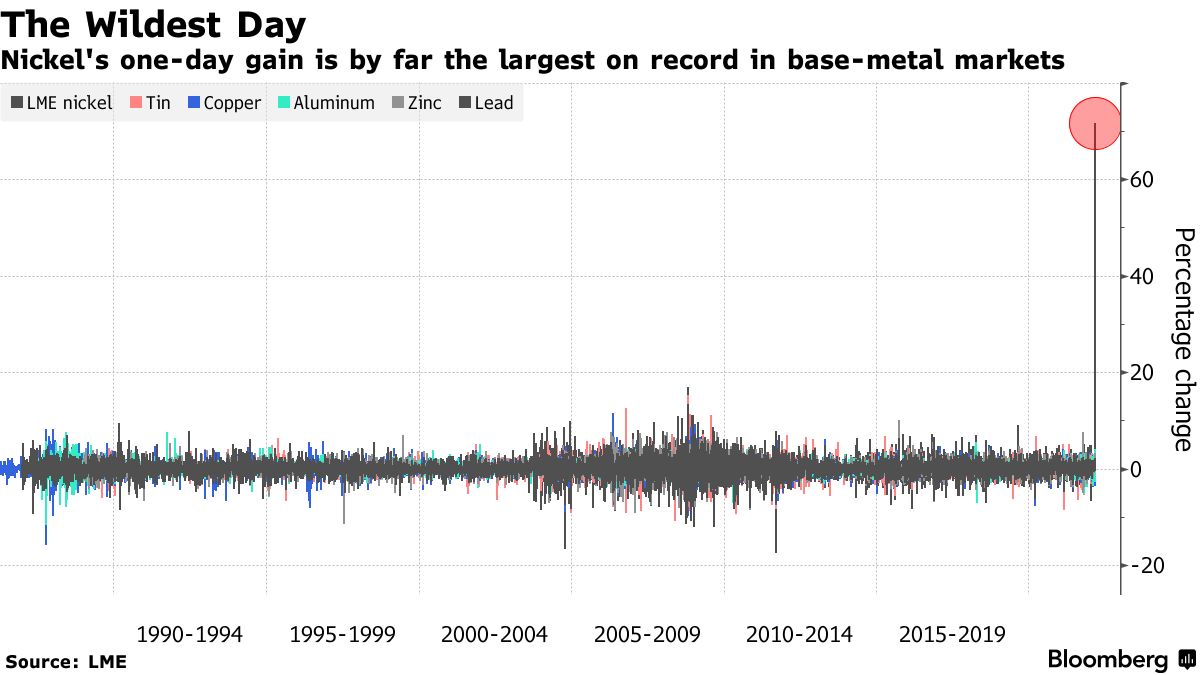
Commodity markets are still roiling after a price spike in some products “created a systemic risk” that prompted exchanges to cancel trades, while equity markets in Asia saw their worst-selling in years.

The Hang Seng China Enterprises Index (INDEX: HSCEI) closed down 7.2%, the biggest drop since 2008. This was after Russia asked for China’s assistance in Ukraine (which could result, later, in sanctions from the U.S.), thus compounding uncertainties with respect to an ongoing regulatory crackdown.

Ahead is data on 1- and 3-year inflation expectations (11:00 AM ET).

Graphic updated 6:11 AM ET. Sentiment Neutral if expected /ES open is inside of the prior day’s range. /ES levels are derived from the profile graphic at the bottom of the following section. Levels may have changed since initially quoted; click here for the latest levels. SqueezeMetrics Dark Pool Index (DIX) and Gamma (GEX) calculations are based on where the prior day’s reading falls with respect to the MAX and MIN of all occurrences available. A higher DIX is bullish. At the same time, the lower the GEX, the more (expected) volatility. Learn the implications of volatility, direction, and moneyness. SHIFT data used for S&P 500 (INDEX: SPX) options activity. Note that options flow is sorted by the call premium spent; if more positive, then more was spent on call options. Breadth reflects a reading of the prior day’s NYSE Advance/Decline indicator. VIX reflects a current reading of the CBOE Volatility Index (INDEX: VIX) from 0-100.

What To Expect

Fundamental: We may attribute participants’ uncertainty to how far monetary policymakers want to tighten, slower economic growth, the implications of geopolitical tensions, imminent Russian defaults, a resurgence in COVID-19 abroad, and more.

Graphic: Via Bloomberg. As Treasury yields rise, participants price in Fed tightening.

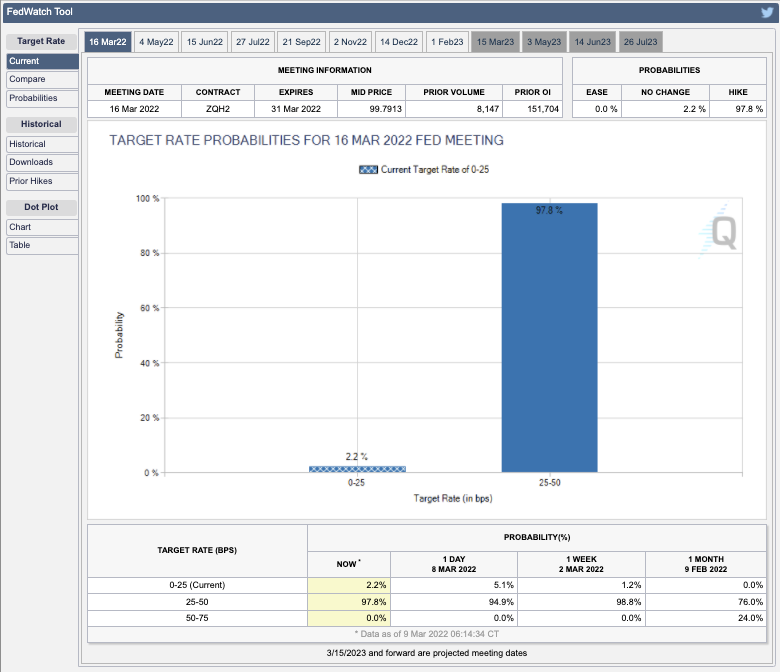
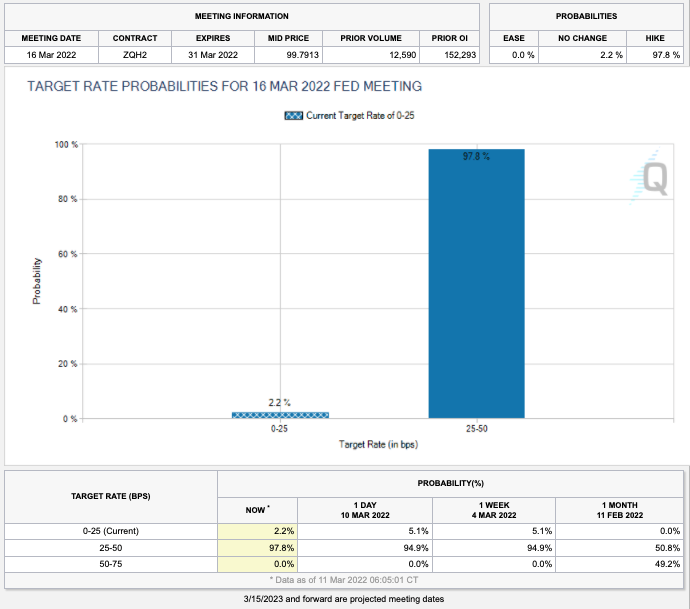
As revealed by metrics like CME Group Inc’s (NASDAQ: CME) FedWatch Tool, for instance, participants are pricing a high certainty of an increase in rates.

Graphic: Via CME Group Inc (NASDAQ: CME). Participants price in an increased probability of a shift in the target rate. Click here to access the FedWatch Tool.

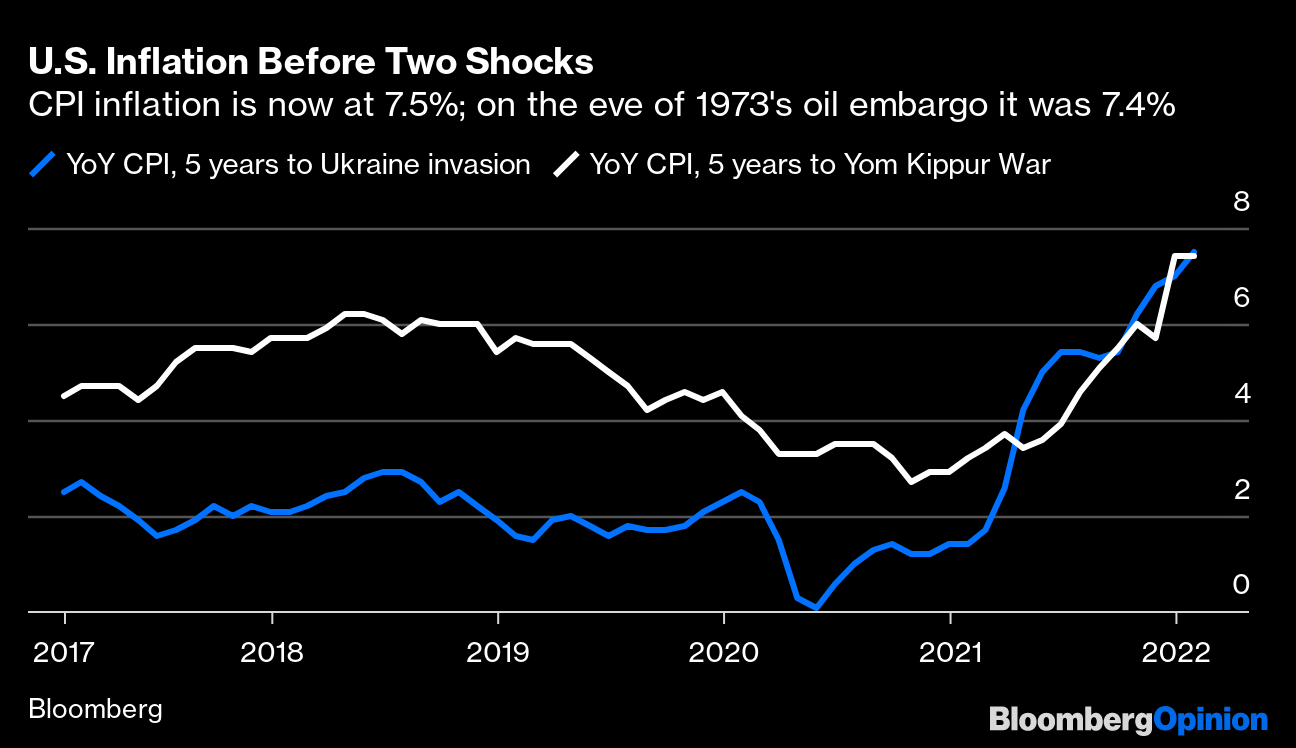
“Yields are reflecting a surprise higher shift upward in inflation expectations,” said Morgan Stanley’s (NYSE: MS) Jim Caron. “Many thought inflation would peak in the first quarter and fall. Now, with oil prices, inflation may stay high.”

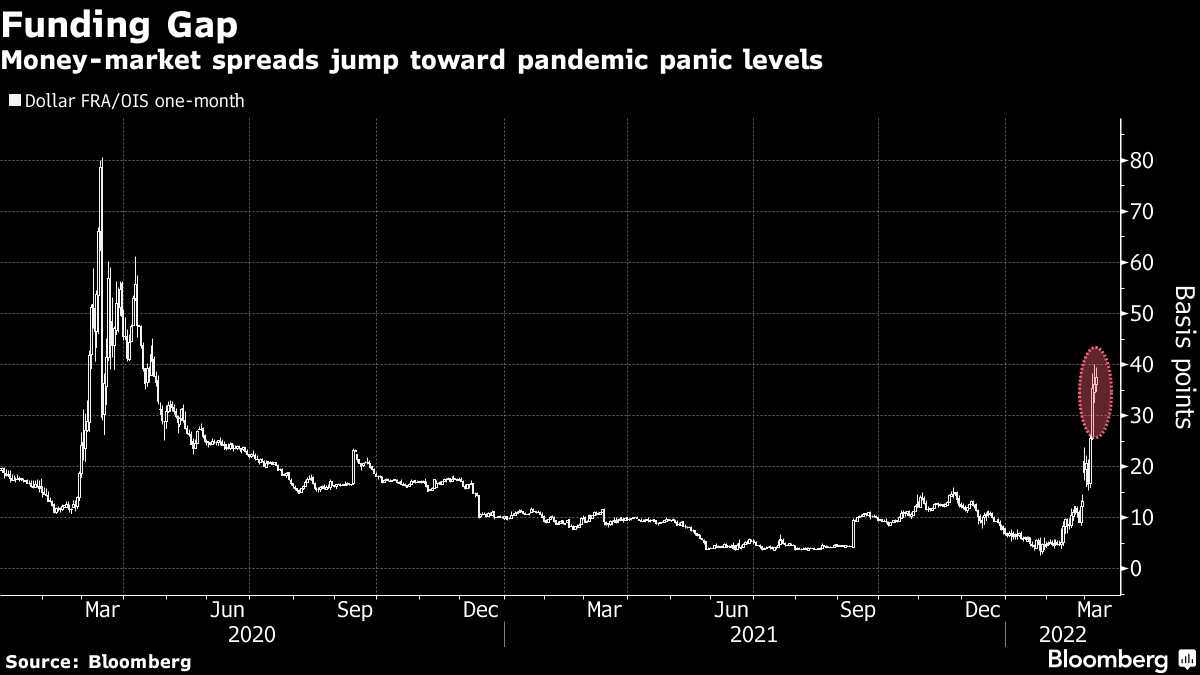
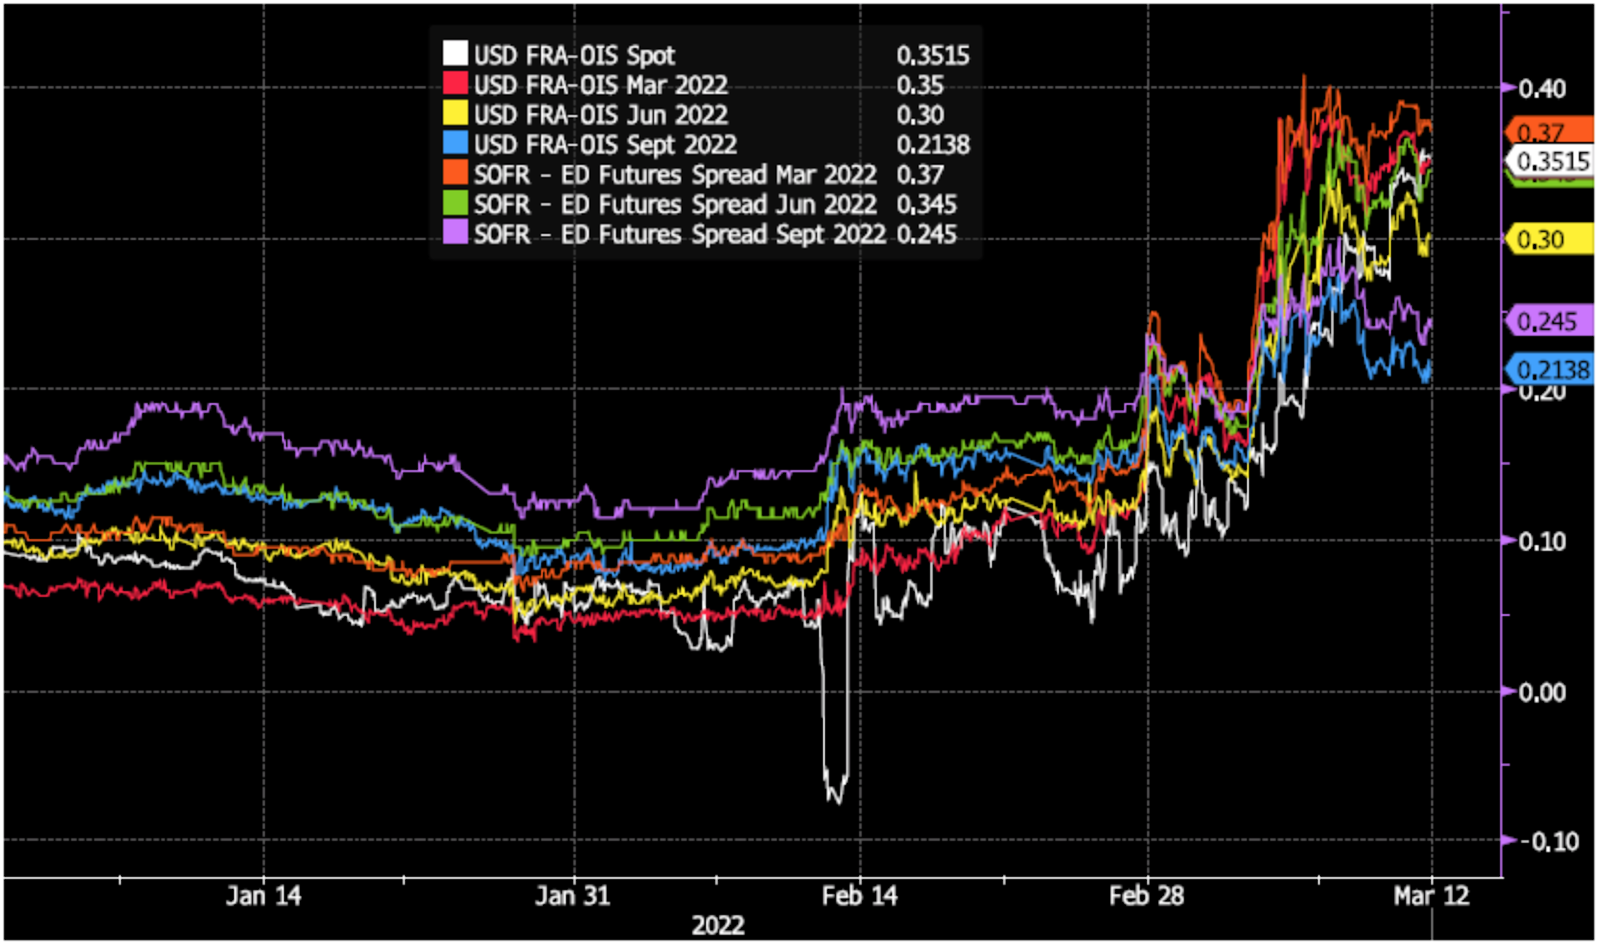
At the same time, there are some indications of market stresses.

Graphic: Via McClellan Financial Publications. “The Daily A-D Line for corporate high yield bonds continues to look quite ugly. That is a concern for the overall stock market because high yield bonds drink from the same liquidity pool as stocks do, and these bonds are arguably more sensitive than stocks are to liquidity problems.”

As explained in DC’s Chartbook discussion, however, “stress in money markets is for now mostly contained and not an imminent risk to financial sustainability.”

Graphic: Via DC’s Chartbook. Funding spreads “have stabilized over the past week, not making new highs after the gap-up open on March 7. These are encouraging signs that the stress in money markets is for now mostly contained and not an imminent risk to financial stability.”

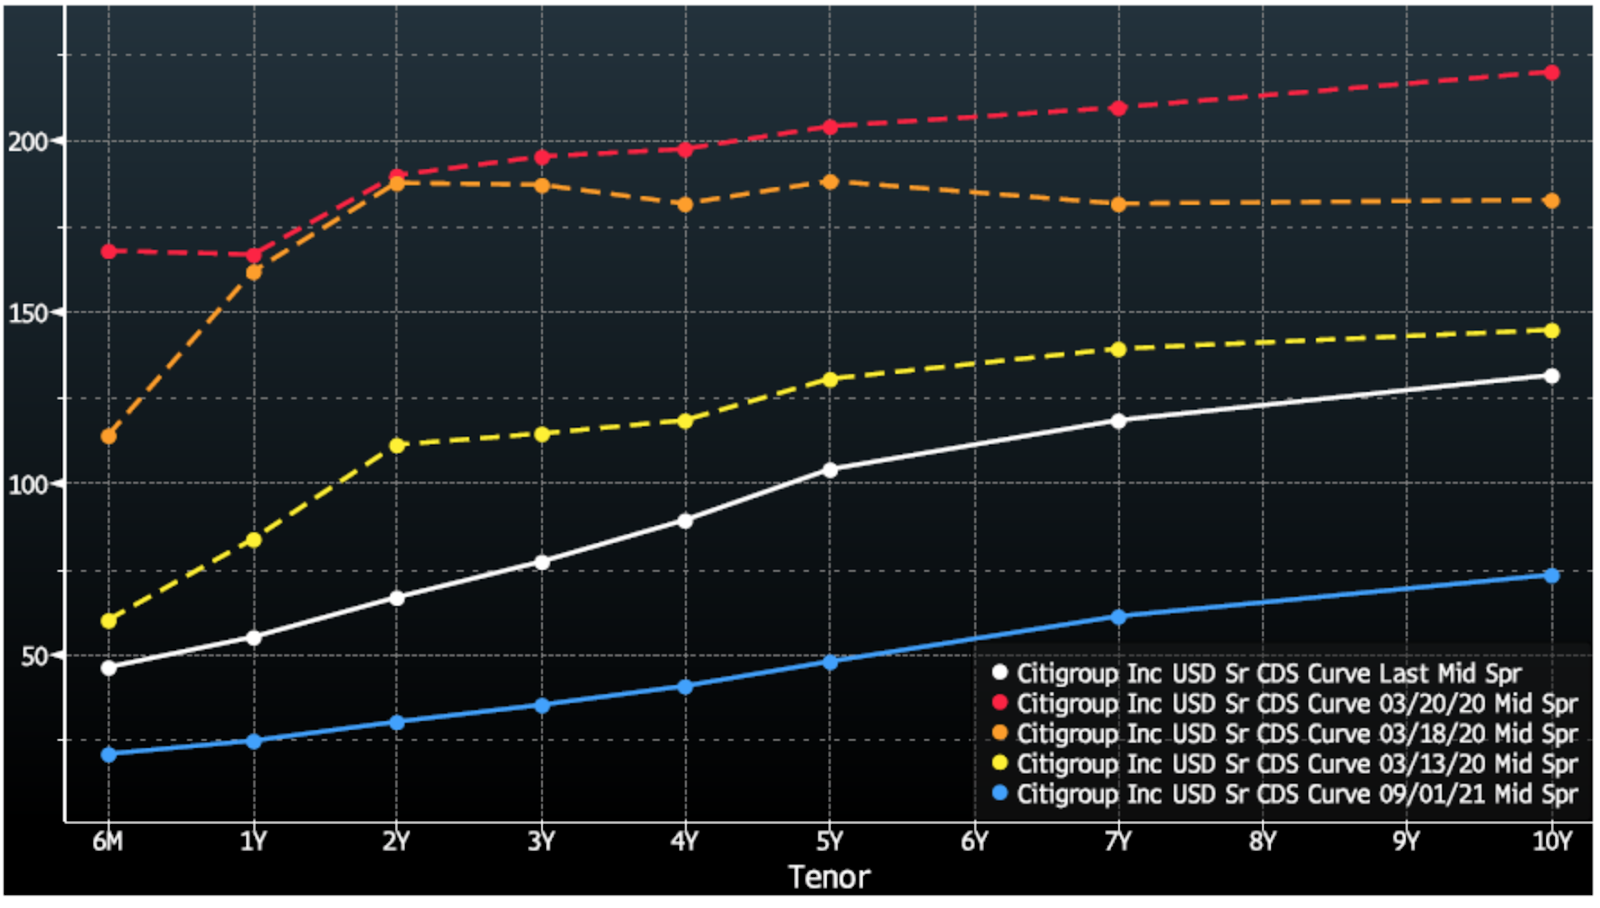
In regards to credit default swap spreads, though they are wider than in recent history, “they are still far below where they were during times of material solvency risk such as March of 2020, and the term structure of CDS spreads suggests this is more due to mechanical de-risking.”

Graphic: Via DC’s Chartbook. Cost of credit insurance for Citigroup Inc (NYSE: C). Hedging with CDS results in mechanical steepening which raises the curve. “This is in sharp contrast to the curve in March 2020 (yellow, orange, and red), when the short end of the CDS curve rose quickly and flattened the curve.”

Okay. So, the “financial system is functioning smoothly.” How do you trade slowing growth in the face of heightened inflation?

As Andreas Steno Larsen of Heimstaden explains, the “best way to assess this question is via a historical study of empirical returns during times of actual stagflation dating back to the early 1970s.”

Graphic: Via Andreas Steno Larsen. “Heatmap on quarterly inflation-adjusted returns across asset classes during stagflation periods (1973 – today).”

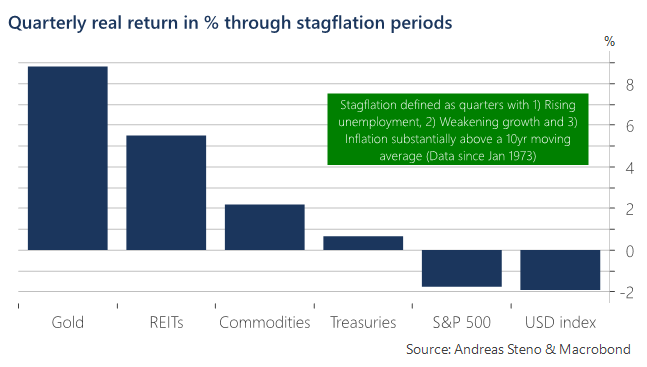
“Assets that tend to keep the value intact or even increase in real terms through stagflation are typically negatively correlated to low or negative real rates, which is why gold and real estate (REITs) are some of the best places to hide during stagflation,” Steno Larsen says. 

“Equities overall struggle to perform in real terms and so do bonds, which might be even worse this time around due to the outset of bond yields into this potential stagflationary environment.”

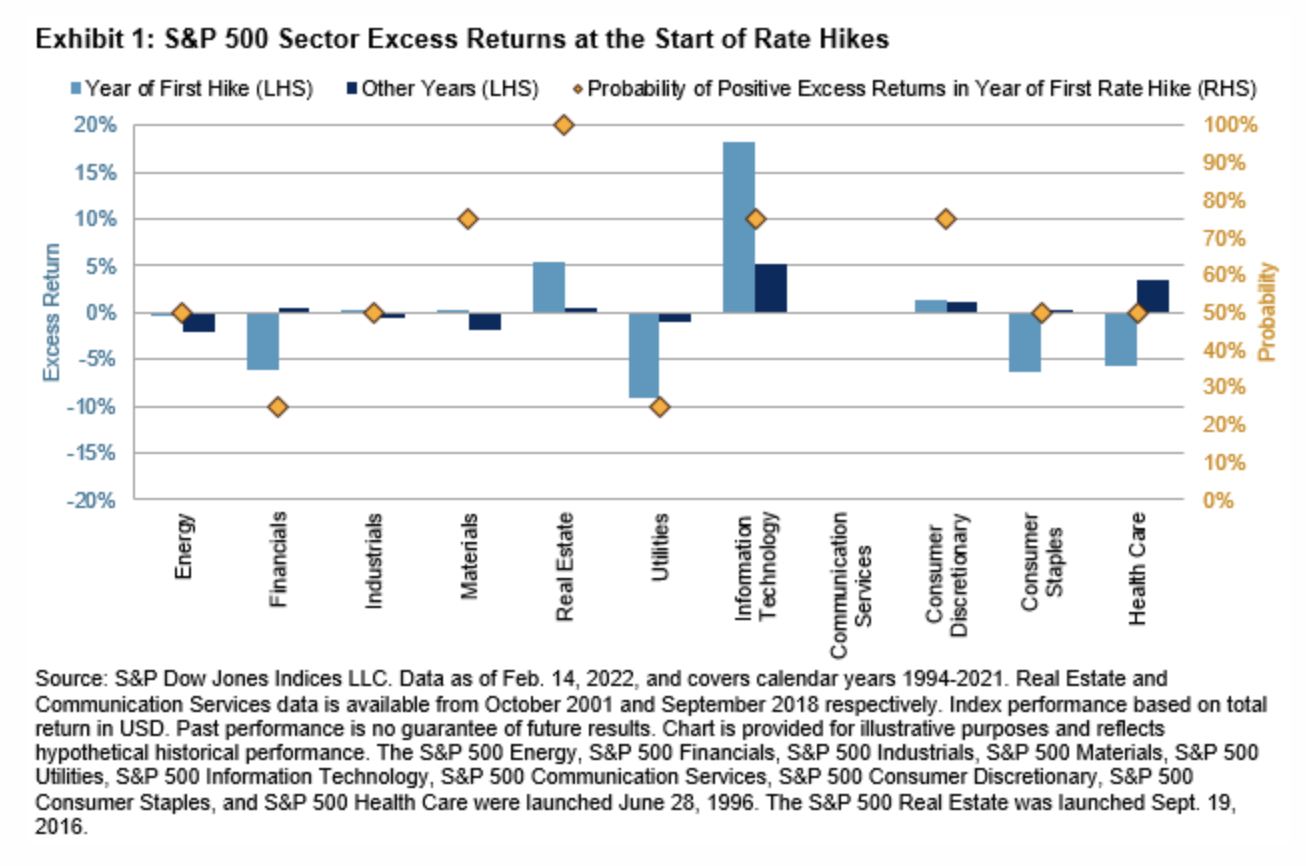
To note, pursuant to the idea that participants have “priced in” the aforementioned, S&P Global Inc (NYSE: SPGI) data suggests “the initial stages of a monetary tightening cycle have not been disastrous for the U.S. stock market historically.”

Graphic: Via S&P Global.

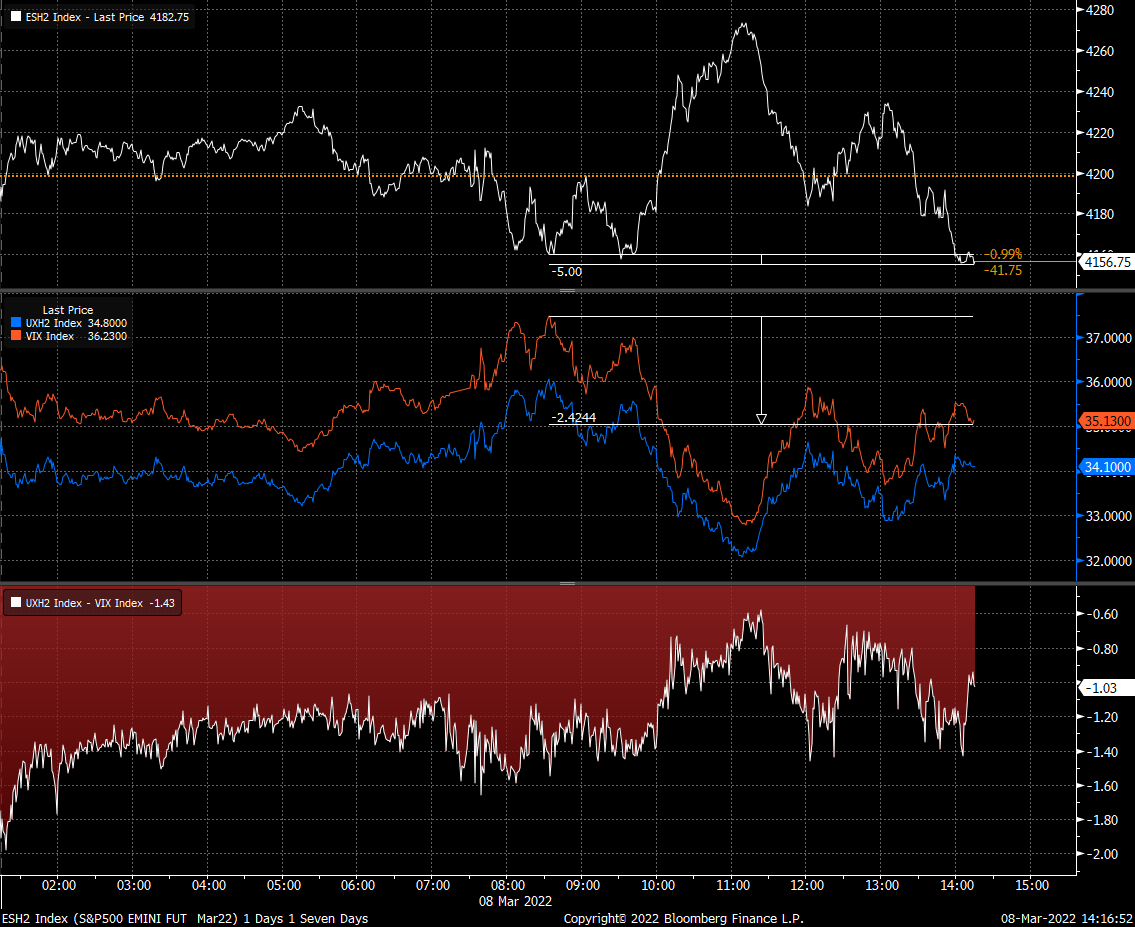
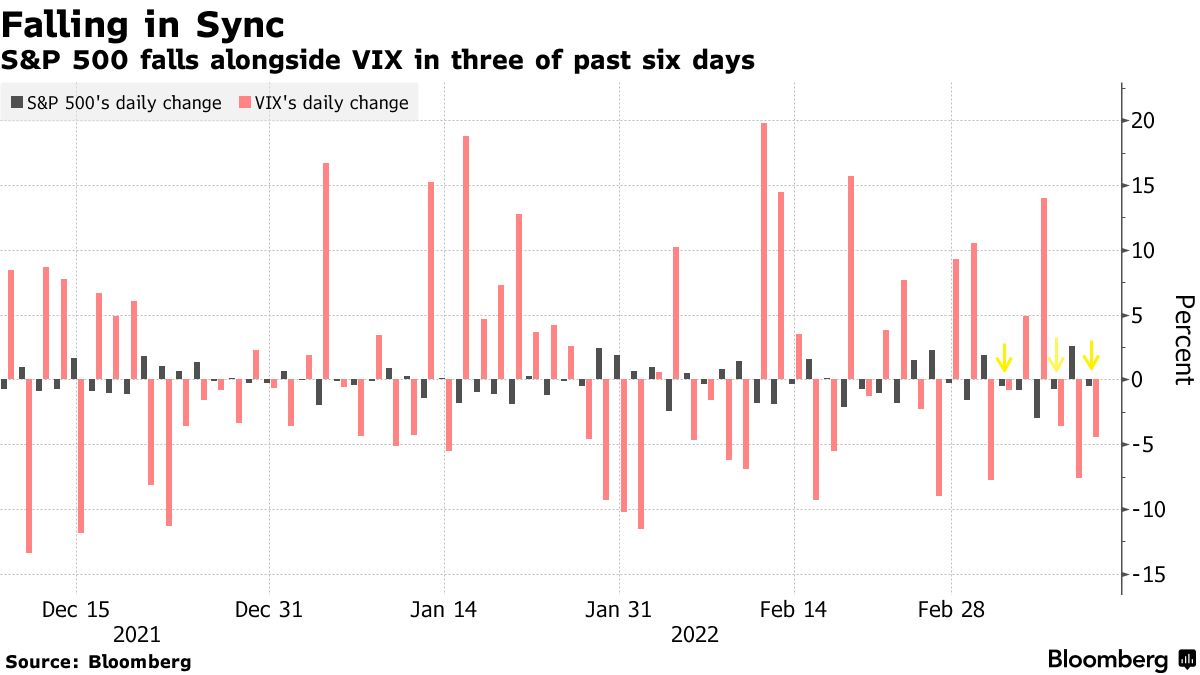
Positioning: Based on a comparison of present options positioning and buying metrics, the returns distribution is skewed positive.

This is in the face of an S&P 500 (INDEX: SPX) and Cboe Volatility Index (INDEX: VIX) down environment.

Graphic: Via Bloomberg. S&P 500 (INDEX: SPX) down, CBOE Volatility Index (INDEX: VIX) down.

In part, this has to do with the supply and demand of protection; mainly, the market is “well hedged and well-positioned,” Amy Wu Silverman of Royal Bank of Canada’s (NYSE: RY) says

Graphic: Via SpotGamma. “Netting call & put delta, you can see we’re near extremes in terms of put:call positions. Often large put positions are removed by expirations, which seems to coincide with market lows. Many of these are quarterly expirations which coincide w/FOMC meetings – such as next week.”

Given this, as JPMorgan Chase & Co (NYSE: JPM) analysts explain, “we could be closer to the end” of discretionary de-risking, and the compression of volatility (via passage of FOMC), as well as the removal of counterparty negative exposure (via OPEX) may serve to alleviate pressure. 

Graphic: Via Goldman Sachs Group Inc (NYSE: GS). Taken from The Market Ear. “18-Mar has more expiring near-the-money SPX open interest than any expiration since 2019.”

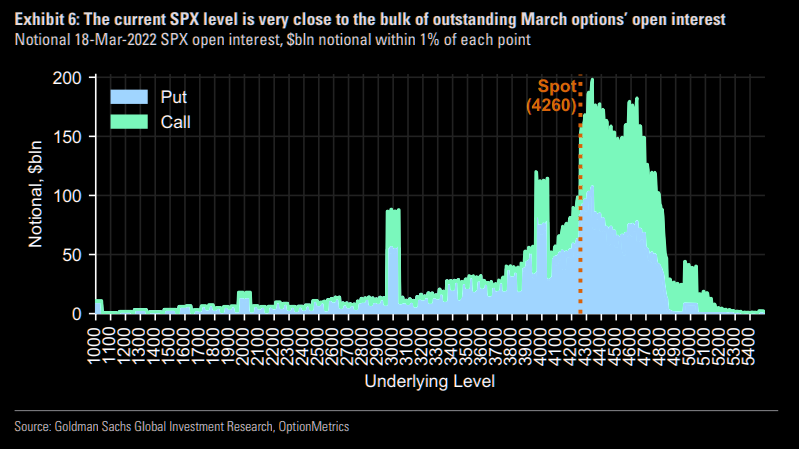
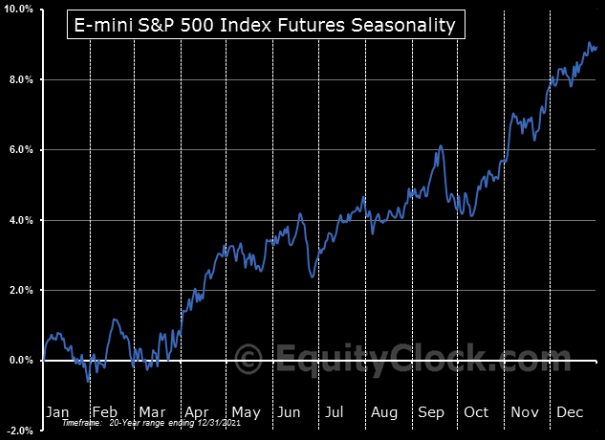
As SpotGamma, explains, “As it stands, without further geopolitical events causing, even more, fear, the markets are due for a relief rally,” on improving seasonality, among other things. 

“Following the FOMC meeting, as well as the reduction in put-heavy exposures post-OPEX (options expiration), the need for put ownership (protection) and relative short positions is reduced (less positive delta = less selling to hedge = less pressure).”

Graphic: Via EquityClock. Taken from The Market Ear.

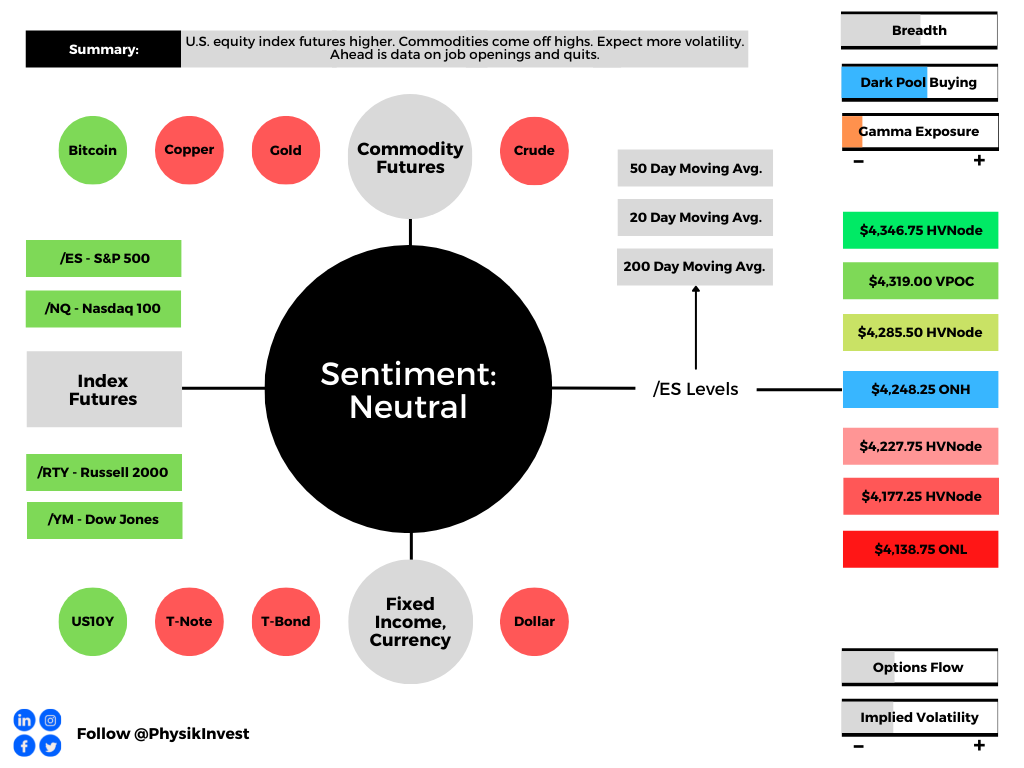
Technical: As of 6:30 AM ET, Monday’s regular session (9:30 AM – 4:00 PM ET), in the S&P 500, will likely open in the middle part of a positively skewed overnight inventory, inside of prior-range and -value, suggesting a limited potential for immediate directional opportunity.

In the best case, the S&P 500 trades higher; activity above the $4,227.75 high volume area (HVNode) puts in play the $4,249.25 low volume area (LVNode). Initiative trade beyond the LVNode could reach as high as the $4,285.25 and $4,314.75 HVNode, or higher.

In the worst case, the S&P 500 trades lower; activity below the $4,227.75 HVNode puts in play the $4,189.00 regular trade low (RTH Low). Initiative trade beyond the RTH Low could reach as low as the $4,138.75 and $4,101.25 overnight low (ONL), or lower.

Considerations: Participants resolve a pinch of two anchored volume-weighted average price indicators (VWAPs). A VWAP is a metric highly regarded by chief investment officers, among other participants, for quality of trade. Additionally, liquidity algorithms are benchmarked and programmed to buy and sell around VWAPs.

We look to buy above a flat/rising VWAP pinch. We look to sell below a flat/declining VWAP pinch.

Click here to load today’s key levels into the web-based TradingView charting platform. Note that all levels are derived using the 65-minute timeframe. New links are produced, daily.
Graphic: 65-minute profile chart of the Micro E-mini S&P 500 Futures.

Definitions

Overnight Rally Highs (Lows): Typically, there is a low historical probability associated with overnight rally-highs (lows) ending the upside (downside) discovery process.

Volume Areas: A structurally sound market will build on areas of high volume (HVNodes). Should the market trend for long periods of time, it will lack sound structure, identified as low volume areas (LVNodes). LVNodes denote directional conviction and ought to offer support on any test. 

If participants were to auction and find acceptance into areas of prior low volume (LVNodes), then future discovery ought to be volatile and quick as participants look to HVNodes for favorable entry or exit.

POCs: POCs are valuable as they denote areas where two-sided trade was most prevalent in a prior day session. Participants will respond to future tests of value as they offer favorable entry and exit.

About

After years of self-education, strategy development, mentorship, and trial-and-error, Renato Leonard Capelj began trading full-time and founded Physik Invest to detail his methods, research, and performance in the markets.

Capelj is also a Benzinga finance and technology reporter interviewing the likes of Shark Tank’s Kevin O’Leary, JC2 Ventures’ John Chambers, FTX’s Sam Bankman-Fried, and ARK Invest’s Catherine Wood, as well as a SpotGamma contributor developing insights around impactful options market dynamics.

Disclaimer

Physik Invest does not carry the right to provide advice.

In no way should the materials herein be construed as advice. Derivatives carry a substantial risk of loss. All content is for informational purposes only.

Categories
Commentary

Daily Brief For March 9, 2022

Editor’s Note: The Daily Brief is a free glimpse into the prevailing fundamental and technical drivers of U.S. equity market products. Join the 200+ that read this report daily, below!

What Happened

Overnight, equity index futures, led by the tech- and growth-heavy Nasdaq 100 auctioned higher. This is immediately after a session characterized by rampant, two-way volatility. 

Much of the action in the equity indices and commodity markets is headline-driven. 

For instance, at one point, alongside news that Ukraine would no longer insist on NATO membership, the S&P 500 auctioned higher nearly 3%. Thereafter, responsive selling at a very key technical level preceded the index’s over 3% drop shortly after.

This push-and-pull, as well as responsiveness near key-technical areas (that are discernable visually on a chart), suggests technically-driven traders with short time horizons are very active. 

Such traders often lack the wherewithal to defend retests and, additionally, the type of trade may be indicative of the other time frame participants waiting for more information to initiate trades.

Ahead is data on job openings and quits (10:00 AM ET).

Graphic updated 6:45 AM ET. Sentiment Neutral if expected /ES open is inside of the prior day’s range. /ES levels are derived from the profile graphic at the bottom of the following section. Levels may have changed since initially quoted; click here for the latest levels. SqueezeMetrics Dark Pool Index (DIX) and Gamma (GEX) calculations are based on where the prior day’s reading falls with respect to the MAX and MIN of all occurrences available. A higher DIX is bullish. At the same time, the lower the GEX, the more (expected) volatility. Learn the implications of volatility, direction, and moneyness. SHIFT data used for S&P 500 (INDEX: SPX) options activity. Note that options flow is sorted by the call premium spent; if more positive, then more was spent on call options. Breadth reflects a reading of the prior day’s NYSE Advance/Decline indicator. VIX reflects a current reading of the CBOE Volatility Index (INDEX: VIX) from 0-100.

What To Expect

Fundamental: The prevailing narrative is concerned with the slowdown in economic growth, the intent to withdraw monetary stimulus, and the response to Russia’s invasion of Ukraine.

Graphic: Bloomberg. U.S. equity indexes spared of recent bloodshed, abroad.

Pursuant to the response to Russia’s invasion of Ukraine has been a disruption in supply chains; commodities, like oil and nickel, have risen and that has inflation and growth impacts.

Graphic: Via Bloomberg, Oxford Economics. “The war in Ukraine is making it harder and more costly for goods to move freely across the globe. Key shipping routes are blocked, and others are feeling ripple effects from the conflict.”

In the coming days and weeks, central banks will announce their monetary policy decisions. Per Bloomberg, commodity costs underline the inflation challenge to the Federal Reserve.

Graphic: Via Bloomberg. The historical analogy is different but close (as today’s economy is less dependent on oil); the “Fed responded to the [1973] shock, and to the growing wave of inflation that preceded it, with a massive tightening.”

With breakevens on 30-year inflation-linked Treasuries – an indicator of the pace of price gains over three decades – climbing to their highest level, the Fed is expected to hike rates 25 bps.

Graphic: Via CME Group Inc (NASDAQ: CME). Participants price in an increased probability of a shift in the target rate. Click here to access the FedWatch Tool.

In the past days, there have been a variety of takes on what’s going on. A pessimistic, yet, interesting take is offered by Credit Suisse Group AG’s (NYSE: CS) Zoltan Pozsar.

Mainly, there is a commodity crisis. Commodities are collateral and collateral is money.

Graphic: Via Bloomberg. The “FRA/OIS, a key gauge of interbank funding risk, as of the close on Monday.” Click here to listen to Zoltan Pozsar’s Bloomberg conversation on Russia, Gold, and the U.S. dollar.

“[E]very crisis occurs at the intersection of funding and collateral markets and that, in the presently unfolding crisis, commodities are collateral, and more precisely, Russian commodities are like subprime collateral and all other stuff is prime.”

Pozsar explains that instability in commodity prices feeds into financial instability as margin calls trigger the failure of commodity traders and (potentially) commodity exchanges.

Graphic: Via Bloomberg. Commodity price rises solicit margin calls.

“Again, commodity correlations are at 1, which is never a good thing,” he says. “The Fed and other central banks will be able to provide liquidity backstops, … but those will be Band-Aid solutions.”

Liquidity is the manifestation of a larger problem – the Russian-non-Russian commodities basis – and its resolve portends a “regime shift” which Pozsar posits China will be at the front of.

“When this crisis (and war) is over, the U.S. dollar should be much weaker and, on the flip side, the renminbi much stronger, backed by a basket of commodities.”

MUFG Securities’ (NYSE: MUFG) George Goncalves makes a similar point, drawing parallels to the early days of 2008. 

“The situation in Europe is precarious enough on its own, but if conditions worsen in a highly connected financial system, balance sheets may get curtailed via haircuts,” Concalves wrote

“Meanwhile there is an eerily similar pattern to the current action in [short-term interest rates] and oil prices to the early summer of 2008. Recall, in response to inflation and central bank hawkishness, markets priced in nearly 150bps in hikes in 2008 before GFC cracked.”

Positioning: Based on metrics often quoted in this morning letter, buying support appears to be cooling. Overlaying options positioning metrics, the returns distribution is skewed positive, still.

This is in opposition to some of the reporting by large outlets. The narrative is along the lines of institutional investors offloading equities to retail.

Graphic: Via Bank of America Corporation (NYSE: BAC).

According to statements by The Ambrus Group’s Kris Sidial, “This is partially a byproduct of the long equity firms that have programs that are designed to exit when Cboe Volatility Index (INDEX: VIX) gets over a certain level and equities drop under a certain percentage.”

Graphic: Via Pat Hennessy. “ES goes +2%, -2%, +3%, -3% in 14 hours! Yes – the close/close move was weak, but the intraday moves were massive – IMO enough to support a 37 VIX. Strange to see vols so soft given intraday realized + close on lows.”

“There is no doubt about it that we have noticed heavier institutional flow throughout the day over the last two weeks. However, there are still large institutions that are putting cash to work in equities. Ironically a rotation out of some European equities into U.S., [and] there is also a good amount of buyback flow that is projected to hit some areas in U.S equities.

Pursuant to remarks in the fundamental section (and Sidial’s note on the heavier institutional flow), we saw some noteworthy put buying in products like the cash-settled Nasdaq 100 (INDEX: NDX) and iShares iBoxx $ Inv Grade Corporate Bond ETF (NYSE: LQD).

Graphic: Via SHIFT. Buying closer strikes. Selling farther strikes.

Whether these are hedges, the replacement of existing linear short positions, or speculation on the downside, it all plays into this negative gamma environment markets are in.

When customers demand downside (put) protection (a negative delta, positive gamma trade that has its gains multiplied to the downside), counterparties sell underlying futures and stock to hedge their positive delta, negative gamma trade which has the effect of pressuring markets.

The compression of volatility (via passage of FOMC) or removal of counterparty negative exposure (via OPEX) may serve to alleviate some of this pressure. Until then, participants can expect the options landscape to add to market volatility.

Technical: As of 6:45 AM ET, Wednesday’s regular session (9:30 AM – 4:00 PM ET), in the S&P 500, will likely open in the upper part of a positively skewed overnight inventory, inside of prior-range and -value, suggesting a limited potential for immediate directional opportunity.

In the best case, the S&P 500 trades higher; activity above the $4,248.25 overnight high (ONH) puts in play the $4,285.50 high volume area (HVNode). Initiative trade beyond the HVNode could reach as high as the $4,319.00 untested point of control (VPOC) and $4,346.75 high volume area (HVNode), or higher.

In the worst case, the S&P 500 trades lower; activity below the $4,248.25 ONH puts in play the $4,227.75 HVNode. Initiative trade beyond the $4,227.75 HVNode could reach as low as the $4,177.25 HVNode and $4,138.75 ONL, or lower.

Click here to load today’s key levels into the web-based TradingView charting platform. Note that all levels are derived using the 65-minute timeframe. New links are produced, daily.
Graphic: 65-minute profile chart of the Micro E-mini S&P 500 Futures.

Definitions

Overnight Rally Highs (Lows): Typically, there is a low historical probability associated with overnight rally-highs (lows) ending the upside (downside) discovery process.

Volume Areas: A structurally sound market will build on areas of high volume (HVNodes). Should the market trend for long periods of time, it will lack sound structure, identified as low volume areas (LVNodes). LVNodes denote directional conviction and ought to offer support on any test. 

If participants were to auction and find acceptance into areas of prior low volume (LVNodes), then future discovery ought to be volatile and quick as participants look to HVNodes for favorable entry or exit.

POCs: POCs are valuable as they denote areas where two-sided trade was most prevalent in a prior day session. Participants will respond to future tests of value as they offer favorable entry and exit.

About

After years of self-education, strategy development, mentorship, and trial-and-error, Renato Leonard Capelj began trading full-time and founded Physik Invest to detail his methods, research, and performance in the markets.

Capelj is also a Benzinga finance and technology reporter interviewing the likes of Shark Tank’s Kevin O’Leary, JC2 Ventures’ John Chambers, FTX’s Sam Bankman-Fried, and ARK Invest’s Catherine Wood, as well as a SpotGamma contributor developing insights around impactful options market dynamics.

Disclaimer

Physik Invest does not carry the right to provide advice.

In no way should the materials herein be construed as advice. Derivatives carry a substantial risk of loss. All content is for informational purposes only.