Categories
Commentary

Turning Nickels Into Dollars: A Winning Strategy For Market Crashes

Good Morning! I hope you had a great weekend and enjoy today’s letter. I would be so honored if you could comment and/or share this post. Cheers!

Risk appetite in the last months was fueled by the emergence of a “goldilocks disinflation thesis,” describes Marko Kolanovic of JPMorgan Chase & Co. This thesis envisions a no-recession scenario where central banks cut rates early, especially in the lead-up to elections.

The market is banking on such anticipatory movement by the Federal Reserve, pricing five rate cuts and the target interest rate moving from 525-550 to 400-425 basis points by year-end. With the backdrop of easing liquidity conditions through 2025 and continuing economic growth, equity investors are positioning for a broader rally. This has led to churn and a loss of momentum.

Graphic: Retrieved from Carson Investment Research via Ryan Detrick.

Though historical trends encourage optimism, Kolanovic is concerned markets are overlooking geopolitical events, such as the Houthi shipping attacksexercises near the Suwałki Gap, and Russia’s testing of electronic warfare. Despite these potential disruptors, atypically low volatility skew and implied correlation indicate a lack of market responsiveness and positioning for less movement.

Recall skew reflects a scenario where increased market volatility disproportionately impacts farther away strike options due to losses from more frequent delta rebalancing in a moving market, leading option sellers to assign higher implied volatility to those strikes to compensate for increased risk. The relationship between index volatility and its components involves both individual volatilities and correlation, with implied correlation as a valuable indicator for pricing dynamics between index options and their components and trading volatility dispersion.

Appearing on The Market Huddle, Kai Volatility’s Cem Karsan emphasized the impact of more structured product issuance and investor volatility selling on index levels, describing how it pins the index and lowers correlation. When a dealer, bank, or market maker on the other side owns options, they need to buy the market when it goes down and sell when it goes up, keeping the index tight and realized volatility low. Much less of this, or even the opposite, is happening in single stocks, so they aren’t experiencing the same level of suppression.

Graphic: Retrieved from The Ambrus Group’s Kris Sidial. Higher short Vega exposure, growing derivative income fund and equity short vol hedge fund AUM, a larger auto-callable market, and record-high dispersion trading flow suppress index vol, posing significant risks.

“As dealers buy and sell index exposure, market makers will attempt to keep the index level and the underlying basket in line via arbitrage constraints,” Newfound Research well explained in their Liquidity Cascades paper. “If dealer hedging has suppressed index-level volatility, but underlying components are still exhibiting idiosyncratic volatility, then the only reconciliation is a decline in correlation.”

SpotGamma’s Brent Kochuba weighs in, noting low correlation typically aligns with interim stock market highs, presenting a potential cause for caution. Examining data since January 2018, Kochuba points out that the SPX’s average close-to-close change is 88 basis points, with the open-to-close average at 70 basis points. This analysis suggests the current SPX implied volatility (IV) is relatively low. While low IV levels can persist, the concern arises as current readings hint at overbought conditions.

“These low IVs can last for some time, but the general point here is that current readings are starting to suggest overbought conditions as index vols are priced for risk-less perfection, and single stock vols expand due to upside call chasing.”
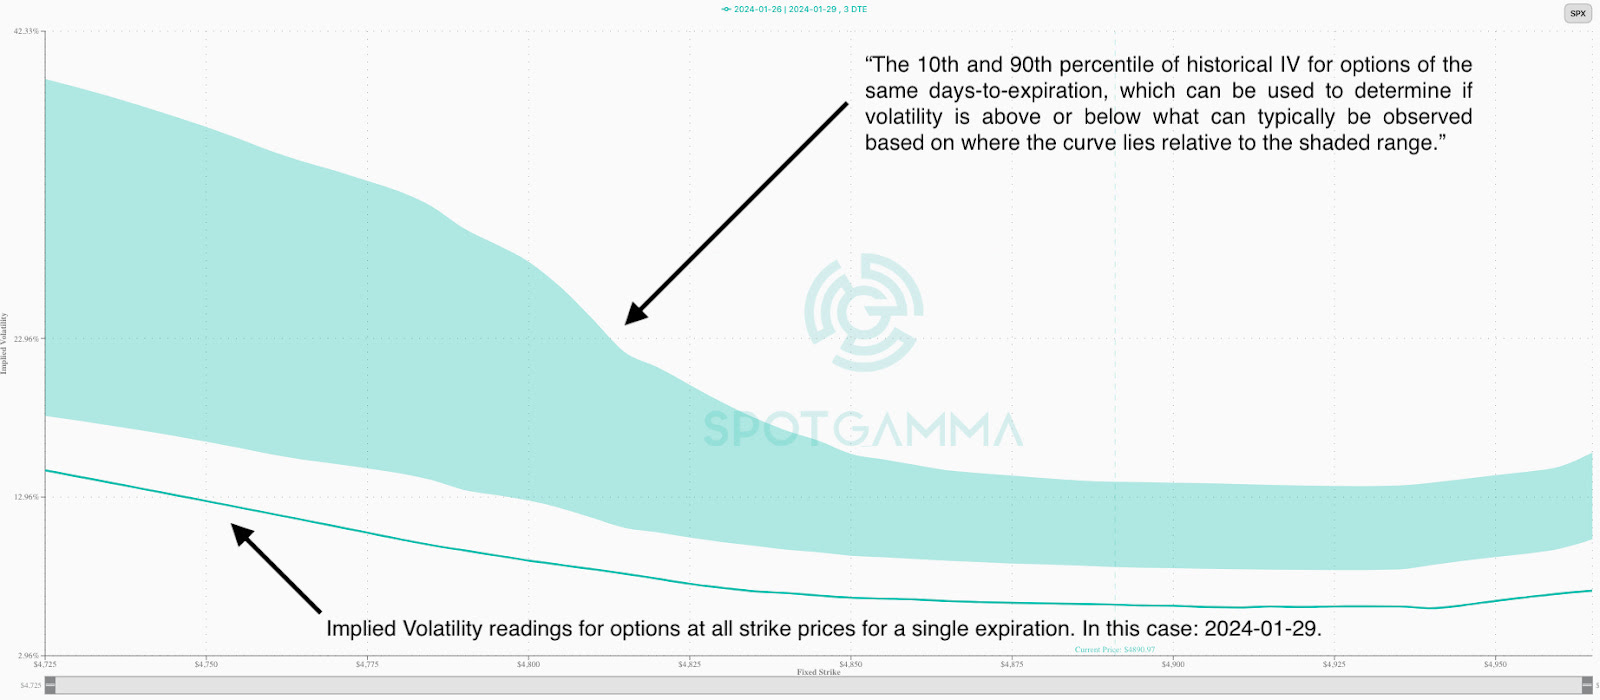
Graphic: Retrieved from SpotGamma. Short-dated S&P 500 implied volatility is compressed. Updated Sunday, January 28, 2024.

Nomura Cross-Asset Macro Strategist Charlie McElligott explains selling volatility, which continues to attract money as it’s been profitable, is a stabilizing trade in most cases. Kris Sidial, Co-Chief Investment Officer at The Ambrus Group, warns it may end spectacularly in his most recent appearances. The situation in China is a cautionary example, where stock volatility triggered a destructive selling cycle as market participants grappled with structured product risk management.
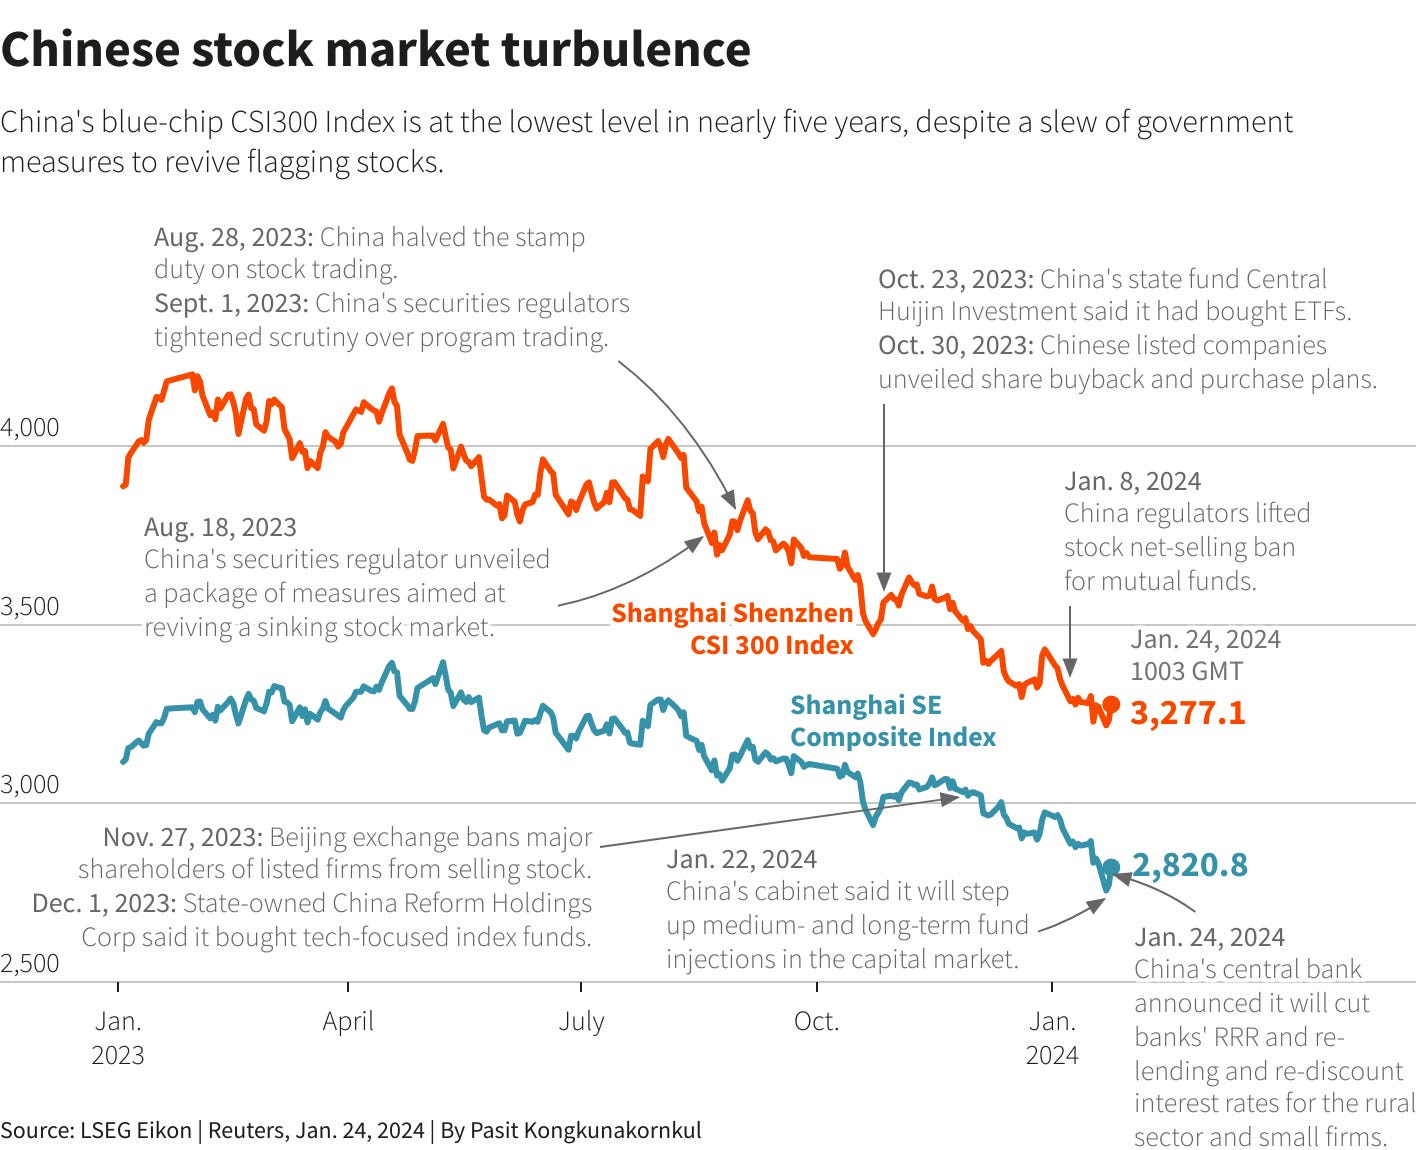
Graphic: Retrieved from Reuters.

Accordingly, for those who perceive a meaningful chance of movement, there is value in owning options, Goldman Sachs Group says, noting they expect more movement than is priced.

Graphic: Retrieved from Goldman Sachs Group via VolSignals.

Karsan, drawing parallels to the unwind of short volatility and dispersion trade from February to March of 2020, says the still-crowded trade can be compared to two sumo wrestlers or colossal plates on the Earth’s core exerting immense pressure against each other. While the trade may appear balanced and continue far longer, the accumulated pressures pose significant risks.
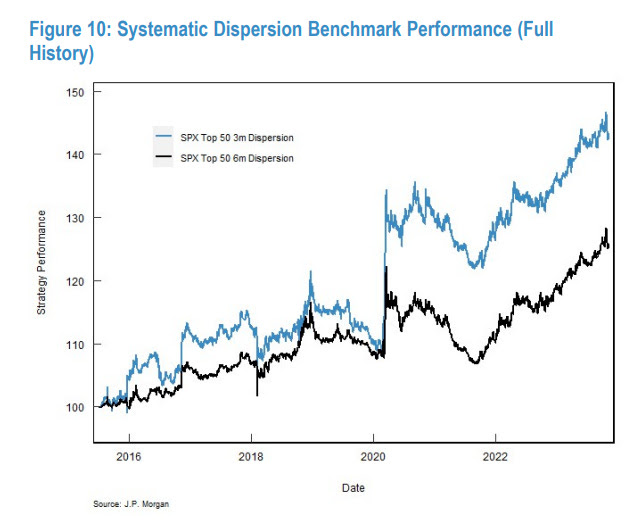
Graphic: Retrieved from JPMorgan Chase & Co via @jaredhstocks.

Major crashes happen when entities must trade volatility and options. Often, the trigger is the inability to cover the margin and meet regulatory requirements, causing a cascading effect.

Karsan, drawing on 25 years of experience, notes a precursor to a crash is a weakening supply of margin puts, particularly the highly convex and far out-of-the-money ones. These options play a significant role during stressful market periods, acting as indicators and drivers of impending crashes. The focus is on their convexity rather than whether they will be in the money, as the margin requirements become a determining factor in their impact on market dynamics. History shows a minor catalyst can lead to a dramatic unwind, turning one week to expiry $0.05 to $0.15 S&P 500 put options into $10.00 overnight.

“Prior to the XIV crash day, … going into the close the last hour, we saw nickel, ten, and five-cent options trade up to about $0.50 and $0.70. They really started to pop in the last hour. And then, the next day, we opened up and they were worth $10.00. You don’t see them go from a nickel to $0.50 very often. If you do, don’t sell them. Buy them, which is the next trade.”
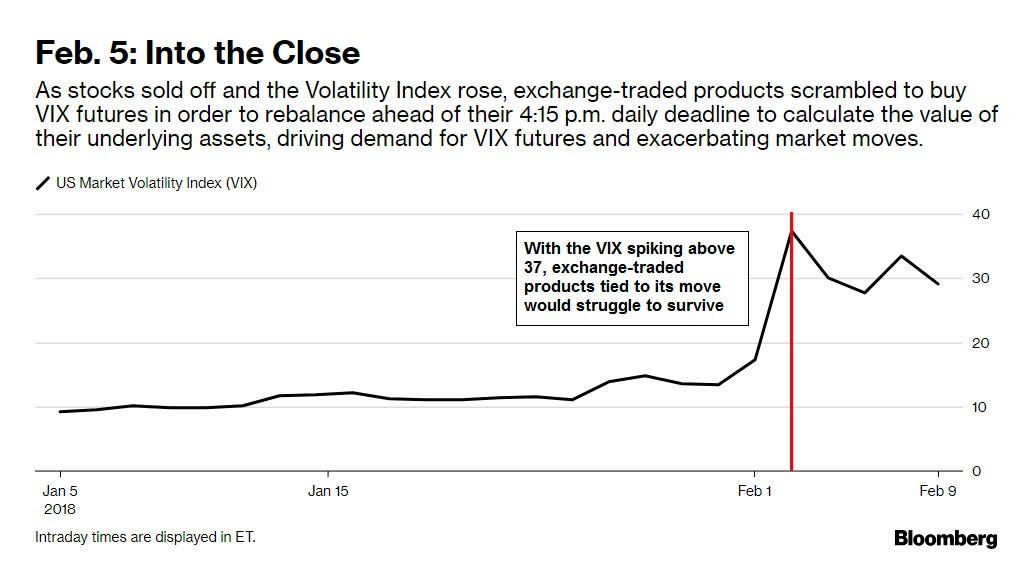
Graphic: Retrieved from Bloomberg.

Setting aside the pessimistic narrative, the current scenario favors continued ownership of risk assets. Cautious optimism surrounds this week’s Quarterly Refunding Announcement (QRA), “depending on how much bill issuance is scaled back and on the absolute funding needs,” CrossBorder Capital explained, coupled with Fed-speak and anticipation of cutting interest rates on falling inflation later this year. Still, according to Unlimited Funds ‘ Bob Elliott, predicting outcomes following this week’s releases lacks an advantage; instead, in this environment of churn, momentum loss, and indicators like low correlation and volatility, last week’s trades for managing potential downside stick out, particularly vis-à-vis volatility skew.

Graphic: Retrieved from SpotGamma. Updated Sunday, January 28, 2024.
Categories
Commentary

Daily Brief For April 11, 2023

LOAD LEVELS ON TRADINGVIEW BY CLICKING HERE.

The narrative yesterday was bearish

A big deal was made surrounding some data that shows investors increasing their bets on US equities falling; net short positions in the E-mini S&P 500 (FUTURE: /ES) are the highest since 2011, Bloomberg reports. JPMorgan Chase & Co (NYSE: JPM) and Goldman Sachs Group Inc (NYSE: GS) concur as their data shows clients betting on stocks falling or reducing stock exposure quickly.

This is happening in the context of some mixed, albeit still robust-leaning, data; payrolls upped bets that the Federal Reserve or Fed would move its target rate to 5.00-5.25%. GS’ Bobby Molavi adds, “the prevalent view seems to be that more things will break on the back of rapid rise in cost of capital.”

Graphic: Retrieved from Bloomberg

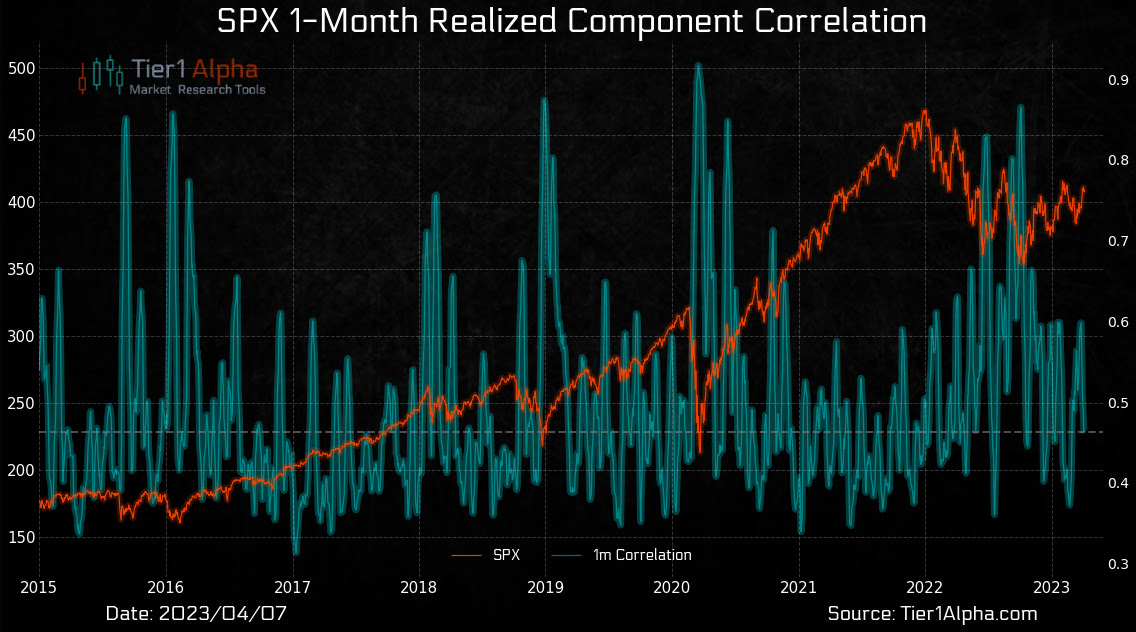
In light of the rate expectations, the Nasdaq 100 (INDEX: NDX) appears to be handing over the leadership baton to the S&P 500 (INDEX: SPX), though both indexes remain primarily intact and coiling; the fundamental-type pressures are balanced by follow-on support from those actors that base their decisions on such things as the amount a market moves (i.e., realized volatility or RVOL), says Tier1Alpha and SpotGamma.

Graphic: Retrieved from Tier1Alpha.

The two providers of market insights see falling implied (IVOL) and RVOL as catalysts for buying stocks. This, coupled with the hedging of soon-to-expire large options open interest, particularly on the put side, in a lower liquidity environment, supports the indexes while underlying breadth and correlations are underwhelming.

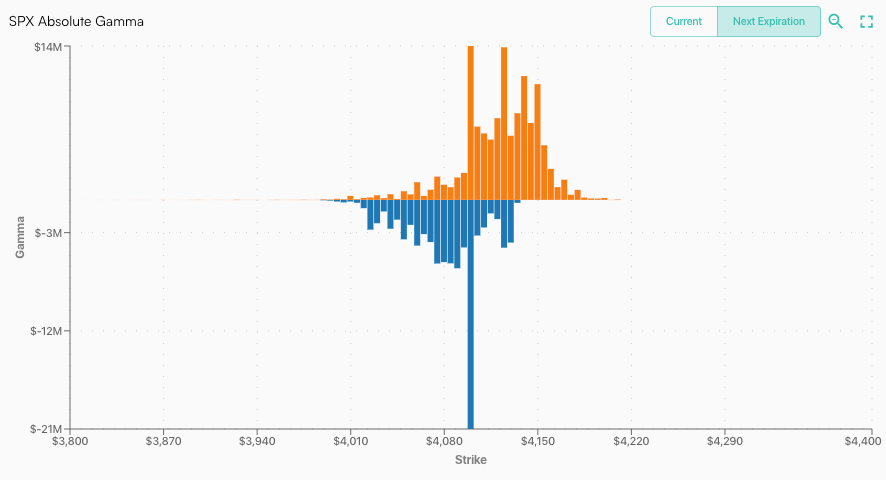
A large concentration of put open interest near current prices is pictured just below. The eventual removal of this put-heavy positioning will reduce some directional risks to options counterparts; as puts disappear or decline in value, their delta or exposure to direction does too. If a counterparty is short a put and has less positive delta to hedge, they may buy back some of their short-delta exposure in the underlying index, a catalyst for higher S&P 500 prices.

Graphic: Retrieved from SpotGamma.

A large open interest concentration set to roll off this April is pictured just below.

Retrieved from SpotGamma.

This has happened before. Newfound Research explains it best in their paper titled “Liquidity Cascades: The Coordinated Risk of Uncoordinated Market Participants.”

In keeping the indexes and their underlying idiosyncratic baskets in line via arbitrage constraints, while there is a build-up of suppressive and supportive dealer hedging at the index level, “then the only reconciliation is a decline in correlation.”

In this context, Tier1Alpha explains, “lower correlations tend to lead to lower volatility … giv[ing] volatility control funds the go-ahead to augment their risk exposure, with an estimated $14 billion in equities purchases … to be spread out in blocks.”

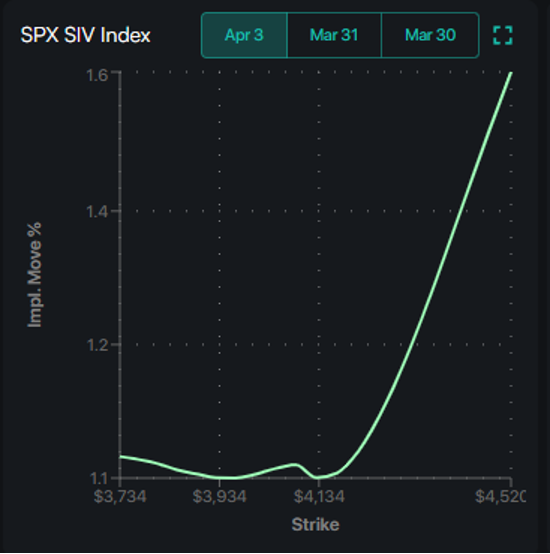
Consequently, in line with our thesis that positioning and technical contexts support near-term strength, it still makes sense to take the profits of very wide, albeit low- or zero-cost, call ratio spread structures discussed in past letters to cut the cost of our bets on the equity market downside and lower rates with more time to expiry. Should the indexes trade higher, SpotGamma agrees with Kai Volatility’s Cem Karsan that volatility could be sticky.

Hence, call structures could keep their value better and enable us to lower the cost of our bets on the market downside. If the fundamental context supporting the rotation of call option profits into puts is no longer valid, then the losses on such trades are limited; the money is made in not losing it.

Graphic: Retrieved from SpotGamma’s Weekend Note.

Not doing as outlined and blindly buying put options to protect long equity exposure is generally a poor-performing strategy, despite the performance claims of some funds specializing in that practice.

Graphic: Retrieved from QVR Advisors via Bloomberg. “Buying puts is a money-losing proposition when considered in isolation. Chart shows the performance of hedges rolled every quarter with delta hedging, as a percentage of notional amount protected.”

About

Welcome to the Daily Brief by Physik Invest, a soon-to-launch research, consulting, trading, and asset management solutions provider. Learn about our origin story here, and consider subscribing for daily updates on the critical contexts that could lend to future market movement.

Separately, please don’t use this free letter as advice; all content is for informational purposes, and derivatives carry a substantial risk of loss. At this time, Capelj and Physik Invest, non-professional advisors, will never solicit others for capital or collect fees and disbursements. Separately, you may view this letter’s content calendar at this link.

Categories
Methodology

Theory Applied: Contextualizing Recent Market Volatility

With SpotGamma, Physik Invest’s Renato Leonard Capelj unpacks recent market movements from an options positioning perspective.

Coverage includes the following:

  • Definition and application of first and second order options greeks.
  • Implications of the November and December options expirations.
  • How current positioning may dictate trade in Q1 2022 and beyond.
  • Expert commentary and much more!

Click below to learn more!

Categories
Commentary

Daily Brief For December 10, 2021

What Happened

Overnight, equity index futures staged a reversal, auctioning back from yesterday’s knee-jerk liquidation toward intraday value, the levels at which 70% of Thursday’s volume transacted.

Ahead is data on the Consumer Price Index (CPI) and Core Inflation (8:30 AM ET), University of Michigan Consumer Sentiment and Expected Inflation (10:00 AM ET), as well as the Federal Budget (2:00 PM ET).

Graphic updated 6:40 AM ET. Sentiment Neutral if expected /ES open is inside of the prior day’s range. /ES levels are derived from the profile graphic at the bottom of the following section. Levels may have changed since initially quoted; click here for the latest levels. SqueezeMetrics Dark Pool Index (DIX) and Gamma (GEX) calculations are based on where the prior day’s reading falls with respect to the MAX and MIN of all occurrences available. A higher DIX is bullish. At the same time, the lower the GEX, the more (expected) volatility. Learn the implications of volatility, direction, and moneyness. SHIFT data used for S&P 500 (INDEX: SPX) options activity. Note that options flow is sorted by the call premium spent; if more positive then more was spent on call options. Breadth reflects a reading of the prior day’s NYSE Advance/Decline indicator. VIX reflects a current reading of the CBOE Volatility Index (INDEX: VIX) from 0-100.

What To Expect

After a multi-day pin against the S&P 500 $4,700.00 area, on weak intraday breadth and market liquidity metrics, the worst-case outcome occurred; participants moved the index away from its intraday value, the levels at which participants found it most favorable to trade at.

As noted in past commentaries, participants’ discovery of higher prices left poor structure; both Monday and Tuesday’s sessions left gaps and p-shaped emotional, multiple-distribution profile structures (i.e., old-money shorts covering).

Thursday’s end-of-day liquidation, ahead of new data on inflation, brought the S&P 500 into a pocket of low volume (LVNode) that participants quickly rejected overnight.

This rejection suggests participants responsively bought the move lower; more information is needed to warrant an expansion of range in either direction.

Graphic: Supportive delta (i.e., committed end-of-day selling as measured by volume delta or buying and selling power as calculated by the difference in volume traded at the bid and offer) in SPDR S&P 500 ETF Trust (NYSE: SPY), one of the largest ETFs that track the S&P 500 index, via Bookmap

Context: Inflation is key in gauging monetary policy. 

Per Bloomberg, a CPI figure above (below) of 7% likely sparks a risk-off (risk-on) move.

Either way, next week the Fed ought to announce an acceleration in its taper to bond-buying. 

Upon an end to the taper, there ought to be a tightening; William Dudley, a former New York Fed governor, believes there will be three 0.25-percentage-point rate increases next year. 

In 2023, Dudley sees four rate hikes that bring the median target rate to 1.8%, and then, the target rate will reach 2.5% in 2024.

Rising rates, among other factors, have the potential to decrease the present value of future earnings, thereby making stocks, especially those that are high growth, less attractive.

Higher inflation prints, today, could spark a risk-off move as participants price in more aggressive change to the monetary frameworks and liquidity provision that promoted a large divergence in price form fundamentals.

“[T]he Fed may be making a policy error by essentially overweighting a fight against inflation versus supporting growth,” Bank of America’s (NYSE: BAC) Mark Cabana explained.

Participants are “worried that the Fed is going to be tightening into supply-constrained inflation and reduction of consumer purchasing power and they’re doing that because they’re worried risk assets may be very sensitive to rate levels.”

Despite the doom and gloom, it’s worth noting that today’s rates and earnings support validations better than in the ‘90s.

The “growth in earnings is so far stronger than the multiple compression caused by rising rates (blue line),” and that will continue to bolster any rally attempt.

Graphic: Low rates support current valuations better than the ‘90s, according to Nasdaq.

Still, that intent to moderate stimulus serves as a headwind and some high-growth names have been weakening.

For instance, as shares of Tesla Inc (NASDAQ: TSLA) declined, yesterday, SpotGamma data suggested participants were seeking downside protection, in size.

Due to an environment wherein the counterparties to customer option trades buy (sell) into weakness (strength), indices are pinned.

“[D]ealer hedging has suppressed index level volatility, but underlying components are [] exhibiting idiosyncratic volatility,” as one paper puts it.

“The only reconciliation is a decline in correlation.”

If that activity in highly-weighted constituents like Tesla was to feed into the indices, the effects would be destabilizing.

However, in regards to positioning metrics, at present, the return distribution is skewed positive.

Adding, if participants are assuaged of their fears at next week’s Federal Open Market Committee (FOMC) meeting, a collapse in event-related implied volatility ought to bring in positive flows as the long delta (from dealers’ exposure to short puts) decreases; the decrease in dealer supply (short delta), via covering of short stock/futures hedges, would bolster any attempt higher. See below.

Expectations: As of 6:40 AM ET, Friday’s regular session (9:30 AM – 4:00 PM ET), in the S&P 500, will likely open in the upper part of a positively skewed overnight inventory, inside of prior-range and -value, suggesting a limited potential for immediate directional opportunity.

Balance Expected: Rotational trade that denotes current prices offer favorable entry and exit. 

Balance-areas make it easy to spot a change in the market (i.e., the transition from two-time frame trade, or balance, to one-time frame trade, or trend). 

Modus operandi is responsive trade (i.e., fade the edges), rather than initiative trade (i.e., play the break).

In the best case, the S&P 500 trades sideways or higher; activity above the $4,685.00 untested point of control (VPOC) puts in play the $4,705.75 LVNode. Initiative trade beyond the LVNode could reach as high as the $4,716.75 LVNode and $4,740.50 minimal excess high, or higher.

In the worst case, the S&P 500 trades lower; activity below the $4,685.00 VPOC puts in play the $4,674.25 HVNode. Initiative trade beyond the HVNode could reach as low as the $4,647.25 and $4,618.75 HVNode, or lower.

Click here to load today’s key levels into the web-based TradingView charting platform. Note that all levels are derived using the 65-minute timeframe. New links are produced, daily.
Graphic: 65-minute profile chart of the Micro E-mini S&P 500 Futures. Learn about the profile.

What People Are Saying

Definitions

Cave-Fill Process: Widened the area deemed favorable to transact at by an increased share of participants. This is a good development.

Volume Areas: A structurally sound market will build on areas of high volume (HVNodes). Should the market trend for long periods of time, it will lack sound structure, identified as low volume areas (LVNodes). LVNodes denote directional conviction and ought to offer support on any test. 

If participants were to auction and find acceptance into areas of prior low volume (LVNodes), then future discovery ought to be volatile and quick as participants look to HVNodes for favorable entry or exit.

POCs: POCs are valuable as they denote areas where two-sided trade was most prevalent in a prior day session. Participants will respond to future tests of value as they offer favorable entry and exit.

Value-Area Placement: Perception of value unchanged if value overlapping (i.e., inside day). Perception of value has changed if value not overlapping (i.e., outside day). Delay trade in the former case.

Excess: A proper end to price discovery; the market travels too far while advertising prices. Responsive, other-timeframe (OTF) participants aggressively enter the market, leaving tails or gaps which denote unfair prices.

About

After years of self-education, strategy development, and trial-and-error, Renato Leonard Capelj began trading full-time and founded Physik Invest to detail his methods, research, and performance in the markets.

Additionally, Capelj is a Benzinga finance and technology reporter interviewing the likes of Shark Tank’s Kevin O’Leary, JC2 Ventures’ John Chambers, and ARK Invest’s Catherine Wood, as well as a SpotGamma contributor, helping develop insights around impactful options market dynamics.

Disclaimer

At this time, Physik Invest does not carry the right to provide advice. In no way should the materials herein be construed as advice. Derivatives carry a substantial risk of loss. All content is for informational purposes only.

Categories
Commentary

Daily Brief For November 24, 2021

What Happened

Overnight, equity index futures auctioned within the confines of Tuesday’s range, unable to follow through on attempts higher or lower. This comes as there was a clear validation of Monday’s knee-jerk selling.

This sideways-to-lower price action in the index products is happening alongside a sell-off in new issues and richly priced technology stocks. Part of the weakness may have something to do with investors booking capital losses to lower their capital gains. 

The other part of it, according to Bloomberg, is an exodus among professional investors who were counting on high-flyers to salvage their year. 

“There was a desire to kind of keep up with the broader index. And there was definitely a view that those are higher-beta assets and that’s a way to try and play a little bit of catch-up,” Barclays Plc’s (NYSE: BCS) Todd Sandoz said. “When the market turns and it’s not working, you need to take risks down. And everybody’s in those names, so you also probably have a view to try to cut things faster.”

With indices pinned and heavily weighted constituents sideways to higher, there is only one form of reconciliation – a decline in correlation. Nonetheless, fundamentals are no different; investors may be able to buy quality stocks at a discount amidst the market’s entry into a seasonally bullish period. 

Buybacks and increased retail engagement, resilient activity, and macro metrics, as well as excess liquidity, in the face of central bank cautiousness, suggest “dips should be bought,” according to Barclays.

Ahead is data on jobless claims, GDP, durable and core capital goods orders, and trade in goods (8:30 AM ET). Thereafter is data on personal and disposable income, consumer spending, core inflation, home sales, sentiment, and 5-year inflation expectations (10:00 AM ET). FOMC minutes come later (2:00 PM ET). 

Graphic updated 6:00 AM ET. Sentiment Neutral if expected /ES open is inside of the prior day’s range. /ES levels are derived from the profile graphic at the bottom of the following section. Levels may have changed since initially quoted; click here for the latest levels. SqueezeMetrics Dark Pool Index (DIX) and Gamma (GEX) calculations are based on where the prior day’s reading falls with respect to the MAX and MIN of all occurrences available. A higher DIX is bullish. At the same time, the lower the GEX, the more (expected) volatility. Learn the implications of volatility, direction, and moneyness. SHIFT data used for S&P 500 (INDEX: SPX) options activity. Note that options flow is sorted by the call premium spent; if more positive then more was spent on call options. Breadth reflects a reading of the prior day’s NYSE Advance/Decline indicator. VIX reflects a current reading of the CBOE Volatility Index (INDEX: VIX) from 0-100.

What To Expect

On divergent intraday breadth and market liquidity metrics, the worst-case outcome occurred, evidenced by an acceptance of Monday’s knee-jerk, high-tempo selling.

Though this activity marks a potential willingness to start trending lower, the nature of Monday’s liquidation, as well as the failure to follow-through (i.e., expand the range to the downside) forces us to question whether participants have it in them to push indices lower. 

In light of the activity we’re seeing, it’s tough to pick a direction and stick with it; the higher odds play, in light of the divergences we’re seeing in breadth metrics between exchanges, as well as market liquidity (below), is to responsively buy dips and sell rips.

Key levels to trade against are the high volume areas (HVNodes) at $4,691.25 and $4,647.25. The latter level corresponds with the 20-day simple moving average.

These levels are the clearest ways to measure risk, given the mechanical responses in prior trade. Should participants manage to break past either level, then conditions have changed. Follow-through is likely. Reason being? Those visual levels are acted on by short-term, technically-driven market participants who generally are unable to defend retests.
Graphic: Divergent delta (i.e., non-committed selling as measured by volume delta or buying and selling power as calculated by the difference in volume traded at the bid and offer) in SPDR S&P 500 ETF Trust (NYSE: SPY), one of the largest ETFs that track the S&P 500 index, via Bookmap. The readings are supportive of responsive trade (i.e., rotational trade that suggests current prices offer favorable entry and exit; the market is in balance).

Context: Keeping this section very short.

We saw the CBOE Volatility Index (INDEX: VIX) end higher, yesterday. 

However, supply came in across the entire area of the VIX futures term structure. That, with the long-gamma environment (defined below), suggests participants are not reaching for hedges.

For the time being, that’s stabilizing, cognizant of the fact that exuberance in individual stocks, over the past weeks, fed into the stock indices themselves.

Further, the price action we’re seeing is likely the resolve of some of that weak breadth we were seeing, recently, in addition to some of the topics discussed at the beginning of this newsletter.

Graphic: Divergences in breadth. SPX versus % of SPX stocks above the 200-day average.

In short, however, should volatility continue to pick up, those participants (who were once exuberant) may reach for protection forcing dealers to reflexively hedge in a destabilizing manner.

Once that protection rolls off the table (expires and/or is monetized), dealers will reverse and support the market, buying-to-close existing stock/futures hedges to negative gamma positions. 

This flow is stabilizing and may support a seasonally-aligned rally into Christmas.

Expectations: As of 6:00 AM ET, Wednesday’s regular session (9:30 AM – 4:00 PM ET), in the S&P 500, will likely open in the middle part of a negatively skewed overnight inventory, inside of prior-range and -value, suggesting a limited potential for immediate directional opportunity.

Spike Scenario In Play: A spike marks the beginning of a break from value. Spikes higher (lower) are validated by trade at or above (below) the spike base (i.e., the origin of the spike).

The spike may also be looked at as a pivot; in today’s case, the spike base is $4,697.50.

In the best case, the S&P 500 trades sideways or higher; activity above the $4,691.25 high volume area (HVNode) puts in play the $4,711.00 untested point of control (VPOC). Initiative trade beyond the VPOC could reach as high as the $4,740.50 minimal excess high and $4,765.25 Fibonacci, or higher.

In the worst case, the S&P 500 trades lower; activity below the $4,691.25 HVNode puts in play the $4,674.25 micro composite point of control (MCPOC). Initiative trade beyond the MCPOC could reach as low as the $4,647.25 HVNode and $4,619.00 VPOC, or lower.

Click here to load today’s updated key levels into the web-based TradingView charting platform. Note that all levels are derived using the 65-minute timeframe. New links are produced, daily.
Graphic: 65-minute profile chart of the Micro E-mini S&P 500 Futures. Learn about the profile.

Charts To Watch

What People Are Saying

Definitions

Overnight Rally Highs (Lows): Typically, there is a low historical probability associated with overnight rally-highs (lows) ending the upside (downside) discovery process.

Volume Areas: A structurally sound market will build on areas of high volume (HVNodes). Should the market trend for long periods of time, it will lack sound structure, identified as low volume areas (LVNodes). LVNodes denote directional conviction and ought to offer support on any test. 

If participants were to auction and find acceptance into areas of prior low volume (LVNodes), then future discovery ought to be volatile and quick as participants look to HVNodes for favorable entry or exit.

Gamma: Gamma is the sensitivity of an option to changes in the underlying price. Dealers that take the other side of options trades hedge their exposure to risk by buying and selling the underlying. When dealers are short-gamma, they hedge by buying into strength and selling into weakness. When dealers are long-gamma, they hedge by selling into strength and buying into weakness. The former exacerbates volatility. The latter calms volatility.

POCs: POCs are valuable as they denote areas where two-sided trade was most prevalent in a prior day session. Participants will respond to future tests of value as they offer favorable entry and exit.

MCPOCs: POCs are valuable as they denote areas where two-sided trade was most prevalent over numerous day sessions. Participants will respond to future tests of value as they offer favorable entry and exit.

About

After years of self-education, strategy development, and trial-and-error, Renato Leonard Capelj began trading full-time and founded Physik Invest to detail his methods, research, and performance in the markets.

Additionally, Capelj is a Benzinga finance and technology reporter interviewing the likes of Shark Tank’s Kevin O’Leary, JC2 Ventures’ John Chambers, and ARK Invest’s Catherine Wood, as well as a SpotGamma contributor, developing insights around impactful options market dynamics.

Disclaimer

At this time, Physik Invest does not manage outside capital and is not licensed. In no way should the materials herein be construed as advice. Derivatives carry a substantial risk of loss. All content is for informational purposes only.

Categories
Commentary

Daily Brief For November 22, 2021

What Happened

Overnight, equity index futures were sideways alongside the narrative that a strengthening dollar and the need to counteract inflation may endanger the rally in risk assets.

Ahead is data on the Chicago Fed National Activity Index (8:30 AM ET) and Existing Home Sales (10:00 AM ET).

Graphic updated 6:20 AM ET. Sentiment Neutral if expected /ES open is inside of the prior day’s range. /ES levels are derived from the profile graphic at the bottom of the following section. Levels may have changed since initially quoted; click here for the latest levels. SqueezeMetrics Dark Pool Index (DIX) and Gamma (GEX) calculations are based on where the prior day’s reading falls with respect to the MAX and MIN of all occurrences available. A higher DIX is bullish. At the same time, the lower the GEX, the more (expected) volatility. Learn the implications of volatility, direction, and moneyness. SHIFT data used for S&P 500 (INDEX: SPX) options activity. Note that options flow is sorted by the call premium spent; if more positive then more was spent on call options. Breadth reflects a reading of the prior day’s NYSE Advance/Decline indicator. VIX reflects a current reading of the CBOE Volatility Index (INDEX: VIX) from 0-100.

What To Expect

To start, on weak intraday breadth and supportive market liquidity metrics, the best case outcome occurred, evidenced by the balance and overlap of value areas in the S&P 500.

Taken together, the activity of the past two weeks or so signals participants’ willingness to position for directional resolve (i.e., trend) in the face of new information, and the like. 

Graphic: Divergent delta (i.e., non-committed selling as measured by volume delta or buying and selling power as calculated by the difference in volume traded at the bid and offer) in SPDR S&P 500 ETF Trust (NYSE: SPY), one of the largest ETFs that track the S&P 500 index, via Bookmap. The readings are supportive of responsive trade (i.e., rotational trade that suggests current prices offer favorable entry and exit; the market is in balance).

Context: The aforementioned trade is happening in the context of concerns over peak liquidity and prevailing monetary frameworks. 

Specifically, as Bloomberg’s John Authers put it, the abundance of global liquidity, that stoked one of the best stock market recoveries in history, is in peril by the strengthening of the dollar and the need to counter inflationary pressures. 

“Obstinately low real yields help to explain why the threat to liquidity has as yet had minimal effect on the stock market. Higher real yields are the shoe that hasn’t dropped this year; investors need a clear plan of evasive action for such an eventuality. For now, liquidity, liquidity, liquidity is still keeping stocks going up, up, up.”

Some of this fear around monetary evolution, so to speak, though, has yet to feed into the pricing of equity market risk. Fear in one market tends to feed into the fear of another.

Graphic: “The ICE BofA MOVE Index, which measures implied volatility for Treasuries, is close to the steepest level since April 2020,” via Bloomberg. This measure, on a relative basis, has diverged from the CBOE Volatility Index (VIX), which is a measure of implied volatility for equities, specifically the S&P 500. 

At the same time, we see a divergence in breadth.

Graphic: % of SPX stocks above their 200-Day Moving Average versus SPX, via indexindicators.com.

The takeaway here is that the SPX is sideways to higher while many of its constituents seem to not be participating in the most recent round of markup.

What factors are to blame for this? Two include an all-time high in buybacks, as well as extremes in speculation and upside volatility in heavily-weighted index constituents.

Adding, the S&P 500 closing last week pinned to the level at which dealers (i.e., those participants that take the other side of options trades and warehouse risk) exposure to positive options gamma was highest. 

Note that I talk about the implications options so much due to increased use and impact on underlying price, as a result of associated hedging. 

The aforementioned explains why the S&P can’t move; “If dealer hedging has suppressed index level volatility, but underlying components are still exhibiting idiosyncratic volatility, then the only reconciliation is a decline in correlation,” according to one paper by Newfound Research.

So trash breadth and a deceleration in equity inflows, coupled with exuberance (and upside volatility in heavily weighted index constituents) and clustered options positioning over the past weeks, is part of the reason why indices are sideways. Yes, to some extent.

Graphic: Per The Market Ear, “BofA points out the halt to inflows in market leaders such as tech, energy and financials. Basically, the “pillar of the pillar” of this market is fading. Do we still trust the seasonality pattern?”

The tone is to change, soon.

After OPEX, the absence of supportive vanna and charm flows (defined below), for which we can attribute some of the trends in extended day outperformance, alongside that sticky gamma hedging, so to speak, frees the market for directional resolve

According to SpotGamma, in light of recent exuberance, “participants are underexposed to downside put protection. Should these participants reach for long-gamma put exposures amidst volatility, there is a potential for a destabilizing, reflexive reaction on the part of dealers.”

The reason is, as volatility rises and customers demand out-of-the-money put protection, counterparties are to hedge by selling stock and futures into weakness. 

Cognizant of the risks, though, I end this section with the following. 

“[D]uring the 12-month period starting six months before and ending six months after a tightening cycle begins, the valuation of the S&P 500 has on average remained remarkably steady,” according to a post by The Market Ear.

At the same time, seasonality is great as, according to Callum Thomas, “Historically most of the time if the market closed up 20%+ for the year, the next year was also positive (84% of the time). As of writing, the market is up some 27% YTD (albeit, this year ain’t over yet!).”

Going forward, we shall monitor for the first signs of instability via spikes in the CBOE Volatility-Of-Volatility Index (INDEX: VVIX) and upward shifts in the VIX futures term structure.

Expectations: As of 6:20 AM ET, Monday’s regular session (9:30 AM – 4:00 PM ET), in the S&P 500, will likely open in the upper part of a positively skewed overnight inventory, inside of prior-range, suggesting a limited potential for immediate directional opportunity.

Balance-Break Scenarios: A change in the market (i.e., the transition from two-time frame trade, or balance, to one-time frame trade, or trend) may occur.

We monitor for acceptance (i.e., more than 1-hour of trade) outside of the balance area. Rejection (i.e., return inside of balance) portends a move to the opposite end of the balance.

Given the passage of OPEX, we ought to give more weight to directional resolve (i.e., trend).

In the best case, the S&P 500 trades sideways or higher; activity above the $4,692.25 high volume area (HVNode) puts in play the $4,723.50 overnight high (ONH). Initiative trade beyond the ONH could reach as high as the $4,735.25 and $4,765.25 Fibonacci, or higher.

In the worst case, the S&P 500 trades lower; activity below the $4,692.25 HVNode puts in play the $4,674.25 micro composite point of control (MCPOC). Initiative trade beyond the MCPOC could reach as low as the $4,647.25 HVNode and $4,619.00 VPOC, or lower.

Click here to load today’s updated key levels into the web-based TradingView charting platform. Note that all levels are derived using the 65-minute timeframe. New links are produced, daily.
Graphic: 65-minute profile chart of the Micro E-mini S&P 500 Futures. Learn about the profile

Definitions

Overnight Rally Highs (Lows): Typically, there is a low historical probability associated with overnight rally-highs (lows) ending the upside (downside) discovery process.

Volume Areas: A structurally sound market will build on areas of high volume (HVNodes). Should the market trend for long periods of time, it will lack sound structure, identified as low volume areas (LVNodes). LVNodes denote directional conviction and ought to offer support on any test. 

If participants were to auction and find acceptance into areas of prior low volume (LVNodes), then future discovery ought to be volatile and quick as participants look to HVNodes for favorable entry or exit.

Gamma: Gamma is the sensitivity of an option to changes in the underlying price. Dealers that take the other side of options trades hedge their exposure to risk by buying and selling the underlying. When dealers are short-gamma, they hedge by buying into strength and selling into weakness. When dealers are long-gamma, they hedge by selling into strength and buying into weakness. The former exacerbates volatility. The latter calms volatility.

Vanna: The rate at which the delta of an option changes with respect to volatility.

Charm: The rate at which the delta of an option changes with respect to time.

POCs: POCs are valuable as they denote areas where two-sided trade was most prevalent in a prior day session. Participants will respond to future tests of value as they offer favorable entry and exit.

MCPOCs: POCs are valuable as they denote areas where two-sided trade was most prevalent over numerous day sessions. Participants will respond to future tests of value as they offer favorable entry and exit.

About

After years of self-education, strategy development, and trial-and-error, Renato Leonard Capelj began trading full-time and founded Physik Invest to detail his methods, research, and performance in the markets.

Additionally, Capelj is a Benzinga finance and technology reporter interviewing the likes of Shark Tank’s Kevin O’Leary, JC2 Ventures’ John Chambers, and ARK Invest’s Catherine Wood, as well as a SpotGamma contributor, developing insights around impactful options market dynamics.

Disclaimer

At this time, Physik Invest does not manage outside capital and is not licensed. In no way should the materials herein be construed as advice. Derivatives carry a substantial risk of loss. All content is for informational purposes only.