We’re excited to announce that we will be publishing ultra-detailed notes with context on fundamentals, positioning, and specific trades. Notes will be nearly 3,000 words or more, and will not be in the traditional newsletter format. Though this newsletter will continue to be published, it will not maintain previously long lengths because of time constraints. Notwithstanding, there will be occasional longer issues, we promise! We aim for quality rather than quantity. Stay tuned for future money-making updates.
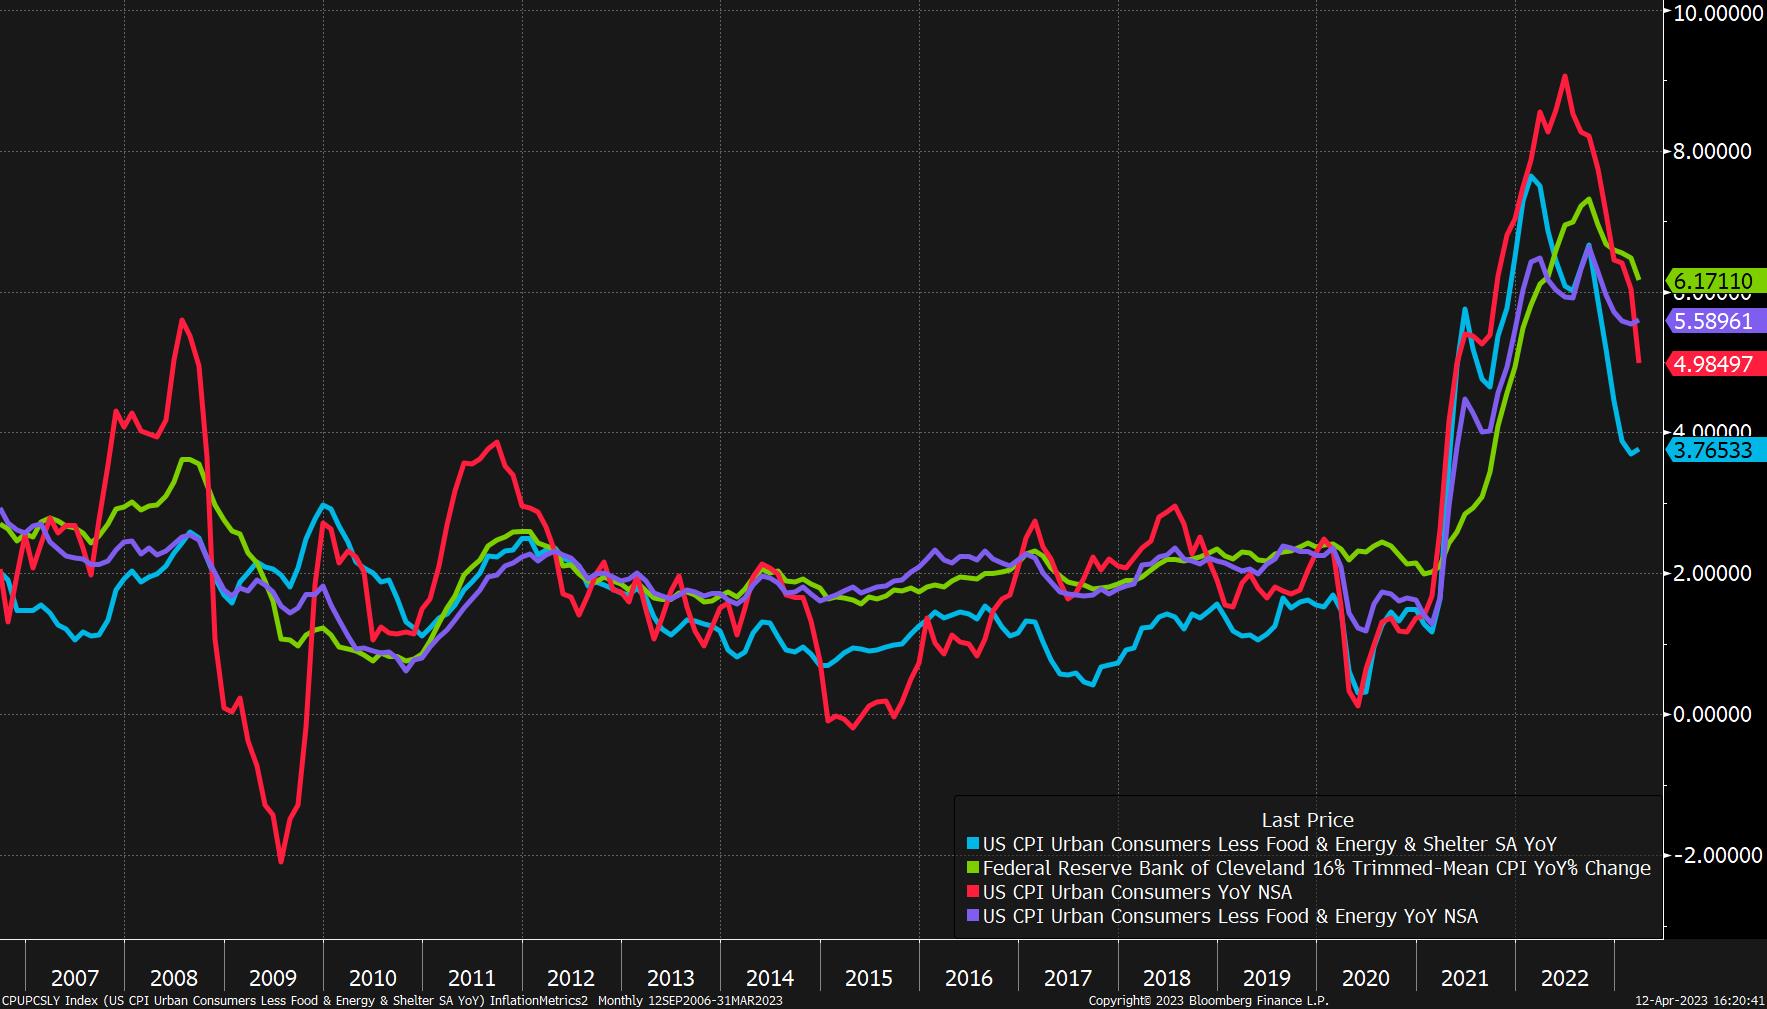
Market indicators suggest an interest rate hike in May is more likely. This is backed by inflation data and Federal Reserve meeting minutes.
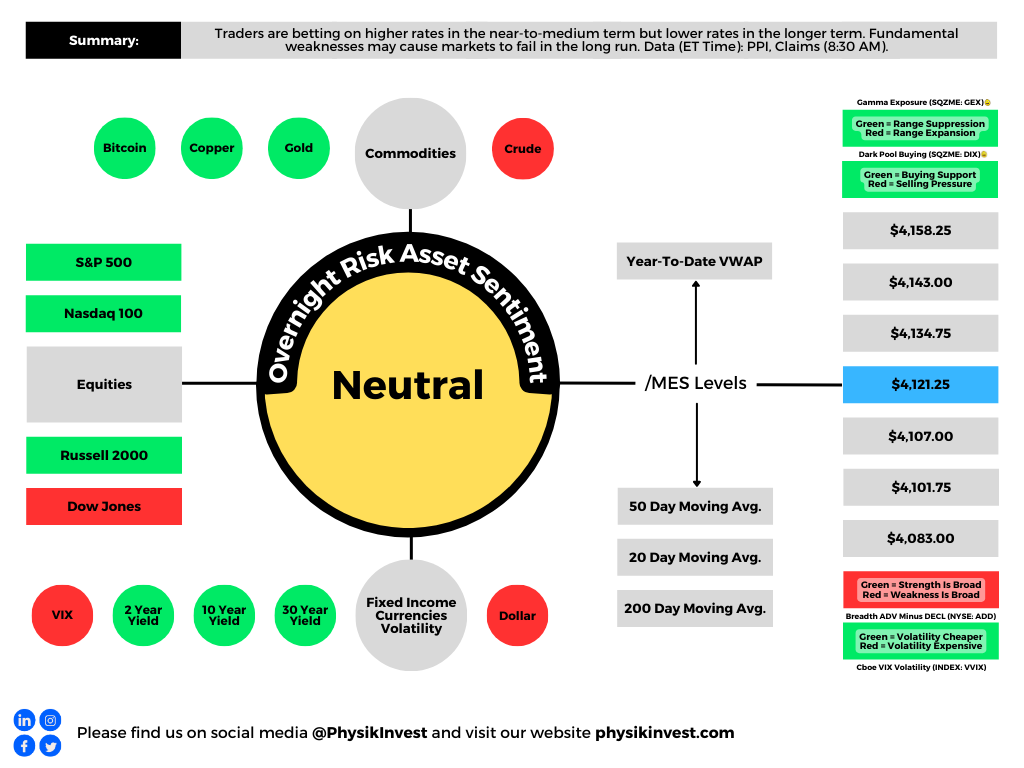
To be more specific, the indicators show traders are betting on higher rates in the near-to-medium term, and lower rates in the longer term. Adding, while inflation has moderated and there have been recent turbulences in the banking sector, monetary policymakers think higher rates for just a bit more are valid. However, they are also aware that a reduction in lending could potentially lead to defaults, recession, and a credit crunch in the worst-case scenario.
Fed President John Williams agreed that bringing down inflation requires more work. Williams suggested that the Fed should consider one more interest-rate hike before pausing, but the actual trajectory of rates will be based on analysis of newer data.
Per Cem Karsan from Kai Volatility, the negative effects of policy decisions will take time to reflect in the market.
He said investors are mostly bullish with a +1 Put, +100 Stock, -1 Call position, while dealers hold the opposite with a -1 Put, -100 Stock, +1 Call position. As the volatility trends lower (e.g., S&P 500 realized volatility or RVOL is ~10), options lose value, and dealers must buy back their short stock to re-hedge. This supports the market.
Thus, Karsan said the markets will be contained in the short to medium term, but fundamental weaknesses, such as the Fed hiking long-end yields, may cause them to fail in the long run. We maintain medium-term strength is monetizable via call spread structures discussed in prior newsletters. Rotating profits into longer-dated bets on markets or rates falling is attractive as well.
About
Welcome to the Daily Brief by Physik Invest, a soon-to-launch research, consulting, trading, and asset management solutions provider. Learn about our origin story here, and consider subscribing for daily updates on the critical contexts that could lend to future market movement.
Separately, please don’t use this free letter as advice; all content is for informational purposes, and derivatives carry a substantial risk of loss. At this time, Capelj and Physik Invest, non-professional advisors, will never solicit others for capital or collect fees and disbursements. Separately, you may view this letter’s content calendar at this link.
Physik Invest’s Daily Brief is read by thousands of subscribers. You, too, can join this community to learn about the fundamental and technical drivers of markets.
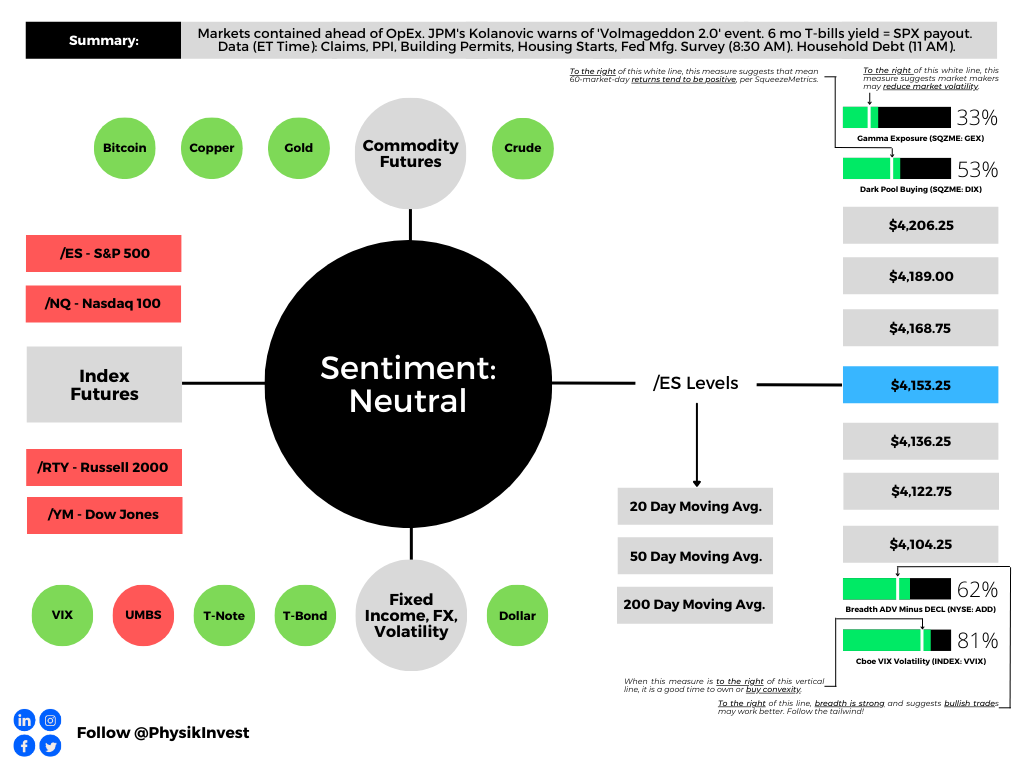
Graphic updated 6:15 AM ET. Sentiment Neutral if expected /ES open is inside of the prior day’s range. /ES levels are derived from the profile graphic at the bottom of this letter. Click here for the latest levels. SqueezeMetrics Dark Pool Index (DIX) and Gamma (GEX) with the latter calculated based on where the prior day’s reading falls with respect to the MAX and MIN of all occurrences available. A higher DIX is bullish. At the same time, the lower the GEX, the more (expected) volatility. Click to learn the implications of volatility, direction, and moneyness. Breadth reflects a reading of the prior day’s NYSE Advance/Decline indicator. The CBOE VIX Volatility Index (INDEX: VVIX) reflects the attractiveness of owning volatility. UMBS price via MND. Click here for the calendar.
Positioning
In the news is quite a bit of noise surrounding ultra-short-dated options with little time to expiry. To quote Nomura Holdings Inc’s (NYSE: NMR) Charlie McElligott, the trading of these options is adding noise; “US equities are such an untradable mess right now.”
However, your letter writer, who mainly trades complex spreads on the cash-settled indexes, thinks there has never been a better time to trade. Ultra-short-dated options enable you to express your opinion in more efficient ways. Additionally, the trade of these options, in the aggregate, can influence market movements, and this is added opportunity if you understand it.
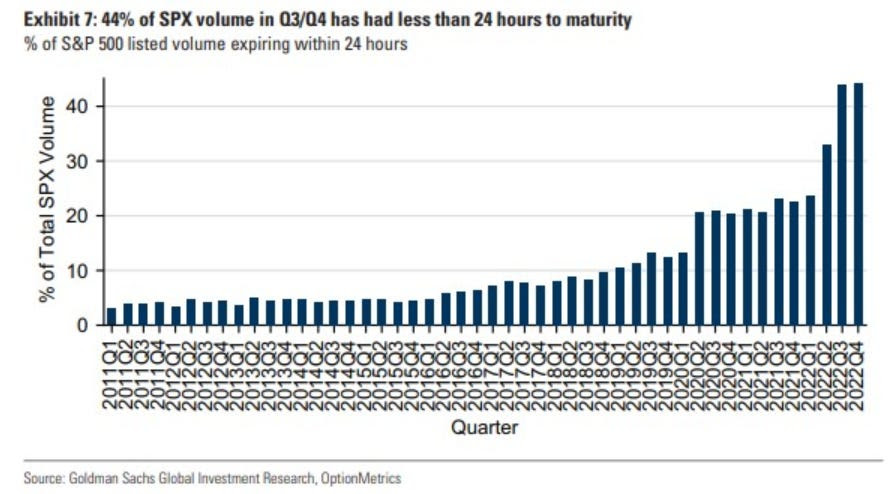
Graphic: Retrieved from Goldman Sachs Group Inc (NYSE: GS) via Bloomberg.
Darrin Johnson, a volatility trader, recently discussed sharp ways to use these options.
Heading into some big events this week, John noted S&P 500 (INDEX: SPX) implied volatility (IVOL) was trading at ~25% on a five-day straddle. Traders could buy this structure while, in the interim, selling other structures like it “against CPI, Retail Sales, and PPI” where IVOL was higher. This would enable you to lower the cost of having positive exposure to movement or positive gamma via the five-day straddle, though this is operating on the premise “that Friday’s volatility will hold mostly steady, while the other 3 deflate.”
Moreover, the ultra-short-dated options are palatable if we will, and other traders, potentially much bigger in size, are observant of this too. The growing interest in these products (e.g., in the second half of last year, ultra-short-dated options made up more than 40% of the S&P 500’s trading volume) is growing in impact on underlying products like the SPX.
In fact, JPMorgan Chase & Co’s (NYSE: JPM) Peng Cheng found these options have an impact that “can vary from a drag of as much as 0.6% to a boost of up to 1.1%.”
To explain, though as of late options counterparties may be playing a smaller role as “customers have taken equal and opposite sides” of positions, per SqueezeMetrics, we can naively look at there being a pool of liquidity to absorb the demand for these ultra-short-dated options which are very sensitive to time, price, and volatility. These increased sensitivities are hedged in a way that impacts this available pool of liquidity. If the trade or impact is large enough, it is transmitted onto underlying market prices.
For instance, consider so-called meme mania and stocks like GameStop Corporation (NYSE: GME) that rocketed as traders’ interest in short-dated options demands rose. To hedge increased demand in call options, for instance, counterparties must buy the underlying stock. This demand boosts the stock.
Likewise, if traders’ consensus is that markets won’t move much until some large macroeconomic events, then their bets against market movement (i.e., sell ultra-short-dated options) will result in counterparties having more exposure to bets on market movement (i.e., positive gamma) which they will hedge in a way that reduces market movement (i.e., buy weakness or sell strength in the underlying stock). So, if traders bet against the movement, resulting in more counterparty positive gamma, then market movement is reduced due to the reaction to this positioning.
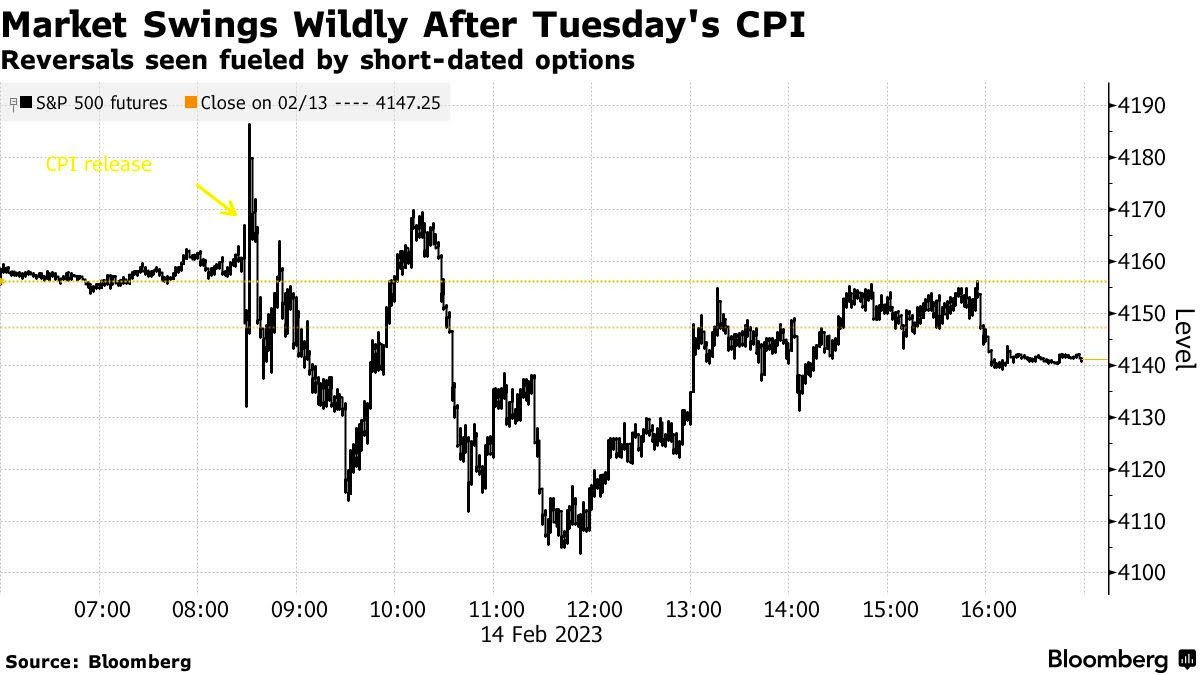
On the other hand, if traders’ consensus is that markets may move a lot, particularly to the downside, their bets on market movement (e.g., buy ultra-short-dated put) will result in counterparties having more exposure to bets against market movement (i.e., negative gamma). This demand for protection will bid options prices, particularly at the front-end of the IVOL term structure as counterparties price this demand in, and the counterparty will sell underlying to hedge. If fears are assuaged and traders no longer demand these bets on market movements, the counterparty can unwind their hedge which, in the put buying example provided, may provide a market boost, such as that which we saw immediately following the release of consumer price updates (CPI) this week; to quote Bloomberg, “[w]hen the worst didn’t happen, these hedges were unwound, helping propel a recovery in futures. It’s partly why the Cboe Volatility Index, or VIX, dropped 7% in a seemingly outsize reaction in a market when the S&P 500 ended the session basically flat.”
Additionally, the re-hedging-inspired recovery was short-lived as well; the impact of ultra-short-dated options, as this letter has stated before, is short-dated. It, too, does much less to influence measures like the Cboe Volatility Index (INDEX: VIX), a floating measure of ~30 day-to-expiry SPX options trading at a fixed-strike IVOL, though it does have an impact. Thus, the dis-interest to hedge stocks traders do not own (or hedge further stocks that may be hedged) out in time, does less to boost the VIX.
Anyways, in January, your letter writer interviewed The Ambrus Group’s co-CIO Kris Sidial about major risks to markets in 2023, as well as reasons why volatility could outperform in 2023 and beyond. Some of the information in that Benzinga interview made it into this newsletter in the days following its release.
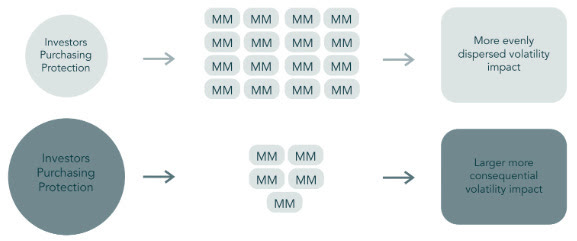
Basically, the SPX and VIX complexes are growing and, on the other side, are a small concentrated group of market makers taking on far more exposure to risk.
Graphic: Retrieved from Ambrus’ publicly available research.
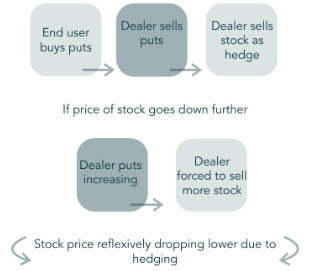
During moments of stress, as we’ve seen in the past with GME for example, options counterparties may be unable to keep up with the demands of investors, so you get a reflexive dynamic that helps push the stock higher. “That same dynamic can happen on the way down”; counterparties will mark up options prices during intense selling. As the options prices rise, options deltas (i.e., their exposure to direction) rise and this prompts so-called bearish vanna counterparty hedging flows in the underlying.
“Imagine a scenario where [some disaster happens] and everybody starts buying 0 DTE puts. That’s going to reflexively drive the S&P lower,” Sidial said. “Take, for example, the JPMorgan collar position that clearly has an effect on the market, and people are starting to understand that effect. That’s just one fund. Imagine the whole derivative ecosystem” leaning one way.
Graphic: Retrieved from Ambrus’ publicly available research.
Well, that’s what JPM’s Marko Kolanovic just said is a major risk and could exacerbate market volatility. “While history doesn’t repeat, it often rhymes,” he explained, noting that the trade of ultra-short-dated options portends a Volmageddon 2.0. If you recall, in 2018, Volmageddon 1.0 turned successful long-running short-volatility trades on their head when traders who were betting against big movements in the market saw their profits erode in days.
Further, to conclude this section since your letter writer is running short on time, as Sidial said, “if you’re trading volatility, let there be an underlying catalyst for doing so.” From a “risk-to-reward perspective, … it’s a better bet to be on the long volatility side,” given “that there are so many things that … keep popping up” from a macro perspective. Check out our letters from the past weeks where we talked about protecting profits (e.g., sell call vertical to finance and buy a put vertical with a lot of time to expiry).
For Ambrus’ publicly available research, click here. Also, follow Sidial on Twitter, here. Consider reading your letter writer’s past two conversations with Sidial, as well. Here is an article on 2021 and the meme stock debacle. Here is another article talking more about Ambrus’ processes.
Technical
As of 6:15 AM ET, Thursday’s regular session (9:30 AM – 4:00 PM ET), in the S&P 500, is likely to open in the lower part of a balanced overnight inventory, inside of the prior day’s range, suggesting a limited potential for immediate directional opportunity.
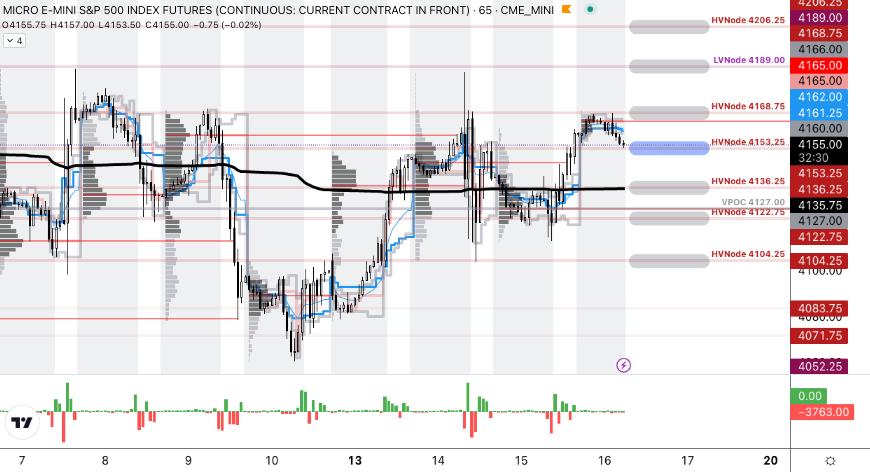
The S&P 500 pivot for today is $4,153.25.
Key levels to the upside include $4,168.75, $4,189.00, and $4,206.25.
Key levels to the downside include $4,136.25, $4,122.75, and $4,104.25.
Disclaimer: Click here to load the updated key levels via the web-based TradingView platform. New links are produced daily. Quoted levels likely hold barring an exogenous development.
Graphic: 65-minute profile chart of the Micro E-mini S&P 500 Futures.
Definitions
Volume Areas: Markets will build on areas of high-volume (HVNodes). Should the market trend for a period of time, this will be identified by a low-volume area (LVNodes). The LVNodes denote directional conviction and ought to offer support on any test.
If participants auction and find acceptance in an area of a prior LVNode, then future discovery ought to be volatile and quick as participants look to the nearest HVNodes for more favorable entry or exit.
POCs: Areas where two-sided trade was most prevalent in a prior day session. Participants will respond to future tests of value as they offer favorable entry and exit.
About
The author, Renato Leonard Capelj, works in finance and journalism.
Capelj spends the bulk of his time at Physik Invest, an entity through which he invests and publishes free daily analyses to thousands of subscribers. The analyses offer him and his subscribers a way to stay on the right side of the market. Separately, Capelj is an options analyst at SpotGamma and an accredited journalist.
Physik Invest’s Daily Brief is read by thousands of subscribers. You, too, can join this community to learn about the fundamental and technical drivers of markets.
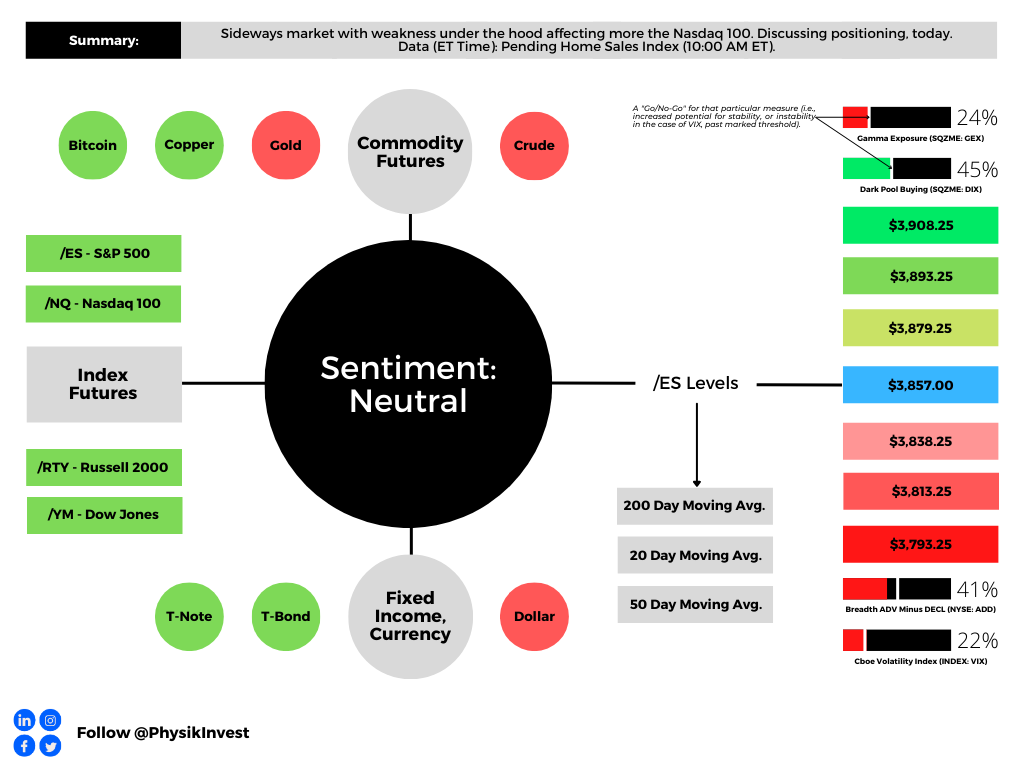
Graphic updated 6:40 AM ET. Sentiment Neutral if expected /ES open is inside of the prior day’s range. /ES levels are derived from the profile graphic at the bottom of this letter. Levels may have changed since initially quoted; click here for the latest levels. SqueezeMetrics Dark Pool Index (DIX) and Gamma (GEX) with the latter calculated based on where the prior day’s reading falls with respect to the MAX and MIN of all occurrences available. A higher DIX is bullish. At the same time, the lower the GEX, the more (expected) volatility. Click to learn the implications of volatility, direction, and moneyness. Breadth reflects a reading of the prior day’s NYSE Advance/Decline indicator. VIX reflects a current reading of the CBOE Volatility Index (INDEX: VIX) from 0-100.
Positioning
In Physik Invest’s Market Intelligence letter for December 21, we discussed the potential for “pressure on options prices [to] remain through December.” In short, on the odds that “nothing happens through the holidays,” it made sense to sell implied volatility (IVOL) after CPI and FOMC targeting an end-of-month expiration.
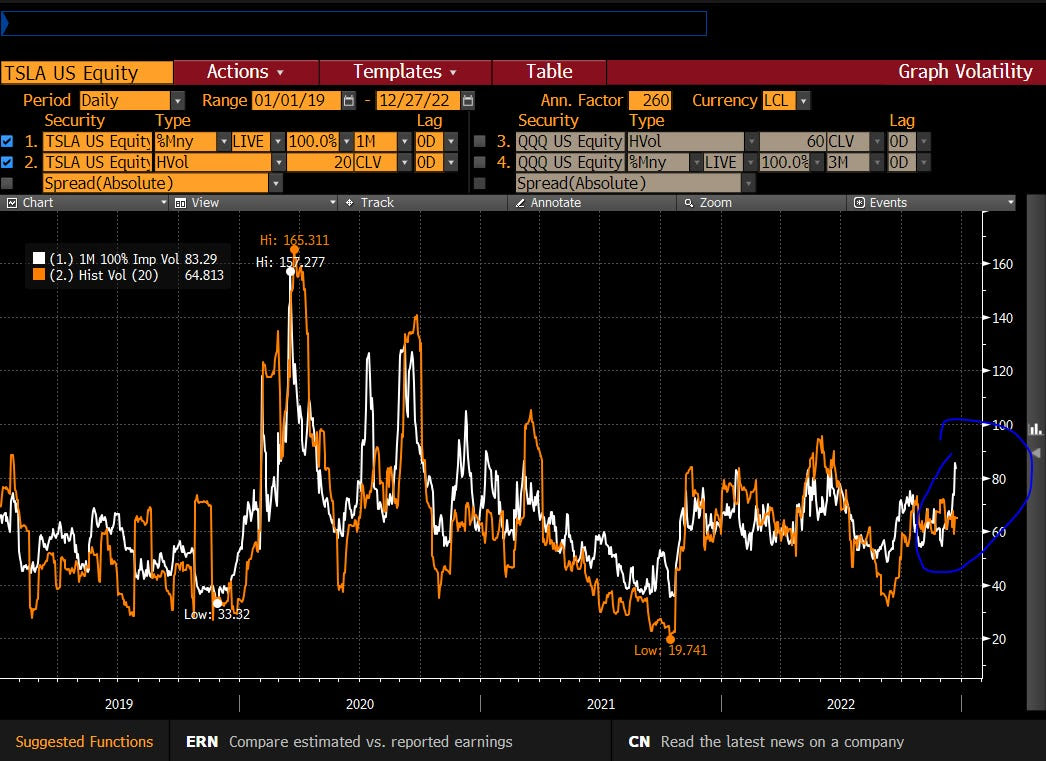
The downward trajectory in IVOL remains intact in spite of some pockets of weakness under the hood in index heavyweights like Tesla Inc (NASDAQ: TSLA); expectations of future movement remain mute at both the index and single stock levels. As a result, short volatility trades (e.g., short straddle) in the indexes and near current market prices, expiring later this month, are doing really well.
Graphic: Retrieved from Kris Sidial. Tesla Inc (NASDAQ: TSLA) 1-month IVOL “relatively muted throughout the pain.”
Part of the equation resulting in this sideways market and tame IVOL environment was discussed in the December 21 letter. Today we add color.
In short, traders’ anticipation of a market drop, as evidenced by them reducing equity exposures into and through the 2022 market decline, coupled with the exploitation of loopholes manifesting increased demand for short-dated exposure to movements (i.e., gamma), and a supply of IVOL that is farther-dated, has put a lid on broad equity IVOL measures like the Cboe Volatility Index (INDEX: VIX) and pushed skew lower.
Consequently, hedges performing well have a lot of +gamma intraday and exposure to realized volatility (RVOL), and less exposure to longer-dated IVOL. The other side of this trade (and those who may be warehousing this risk) has exposure to -gamma and, to hedge that, they must act in a manner that exacerbates realized movement, hence RVOL’s meaningful outperformance.
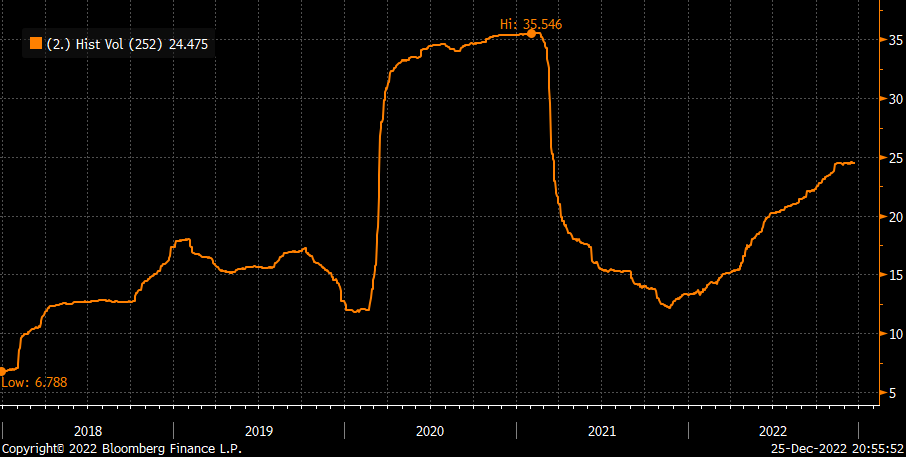
In fact, RVOL in 2022 is nearly two times the level of RVOL in 2021, all the while the IVOL term structure is basically at the “same place it was a year ago,” according to Danny Kirsch of Piper Sandler Companies (NYSE: PIPR).
Graphic: Retrieved from Danny Kirsch, the head of options at Piper Sandler Companies (NYSE: PIPR). “Rolling 1 year realized volatility [for] … 2022 nearly 2x the level of 2021, speaks to long gamma and not vega for 2022.”
In a two-and-a-half-hour Twitter Spaces discussion, Kai Volatility’s Cem Karsan discussed what is the potential cause of this. Some of the blame rests on the way margin calculations (i.e., the loophole mentioned earlier); less cash must be posted if trades are closed the same day, basically.
Anyways, at the macro level, yes, the trends continue. Generally speaking, IVOL is mute and not accounting for the activity in short-dated options, as discussed by The Ambrus Group’s recent paper, while RVOL is about two times the level it was in 2021, making +gamma profitable.
However, at the micro level, so to speak, as we started out this discussion, traders’ anticipation that “nothing happens through the holidays,” has resulted in the supply of short-dated volatility, boosting the stickiness of open interest at current market prices.
Let’s unpack this further and explain why this activity won’t continue forever.
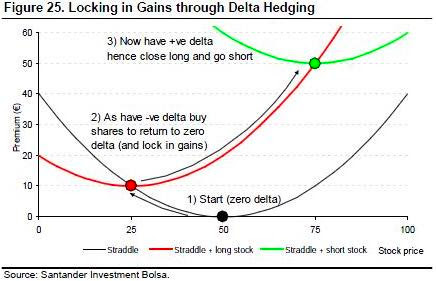
Near current market prices sit large concentrations of options positions. For instance, we have the $3,835.00 SPX strike (the call part of a massively popular collar trade that is rolled every quarter). At $3,835.00 is the short strike of a big collar trade.
This means the trader (or fund owner) is short the call, hence -delta and -gamma. The other side (or counterpart) is long the call, hence +delta and +gamma.
In theory, the other side, in response to this exposure, will buy weakness and sell strength. In other words, to hedge a long call, the other side sells futures. If the market falls, the call’s delta will fall and become less positive. Therefore, the other side will buy back some of their initial futures hedges (reduce -delta from short futures) to neutralize delta risk. If the market rises, the other side will have more exposure to +delta. To neutralize the delta, the other side will sell more futures.
As a consequence, the market pins.
Graphic: Retrieved from Banco Santander SA (NYSE: SAN).
This is a trend, as we discussed on December 21, that likely continues through year-end. After year-end, the market is likely to “move more freely,” per SpotGamma, “because this options activity that is promoting mean reversion will no longer be there,” and, therefore, the indexes likely trade more “in sync with its wild constituents of the likes of Tesla and beyond.”
More on what’s next:
As Karsan dissected, yesterday, there’s a “liquidity premium” that’s getting crowded short; in this less well-hedged market environment, traders’ realization with respect to liquidity and collateral needs for supporting trading activities may provide the context for some sharp drops. But first, it’s likely (though not certain) the market experiences some relief. Knowing that the long-end is cheap (hence near-zero percentile skew) on a supply and demand basis, it does not make sense to sell options blindly out in time.
Technical
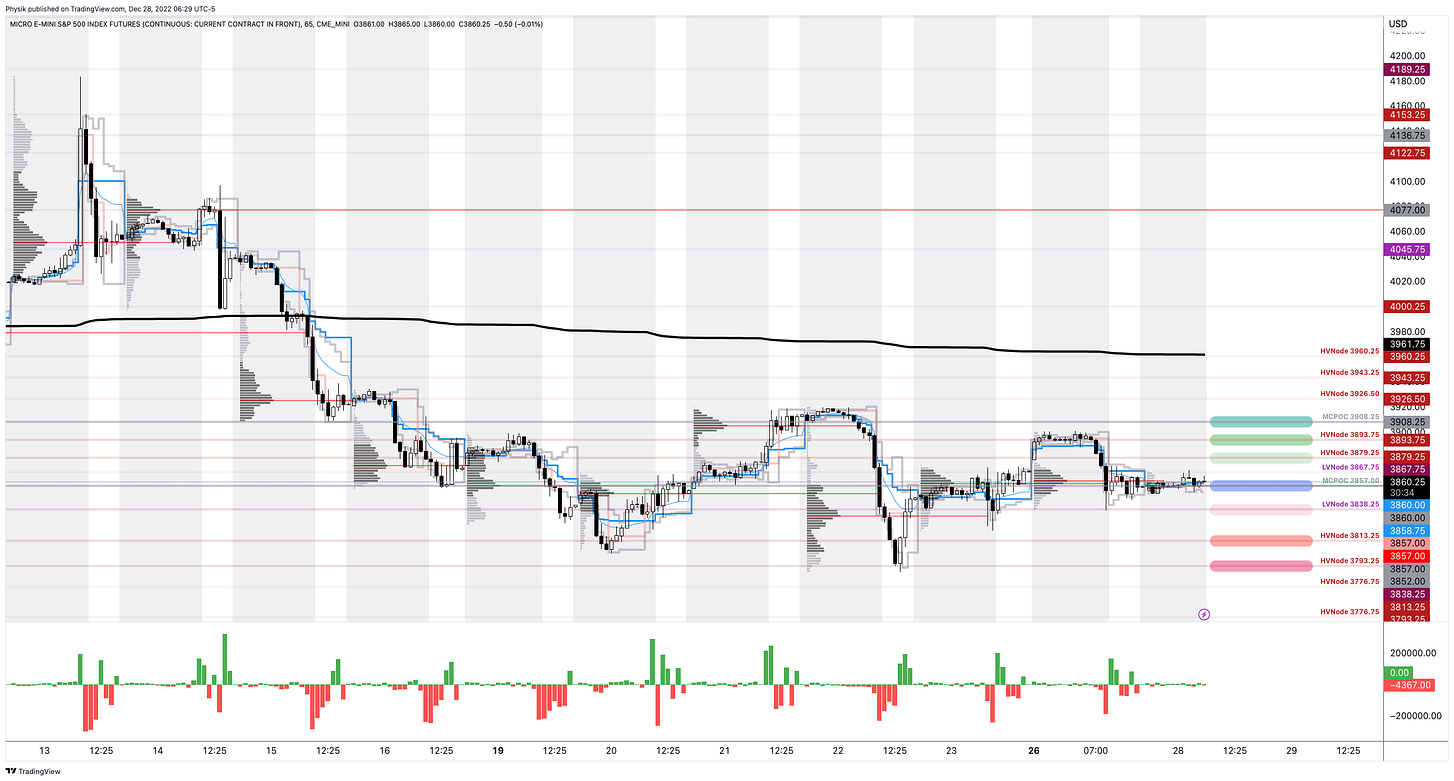
As of 6:30 AM ET, Wednesday’s regular session (9:30 AM – 4:00 PM ET), in the S&P 500, is likely to open in the middle part of a balanced overnight inventory, inside of prior-range and -value, suggesting a limited potential for immediate directional opportunity.
Our S&P 500 pivot for today is $3,857.00.
Key levels to the upside include $3,879.25, $3,893.75, and $3,908.25.
Key levels to the downside include $3,838.25, $3,813.25, and $3,793.25.
Click here to load today’s key levels into the web-based TradingView platform. All levels are derived using the 65-minute timeframe. New links are produced, daily.
Graphic: 65-minute profile chart of the Micro E-mini S&P 500 Futures.
Definitions
Volume Areas: Markets will build on areas of high-volume (HVNodes). Should the market trend for long periods of time, it will be identified by low-volume areas (LVNodes). LVNodes denote directional conviction and ought to offer support on any test.
If participants auction and find acceptance in an area of a prior LVNode, then future discovery ought to be volatile and quick as participants look to HVNodes for favorable entry or exit.
MCPOCs: Denote areas where two-sided trade was most prevalent over numerous sessions. Participants will respond to future tests of value as they offer favorable entry and exit.
About
In short, an economics graduate working in finance and journalism.
Capelj spends most of his time as the founder of Physik Invest through which he invests and publishes daily analyses to subscribers, some of whom represent well-known institutions.
Separately, Capelj is an equity options analyst at SpotGamma and an accredited journalist interviewing global leaders in business, government, and finance.