Bank of America Corporation (NYSE: BAC) sees allocations to equities versus bonds falling. That’s amid recession fears. Per EPB, “the cyclical economy has just started to shed jobs today, and leading indicators signal the recession is likely underway.”
“To get advanced warning of recessions, you must look at the construction and manufacturing sectors, even though these two sectors are only 13% of the labor market,” EPB adds, noting traditional indicators’ weakening predictability is not so great to ignore the insight. “It’s clear that the composition of traditional leading indicators remains appropriate, and thus, the current resounding recessionary signal should not be ignored.”
BAC strategist Michael Hartnett said, though, that this “consensus lust for recession” must soon be satisfied. Otherwise, the “pain trade” would be even higher yields and stocks; the S&P 500 (INDEX: SPX) is enjoying an accelerated rally which Jefferies Financial Group (NYSE: JEF) strategists think portends a period of flatness, now, over the coming weeks …
Graphic: Retrieved from Jefferies Financial Group (NYSE: JEF) via The Market Ear.
… and through options expiration (OpEx), typically a poor performance period for the SPX.
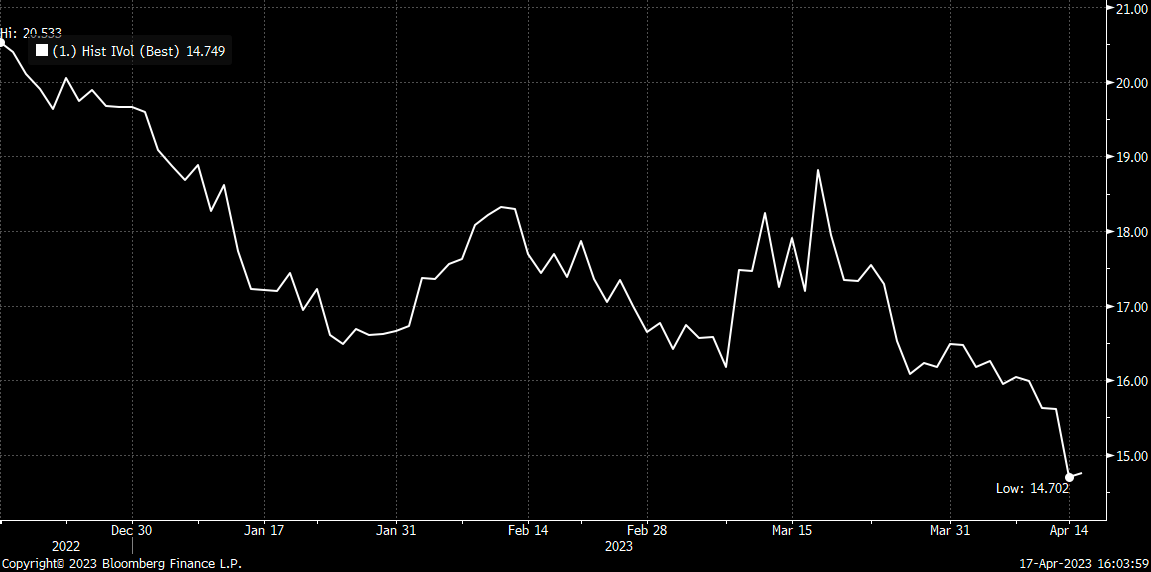
Beyond the uninspiring fundamentals, the positioning contexts are supportive. Recall our letters published earlier this year. If the market consolidated and failed to break substantially, then falling implied volatility (IVOL) and time passing would bolster markets and, potentially, help build a platform for a rally into mid-year. A check of fixed-strike and top-line measures of IVOL like the Cboe Volatility Index or VIX confirms options activities are keeping markets intact.
Graphic: Retrieved from Danny Kirsch of Piper Sandler (NYSE: PIPR). “SPX May $4,150.00 call volatility, the lack of realized volatility weighing on the market. Volatility low, not cheap.”
Beyond the rotation into shorter-dated options, just one of the factors exacerbating the decimation of longer-dated volatility, traders’ consensus is that markets won’t move a lot and/or they don’t need to hedge over longer time horizons; traders want punchier exposure to realized volatility (RVOL), and that they can get through shorter-dated options that have more gamma (i.e., exposure to changes in movement), not vega (i.e., exposure to changes in implied volatility).
Graphic: Retrieved from Goldman Sachs Group Inc (NYSE: GS) via Bloomberg.
Consequently, counterparties may be less dangerous to accelerating movement in either direction; hence, the growing likelihood of a period of flatness.
“Despite the collapse in the 1-month realized volatility, we suspect most vol control funds have scaled into using their longer-term realized vols, which by design, lead to less aggressive rebalancing flows,” Tier1Alpha says. “For example, the 3-month rVol, which is currently driving our model, was essentially unchanged yesterday, which means volatility targets were maintained, and very little additional rebalancing had to occur. So even with the decline in the 1-month vol, overall risk exposure remained the same.”
With IVOL at a lower bound, the bullish impacts yielded by its compressing have largely played out. There may be more to be gained by movements higher in IVOL, in addition to the expiry of many call options this OpEx. By owning protection, particularly far from current prices, you are positioned to monetize on the market downside and non-linear repricings of volatility, as this letter has discussed in recent history. The caveat is that volatility can cluster and revert for longer; hence, your structure matters.
“I am concerned that VIX is underpricing the series of events that we know to expect over the coming weeks,” says Interactive Brokers Group Inc’s (NASDAQ: IBKR) Steve Sosnick. “While there is now an 88% implied likelihood of a 25 basis point hike, the likely path of any potential future hikes and assumed cuts should be more clarified at the meeting and in its aftermath. And oh, has anyone ever heard the expression “sell in May and go away?”
Graphic: Retrieved from Interactive Brokers Group Inc (NASDAQ: IBKR).
With call skews far up meaningfully steep in some products, still-present low- and zero-cost call structures this letter has talked about in the past remain attractive. If the market falls apart, your costs are low, and losses are minimal. If markets move higher into a “more combustible” position, wherein “volatility is sticky into a rally,” you may monetize your call structures and roll some of those profits into bear put spreads (i.e., buy put and sell another at a lower strike). An alternative option is neutral. Own something such as a T-bill or box spread (i.e., buy call and sell put at one strike and sell call and buy put at another higher strike). Some boxes are yielding upwards of 5.4% as of yesterday’s close.
To end, though the short-dated options activity may prompt cascading events in market downturns, the main issue is the reduced use of longer-dated options; a supply and demand imbalance likely resolves itself with an implied volatility repricing of a great size where longer-dated options outperform those that are shorter-dated.
Our locking in of rates or using the profits of call structures to position for a potential IVOL repricing, particularly in the back half of the year when dealer positioning is less clear, buybacks are to fall off of a cliff, rates may fall, and the boost from short-covering has played its course, is an attractive proposition given the context.
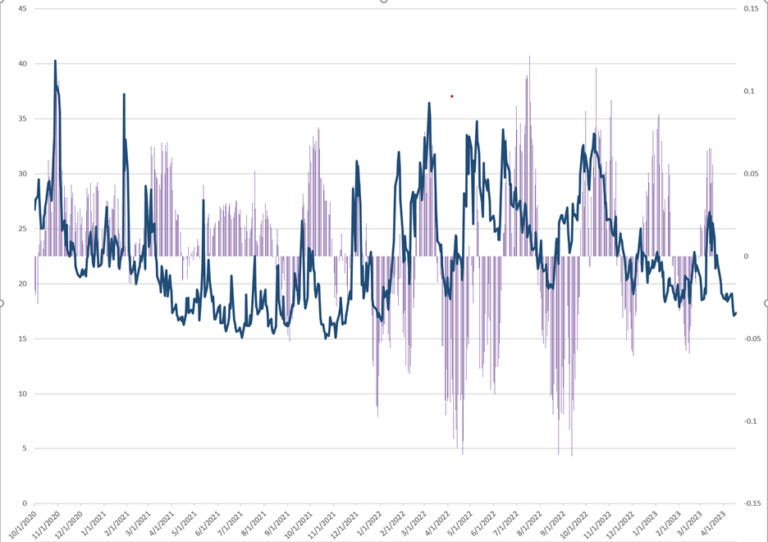
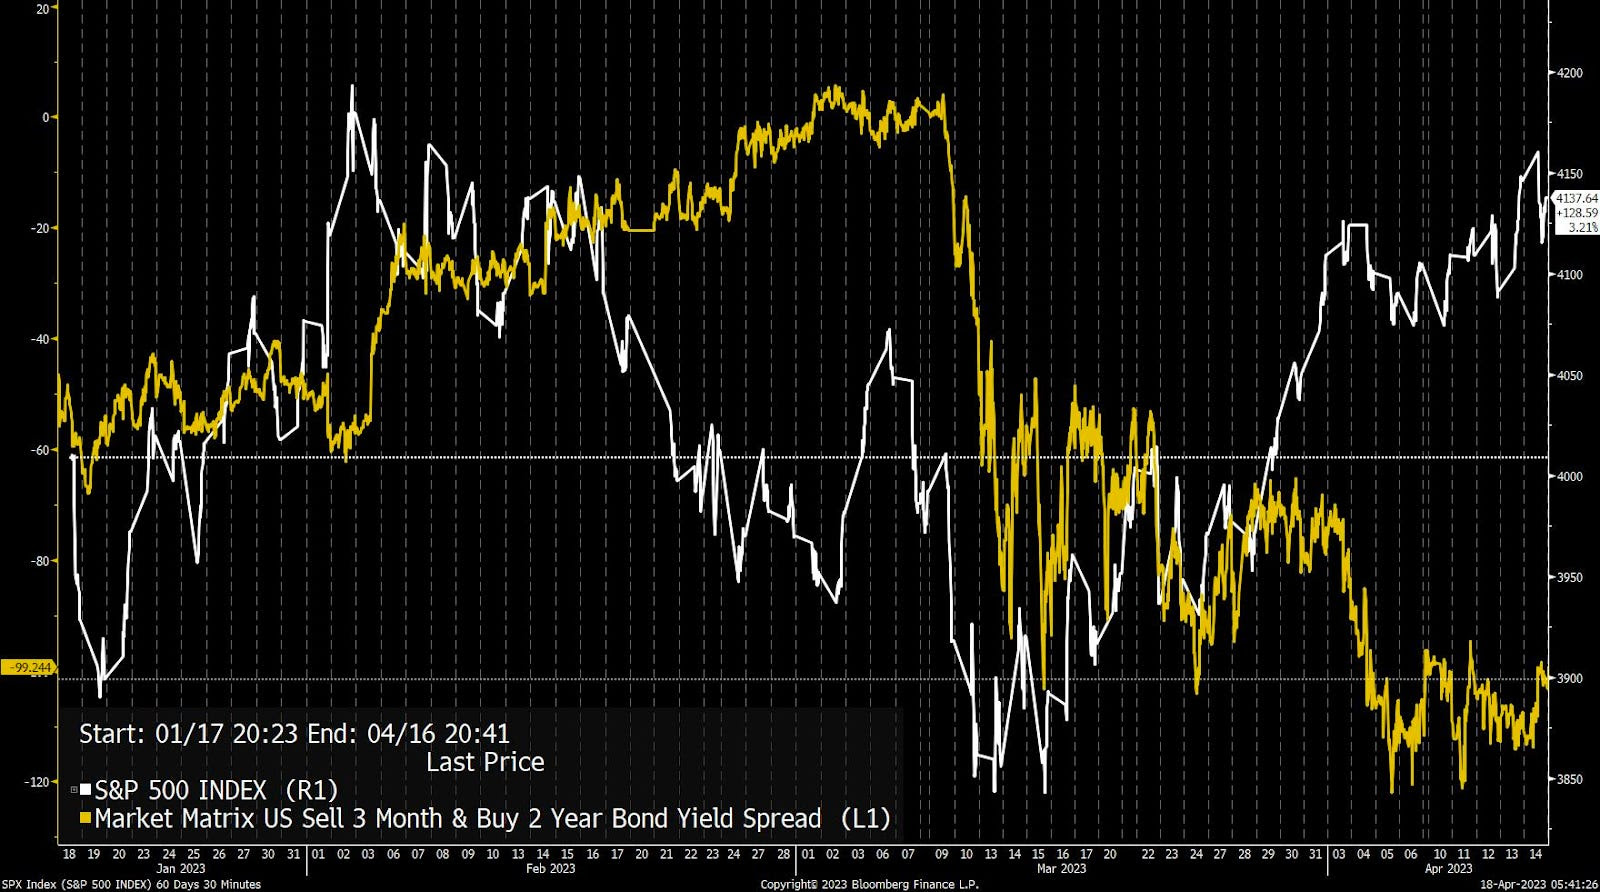
Graphic: Retrieved from Bloomberg. “The S&P 500 (white line) is well above its levels from early March, while the yield on the 3m-2y spread remains in a deep inversion, signifying meaningful expectations of cuts in the months ahead.”
About
Welcome to the Daily Brief by Physik Invest, a soon-to-launch research, consulting, trading, and asset management solutions provider. Learn about our origin story here, and consider subscribing for daily updates on the critical contexts that could lend to future market movement.
Separately, please don’t use this free letter as advice; all content is for informational purposes, and derivatives carry a substantial risk of loss. At this time, Capelj and Physik Invest, non-professional advisors, will never solicit others for capital or collect fees and disbursements. Separately, you may view this letter’s content calendar at this link.
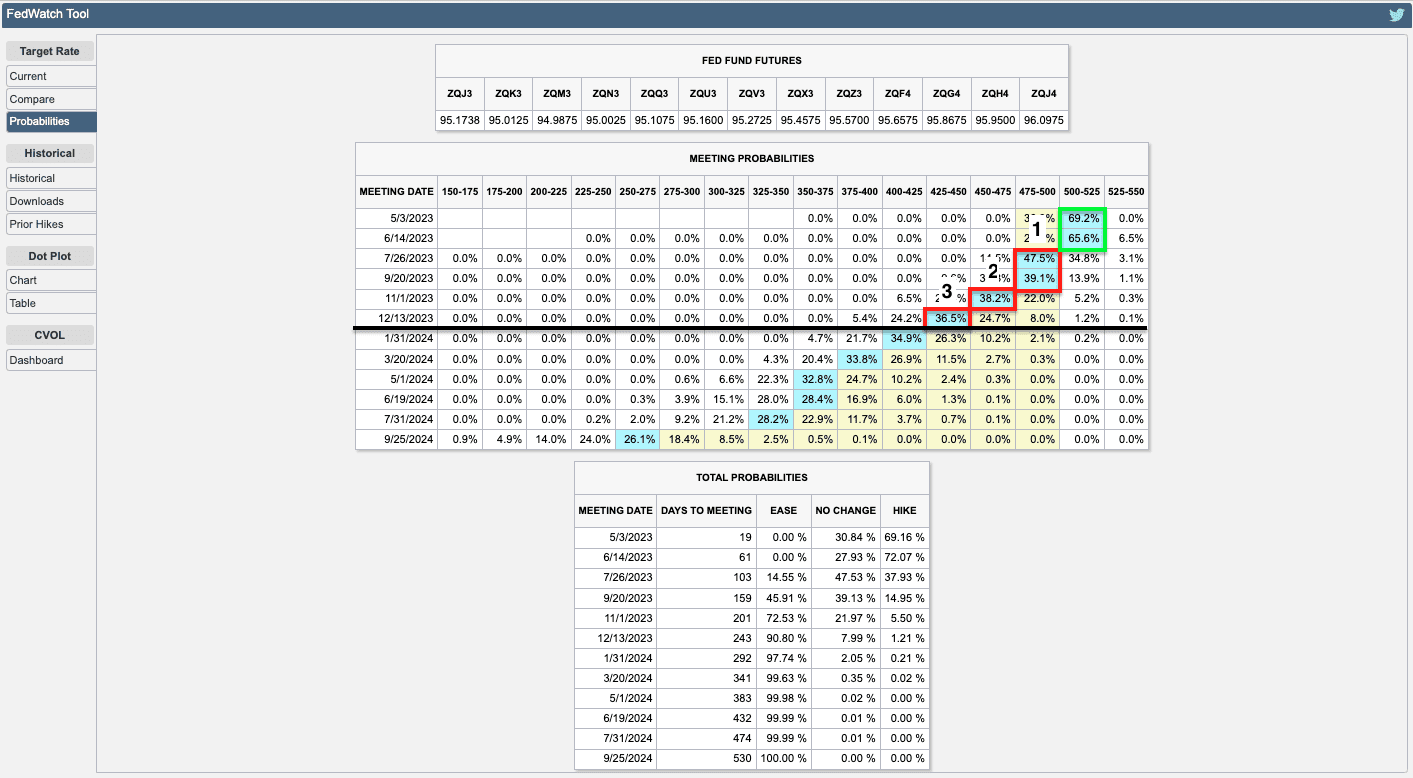
Consensus is a tightening cycle that climaxes on May3 with one final 25 basis point hike. Most traders price three cuts after—one in July, November, and December.
Note: After the release of strong bank earnings today, this analysis remains intact.
Graphic: Retrieved from CME Group Inc (NASDAQ: CME).
Though policymakers are successful in walking up traders’ interest rate expectations, the long end of the yield curve hasn’t budged much; despite the response to banking turmoil helping “calm conditions, … and lessen the near-term risks,” many believe the Fed will have to pivot, soon.
The Federal Reserve’s ranks expect a “mild recession,” too, validating people such as Bank of America Corporation’s (NYSE: BAC) Michael Hartnett, who said investors should steer clear of stocks. Hartnett added the expectations of a recession would solidify following the upcoming earnings season, a test of how companies have managed headwinds like the bank crisis and slowing demand.
Graphic: Retrieved from Bank of America Corporation (NYSE: BAC).
Despite billions in redemptions over the past week or so, the market’sstrengthcan continue for longer, though. Here’s why.
Graphic: Retrieved from Goldman Sachs Group Inc (NYSE: GS) via The Market Ear.
Contextually, positioning overwhelmingly supports the market at this juncture. That’s per the likes of Cem Karsan of Kai Volatility have explained.
Falling volatility has led to billions more in buying flows from volatility-controlled funds rebalancing their risk exposures, Tier1Alpha adds, noting “there is a chance realized volatility [or RVOL] will continue to decrease until the end of next week as long as the SPX returns stay muted. If volatility rises beyond the +/- 2% threshold, net equity sales could exceed $5 billion.”
“This is not expected due to favorable CPI data and dealer positioning,” however.
With markets likely to be contained in the short to medium term, and fundamental weaknesses, such as the Fed hiking long-end yields, likely to cause them to fail in the long run—play near- or medium-term strength via call spread structures, and use the profits to lower the cost of longer-dated bets on markets or rates falling.
In support of this view, per The Market Ear’s summary of some Goldman Sachs Group Inc (NYSE: GS) analyses, “the disconnect between Nasdaq 100 (INDEX: NDX) and bond yields has grown to statistically significant levels.” Thus, “owning downside asymmetry” is starting to look “more attractive.”
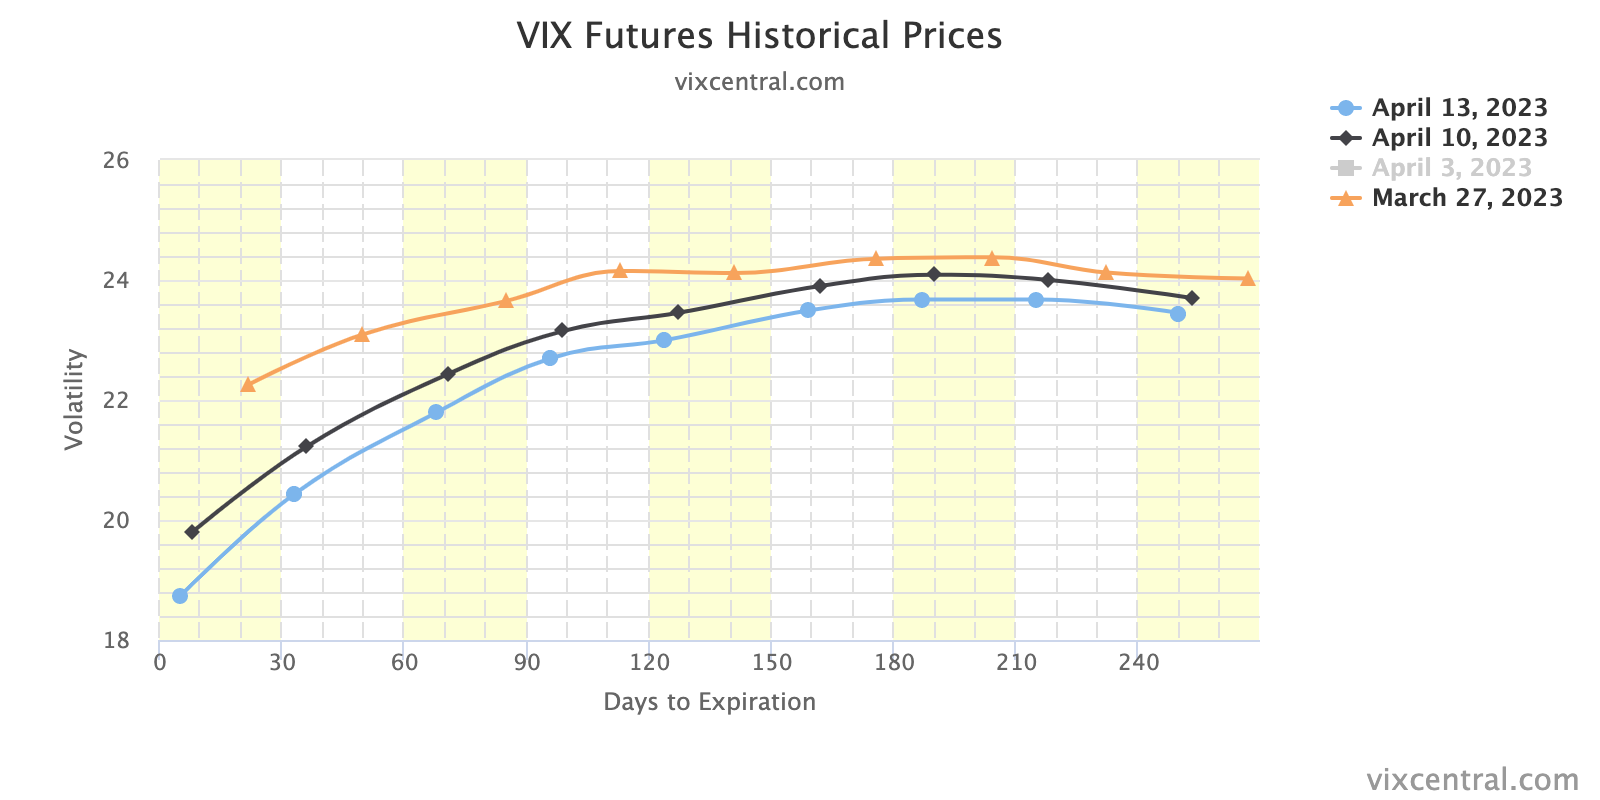
Graphic: Retrieved from VIX Central. The compression of implied volatility, or IVOL, is a booster for equities. Investors are mostly bullish with a +1 Put, +100 Stock, -1 Call position, while dealers hold the opposite with a -1 Put, -100 Stock, +1 Call position. As the volatility trends lower (e.g., S&P 500 realized volatility or RVOL is ~10), options lose value, and dealers must buy back their short stock to re-hedge. This supports the market.
About
Welcome to the Daily Brief by Physik Invest, a soon-to-launch research, consulting, trading, and asset management solutions provider. Learn about our origin story here, and consider subscribing for daily updates on the critical contexts that could lend to future market movement.
Separately, please don’t use this free letter as advice; all content is for informational purposes, and derivatives carry a substantial risk of loss. At this time, Capelj and Physik Invest, non-professional advisors, will never solicit others for capital or collect fees and disbursements. Separately, you may view this letter’s content calendar at this link.
The daily brief is a free glimpse into the prevailing fundamental and technical drivers of U.S. equity market products. Join the 300+ that read this report daily, below!
Overnight, equity indices probed higher, above Thursday’s trade, which established a new swing low. The Cboe Volatility Index (INDEX: VIX) fell while yields were bid and commodities mixed.
Today, we’ll get into some key narratives including crypto turmoil and financial conditions, as well as a validation of some of our trade theses.
Ahead is data on import prices (8:30 AM ET), University of Michigan consumer sentiment and inflation expectations (10:00 AM ET), as well as Fed-speak by Neel Kashkari (11:00 AM ET).
Take care and watch your risk.
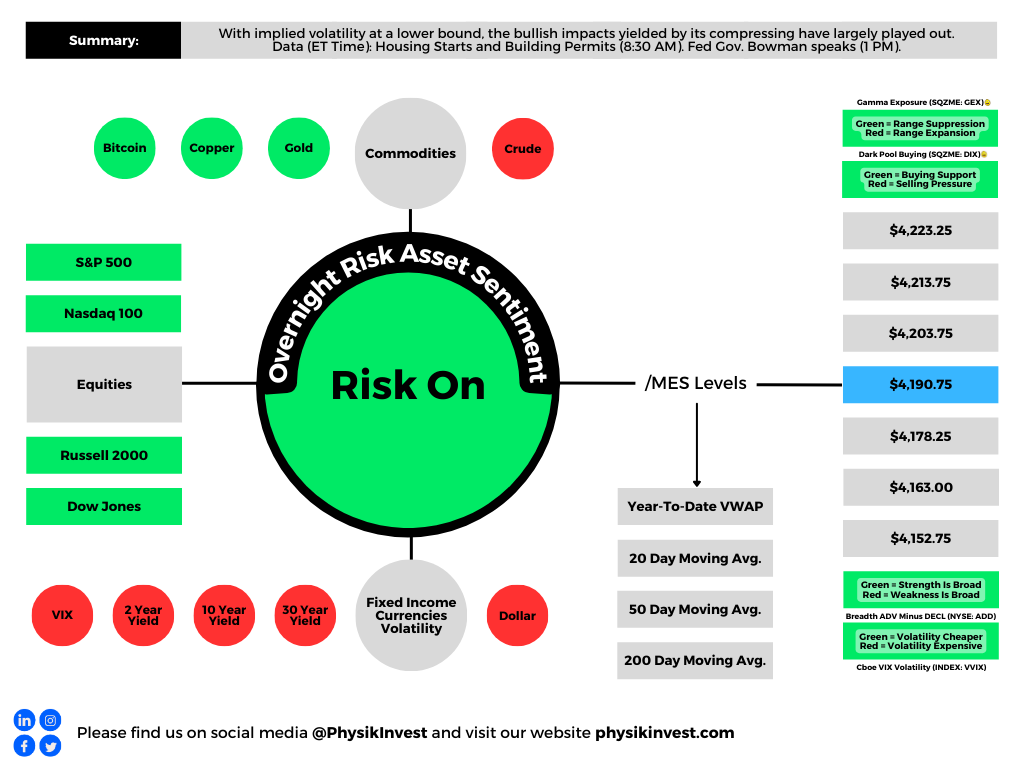
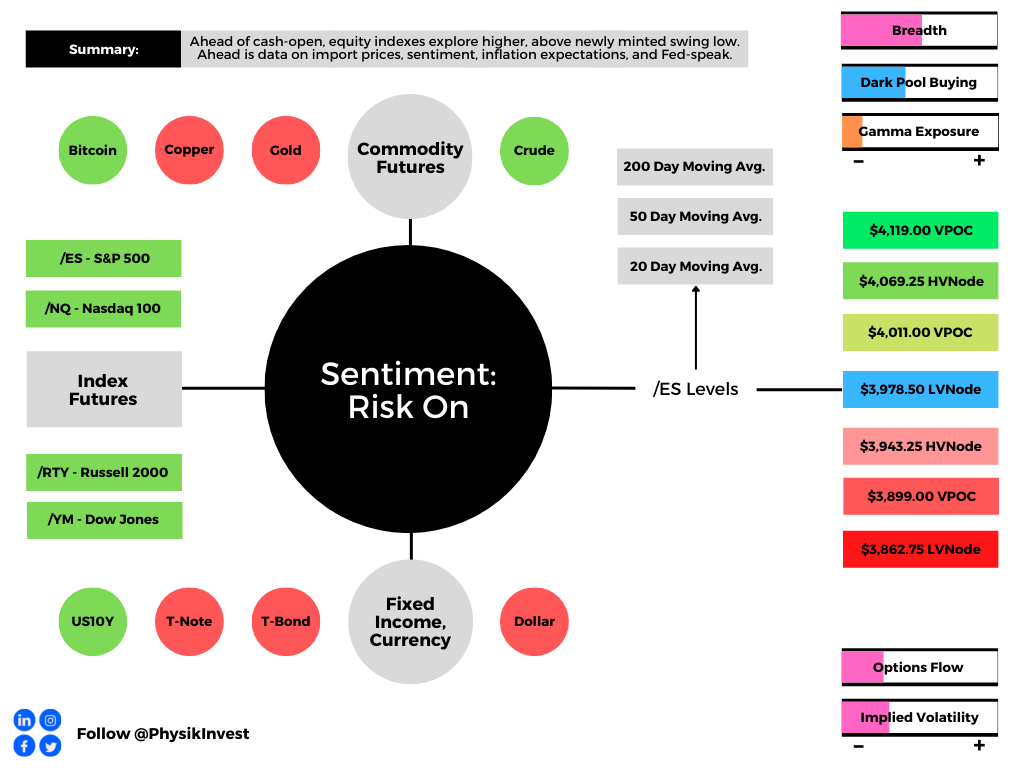
Graphic updated 6:40 AM ET. Sentiment Risk-On if expected /ES open is above the prior day’s range./ES levels are derived from the profile graphic at the bottom of the following section. Levels may have changed since initially quoted; click here for the latest levels. SqueezeMetrics Dark Pool Index (DIX) and Gamma (GEX) calculations are based on where the prior day’s reading falls with respect to the MAX and MIN of all occurrences available. A higher DIX is bullish. At the same time, the lower the GEX, the more (expected) volatility. Learn the implications of volatility, direction, and moneyness. SHIFT data used for S&P 500 (INDEX: SPX) options activity. Note that options flow is sorted by the call premium spent; if more positive, then more was spent on call options. Breadth reflects a reading of the prior day’s NYSE Advance/Decline indicator. VIX reflects a current reading of the CBOE Volatility Index (INDEX: VIX) from 0-100.
What To Expect
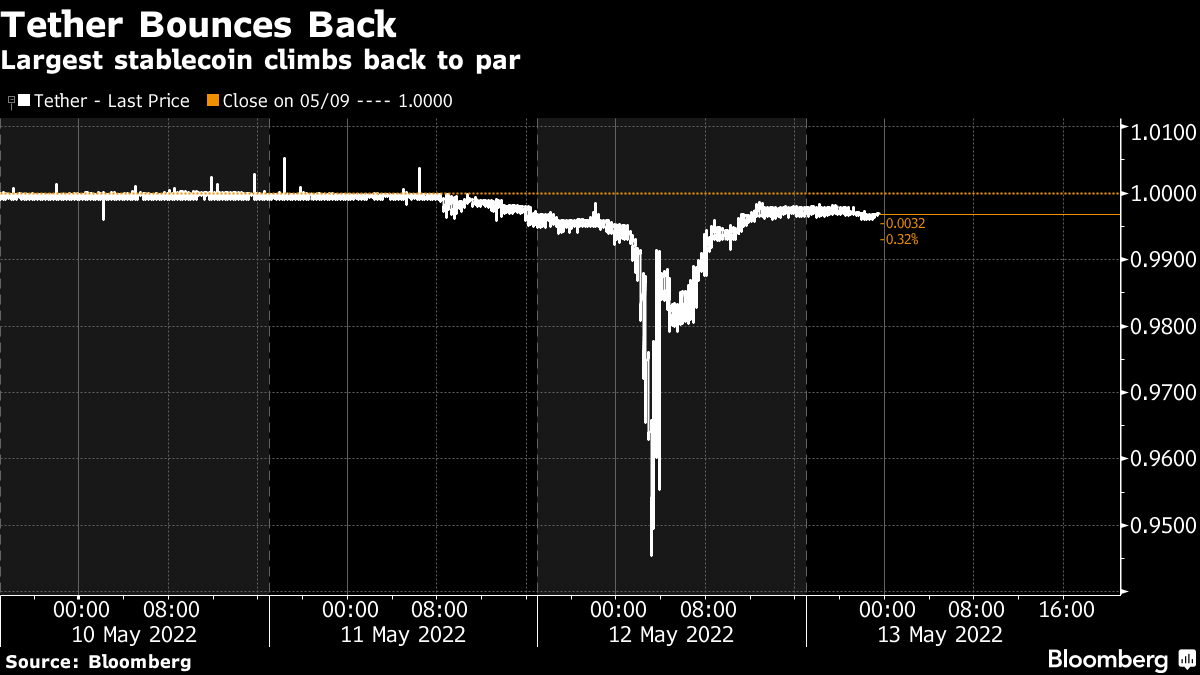
Fundamental: In the news, panic in the cryptocurrency markets eased and Tether (CRYPTO: USDT-USD), the world’s largest stablecoin, backed by commercial paper and U.S. Treasuries, climbed back to par.
JPMorgan Chase & Co’s (NYSE: JPM) Teresa Ho said there would be little impact on traditional funding markets while, according to Barclays PLC’s (NYSE: BCS) Joseph Abate, redemptions in Tether, which has a market value just shy of $90-100 billion, would only “cause meaningful strains in money markets should they exceed half of the stablecoin’s total holdings.”
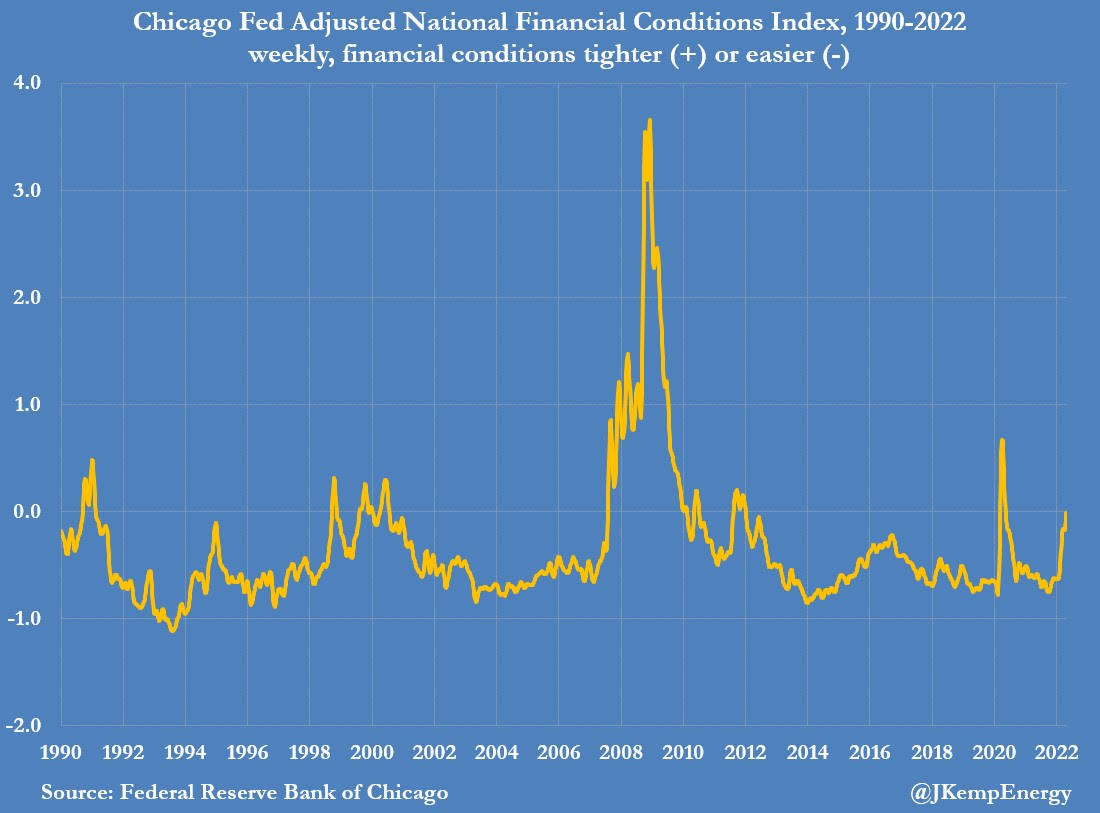
Also in the news are rising interest rates (e.g., mortgage rates up to ~5.30%) and a weak equity market (e.g., S&P 500 lower ~20%), among other things, feeding into a tightening of financial conditions (which is how monetary policy impacts the economy).
“Financial conditions for households and businesses wanting to borrow or raise capital tightened again last week and are the most restrictive since the first wave of the pandemic in 2020 and before that 2012,” Reuters’ John Kemp said.
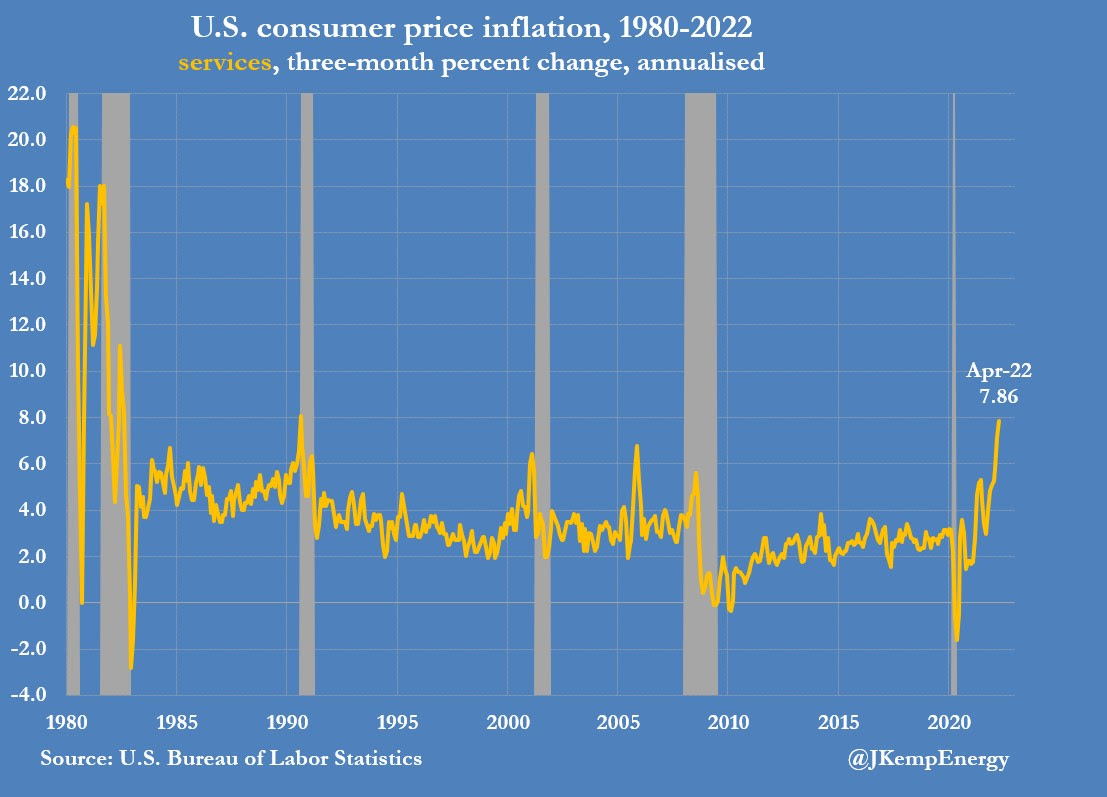
“Rapid service sector price increases usually signal the imminent arrival of a recession,” Kemp said, pointing to decisions by some public companies like Uber Inc (NYSE: UBER), Twitter Inc (NYSE: TWTR), and Amazon Inc (NASDAQ: AMZN) to slow growth and cut labor forces as a validation of slowing momentum.
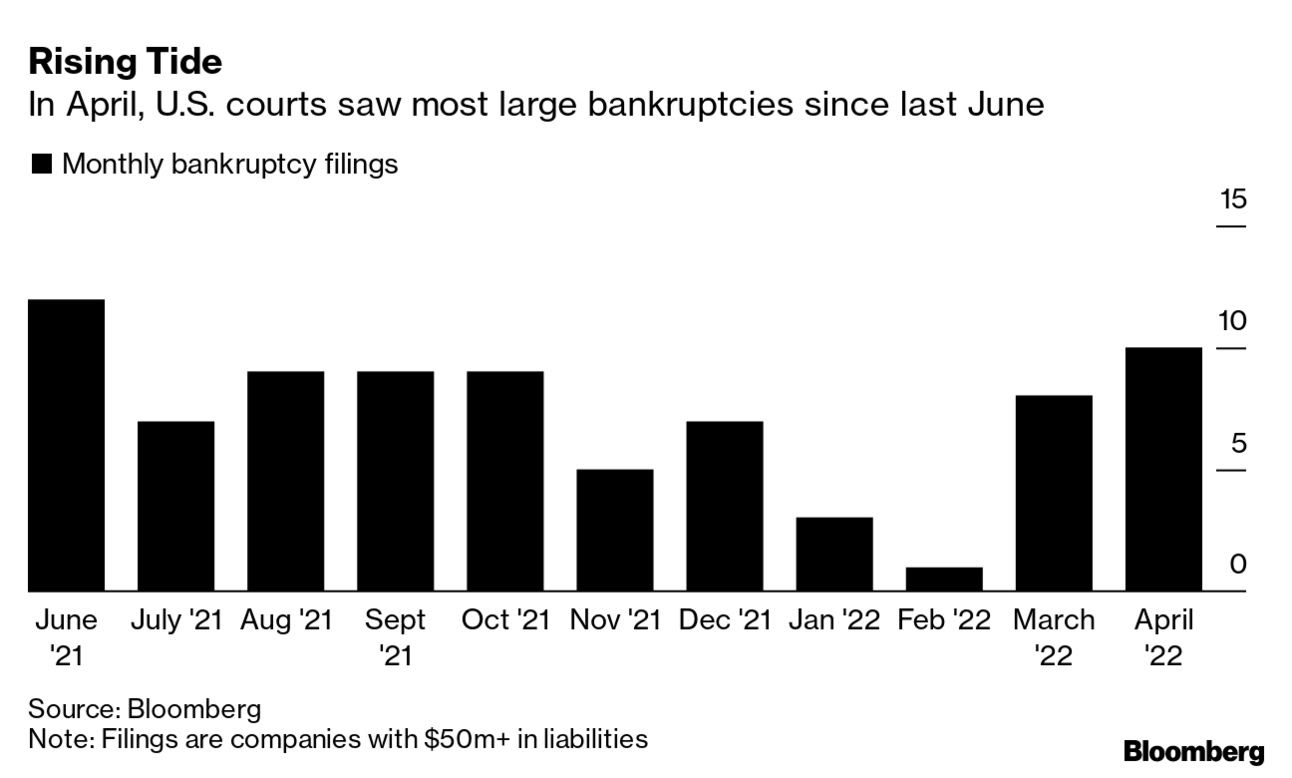
Graphic: Via Bloomberg. “I think we’re primed for a big distressed supply surge,” said Phil Brendel, a distressed debt analyst for Bloomberg Intelligence. “Everyone gets comfortable and complacent on credit and then when it turns, you tend to see these massive spikes.”
The accelerated selling of equities (~$6.2 billion), bonds (~11.4 billion), cash (~$19.7 billion), and some commodities (~$1.8 billion in gold), over the last week, per Bank of America Corporation’s (NYSE: BAC) Michael Hartnett is capitulation.
“The definition of true capitulation is investors selling what they love,” Hartnett said, gauging the prospects that stocks have hit a near-term bottom. “Fear and loathing suggest stocks are prone to an imminent bear market rally, but we do not think ultimate lows have been reached.”
Positioning: In past commentaries, we talked about ways to play a returns distribution that is skewed to the upside (albeit, with large negative outliers).
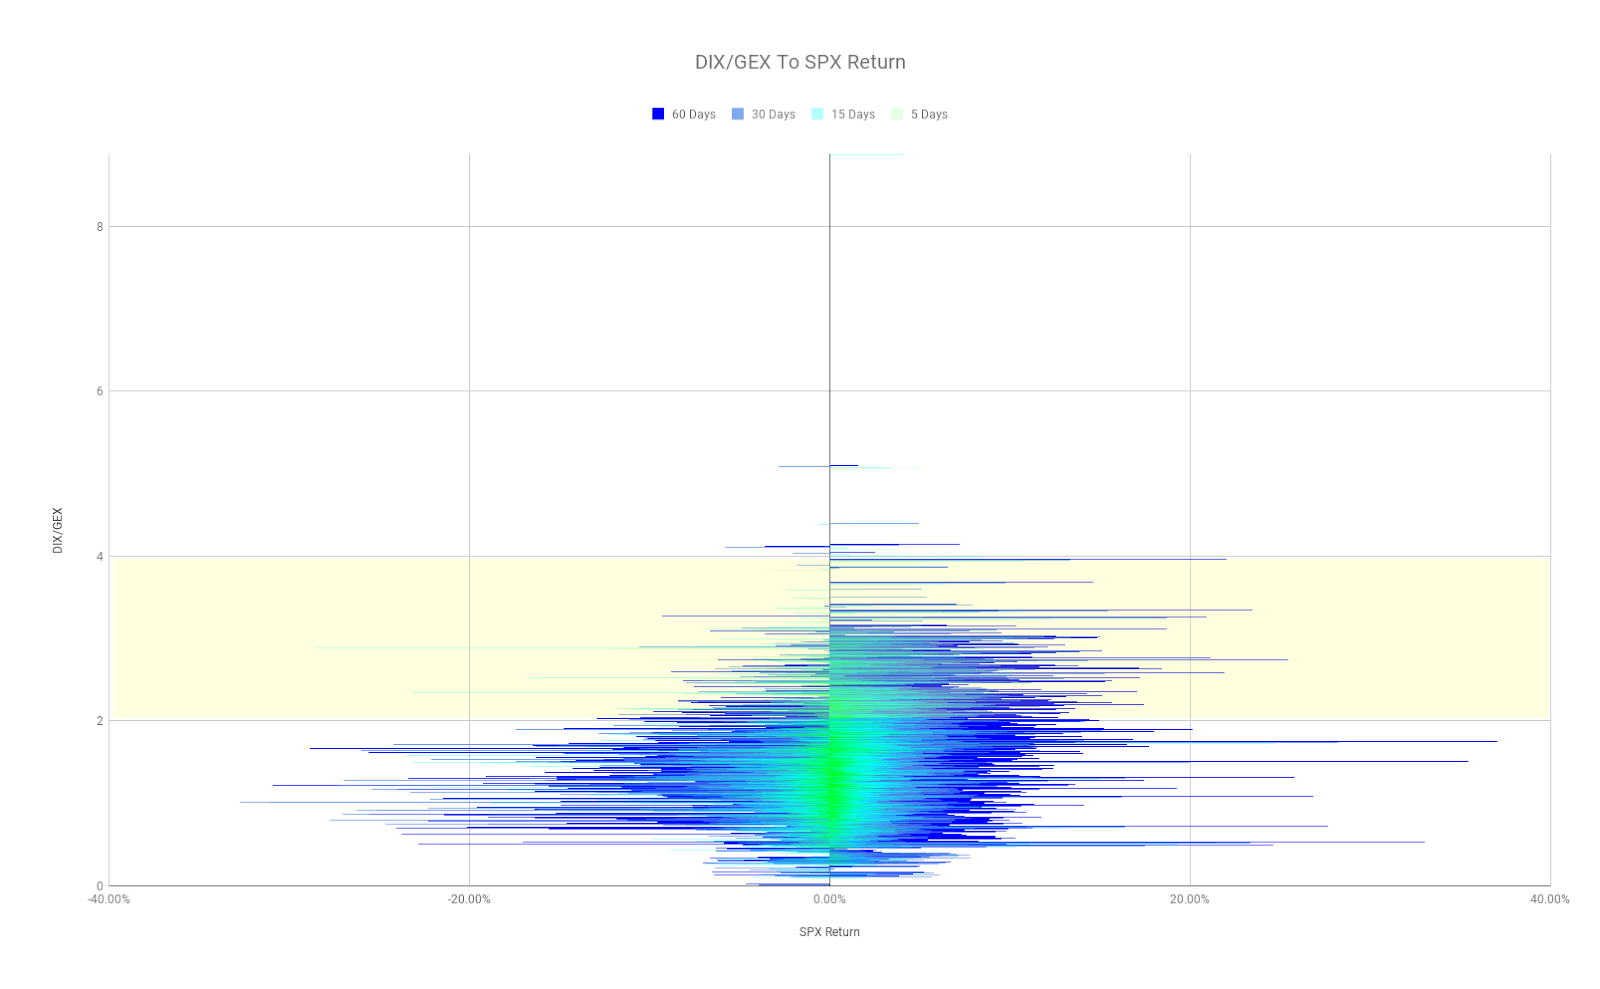
Graphic: Via Physik Invest. Data retrieved from SqueezeMetrics. A higher DIX/GEX ratio has historically been associated with S&P 500 outperformance in the subsequent month. A very low DIX/GEX ratio has historically been associated with positive S&P 500 performance in the subsequent month, though there are many more negative outliers.
The following Goldman Sachs Group Inc (NYSE: GS) remark is a validation of what we’ve discussed:
“Even though the VIX’s reaction to recent spot downside has been mild, its high starting point leaves vol high overall, and we like strategies with a short volatility bias, including put selling and 1×2 call spread overlays.”
Graphic: Via Goldman Sachs Group Inc. Taken from The Market Ear.
Mainly, zero- and low-cost bets ($0.00-$1.00 debit to open) that deliver asymmetric payouts (sometimes in excess of $10.00 credit to close) in case of violent and short-lived reversals.
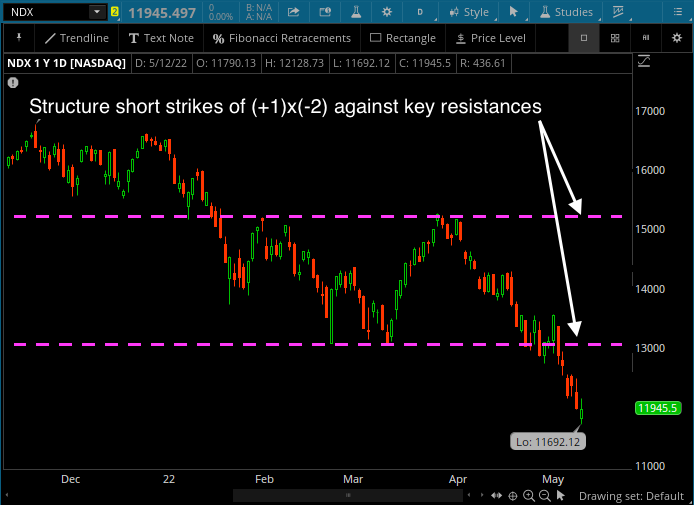
Personally, this letter’s author is structured positive delta and gamma in the Nasdaq 100 (INDEX: NDX) via ratios spread (1×2) and butterfly (1x2x1) structures.
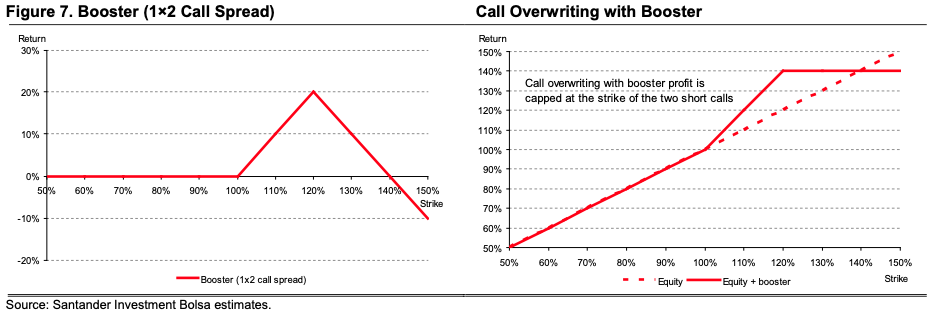
Graphic: Via Banco Santander SA (NYSE: SAN) research, the return profile, at expiry, of a classic 1×2 (long 1, short 2 further away) ratio spread.
As stated before, width and timing are everything.
Too much time or too narrow may result in asymmetric losses when the demand for upside bets further out in price and time bids the skew that you’re short, relative to the at-the-money volatility you own.
Ten to fifteen days to expiration and 500-1000 points wide, in the Nasdaq 100 (INDEX: NDX), one of the hardest hit of the indexes, work well.
An easy check is whether the spread prices for a debit or credit to close if the underlying moves to the long strike of the spread, all else equal.
Debits (which may run as low as $0.00, depending on trade location) can be offset with credits from put sales.
Graphic: Chart of the Nasdaq 100 (INDEX: NDX).
Technical: As of 6:45 AM ET, Friday’s regular session (9:30 AM – 4:00 PM ET), in the S&P 500, will likely open in the upper part of a positively skewed overnight inventory, outside of prior-range and -value, suggesting a higher potential for immediate directional opportunity.
In the best case, the S&P 500 trades higher; activity above the $3,978.50 low volume node (LVNode) puts into play the $4,011.00 untested point of control (VPOC). Initiative trade beyond the VPOC could reach as high as the $4,069.25 high volume area (HVNode) and $4,119.00 VPOC, or higher.
In the worst case, the S&P 500 trades lower; activity below the $3,978.50 LVNode puts into play the $3,943.25 HVNode. Initiative trade beyond the HVNode could reach as low as the $3,899.00 VPOC and $3,862.75 LVNode, or lower.
Click here to load today’s key levels into the web-based TradingView charting platform. Note that all levels are derived using the 65-minute timeframe. New links are produced, daily.
Graphic: 65-minute profile chart of the Micro E-mini S&P 500 Futures.
Considerations: Gap scenarios are in play.
Gaps ought to fill quickly. Should they not, that’s a signal of strength; do not fade. Leaving value behind on a gap-fill or failing to fill a gap (i.e., remaining outside of the prior session’s range) is a go-with indicator.
Auctioning and spending at least 1-hour of trade back in the prior range suggests a lack of conviction; in such a case, do not follow the direction of the most recent initiative activity.
Definitions
Volume Areas: A structurally sound market will build on areas of high volume (HVNodes). Should the market trend for long periods of time, it will lack sound structure, identified as low volume areas (LVNodes). LVNodes denote directional conviction and ought to offer support on any test.
If participants were to auction and find acceptance into areas of prior low volume (LVNodes), then future discovery ought to be volatile and quick as participants look to HVNodes for favorable entry or exit.
POCs: POCs are valuable as they denote areas where two-sided trade was most prevalent in a prior day session. Participants will respond to future tests of value as they offer favorable entry and exit.
MCPOCs: POCs are valuable as they denote areas where two-sided trade was most prevalent over numerous day sessions. Participants will respond to future tests of value as they offer favorable entry and exit.
About
After years of self-education, strategy development, mentorship, and trial-and-error, Renato Leonard Capelj began trading full-time and founded Physik Invest to detail his methods, research, and performance in the markets.
Capelj also develops insights around impactful options market dynamics at SpotGamma and is a Benzinga reporter.
In no way should the materials herein be construed as advice. Derivatives carry a substantial risk of loss. All content is for informational purposes only.
The Daily Brief is a free glimpse into the prevailing fundamental and technical drivers of U.S. equity market products. Join the 200+ that read this report daily, below!
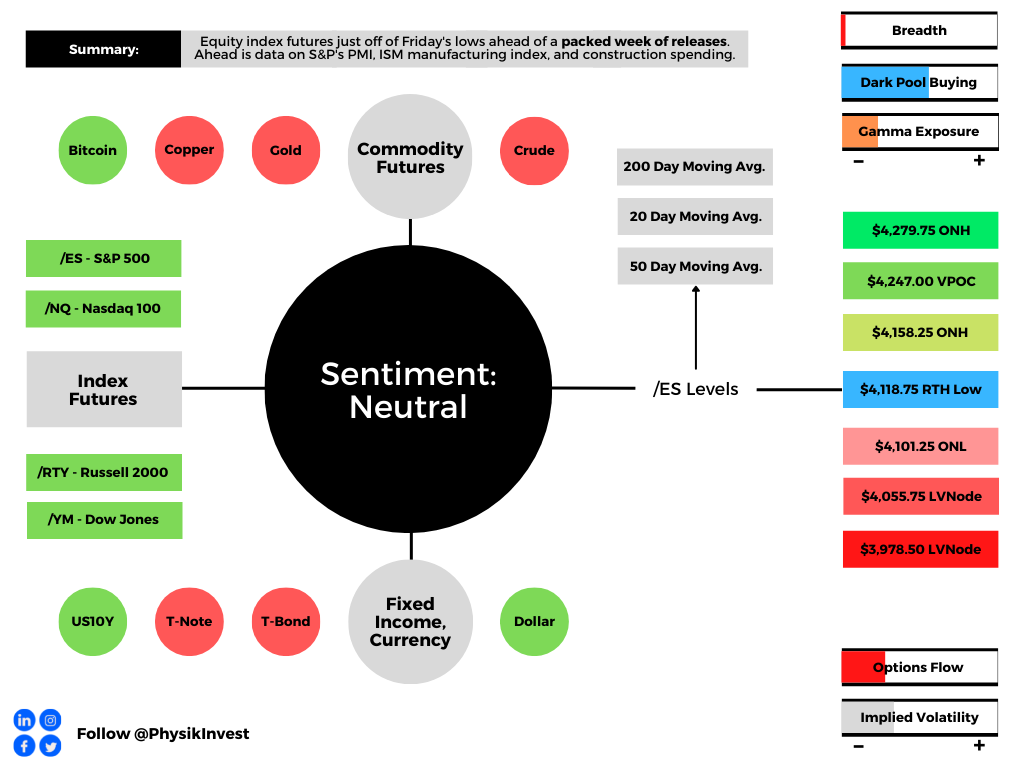
Overnight, equity index futures auctioned off of Friday’s regular trade lows. Yields, the dollar, and implied volatility metrics were bid.
There were no changes in the newsflow’s tone this weekend; investors remain concerned over the implications of monetary policy shifts and inflation, as well as war, COVID, and the supply pressures associated.
Ahead is data on S&P Global Inc’s (NYSE: SPGI) U.S. manufacturing PMI (9:45 AM ET), as well as the ISM manufacturing index and construction spending (10:00 AM ET).
Graphic updated 6:30 AM ET. Sentiment Neutral if expected /ES open is inside of the prior day’s range. /ES levels are derived from the profile graphic at the bottom of the following section. Levels may have changed since initially quoted; click here for the latest levels. SqueezeMetrics Dark Pool Index (DIX) and Gamma (GEX) calculations are based on where the prior day’s reading falls with respect to the MAX and MIN of all occurrences available. A higher DIX is bullish. At the same time, the lower the GEX, the more (expected) volatility. Learn the implications of volatility, direction, and moneyness. SHIFT data used for S&P 500 (INDEX: SPX) options activity. Note that options flow is sorted by the call premium spent; if more positive, then more was spent on call options. Breadth reflects a reading of the prior day’s NYSE Advance/Decline indicator. VIX reflects a current reading of the CBOE Volatility Index (INDEX: VIX) from 0-100.
What To Expect
Fundamental: The indexes continue to hold well in the context of severe weaknesses under the hood, so to speak, especially in the high-flying technology and growth of 2020-2021.
Stocks like Zoom Video Communications (NASDAQ: ZM) and Netflix Inc (NASDAQ: NFLX), the beneficiaries of the work-from-home trends, have de-rated substantially since the start of 2022.
In spite of earnings growth (~10% for S&P 500 companies that have reported, per Bloomberg), “the reaction to earnings surprises in April was asymmetric,” and a display of “the outsized role played by outliers.”
For context, “Mega-cap growth (MCG) & Tech earnings are missing by -6.0% at the aggregate level [while] the median company [is] beating by 5.7%.”
This is as inflation, among other factors, continues to bite into the “over-optimistic multiples driven by the assumption that pandemic-era performance could continue in perpetuity.”
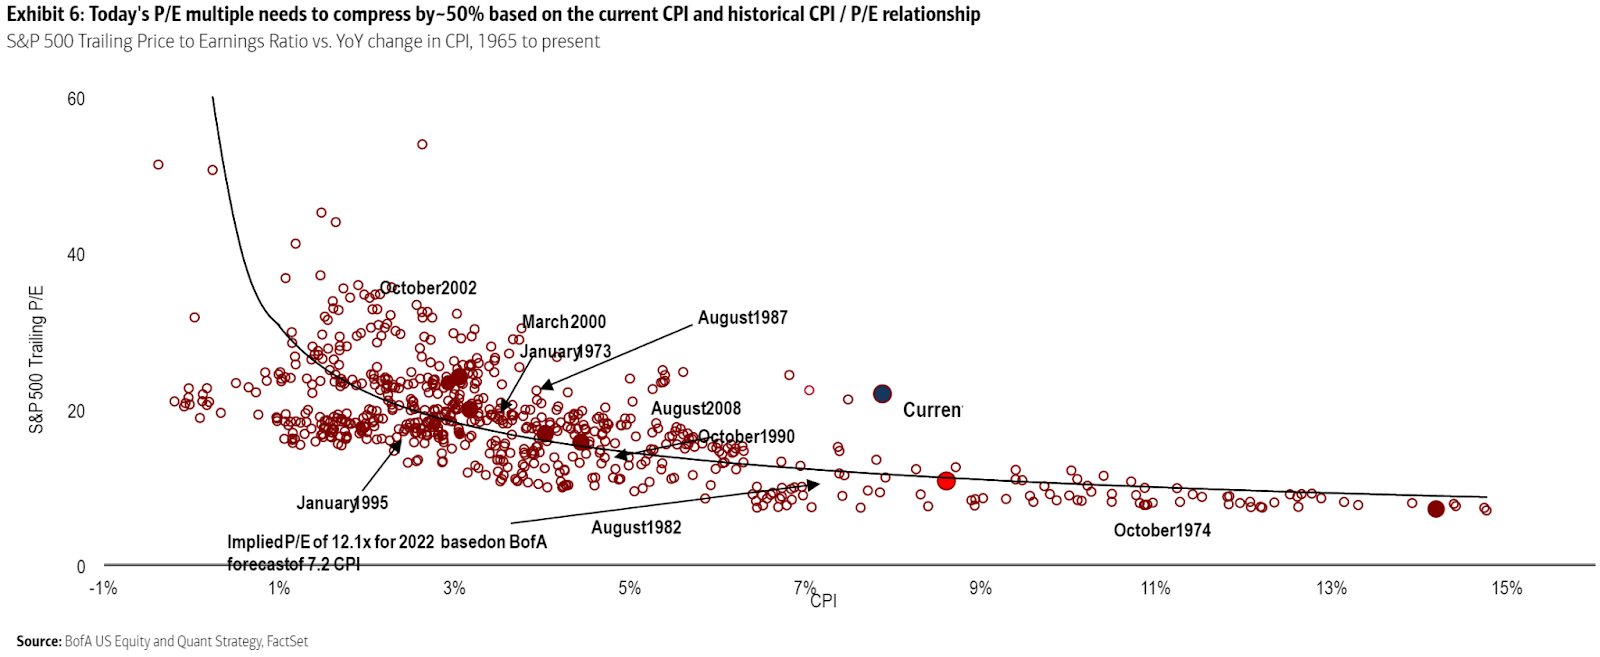
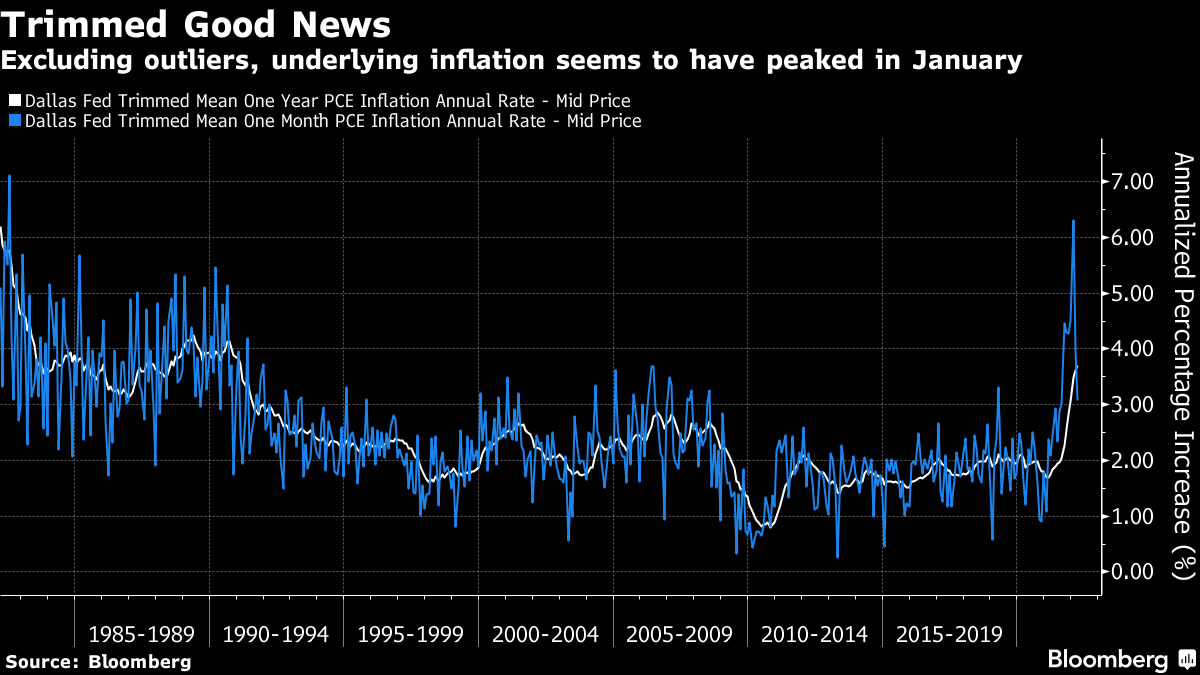
Per Bank of America Corporation (NYSE: BAC), the S&P’s current P/E is way too high, given the current CPI.
Graphic: Via Bank of America Corporation. Taken from Bloomberg. “It’s straightforward common sense that higher inflation would lead to paying a lower multiple of earnings because you expect future earnings to be eaten into by inflation. And common sense is borne out empirically; all else equal, higher inflation does indeed tend to mean lower earnings multiples.”
Notwithstanding, trimming outliers, inflation may have peaked and that is a positive for those equity investors who think “inflation is high, but they’re confident that it’s transitory,” therefore current valuations are just.
Per @ConvexityMaven, recession chatter is unwarranted. The economy is expanding and the only worry investors should have is “if the Fed cannot chill nominal GDP.”
That means “rates are going north” and, according to Bank of America Corporation’s Michael Hartnett, “asset prices must reset lower.”
Some investors, like the Japanese, have heeded this message and are offloading billions in Treasuries in anticipation of more attractive levels and “stabilization in long-dated yields.”
Perspectives: Some, including Credit Suisse Group AG’s (NYSE: CS) Zoltan Pozsar, believe market participants are in for a world of [much more] hurt as “central banks can only deal with nominal, not real chokepoints.”
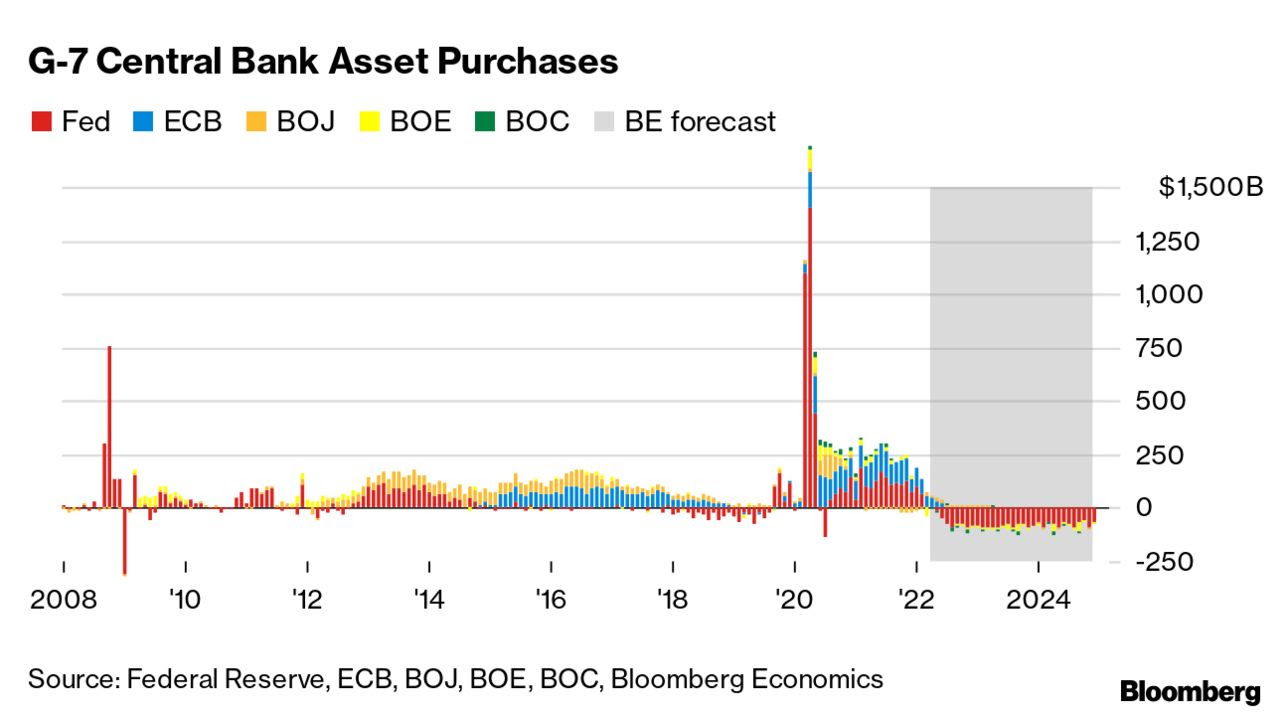
“Banks’ stock buybacks are lowering SLRs as we speak, and the Fed is about to embark on QT, and these nominal balance sheet and liquidity trends, will at some point clash with the realities of a garden variety of supply chain issues,” as a result of geopolitical chokepoints.
Graphic: Per Bloomberg, “[E]very $1 trillion of QT will equate to a decline of roughly 10% in stocks over the next 12 months or so.”
Given Pozsar’s findings, “The Fed will do QE again by summer 2023.”
Positioning: Recall that the indexes are trading relatively strong, in comparison to constituents, especially those that are smaller technology and growth companies.
Essentially, “we’re two-thirds of the way through a dot-com type collapse,” explains Simplify Asset Management’s Mike Green.
“It’s just happened underneath the surface of the indices which is [that] … dynamic of passive flows supporting the largest stocks within the index, whereas the smaller stocks can be influenced to a greater extent by the behavior of discretionary managers.”
This liquidity supply, apart from passive flows, stems from index-level hedging pressures, also.
Here’s why, as borrowed from our April 27, 2022 commentary.
Participants are well-hedged and use weakness as an opportunity to buy into a less highly valued broader market.
Well-hedged means that customers (i.e., you and I) own protection against long equity exposure. So, that could mean customers own puts and/or are short calls. One of the most dominant flows is the long put, short call.
Such trade offers customers positive, yet asymmetric (gamma), exposure to direction (delta). In other words, negative delta and positive gamma.
The counterparty has exposure to positive delta and negative gamma. If the underlyings trade lower and volatility rises, all else equal, the position will lose. To hedge against these losses, the counterparties will sell underlying into weakness.
If prices reverse and move higher, these counterparties will re-hedge and buy underlying.
Normally, as seen over the bull run of 2020 and 2021, markets are in an uptrend and there’s a strong supply of volatility. Often, customers sell more calls than puts and, in an uptrend, those calls solicit more active hedging than the put options.
Recall that the customer is short the call. That means the counterparty is long the call (a positive delta and gamma trade) and will make money if prices rise, all else equal.
The hedging of this particular exposure (i.e., sell strength, buy weakness), in an uptrend, occurs slower (i.e., counterparts will allow their profits to run), and that’s what can help the market sustain lower volatility trends for longer periods.
When prices reverse and underlyings trade lower, put options solicit increased hedging activity. Given the nature of counterparty exposure to those puts, that hedging happens quickly and can take from market liquidity as to volatility (i.e., buy strength, sell weakness).
Graphic: Via SqueezeMetrics. Equity move lower solicits increased hedging activity of put options. Counterparties have negative gamma exposure to these puts. Therefore, to hedge, they buy strength and sell weakness, adding to realized volatility. This trend is ongoing.
So, what now?
Participants are most concerned (and hedging against) unforeseen monetary policy action and economic chokepoints like a potential Russian default.
Investors will get clarity on some of these issues in the coming sessions.
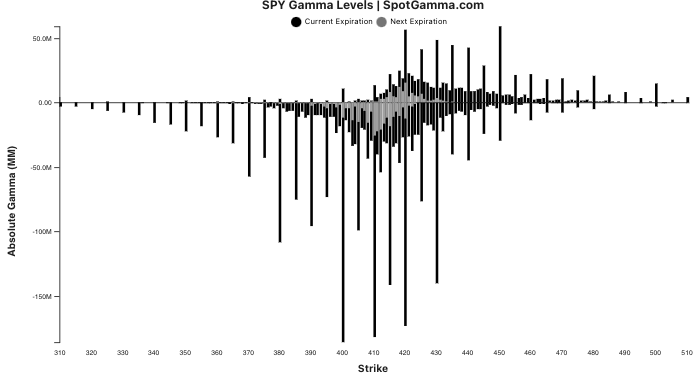
Graphic: Via SpotGamma, the estimated gamma for calls by strike as a positive number and puts as a negative number on the S&P 500 ETF, the SPY. Notice the weight on the put side.
Barring a worst-case scenario, if markets do not perform to the downside (i.e., do not trade lower), those highly-priced (often very short-dated) bets on direction will quickly decay, and hedging flows with respect to time and volatility may bolster sharp rallies.
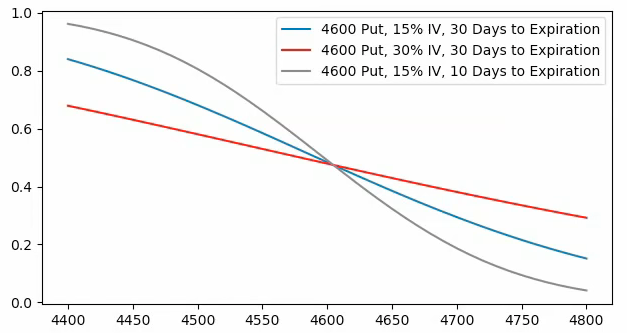
Graphic: Via SpotGamma. “SPX prices X-axis. Option delta Y-axis. When the factors of implied volatility and time change, hedging ratios change. For instance, if SPX is at $4,700.00 and IV jumps 15% (all else equal), the dealer may sell an additional 0.2 deltas to hedge their exposure to the addition of a positive 0.2 delta. The graphic is for illustrational purposes, only.”
Whether those price rises kick off a sustained reversal depends on what the fundamental situation is, then.
Presently, the largest index constituents are starting to succumb to worsening fundamentals and that will, ultimately, feed into the indexes which are pinned due to passive and hedging flows.
In other words, fundamentals will trump this talk of positioning (i.e., it is only in the short-term does this positioning we’ve talked about have greater implications).
Consideration: The returns distribution, based on implied volatility metrics alone, is skewed positive (though there are some large negative outliers pursuant to The Ambrus Group’s Kris Sidial recent explanation that despite negative sentiment, “nobody is truly scared” and “Fixed strike vols continue to underperform, along with the lack of concern in the VX term structure”).
Caution.
Graphic: Via SpotGamma, “Put vs Call gamma suggests stretched positioning.”
Technical: As of 6:30 AM ET, Monday’s regular session (9:30 AM – 4:00 PM ET), in the S&P 500, will likely open in the middle part of a balanced overnight inventory, inside of prior-range and -value, suggesting a limited potential for immediate directional opportunity.
In the best case, the S&P 500 trades higher; activity above the $4,118.75 regular trade low (RTH Low) puts in play the $4,158.25 overnight high (ONH). Initiative trade beyond the ONH could reach as high as the $4,247.00 untested point of control (VPOC) and $4,279.75 ONH, or higher.
In the worst case, the S&P 500 trades lower; activity below the $4,118.75 RTH Low puts in play the $4,101.25 overnight low (ONL). Initiative trade beyond the ONL could reach as low as the $4,055.75 low volume area (LVNode) and $3,978.50 low volume area (LVNode), or lower.
Click here to load today’s key levels into the web-based TradingView charting platform. Note that all levels are derived using the 65-minute timeframe. New links are produced, daily.
Graphic: 65-minute profile chart of the Micro E-mini S&P 500 Futures.
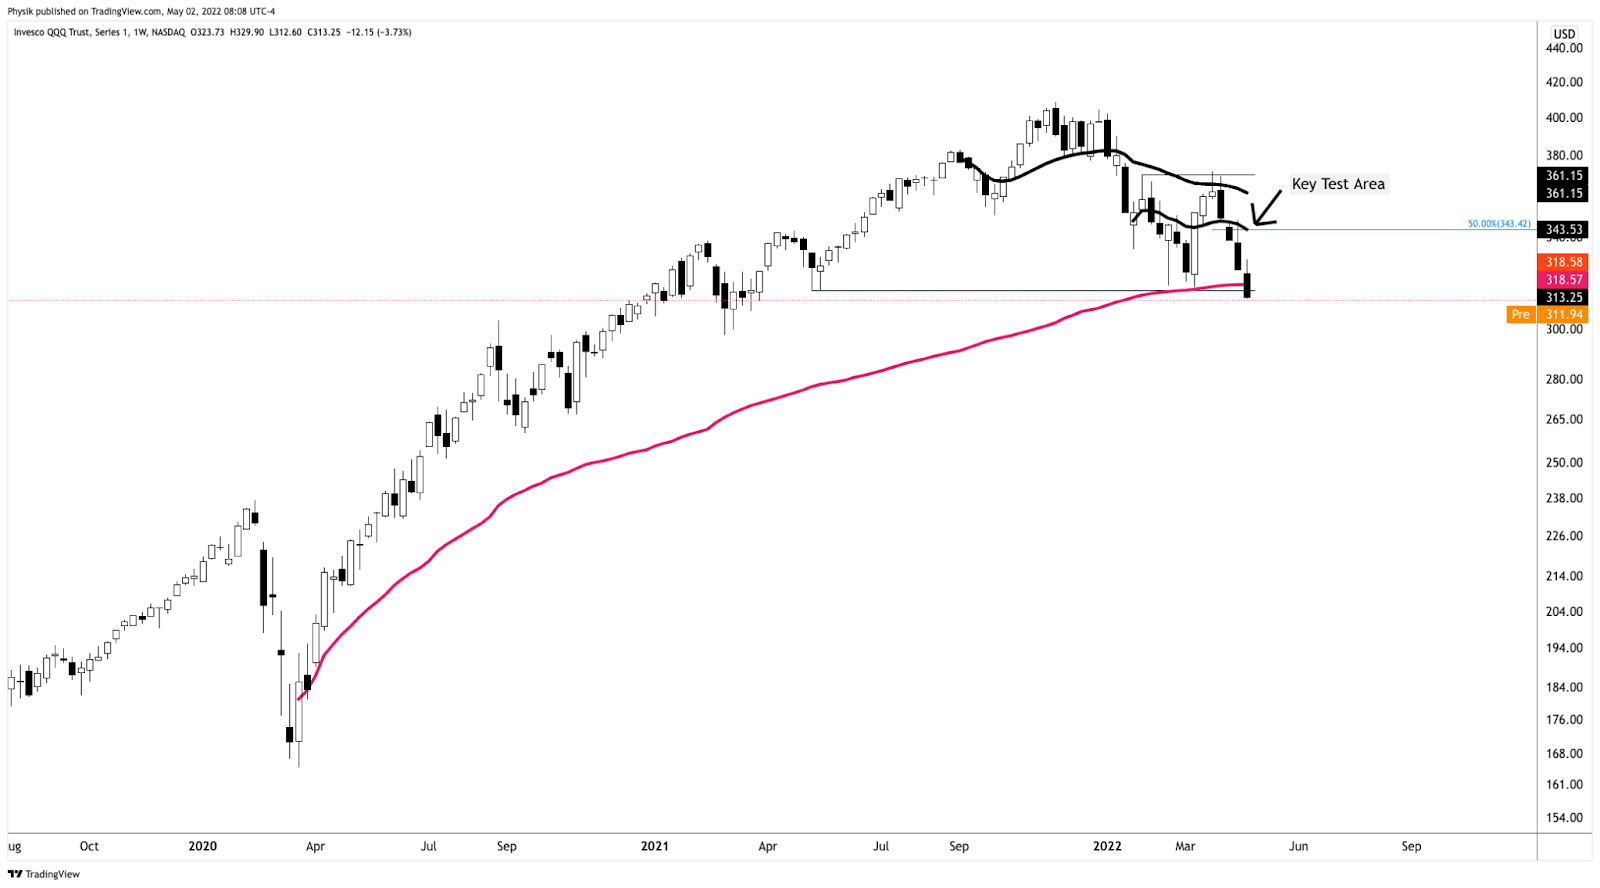
Considerations: Terribly weak price action, last week, with the S&P 500, Nasdaq 100, and Russell 2000 all flirting with early 2022 lows.
The weaker of the bunch – the Invesco QQQ Trust Series 1 (NASDAQ: QQQ) – just broke a major VWAP anchored from the lows of March 2020.
That indicator denotes the level at which the average buyer/seller is in.
In other words, it is the fairest price to pay for Nasdaq 100 exposure (since March 2020) and, instead of being construed as a so-called demand zone, the level ought to be looked at as overhead supply on tests, higher. Caution.
Graphic: Invesco QQQ Trust Series 1 (NASDAQ: QQQ) with anchored VWAPs.
Definitions
Overnight Rally Highs (Lows): Typically, there is a low historical probability associated with overnight rally-highs (lows) ending the upside (downside) discovery process.
Volume Areas: A structurally sound market will build on areas of high volume (HVNodes). Should the market trend for long periods of time, it will lack sound structure, identified as low volume areas (LVNodes). LVNodes denote directional conviction and ought to offer support on any test.
If participants were to auction and find acceptance into areas of prior low volume (LVNodes), then future discovery ought to be volatile and quick as participants look to HVNodes for favorable entry or exit.
POCs: POCs are valuable as they denote areas where two-sided trade was most prevalent in a prior day session. Participants will respond to future tests of value as they offer favorable entry and exit.
Volume-Weighted Average Prices (VWAPs): A metric highly regarded by chief investment officers, among other participants, for quality of trade. Additionally, liquidity algorithms are benchmarked and programmed to buy and sell around VWAPs.
About
After years of self-education, strategy development, mentorship, and trial-and-error, Renato Leonard Capelj began trading full-time and founded Physik Invest to detail his methods, research, and performance in the markets.
Capelj also develops insights around impactful options market dynamics at SpotGamma and is a Benzinga reporter.
In no way should the materials herein be construed as advice. Derivatives carry a substantial risk of loss. All content is for informational purposes only.
Equity index futures trade sideways to lower staying within the prior day’s range.
China has deemed crypto illegal.
Equity market enduring outflows.
Positioning risks are back in line.
What Happened: U.S. stock index futures auctioned sideways to lower overnight after a series of outlier moves; despite global equity funds seeing their first outflows in 2021, positioning risks, among other things, cooled.
In other news, China deemed all crypto-related transactions illegal and holders of China Evergrande Group’s dollar bonds haven’t received a coupon payment due Thursday.
Ahead is Fed-speak by Loretta Mester (8:45 AM ET), alongside data on new home sales (10:00 AM ET), and other Fed-speak by Jerome Powell and Esther George (10:00 AM ET).
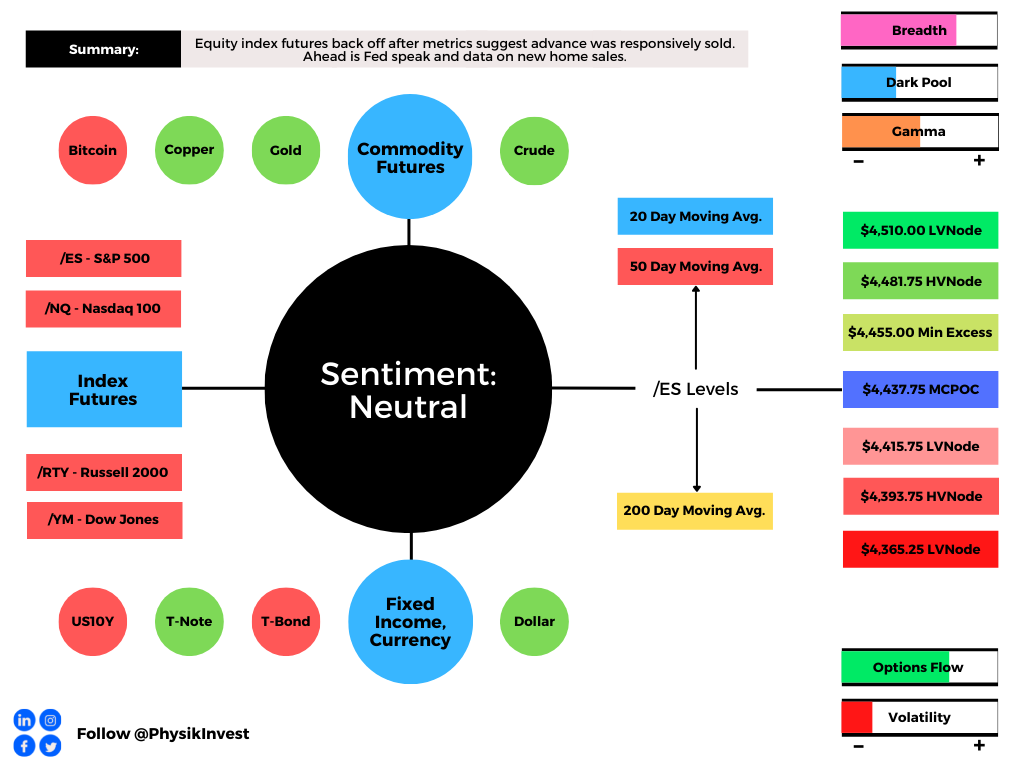
Graphic updated 6:30 AM ET. Sentiment Neutral if expected /ES open is inside of the prior day’s range. /ES levels are derived from the profile graphic at the bottom of the following section. SqueezeMetrics Dark Pool Index (DIX) and Gamma (GEX) calculations are based on where the prior day’s reading falls with respect to the MAX and MIN of all occurrences available. A higher DIX is bullish. At the same time, the lower the GEX, the more (expected) volatility. SHIFT data used for S&P 500 (INDEX: SPX) options activity. Note that options flow is sorted by the call premium spent; if more positive then more was spent on call options. Breadth reflects a reading of the prior day’s NYSE Advance/Decline indicator. VIX reflects a current reading of the CBOE Volatility Index (INDEX: VIX) from 0-100.
What To Expect: As of 6:30 AM ET, Friday’s regular session (9:30 AM – 4:00 PM EST) in the S&P 500 will likely open inside of prior-range and -value, suggesting a limited potential for immediate directional opportunity.
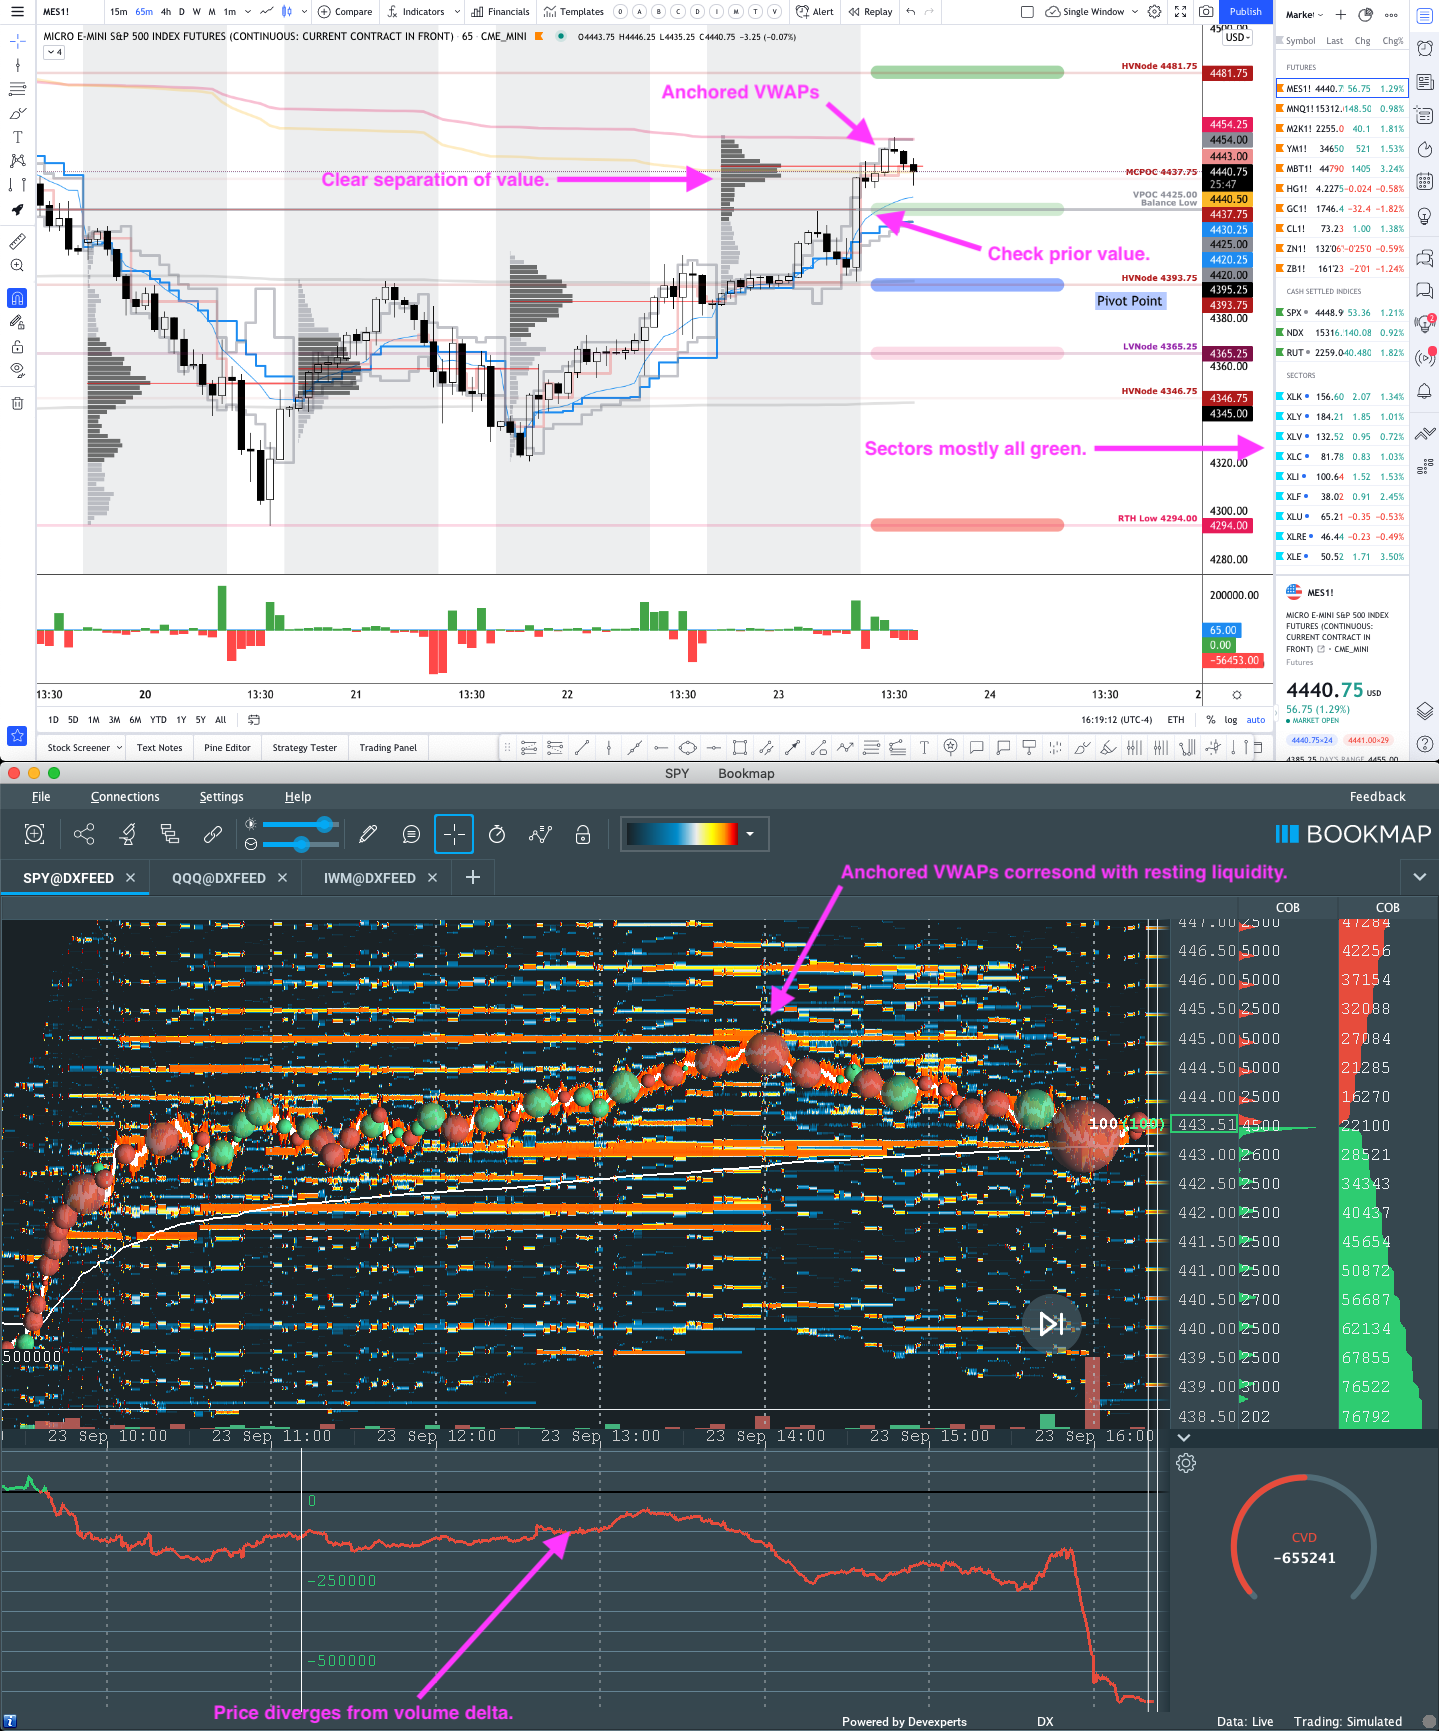
Adding, during the prior day’s regular trade, on positive but lighter intraday breadth and divergent market liquidity metrics, the best case outcome occurred, evidenced by initiative buying that ceased at $4,455.00.
This trade is significant because it resolved the $4,425.00 untested point of control (VPOC), an area of unfinished business so to speak.
In the process of resolve, the S&P 500 – as evidenced by emotional, multiple distribution profile structures – established a minimal excess rally high at $4,455.00 before the momentum from covering shorts was overpowered by responsive selling at key areas of resting liquidity, at and around $4,455.00, or so.
Graphic: Divergent delta (i.e., non-committed buying as measured by volume delta or buying and selling power as calculated by the difference in volume traded at the bid and offer) in SPDR S&P 500 ETF Trust (NYSE: SPY), one of the largest ETFs that track the S&P 500 index, via Bookmap. The readings are supportive of responsive trade or balance (i.e., rotational trade that suggests current prices offer favorable entry and exit).
Further, the aforementioned trade is happening in the context of global equity fund outflows, a theme in line with a recent fraying in the buy-the-dip psychology.
The implications of this theme on price are contradictory; to elaborate, according to Reuters, “With outflows of $24.2 billion, global stock funds lost the most since March 2020 as investors moved in [favor] of cash where they [plowed] in $39.6 billion of funds, Bank of America Corporation (NYSE: BAC) said, citing EPFR data. Bond funds saw inflows of $10 billion.”
Bank of America’s Michael Hartnett commented: “Pessimism over passage of the $1 billion bipartisan infrastructure bill and $3.5 trillion build back better Reconciliation caused the second-biggest outflow ever from infrastructure funds and largest from consumer funds on a year-to-date basis.”
Nevertheless, Goldman Sachs Group Inc’s (NYSE: GS) Peter Oppenheimer, alongside HSBC Holdings Plc (NYSE: HSBC) strategists, believes dip-buying is a go as “we’re still in the relatively early stages of this economic cycle.”
We saw some large participant(s) take advantage of the recent dip; there was a “flurry of [bullish] trades with the SPDR S&P 500 ETF Trust (NYSE: SPY) … involved call spreads maturing in each of the next three months. The total cost was about $50 million.”
There were large $SPY call spreads ($50mm notional) which fired off pre-FOMC yesterday AM.
This view from shows those ~10:40Am ET trades from a delta perspective. You can see just how large they were relative to the rest of day thru a hedging lens.https://t.co/m1fCzF93qxpic.twitter.com/nfgwv72AaF
Moreover, for today, given expectations of lower volatility, participants may make use of the following frameworks.
In the best case, the S&P 500 trades sideways or higher; activity above the $4,437.75 micro composite point of control (MCPOC) puts in play the $4,455.00 minimal excess high. Initiative trade beyond the minimal excess high could reach as high as the $4,481.75 high volume area (HVNode) and $4,510.00 low volume area (LVNode), or higher.
In the worst case, the S&P 500 trades lower; activity below the $4,437.75 MCPOC puts in play the $4,415.75 LVNode. Initiative trade beyond the $4,415.75 LVNode could reach as low as the $4,393.75 HVNode and $4,365.25 LVNode, or lower.
Graphic: 65-minute profile chart of the Micro E-mini S&P 500 Futures updated 6:30 AM ET.
Definitions
Volume Areas: A structurally sound market will build on areas of high volume (HVNodes). Should the market trend for long periods of time, it will lack sound structure, identified as low volume areas (LVNodes). LVNodes denote directional conviction and ought to offer support on any test.
If participants were to auction and find acceptance into areas of prior low volume (LVNodes), then future discovery ought to be volatile and quick as participants look to HVNodes for favorable entry or exit.
POCs: POCs are valuable as they denote areas where two-sided trade was most prevalent in a prior day session. Participants will respond to future tests of value as they offer favorable entry and exit.
MCPOCs: POCs are valuable as they denote areas where two-sided trade was most prevalent over numerous day sessions. Participants will respond to future tests of value as they offer favorable entry and exit.
Excess: A proper end to price discovery; the market travels too far while advertising prices. Responsive, other-timeframe (OTF) participants aggressively enter the market, leaving tails or gaps which denote unfair prices.
News And Analysis
Global equity funds see their first outflows in 2021.
Trader spent $50M on options betting on SPX rally.
China: I’m forever blowing bubbles. How bad is it?
What People Are Saying
As we press against upside 2 sigma threshold (4442.75) in #ES_F worth noting that over the past yr we have only closed above this level 3 times ~1% occurrence. And distro of returns has been fairly normal, particularly upside. Argument to lighten intraday longs, NOT to fade. $SPYpic.twitter.com/iSgeq92Mtb
Remind: RTH session for US indices is now defined as 9:30 AM to 4 PM Eastern US time. Reasons: 1) The CME changed official settlement time to the close of cash + 2) Last 15 min pit bracket is no longer relevant. Pits are not relevant/closing soon. #ES_F#NQ_F#futures#trading
{Without typos} No surprise that $VIX has flopped today. But $VIX futures being a little sticky. Spread of Oct to spot is wider than usual with 18 DTE. Could have further to fall if $SPX continues higher. pic.twitter.com/cLbzLgXfsf
After years of self-education, strategy development, and trial-and-error, Renato Leonard Capelj began trading full-time and founded Physik Invest to detail his methods, research, and performance in the markets.
Additionally, Capelj is a finance and technology reporter. Some of his biggest works include interviews with leaders such as John Chambers, founder and CEO, JC2 Ventures, Kevin O’Leary, businessman and Shark Tank host, Catherine Wood, CEO and CIO, ARK Invest, among others.
Disclaimer
At this time, Physik Invest does not manage outside capital and is not licensed. In no way should the materials herein be construed as advice. Derivatives carry a substantial risk of loss. All content is for informational purposes only.
What Happened: Coming into the extended holiday weekend, on tapering volumes, U.S. index futures balanced within prior range.
This activity occurred in the context of a larger balance-area forming just beyond the $3,600.00 multi-month break-out point. Given the lack of range expansion, in addition to the aforementioned responsive, back-and-forth trade, participants are signaling a lack of conviction.
Though there is a lot of noise in the markets — an uneven recovery, stimulus, elections, trade, and the like — one key point remains: the multi-month upside breakout targeting S&P 500 prices as high as $4,000.00 remains intact. Add to this the recovery of Monday’s liquidation fueled by weak-handed, short-term buyers, and the fact that the all-time $3,724.25 rally-high was established in an overnight session, it is highly likely that the upside discovery process has yet to end.
Note: Historically, there is a low probability that overnight all-time highs end the upside discovery process.
Pictured: Profile overlays on a 30-minute candlestick chart of the Micro E-mini S&P 500 Futures
What To Expect: Friday’s session found responsive selling surface near the $3,691.00 profile level. Given that participants had difficulty in sustaining higher prices, alongside shortened holiday trade, the following frameworks apply for next week’s trade.
In the best case, the S&P 500 remains above its $3,667.75 HVNode, and continues to balance. As stated earlier, given the tapering volume and holiday, the odds of directional resolve are quite low.
Two go, no-go levels exist; trade that finds increased involvement above $3,691.00 and below $3,667.75 would suggest a change in conviction. Anything in-between favors responsive trade.
Conclusion:Bank of America Corp’s (NYSE: BAC) Michael Hartnett summarized it best: “[T]he year of the virus, the lockdown, a crash, a recession, an epic policy panic, the greatest stock market rally of all-time, a V-shape economic recovery, and ending with a vaccine for COVID-19.”
Though risks remain, markets are pricing in the odds of a continued rebound. Unless some exogenous event were to transpire, technically speaking, all broad-market indices are in an uptrend. A move below $3,600.00 in the S&P 500 would denote a change in tone, increasing the likelihood of a failed breakout that would target prices as low as $3,200.00.
Pictured: Retest of the upside breakpoint on a daily candlestick chart of the cash S&P 500 Index
Levels Of Interest: The $3,691.00 boundary and $3,667.75 HVNode.
Bonus: Here is a look at some of the opportunities unfolding.