
Physik Invest’s Daily Brief is read free by thousands of subscribers. Join this community to learn about the fundamental and technical drivers of markets.
Fundamental
We look beyond all the doom-and-gloom narrative to the bond-equity divergence which JPMorgan Chase & Co’s (NYSE: JPM) Marko Kolanovic wrote about recently.
Essentially, regressions suggest the move in interest rates since the Federal Reserve’s (Fed) meeting earlier this month should have resulted in a 5-10% sell-off in the rate-sensitive Nasdaq. It didn’t. Per Kolanovic, “this divergence cannot go much further.”
Recall interest rates matter to discounted future cash flows. The higher rates are the, worse that is for equities, says Damped Spring’s Andy Constan well in an interview.
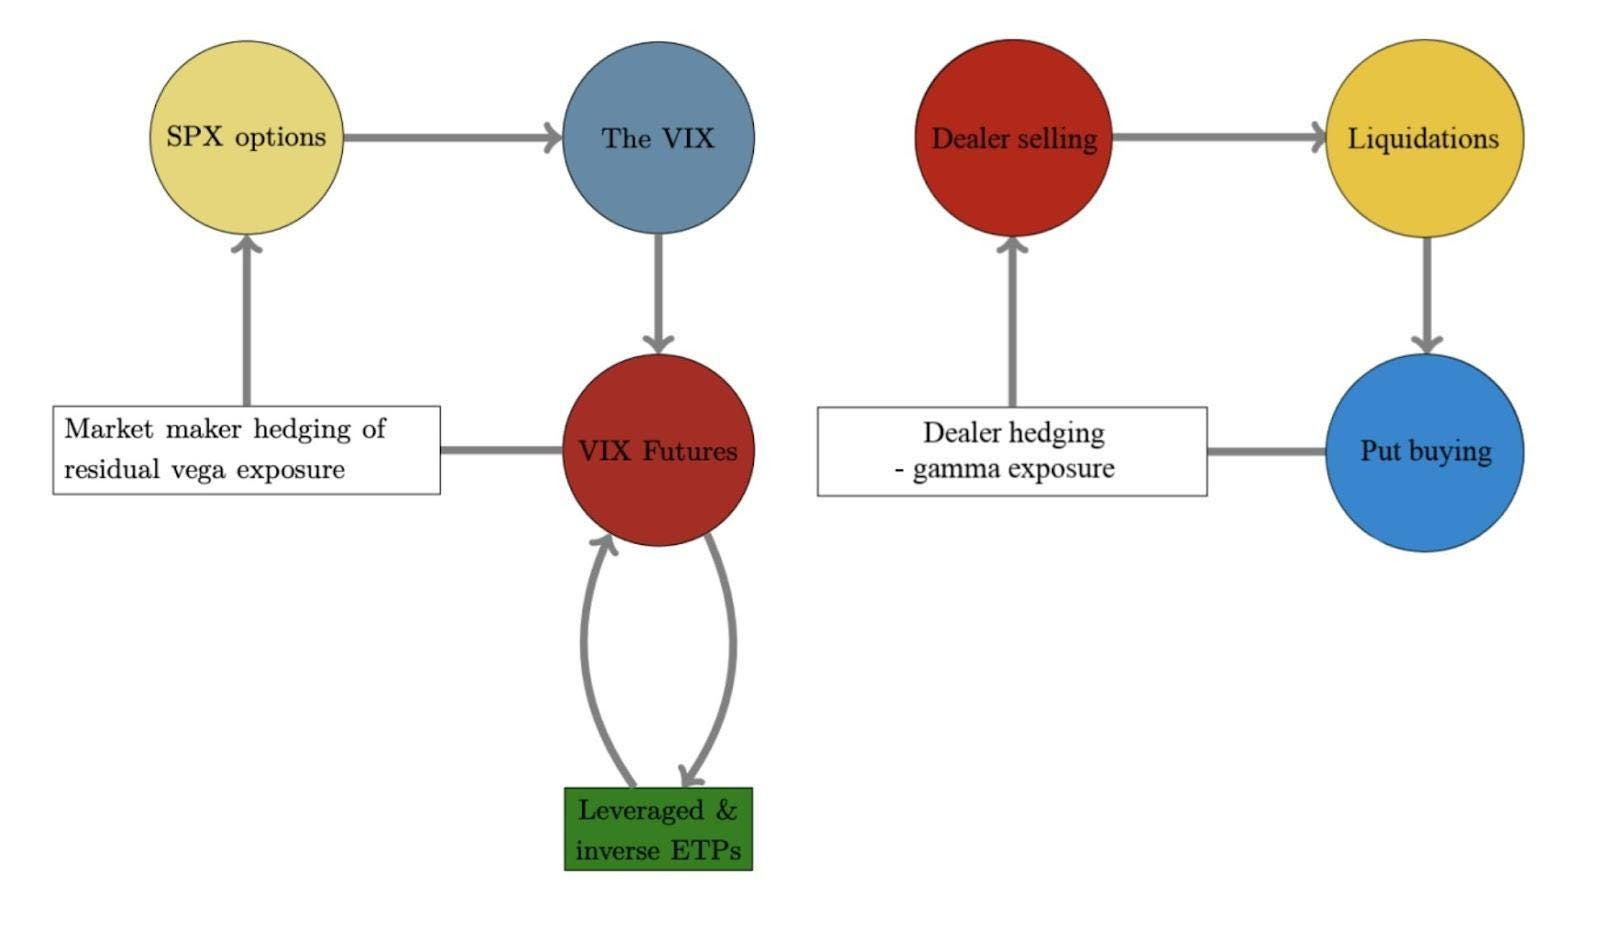
Interest rates matter elsewhere as well. When interest rates increase, “a mortgage goes down in price by a greater amount than the bond because the expected maturity of the mortgage becomes longer. The magnitude of this unbalanced price volatility characteristic is measured by a financial statistic called ‘convexity.’” Managing this convexity can be problematic and force feedback loops, just as we talk about with options per the below. See here for more.
Kolanvoic ends: The “risk-reward of holding bonds at this level of short-term yields looks better than equity (earnings yield) than any time since the great financial crisis (i.e., the spread between 2y and equity earnings yield is at the lowest point since 2007).”

Positioning
This letter said there would be movement after last week’s options expirations (OpEx).
To quote the February 15 letter, ignoring the “excellent” liquidity and traders buying S&P 500 (INDEX: SPX) “hand over fist,” OpEx would result in a decline in counterparty exposure to positive gamma (i.e., positive exposure to movement). Support from an options positioning perspective would decline, and counterparties would “do less to disrupt and more to bolster movement.”
That’s along the lines of what’s happening, though the movement appears orderly.
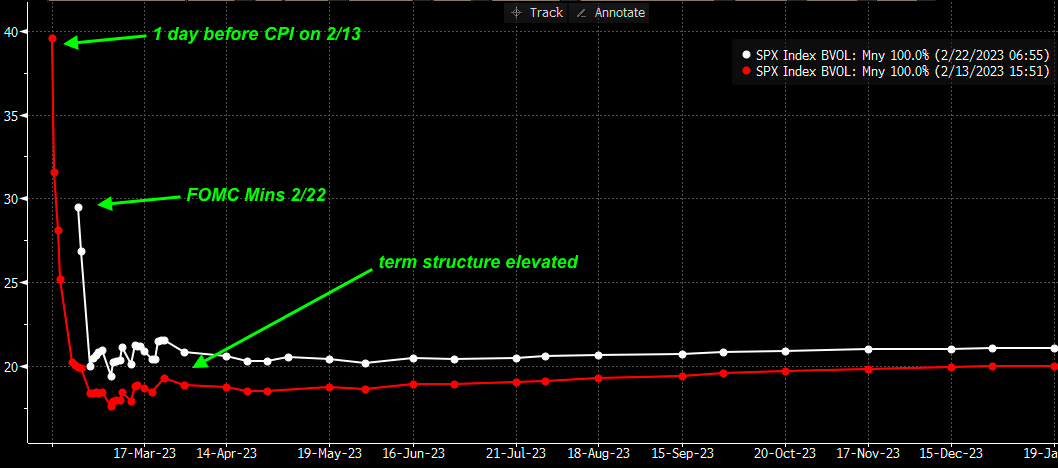
Per SpotGamma, “The selling appears contained, as evidenced by an upward trending [implied volatility or IVOL] term structure and light bid in topline measures of [IVOL] like the [Cboe Volatility Index (INDEX: VIX)].” Notwithstanding this light bid at the front of the term structure, there is no rush to protect, as would be evidenced by longer-dated IVOL shifting “materially higher as traders reset to lower equity valuations.”
With there being many options positions concentrated near the $4,000.00 SPX area, markets may be at risk of accelerated selling. Below $4,000.00 traders desire to own predominantly puts, and this leaves counterparties “short puts and [] positive delta, as well as negative gamma and vega, meaning they lose money in an increasing way as the market trades lower and volatility increases.” To hedge, counterparties could sell futures or stocks into the decline. This accelerates selling.
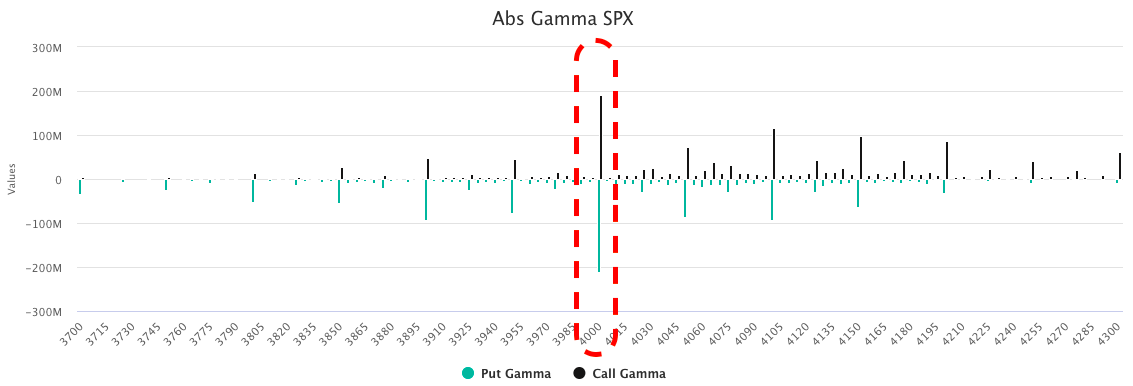
So, with a break of that big $4,000.00 level increasing risk that selling accelerates, the desire to protect will bid IVOL and the marginal impact of its expansion can do more damage than good that any marginal compression can do.

In light of this, your letter writer leans negative delta, as well as positive gamma and vega. If the market trades lower, such a setup would make money in short.
Technical
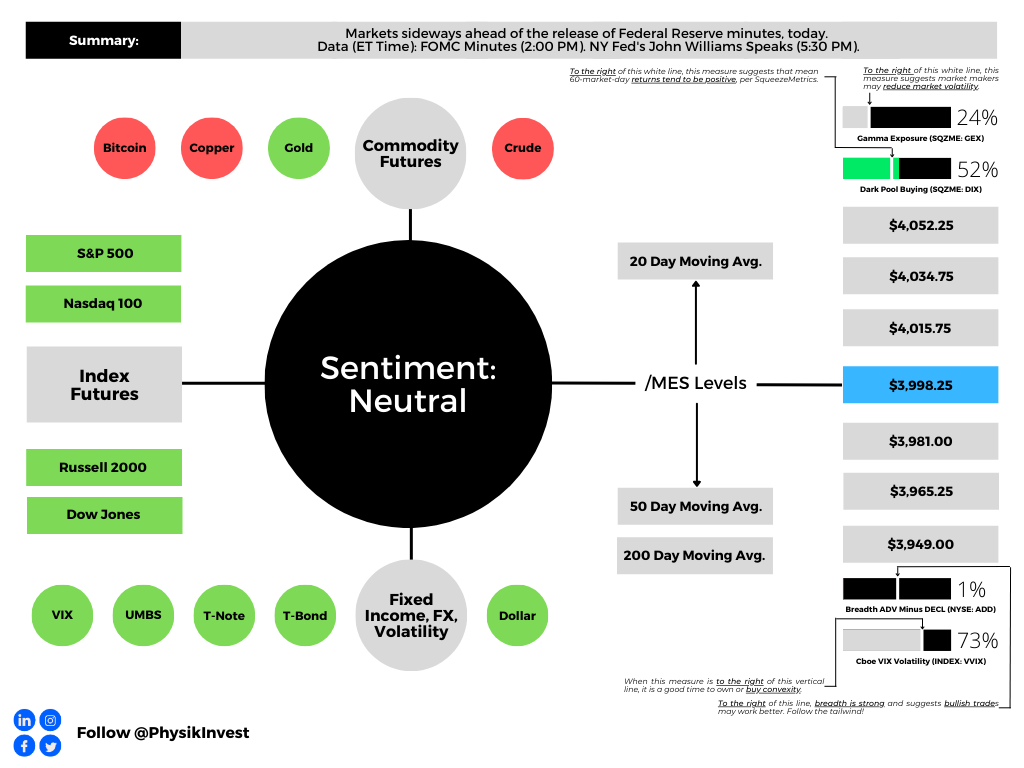
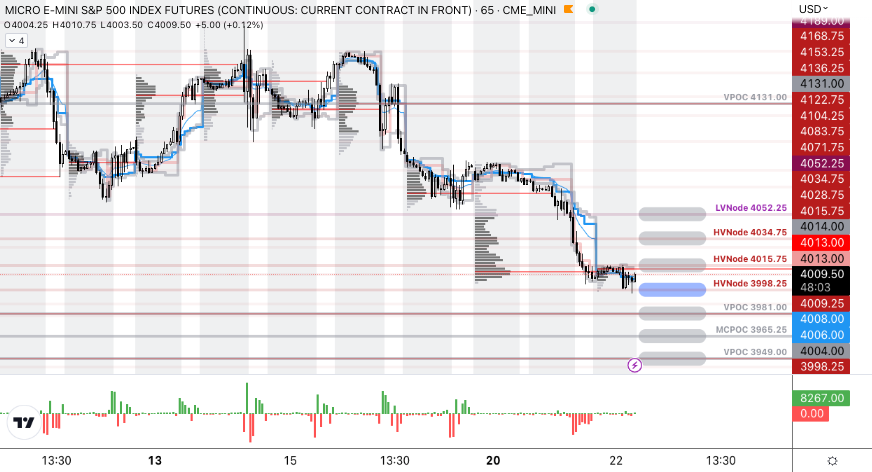
As of 7:15 AM ET, Wednesday’s regular session (9:30 AM – 4:00 PM ET), in the S&P 500, is likely to open in the middle part of a negatively skewed overnight inventory, inside of the prior day’s range, suggesting a limited potential for immediate directional opportunity.
The S&P 500 pivot for today is $3,998.25.
Key levels to the upside include $4,015.75, $4,034.75, and $4,052.25.
Key levels to the downside include $3,981.00, $3,965.25, and $3,949.00.
Disclaimer: Click here to load the updated key levels via the web-based TradingView platform. New links are produced daily. Quoted levels likely hold barring an exogenous development.
Definitions
Volume Areas: Markets will build on areas of high-volume (HVNodes). Should the market trend for a period of time, this will be identified by a low-volume area (LVNodes). The LVNodes denote directional conviction and ought to offer support on any test.
If participants auction and find acceptance in an area of a prior LVNode, then future discovery ought to be volatile and quick as participants look to the nearest HVNodes for more favorable entry or exit.
Gamma: The sensitivity of an option’s Delta to changes in the underlying asset’s price.
CPOCs: Denote areas where two-sided trade was most prevalent over all sessions. Participants will respond to future tests of value as they offer favorable entry and exit.
POCs: Areas where two-sided trade was most prevalent in a prior day session. Participants will respond to future tests of value as they offer favorable entry and exit.
MCPOCs: Denote areas where two-sided trade was most prevalent over numerous sessions. Participants will respond to future tests of value as they offer favorable entry and exit.
Inversion Of VIX Futures Term Structure: Longer-dated VIX expiries are less expensive; is a warning of elevated near-term risks for equity market stability.
About
The author, Renato Leonard Capelj, works in finance and journalism.
Capelj spends the bulk of his time at Physik Invest, an entity through which he invests and publishes free daily analyses to thousands of subscribers. The analyses offer him and his subscribers a way to stay on the right side of the market. Separately, Capelj is an options analyst at SpotGamma and an accredited journalist.
Capelj’s past works include conversations with investor Kevin O’Leary, ARK Invest’s Catherine Wood, FTX’s Sam Bankman-Fried, North Dakota Governor Doug Burgum, Lithuania’s Minister of Economy and Innovation Aušrinė Armonaitė, former Cisco chairman and CEO John Chambers, and persons at the Clinton Global Initiative.
Connect
Direct queries to renato@physikinvest.com. Find Physik Invest on Twitter, LinkedIn, Facebook, and Instagram. Find Capelj on Twitter, LinkedIn, and Instagram. Only follow the verified profiles.
Calendar
You may view this letter’s content calendar at this link.
Disclaimer
Do not construe this newsletter as advice. All content is for informational purposes. Capelj and Physik Invest manage their own capital and will not solicit others for it.


