Categories
Commentary

Daily Brief For April 27, 2022

The Daily Brief is a free glimpse into the prevailing fundamental and technical drivers of U.S. equity market products. Join the 200+ that read this report daily, below!

What Happened

Overnight, equity index futures probed higher, essentially negating Tuesday’s end-of-day, knee-jerk liquidation.

Tuesday’s selling came alongside Russia cutting gas to Poland and Bulgaria, Vice President Kamala Harris testing positive for COVID-19, and heavy selling in growth and tech stocks, amid doubts corporate profits can withstand the Federal Reserve’s bid to tame inflation.

As Jerome Schneider of Pacific Investment Management Co says, QT will “have a profound effect on the cost of liquidity and more importantly the cost of transacting business and reallocating assets from one avenue to another avenue.” 

“There might not necessarily be a rapid deceleration or decline in the stock market or other risk assets, but there’s going to be a changing cost of capital that this balance sheet is going to be part of.”

After the close, weakness continued. Alphabet Inc (NASDAQ: GOOGL) (NASDAQ: GOOG) missed on slowing sales growth and digital-ad spending. One of the biggest losers was Tesla Inc (NASDAQ: TSLA) which shed 12% or so on news that Elon Musk would use his fortune, much of which is tied up in Tesla, to buy Twitter Inc (NYSE: TWTR).

Germany’s passage of a bigger borrowing budget, coupled with China’s pledge to boost infrastructure bolstered an overnight advance that fed into price action at home. The S&P 500, in particular, for a brief moment, took back a key level, negating much of yesterday’s liquidation.

Ahead is data on international trade in goods (8:30 AM ET), as well as pending home sales and the rental vacancy rate (10:00 AM ET).
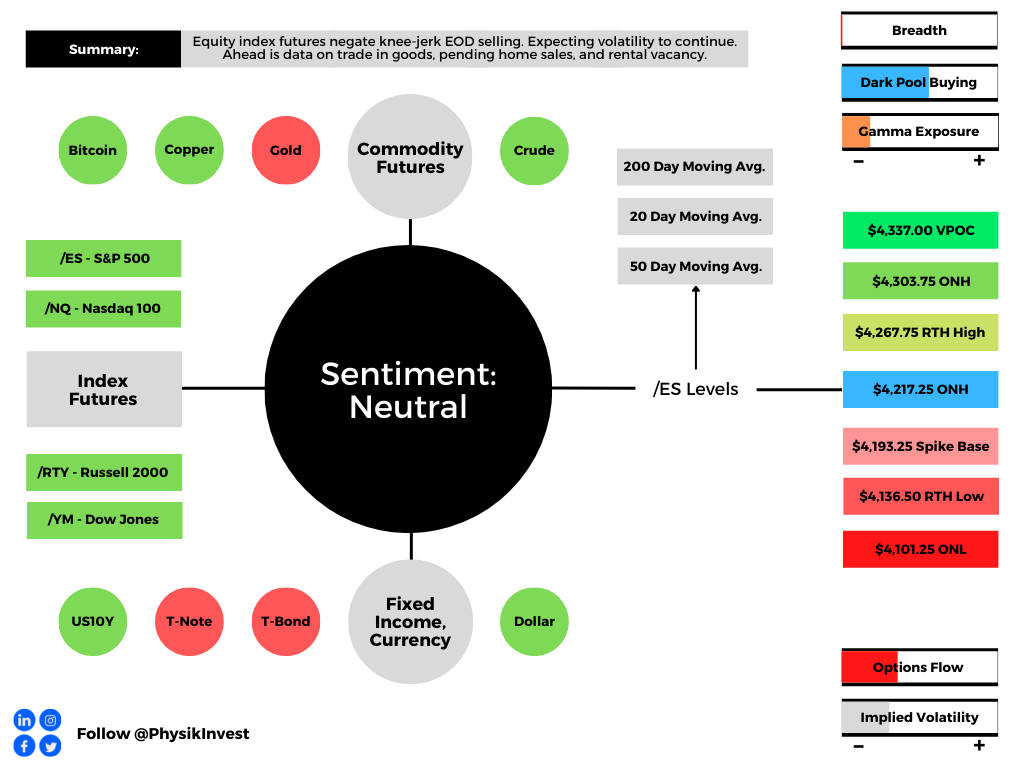
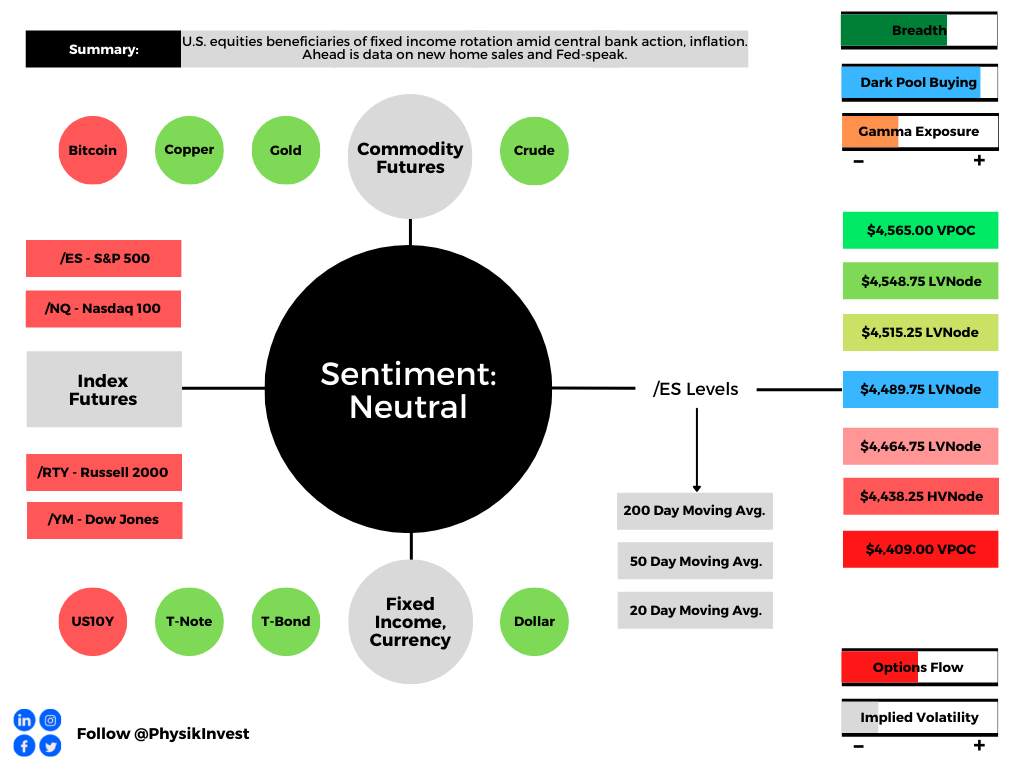
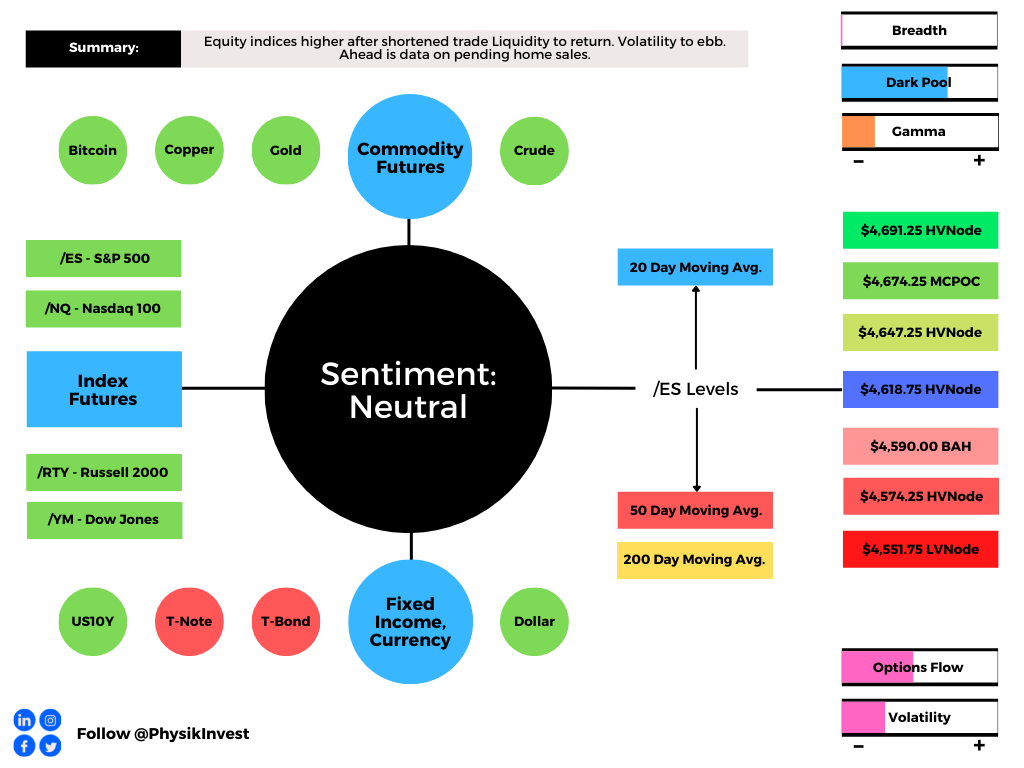
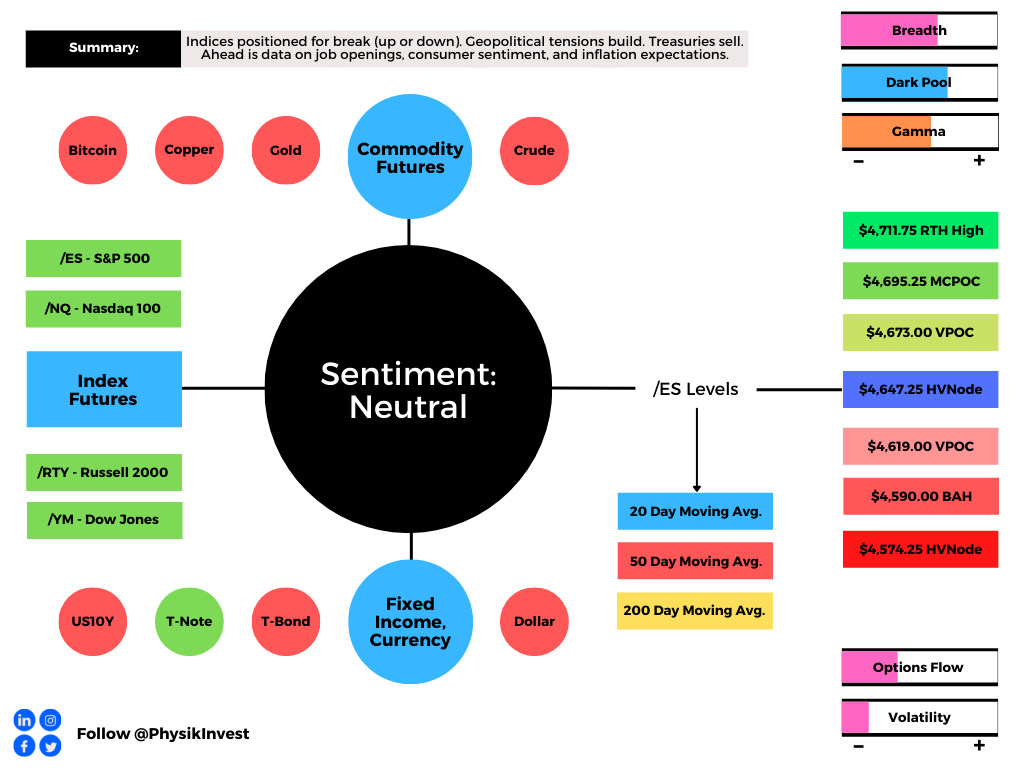
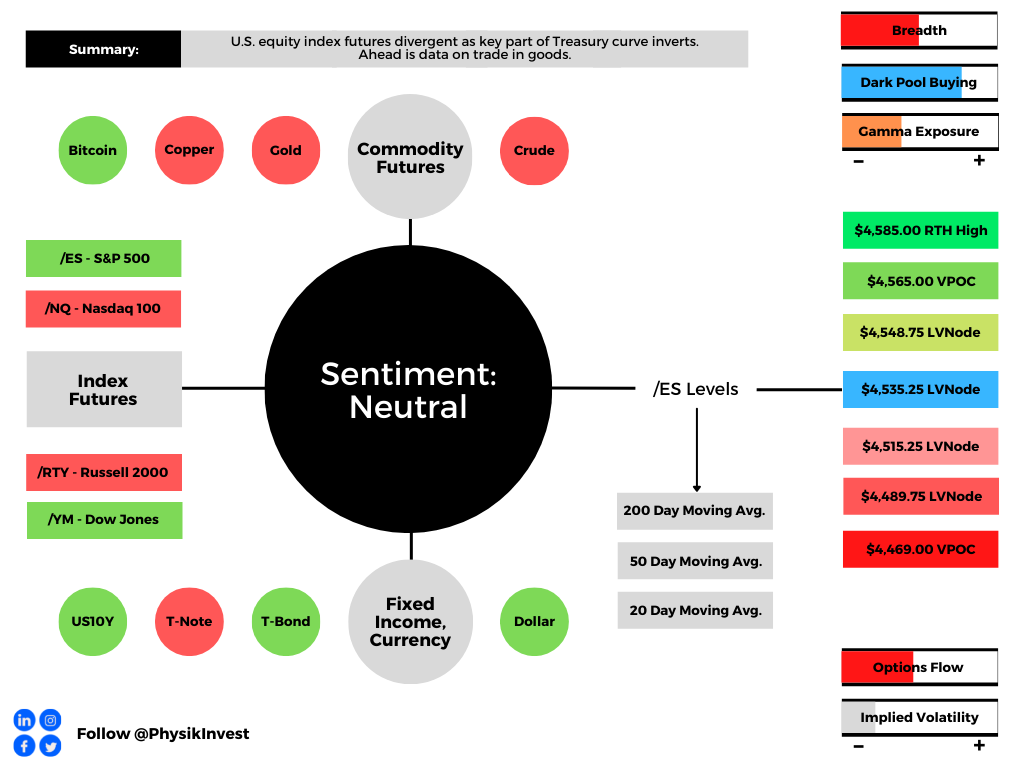
Graphic updated 7:00 AM ET. Sentiment Neutral if expected /ES open is inside of the prior day’s range. /ES levels are derived from the profile graphic at the bottom of the following section. Levels may have changed since initially quoted; click here for the latest levels. SqueezeMetrics Dark Pool Index (DIX) and Gamma (GEX) calculations are based on where the prior day’s reading falls with respect to the MAX and MIN of all occurrences available. A higher DIX is bullish. At the same time, the lower the GEX, the more (expected) volatility. Learn the implications of volatility, direction, and moneyness. SHIFT data used for S&P 500 (INDEX: SPX) options activity. Note that options flow is sorted by the call premium spent; if more positive, then more was spent on call options. Breadth reflects a reading of the prior day’s NYSE Advance/Decline indicator. VIX reflects a current reading of the CBOE Volatility Index (INDEX: VIX) from 0-100.

What To Expect

Positioning: Markets are positioned for continued volatility. 

Based on a reading of market gamma exposure (GEX) and buying support (DIX), the returns distribution is skewed positive. There’s buying in the context of an environment in which the hedging of options positioning implies selling into weakness and buying of strength.
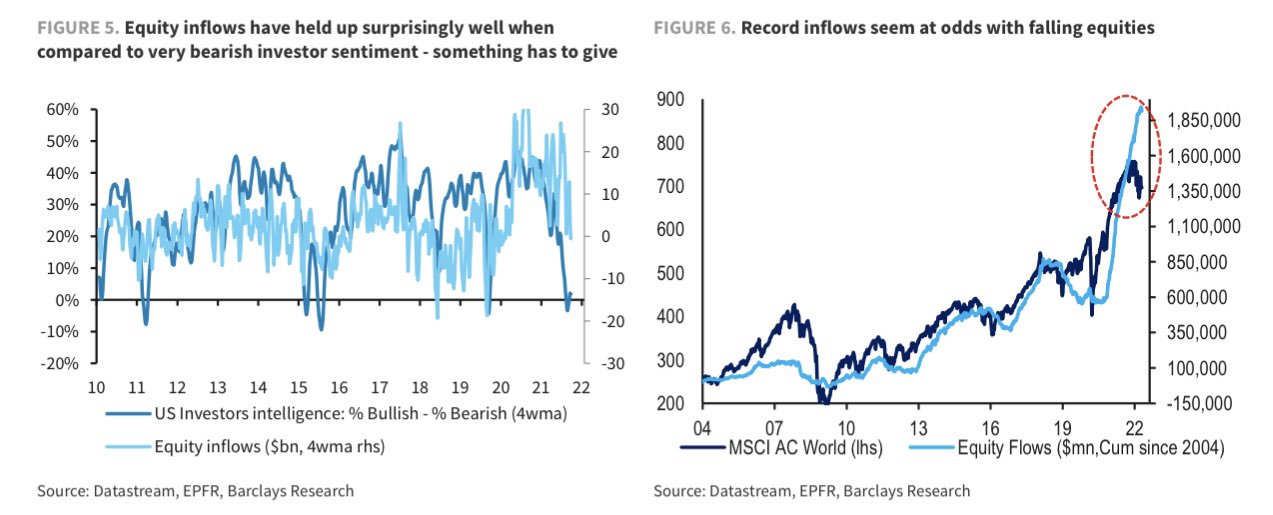
Graphic: Via Barclays PLC (NYSE: BCS) research.

In the most simple way that I can explain: when positioning is stretched one way, that often tends to mark a turning point – the returns distribution is either skewed positive or negative.
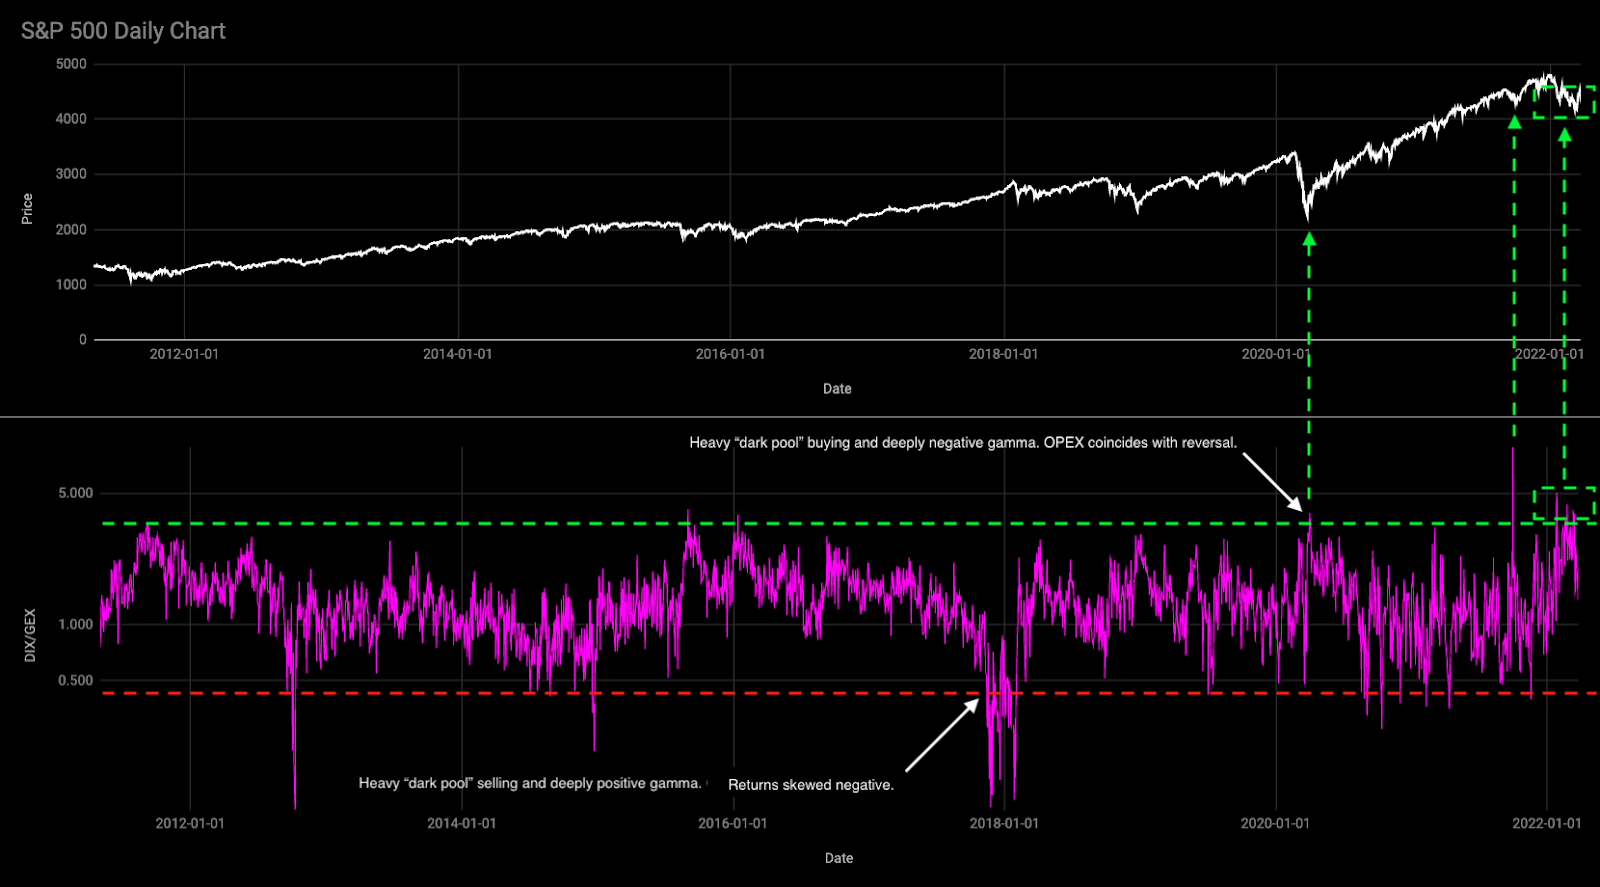
Graphic: Via Physik Invest. Data via SqueezeMetrics. Updated March of 2022. A high DIX/GEX ratio often portends positive 1-month returns.

An updated read, after Tuesday’s weak close, tells us that we can (1) definitely expect larger ranges to continue and (2) potential for short-term bounces

Based on overnight activity, one of those is happening, now.
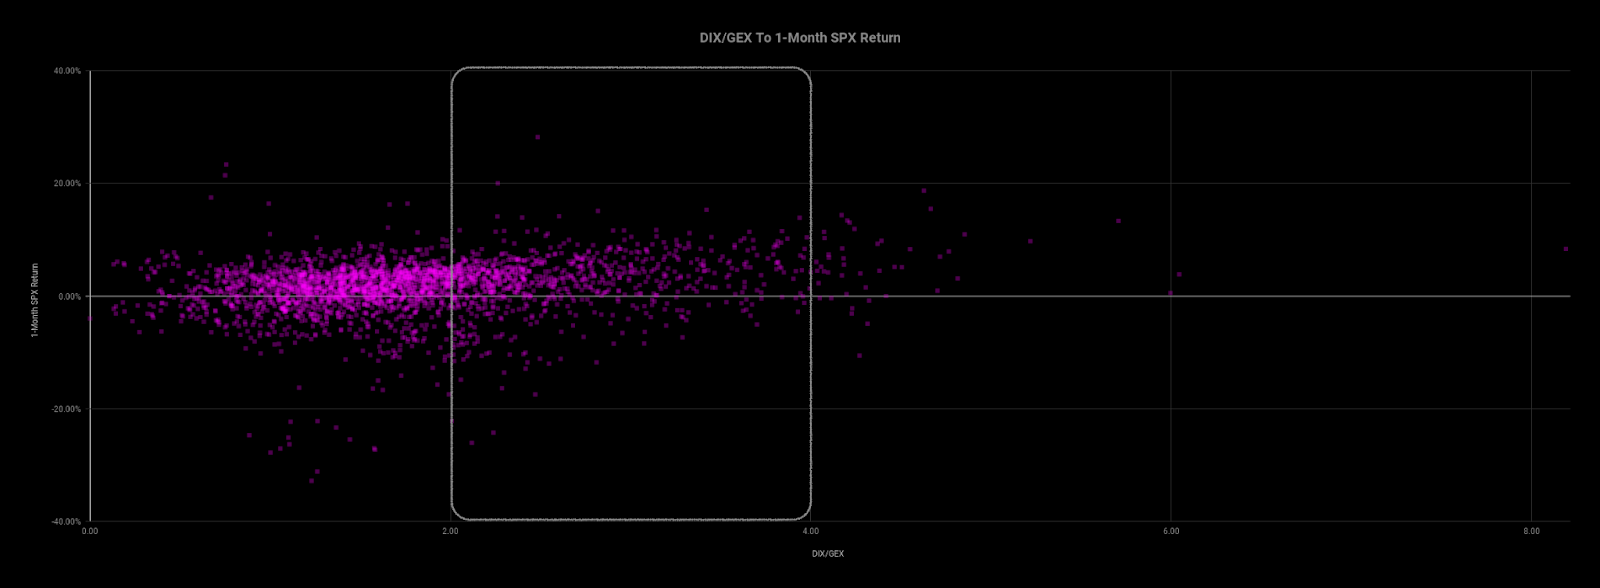
Graphic: Via Physik Invest. Data via SqueezeMetrics.

This is as participants are both well-hedged and using weakness as an opportunity to buy into a less highly valued market.

Well-hedged means that customers (i.e., you and I) own protection against long equity exposure. So, that could mean customers own puts and/or are short calls. One of the most dominant flows is the long put, short call.

Such trade offers customers positive, yet asymmetric (gamma), exposure to direction (delta). In other words, negative delta and positive gamma. 

The counterparty has exposure to positive delta and negative gamma. If the underlyings trade lower and volatility rises, all else equal, the position will lose. To hedge against these losses, the counterparties will sell underlying into weakness.

If prices reverse and move higher, these counterparties will re-hedge and buy underlying.

Normally, as seen over the bull run of 2020 and 2021, markets are in an uptrend and there’s a strong supply of volatility. Often, customers sell more calls than puts and, in an uptrend, those calls solicit more active hedging than the put options.

Recall that the customer is short the call. That means the counterparty is long the call (a positive delta and gamma trade) and will make money if prices rise, all else equal. 

The hedging of this particular exposure (i.e., sell strength, buy weakness), in an uptrend, occurs slower (i.e., counterparts will allow their profits to run), and that’s what can help the market sustain lower volatility trends for longer periods.

When prices reverse and underlyings trade lower, put options solicit increased hedging activity. Given the nature of counterparty exposure to those puts, that hedging happens quickly and can take from market liquidity as to volatility (i.e., buy strength, sell weakness).

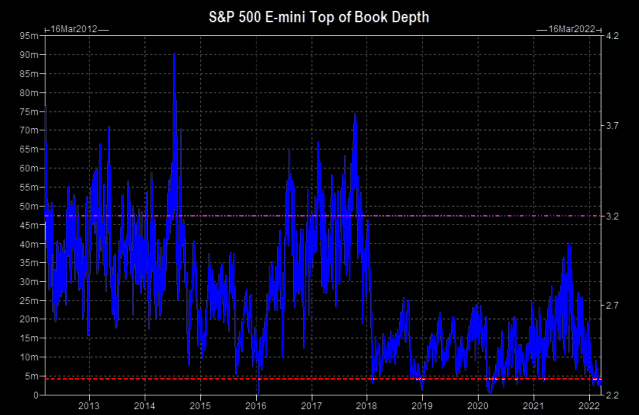
See, below, E-mini S&P 500 book depth, a proxy for market liquidity, and how much it has declined since the end of last year when markets became more volatile and noise around the Federal Reserve’s intent to taper bond-buying and raise rates grew louder.
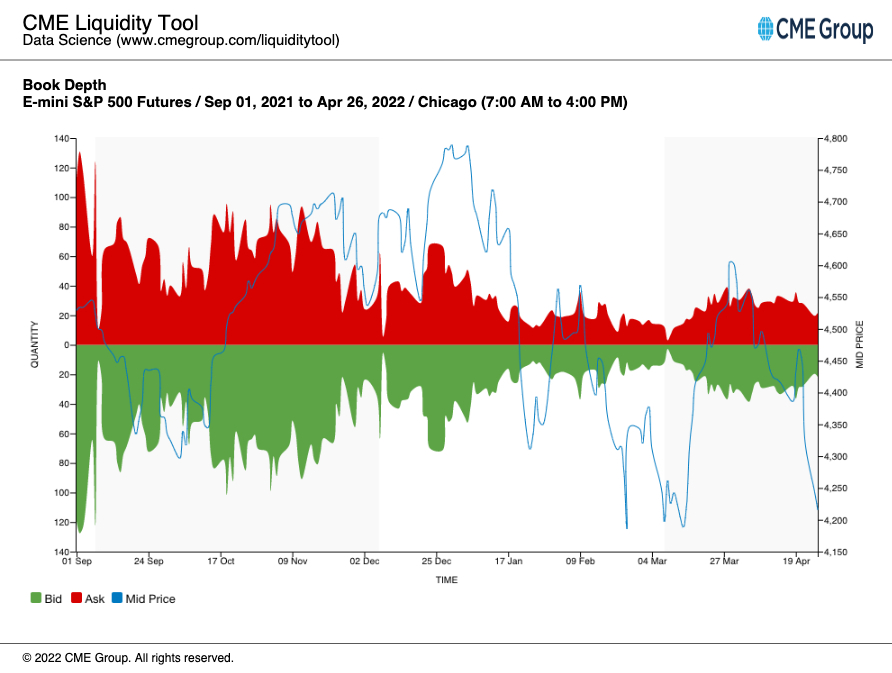
Graphic: Via CME Group Inc (NASDAQ: CME) Liquidity Tool. Note how in late March, book depth rose as markets rose and customer call activity solicited increased hedging of counterparty long-gamma exposure (i.e., buy weakness, sell strength), adding to market liquidity.

In the above environment, counterparty hedging matters; the market is more sensitive to the flow, so to speak. That sensitivity is expected to continue.

SpotGamma, an options data and analysis service, sees the early May period as pivotal. Then is the Federal Open Market Committee (FOMC) meeting and the potential Russian default, per Moody’s Corporation (NYSE: MCO).

As quoted: “Russia ‘may be considered in default’ if it does not pay two bonds in US dollars by end of a grace period on May 4.”
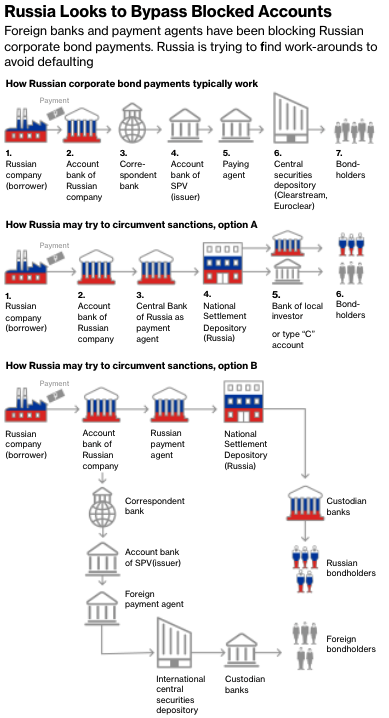
Graphic: Via Bloomberg.

Until those events are resolved, participants will likely continue to (remain) hedge(d). Upon resolve, customers likely monetize their protection to offset losses on underlying equity exposure. 

That means selling volatility which reduces counterparty exposure to short puts (negative gamma and positive delta). To re-hedge, underlying is bought back and that may support a price rise.
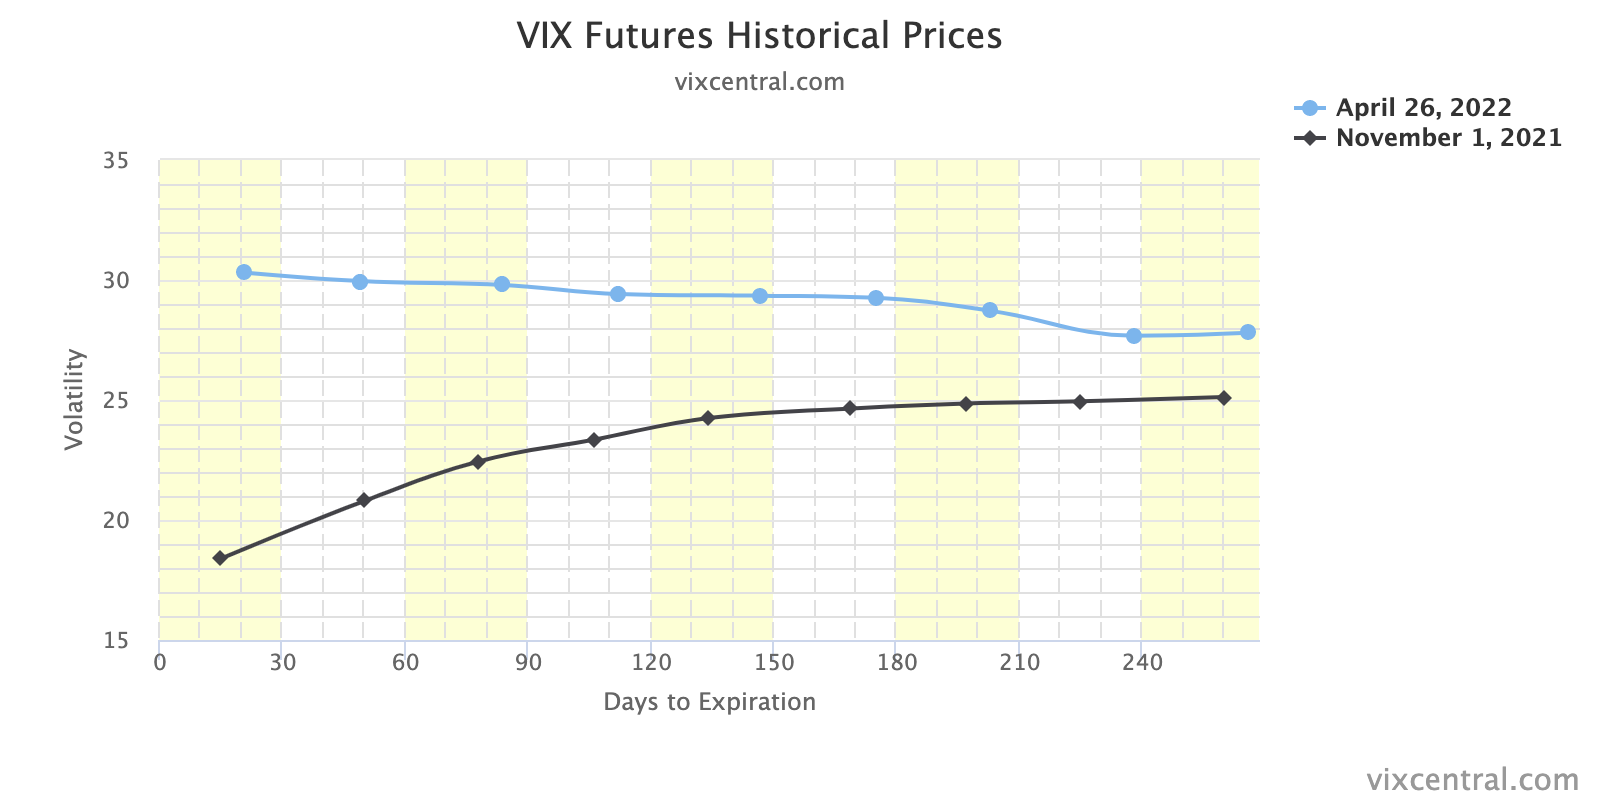
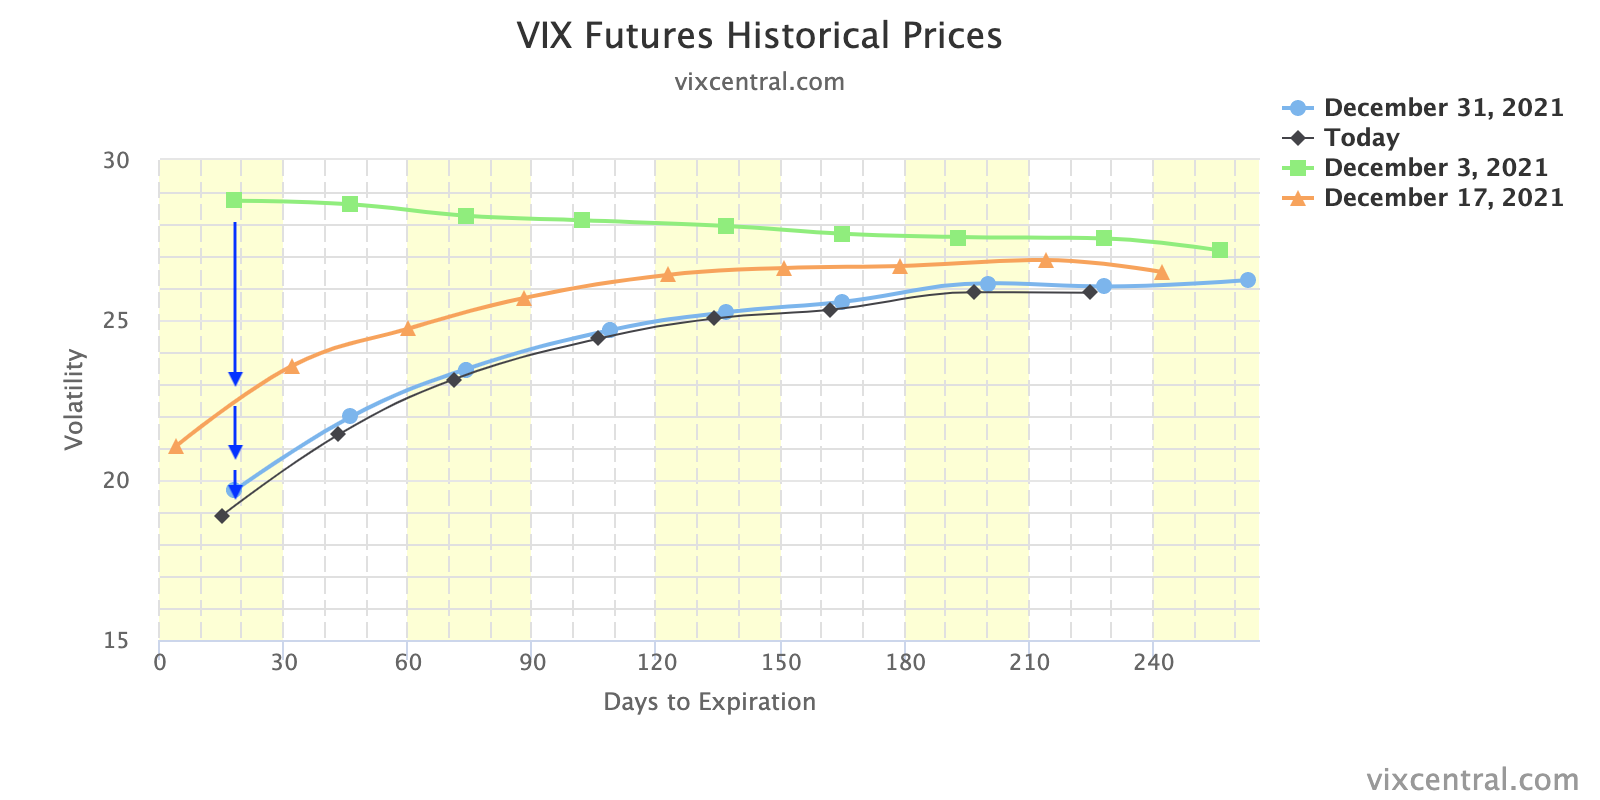
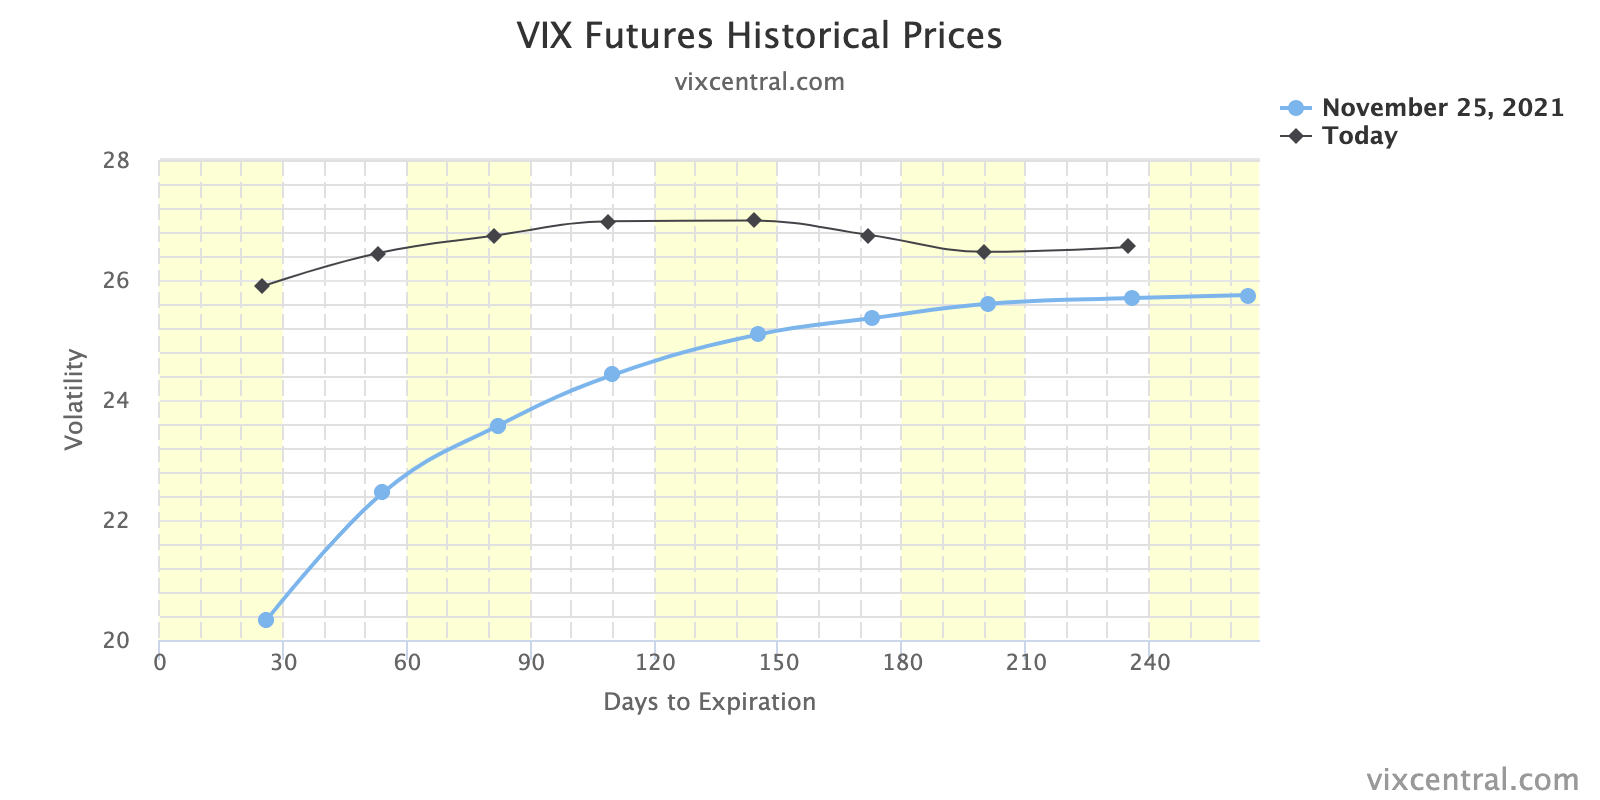
Graphic: VIX term structure via VIX Central. Expansion (higher) solicits counterparty selling which pressures the market lower. Compression (lower) solicits counterparty buying which bolsters attempts higher.

Whether that price rise has legs depends on what the fundamental situation is, then. See the below section titled Considerations for a full technical picture and the most likely turning points.

Technical: As of 7:00 AM ET, Wednesday’s regular session (9:30 AM – 4:00 PM ET), in the S&P 500, will likely open in the middle part of a balanced overnight inventory, inside of prior-range and -value, suggesting a limited potential for immediate directional opportunity.

In the best case, the S&P 500 trades higher; activity above the $4,217.25 overnight high (ONH) puts in play the $4,267.75 regular trade high (RTH High). Initiative trade beyond the RTH High could reach as high as the $4,303.75 ONH and $4,337.00 VPOC, or higher.

In the worst case, the S&P 500 trades lower; activity below the $4,217.25 ONH puts in play the $4,193.25 spike base. Initiative trade beyond the spike base could reach as low as the $4,136.50 regular trade low (RTH Low) and $4,101.25 overnight low (ONL), or lower.

Considerations: Spikes mark the beginning of a break from value. Spikes higher (lower) are validated by trade at or above (below) the spike base (i.e., the origin of the spike).

Additionally, the indexes continue to trade below their 20-, 50-, and 200-day simple moving averages, confirming the trend change and bearish tone (further validated by poor breadth).
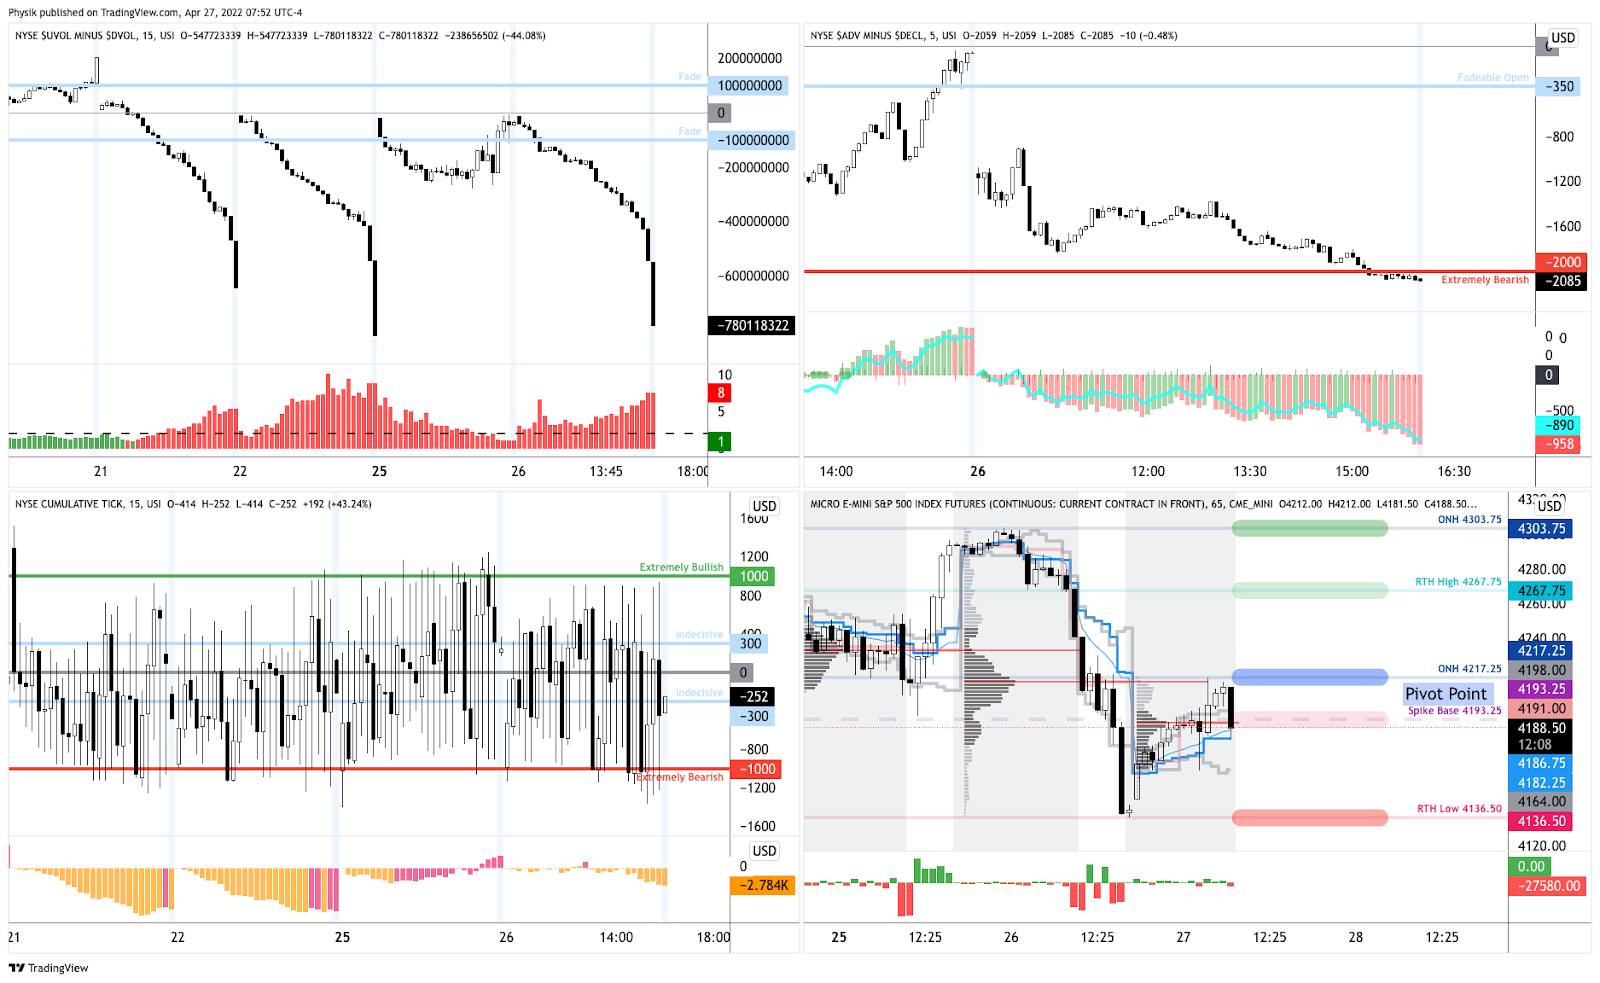
Graphic: Market Internals as pioneered by (a mentor of mine) Peter Reznicek. Notice the indicator in the top right, weighted S&P sectors (histogram) versus unweighted (blue line). During late last week, participants sold the entire market, heavily (as supported by the difference between the volume flowing into stocks that are up versus those that are down).

All indexes remain, as stated, yesterday, below their volume-weighted average prices (VWAPs) anchored from the start of this year (or their respective peaks). 

VWAPs are a metric highly regarded by chief investment officers (CIOs), among other participants, for quality of trade. Liquidity algorithms, too, are benchmarked and programmed to buy and sell around VWAPs.

The Invesco QQQ Trust Series 1 (NASDAQ: QQQ) just tested a major VWAP, yesterday, anchored from the lows of March 2020. That’s a fair price to pay for Nasdaq 100 exposure.
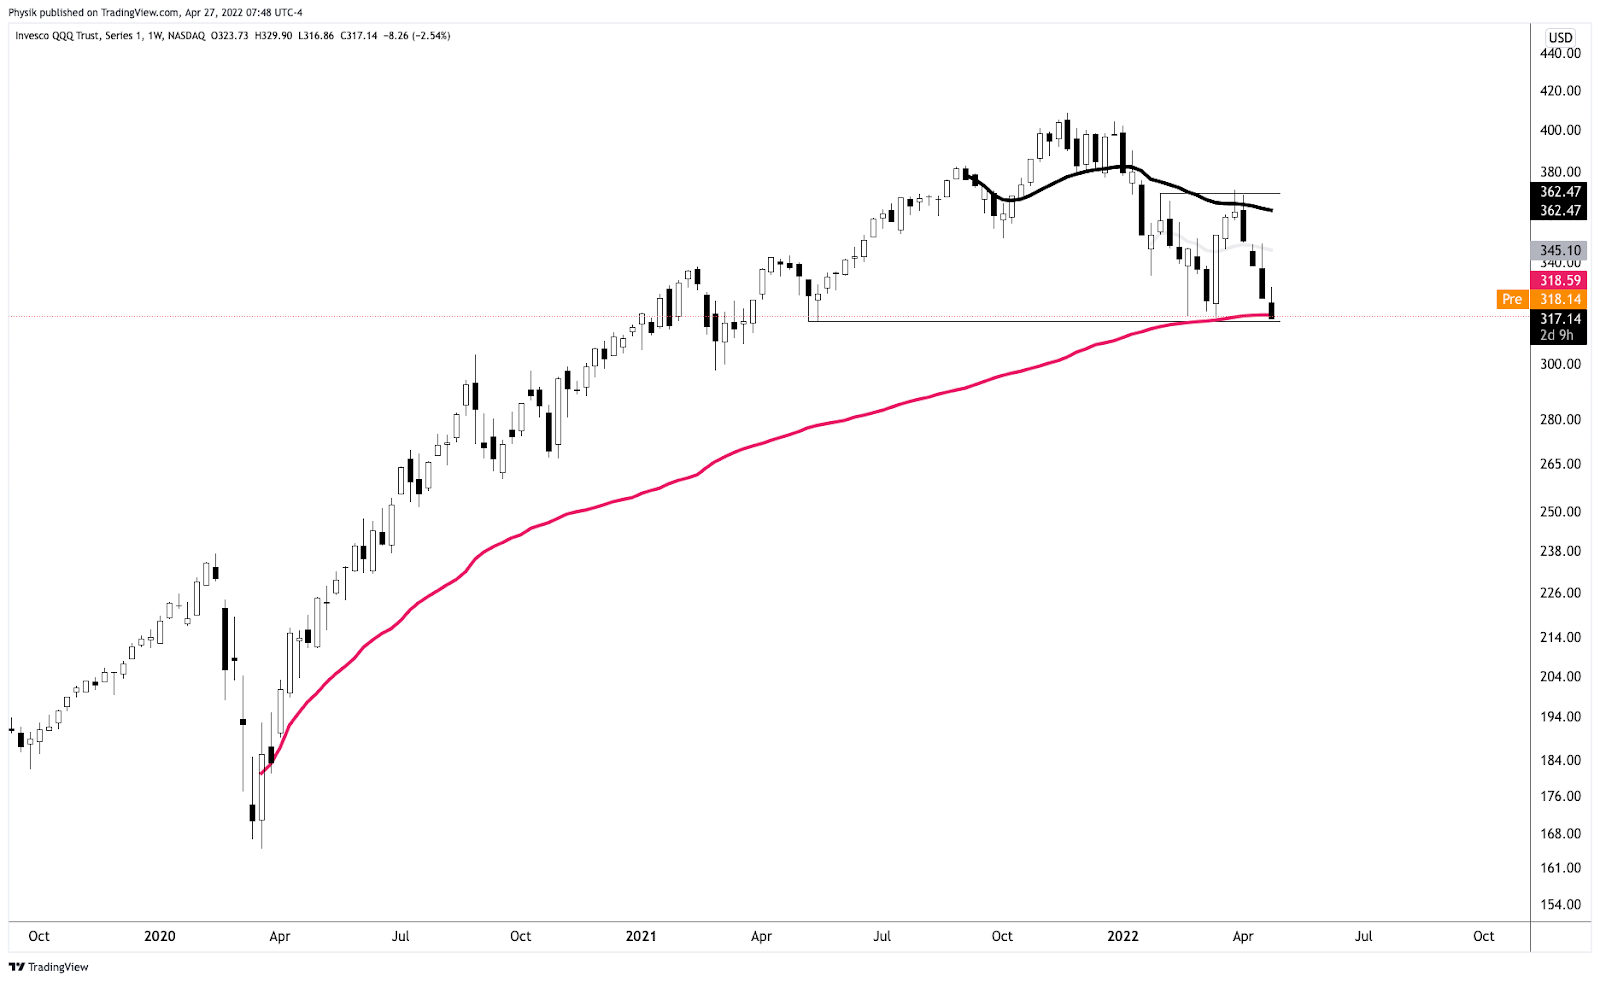
Graphic: Invesco QQQ Trust Series 1 (NASDAQ: QQQ) with anchored VWAPs.

Notwithstanding, notice the flat-to-declining AVWAP that’s black in color. So long as prices remain below this level, the index is likely a sell. 

Should that level flatten (and begin to rise), and if the QQQ was able to trade above it for a sustained period, there is potential for sustained upside.

Click here to load today’s key levels into the web-based TradingView charting platform. Note that all levels are derived using the 65-minute timeframe. New links are produced, daily.
Graphic: 65-minute profile chart of the Micro E-mini S&P 500 Futures.

Definitions

Overnight Rally Highs (Lows): Typically, there is a low historical probability associated with overnight rally-highs (lows) ending the upside (downside) discovery process.

Volume Areas: A structurally sound market will build on areas of high volume (HVNodes). Should the market trend for long periods of time, it will lack sound structure, identified as low volume areas (LVNodes). LVNodes denote directional conviction and ought to offer support on any test. 

If participants were to auction and find acceptance into areas of prior low volume (LVNodes), then future discovery ought to be volatile and quick as participants look to HVNodes for favorable entry or exit.

POCs: POCs are valuable as they denote areas where two-sided trade was most prevalent in a prior day session. Participants will respond to future tests of value as they offer favorable entry and exit.

About

After years of self-education, strategy development, mentorship, and trial-and-error, Renato Leonard Capelj began trading full-time and founded Physik Invest to detail his methods, research, and performance in the markets.

Capelj also develops insights around impactful options market dynamics at SpotGamma and is a Benzinga reporter.

Some of his works include conversations with ARK Invest’s Catherine Wood, investors Kevin O’Leary and John Chambers, FTX’s Sam Bankman-Fried, Kai Volatility’s Cem Karsan, The Ambrus Group’s Kris Sidial, among many others.

Disclaimer

In no way should the materials herein be construed as advice. Derivatives carry a substantial risk of loss. All content is for informational purposes only.

Categories
Commentary

Daily Brief For March 28, 2022

The Daily Brief is a free glimpse into the prevailing fundamental and technical drivers of U.S. equity market products. Join the 200+ that read this report daily, below!

What Happened

Overnight, equity index futures diverged during participants’ attempt to discover higher prices.

Commodities were mixed while bonds extended their slump; central bank authorities, in an effort to rein in inflation amid rising prices, are focused on implementing tighter monetary policies.

For a moment, the (5-30) Treasury curve dropped below zero for the first time since 2006. This is after the Federal Reserve’s (Fed) Jerome Powell said last week the central bank was committed to upping borrowing costs and would hike by 50 basis points if needed.

Graphic updated 6:40 AM ET. Sentiment Neutral if expected /ES open is inside of the prior day’s range. /ES levels are derived from the profile graphic at the bottom of the following section. Levels may have changed since initially quoted; click here for the latest levels. SqueezeMetrics Dark Pool Index (DIX) and Gamma (GEX) calculations are based on where the prior day’s reading falls with respect to the MAX and MIN of all occurrences available. A higher DIX is bullish. At the same time, the lower the GEX, the more (expected) volatility. Learn the implications of volatility, direction, and moneyness. SHIFT data used for S&P 500 (INDEX: SPX) options activity. Note that options flow is sorted by the call premium spent; if more positive, then more was spent on call options. Breadth reflects a reading of the prior day’s NYSE Advance/Decline indicator. VIX reflects a current reading of the CBOE Volatility Index (INDEX: VIX) from 0-100.

What To Expect

Fundamental: Keeping it short, today. 

Last week, we discussed monetary policy and the impact of quantitative tightening (QT) in the face of revisions in global growth expectations. You can check that out, here.

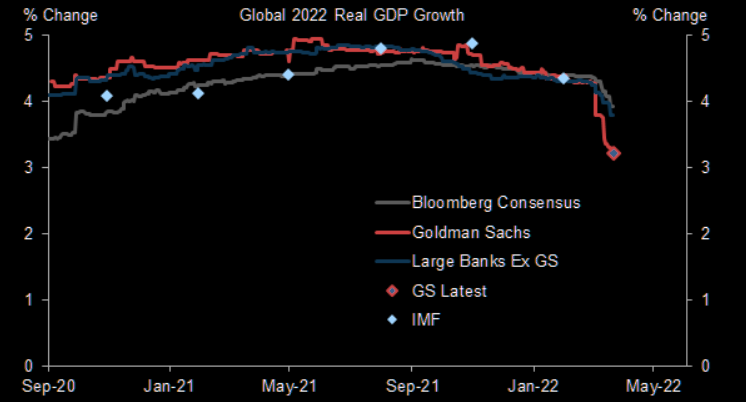
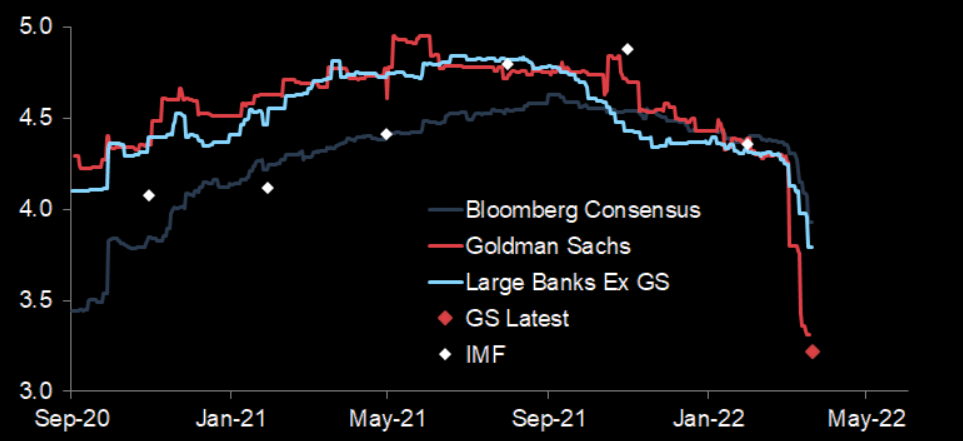
Graphic: Via Goldman Sachs Group Inc (NYSE: GS). Taken from The Market Ear. “GS has significantly lowered our 2022 global growth forecast in recent weeks. The chart shows global 2022 real GDP growth, % change.”

On the belief that the “Fed hiking cycle and balance sheet drain are now priced” as the market enters a seasonally favorable period, strategists like JPMorgan Chase & Co’s (NYSE: JPM) Marko Kolanovic favor risk in high-beta.

“While the commodity supercycle will persist,” Kolanovic said, “the correction in bubble sectors is now likely finished, and geopolitical risk will likely start abating in a few weeks’ time (while a comprehensive resolution may take a few months).”

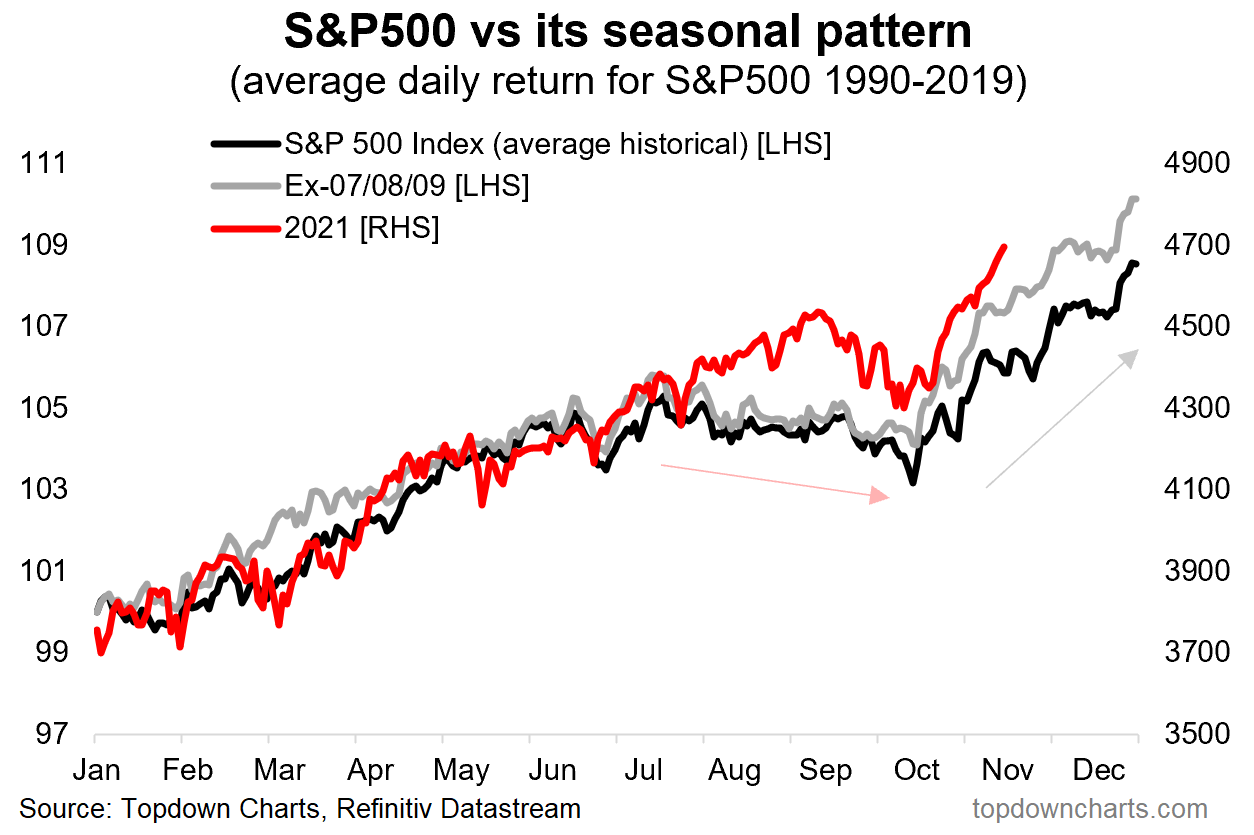
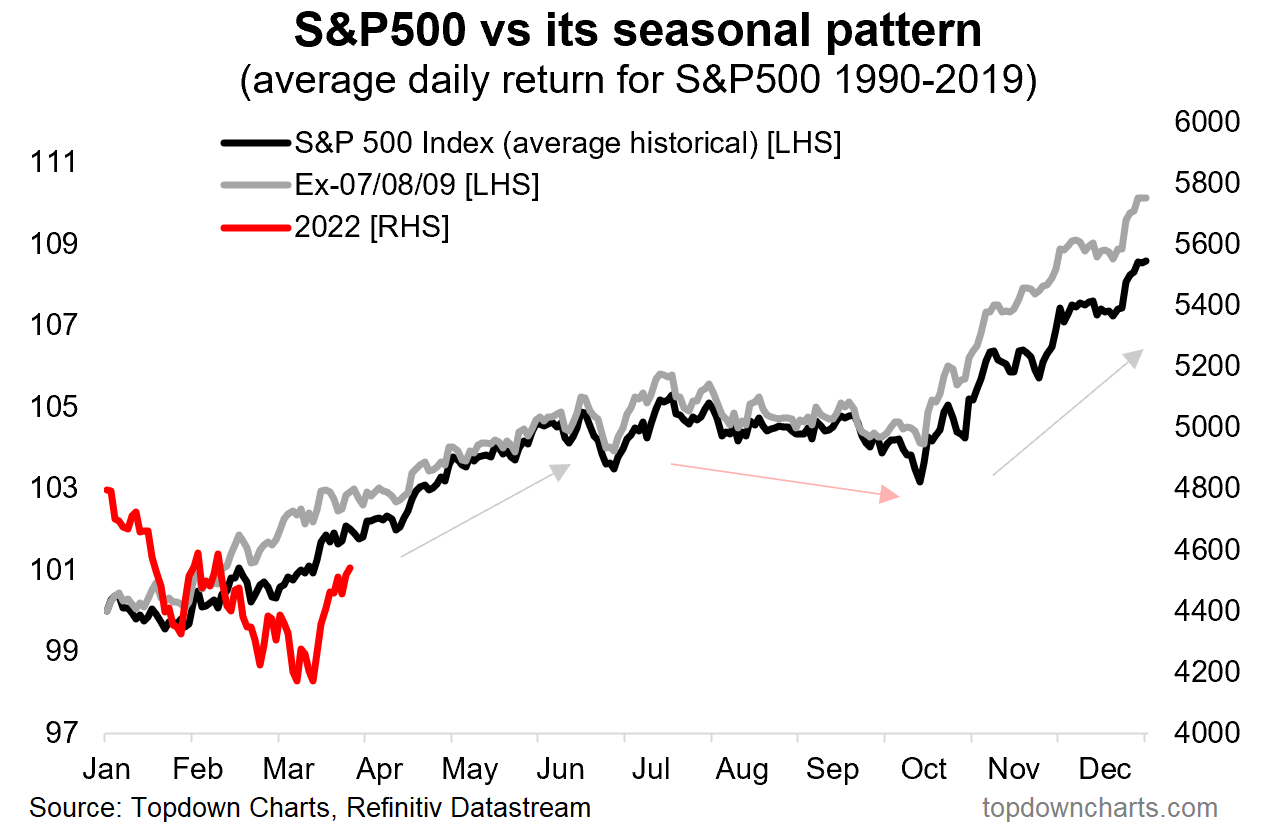
Graphic: Via Callum Thomas. “April is historically the best month (highest average monthly gain and 74% of all Aprils in history were positive).”

Complicating Kolanovic’s outlook is uncertainty with respect to the Fed’s decision to hike and pare asset holdings as financial conditions tighten.

Graphic: Via Stenos Signals. “On top of already tight financial conditions, the spill-overs from a weakening credit cycle remain mostly unseen. If usual correlations hold, then a contracting credit cycle will lead long bond yields LOWER and not higher during H2-2022.”

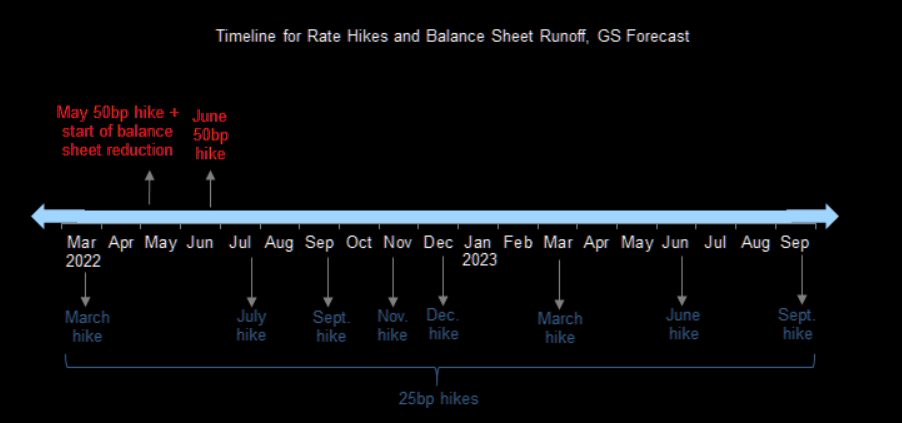
In the coming weeks, the thesis that a de-rate (or pricing in of uncertainties) has played out will be put to the test as the Fed reveals its template for QT. Final plans are likely to be unveiled in an announcement at the beginning of May.

Damped Spring Advisors’ Andy Constan explains well his perspectives on what comes next in the below video. Check it out.

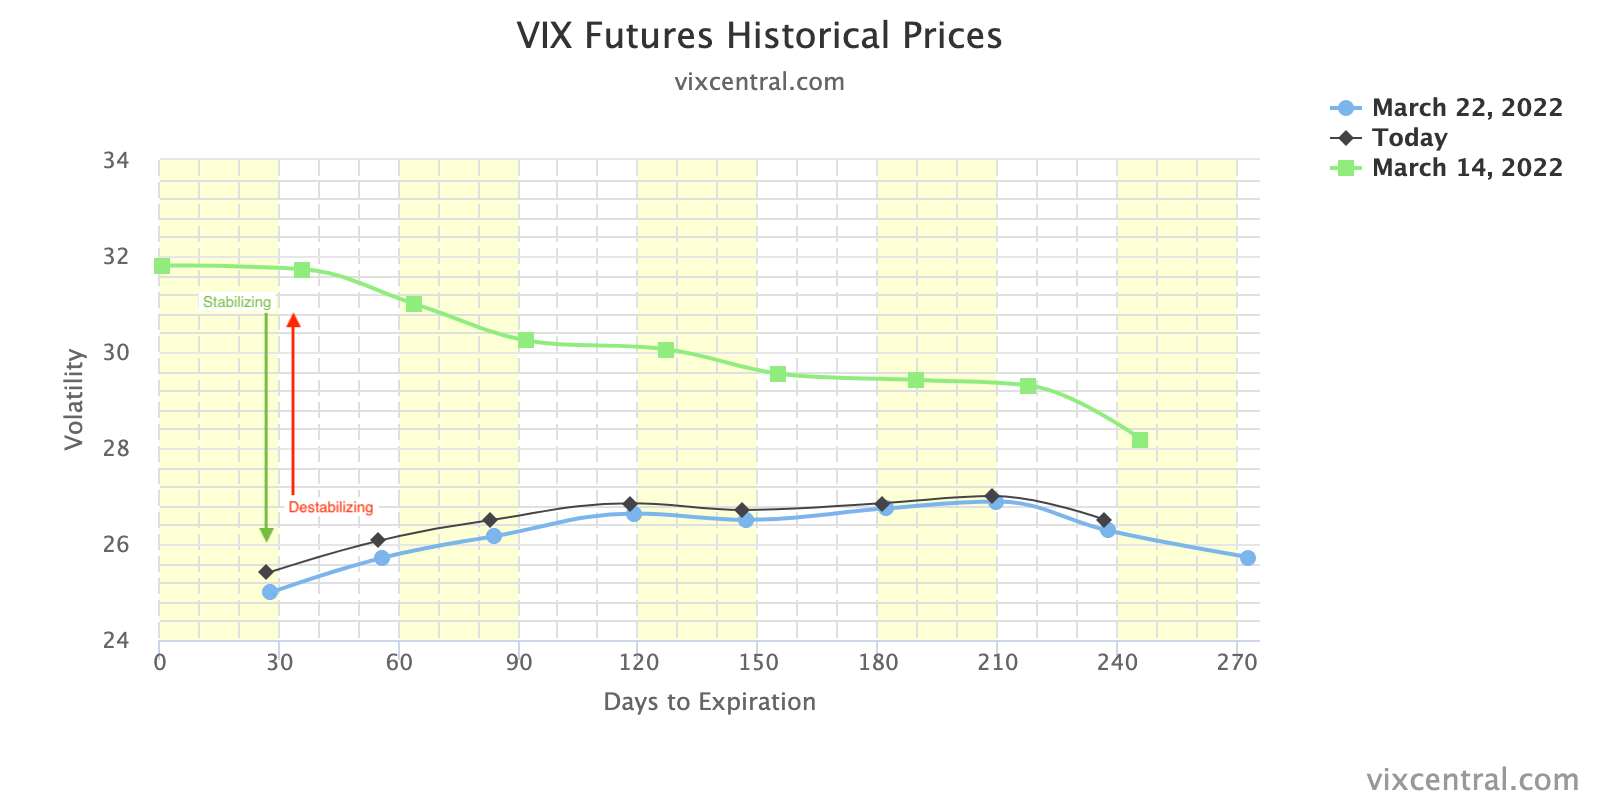
Positioning: The CBOE Volatility Index (INDEX: VIX), a measure of participants’ demand for protection, so to speak, appears to have hit a lower bound around 20.00. This is as the VIX term structure steepened, dramatically, over the last weeks, particularly at the front end of the curve.

Graphic: Via Vix Central.

After a long period during which options market participants concentrated their activity on bets on lower prices (negative delta trades that payout in case of movement lower), markets jolted higher as that protection was monetized (and decay ensued).

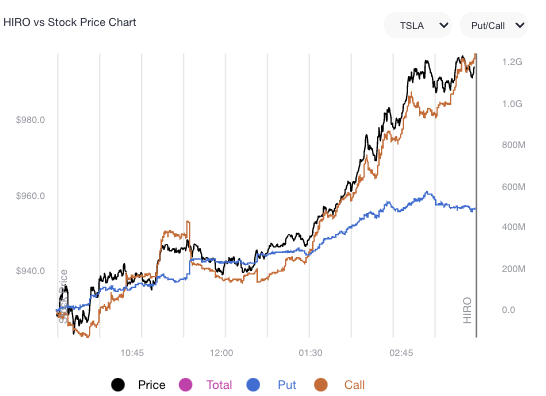
Alongside this collapse in implied volatility was speculative demand in index heavy-weights like Tesla Inc (NASDAQ: TSLA). Participants bought stock while selling puts (bets on the downside) and buying calls (bets on the upside).

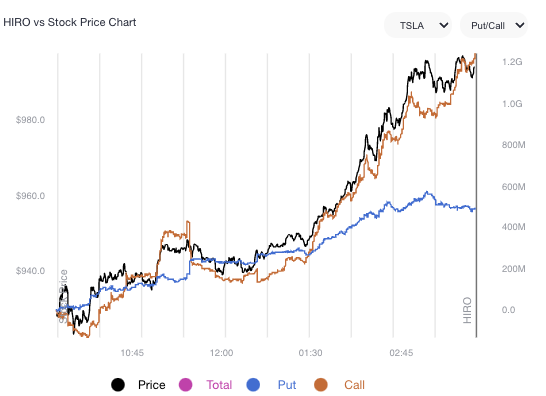
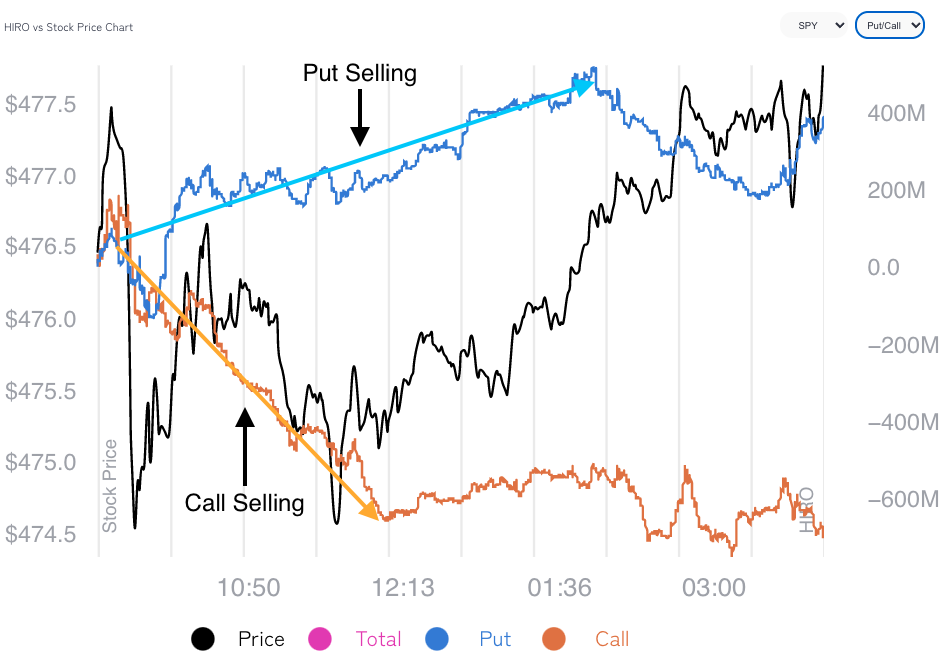
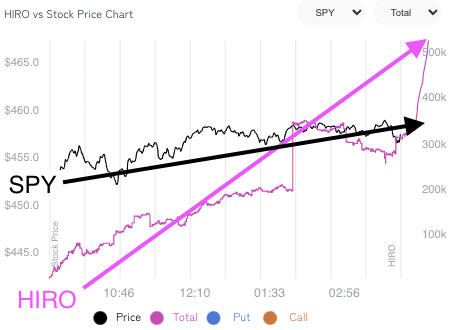
Graphic: SpotGamma’s Hedging Impact of Real-Time Options (HIRO) indicator for TSLA as shown in our March 23, 2022 newsletter. The rising orange line denotes call buying. The rising blue line denotes put selling.

As this speculative demand cools, counterparties to these levered bets on the upside unwind their hedges and this has the effect of pressuring attempts higher.

According to SpotGamma, this is as, heading into this week’s expiration of quarterly options, there’s a “potential for more ‘pinning’ action as close-to-the-money bets concentrated in that expiry near the end of their lifecycle.” You can learn more about this, here.

Why? As time and volatility trend toward zero, the rate of change of options delta (gamma) of near-the-money options increases.

“This happens because the range of spot prices across which option deltas shift from near-zero to near-100% becomes very narrow as options approach maturity (and at maturity, options on one side of the settlement value have zero delta and the other side have 100% delta).”

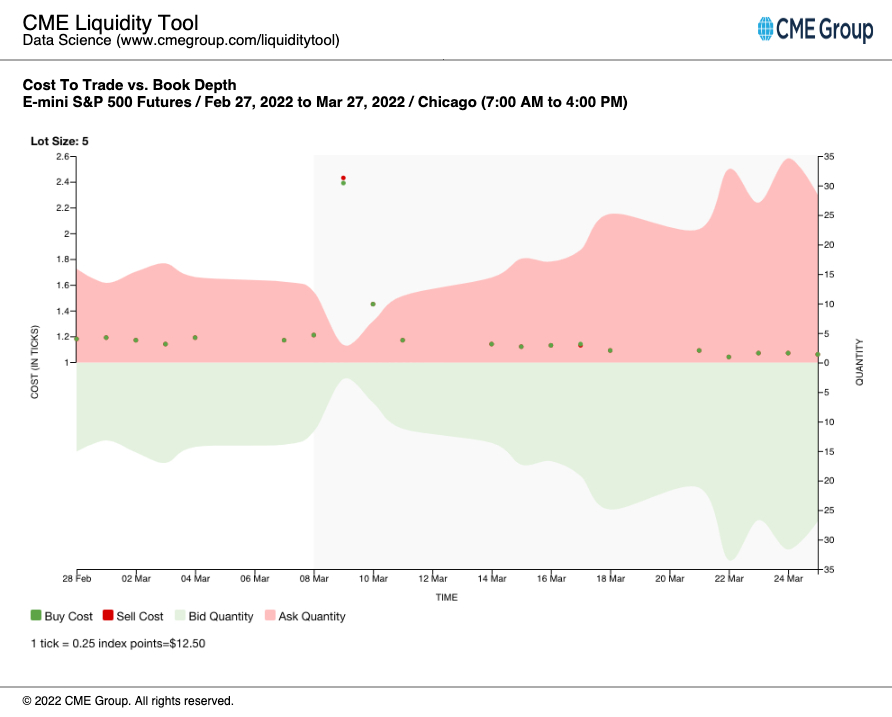
With, at least at the index level, bets on lower volatility dominating (put and call selling), as the gamma of these near-the-money options increases, counterparties add liquidity, buying (selling) into weakness (strength) as positive delta exposure falls (rises).

Graphic: Analysis of book depth for the E-mini S&P 500 futures contract, via CME Group Inc’s (NASDAQ: CME) Liquidity Tool. For more on the implications of participants’ options positioning and dealer hedging, read here.

Moreover, the odds point to sideways trade, rather than a fast move higher or lower. 

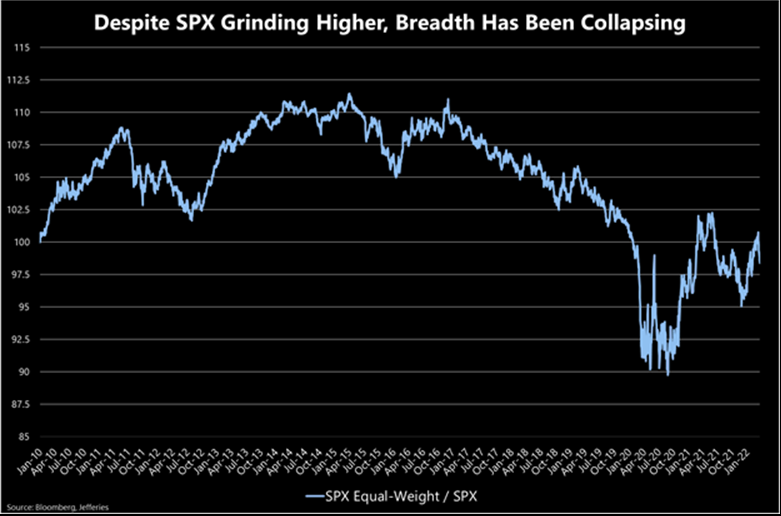
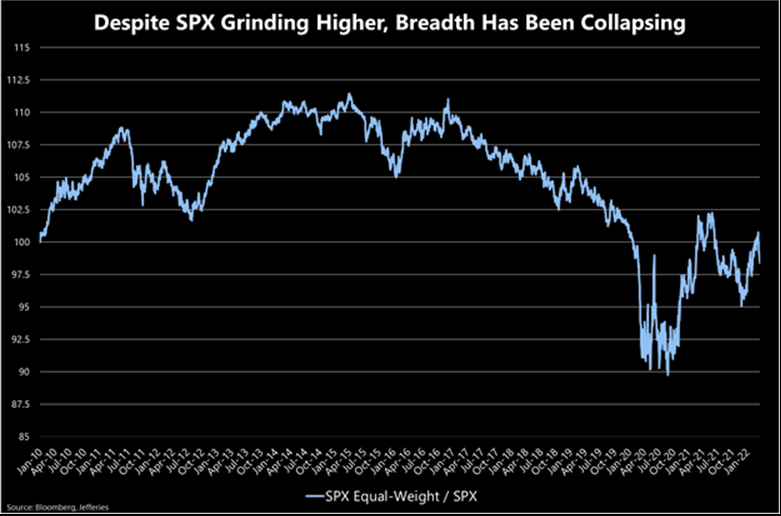
However, after this expiry, it’s likely that the market succumbs to underlying forces. At present, despite the S&P 500 and its peers trading higher, underlying breadth is collapsing.

Graphic: Via Jefferies Financial Group Inc (NYSE: JEF). Taken from The Market Ear. “While the SPX is up over 8% since the lows, the equal-weight version of the index is down nearly 3% relative, its steepest relative decline so far this year. Typically, this would make us uneasy too, but the market narrowed considerably from June to Dec last year, so this might be attributable to a tech bounce from lows.”

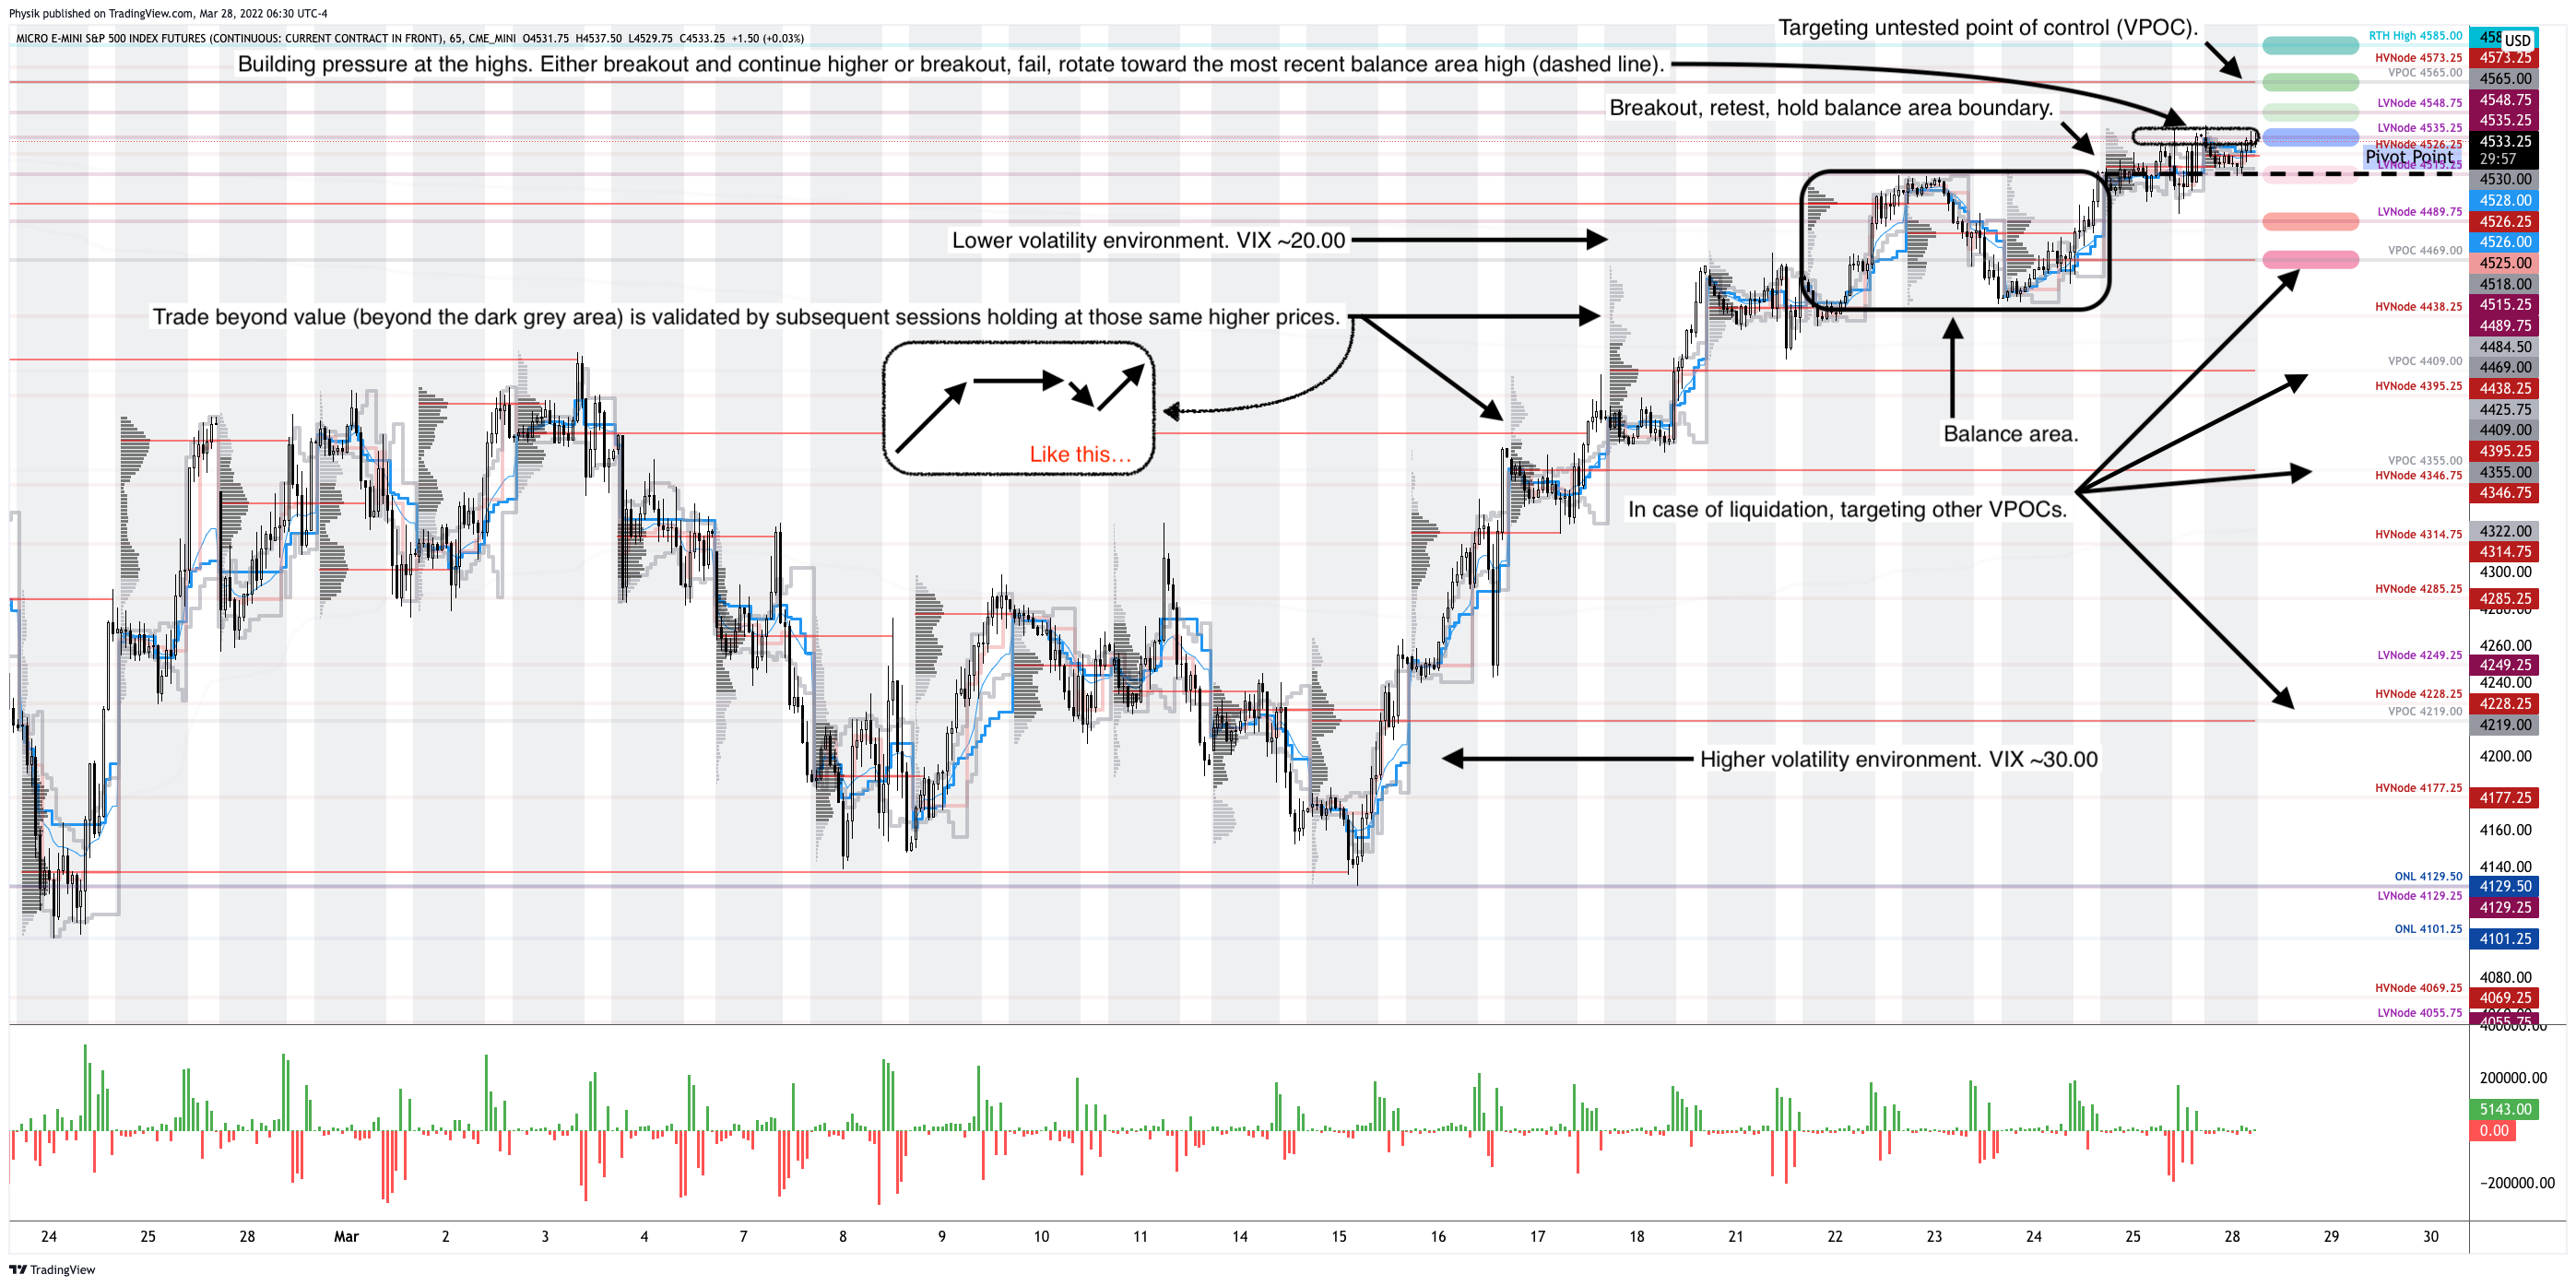
Technical: As of 6:40 AM ET, Monday’s regular session (9:30 AM – 4:00 PM ET), in the S&P 500, will likely open in the upper part of a balanced overnight inventory, inside of prior-range and -value, suggesting a limited potential for immediate directional opportunity.

In the best case, the S&P 500 trades higher; activity above the $4,535.25 low volume area (LVNode) puts in play the $4,548.75 LVNode. Initiative trade beyond the $4,548.75 LVNode could reach as high as the $4,565.00 untested point of control (VPOC) and $4,585.00 regular trade high (RTH High), or higher.

In the worst case, the S&P 500 trades lower; activity below the $4,535.25 LVNode puts in play the $4,515.25 LVNode. Initiative trade beyond the $4,515.25 LVNode could reach as low as the $4,489.75 LVNode and $4,469.00 VPOC, or lower.

Click here to load today’s key levels into the web-based TradingView charting platform. Note that all levels are derived using the 65-minute timeframe. New links are produced, daily.
Graphic: 65-minute profile chart of the Micro E-mini S&P 500 Futures.

What People Are Saying

Definitions

Volume Areas: A structurally sound market will build on areas of high volume (HVNodes). Should the market trend for long periods of time, it will lack sound structure, identified as low volume areas (LVNodes). LVNodes denote directional conviction and ought to offer support on any test. 

If participants were to auction and find acceptance into areas of prior low volume (LVNodes), then future discovery ought to be volatile and quick as participants look to HVNodes for favorable entry or exit.

POCs: POCs are valuable as they denote areas where two-sided trade was most prevalent in a prior day session. Participants will respond to future tests of value as they offer favorable entry and exit.

Balance (Two-Timeframe Or Bracket): Rotational trade that denotes current prices offer favorable entry and exit. Balance areas make it easy to spot a change in the market (i.e., the transition from two-time frame trade, or balance, to one-time frame trade, or trend). 

About

After years of self-education, strategy development, mentorship, and trial-and-error, Renato Leonard Capelj began trading full-time and founded Physik Invest to detail his methods, research, and performance in the markets.

Capelj also develops insights around impactful options market dynamics at SpotGamma and is a Benzinga reporter.

Some of his works include conversations with ARK Invest’s Catherine Wood, investors Kevin O’Leary and John Chambers, FTX’s Sam Bankman-Fried, Kai Volatility’s Cem Karsan, The Ambrus Group’s Kris Sidial, among many others.

Disclaimer

In no way should the materials herein be construed as advice. Derivatives carry a substantial risk of loss. All content is for informational purposes only.

Categories
Commentary

Daily Brief For March 23, 2022

Editor’s Note: Hey team! Thanks for all the support. I enjoy putting together these notes as it helps keep me aware of narratives that may impact my own trades.

I’ll be taking the rest of the week off (i.e., no notes till Monday most likely), focusing on other areas of the business like prep for the weeks and months to come.

Take care and trade safe,

Renato

What Happened

Overnight, equity index futures auctioned sideways to lower while commodities, bonds, and implied volatility metrics were bid.

This is in the context of a global bond market rout. Central banks intend to tighten policy in light of surging inflation; investors are selling bonds and rotating into areas that have “better upside.”

Ahead is data on new home sales (10:00 AM ET). The Federal Reserve’s (Fed) Loretta Mester speaks at 10:00 AM ET. Mary Daly follows at 11:45 AM ET.

Moreover, yesterday’s commentary carried a pessimistic tone. In hindsight, too pessimistic. The reality is that this is a market environment like no other. Certain metrics that were very reliable carry little-to-no value (predictive ability) right now. This is true for those who base much of their decision-making on “fundamental” and “technical” analyses, too.

To combat this, we zoom out and look for trades that offer asymmetric payouts. We’re careful to provide liquidity when others demand it en masse. Similarly, we are to give ourselves room for error; stops are widened and lot sizes are smaller.

Read on for today’s lighter-hearted take on what’s happening and frameworks to trade on.

Graphic updated 6:30 AM ET. Sentiment Neutral if expected /ES open is inside of the prior day’s range. /ES levels are derived from the profile graphic at the bottom of the following section. Levels may have changed since initially quoted; click here for the latest levels. SqueezeMetrics Dark Pool Index (DIX) and Gamma (GEX) calculations are based on where the prior day’s reading falls with respect to the MAX and MIN of all occurrences available. A higher DIX is bullish. At the same time, the lower the GEX, the more (expected) volatility. Learn the implications of volatility, direction, and moneyness. SHIFT data used for S&P 500 (INDEX: SPX) options activity. Note that options flow is sorted by the call premium spent; if more positive, then more was spent on call options. Breadth reflects a reading of the prior day’s NYSE Advance/Decline indicator. VIX reflects a current reading of the CBOE Volatility Index (INDEX: VIX) from 0-100.

What To Expect

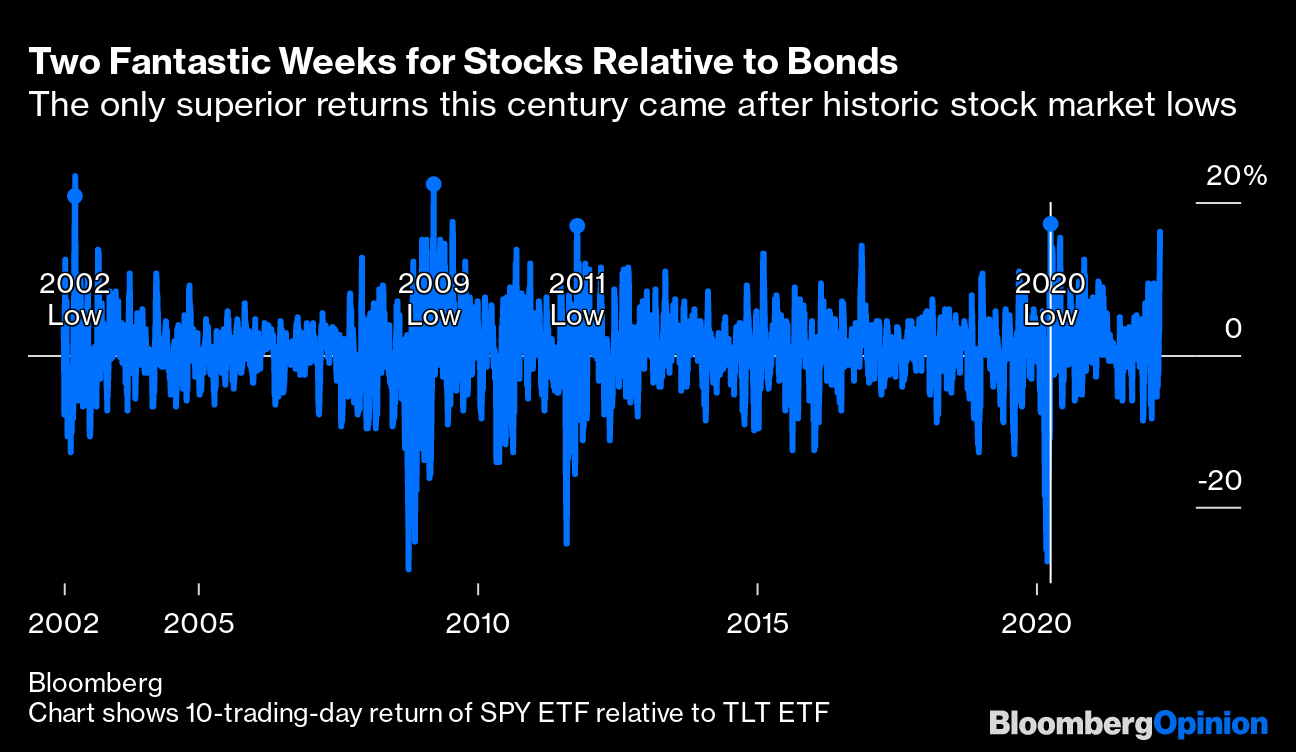
Fundamental: Bloomberg’s John Authers published a discussion on the performance of stocks, relative to bonds. Essentially, there have only been four previous two-week periods when stocks beat bonds by this much.

Graphic: Via Bloomberg. The 10-trading-day return of the SPDR S&P 500 ETF (NYSE: SPY) relative to the iShares 20 Plus Year Treasury Bond ETF (NASDAQ: TLT).

“All of the big positive moves were driven by classic stock market rebounds that proved to be durable. There was no particular move in bond yields. This is the first time a turn this dramatic has been pushed almost as much by falling bond prices as by rising stock prices.”

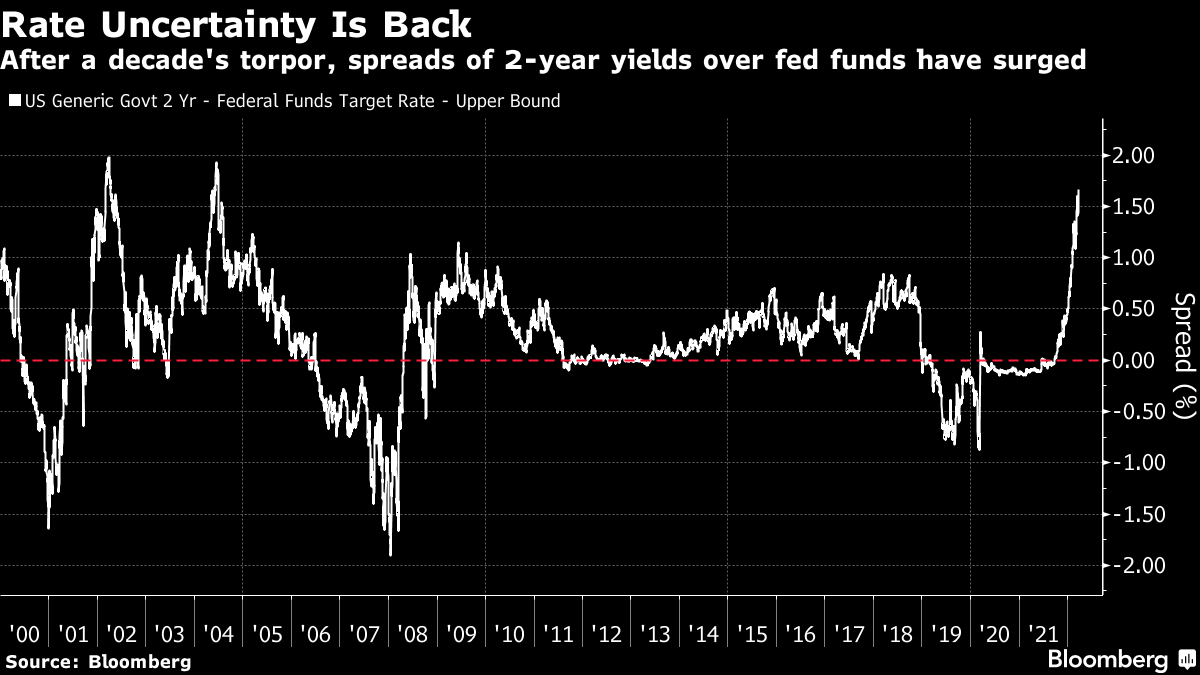
Graphic: Via Bloomberg. “The upper bound of the fed funds rate is still only 0.5%, but the two-year bond yield implies confidence that there are seven more hikes to come in that time.”

Authers explains that “equities are enjoying a false dawn as they’re recipients of the money coming out of bonds, and that we are about to be reacquainted with the bear markets in both bonds and stocks which come when rates [i.e., cost of money] have to rise to control inflation,” which impacts longer duration stocks (i.e., a stock whose value lies further in the future) most.

Graphic: Via Goldman Sachs Group Inc. Taken from The Market Ear

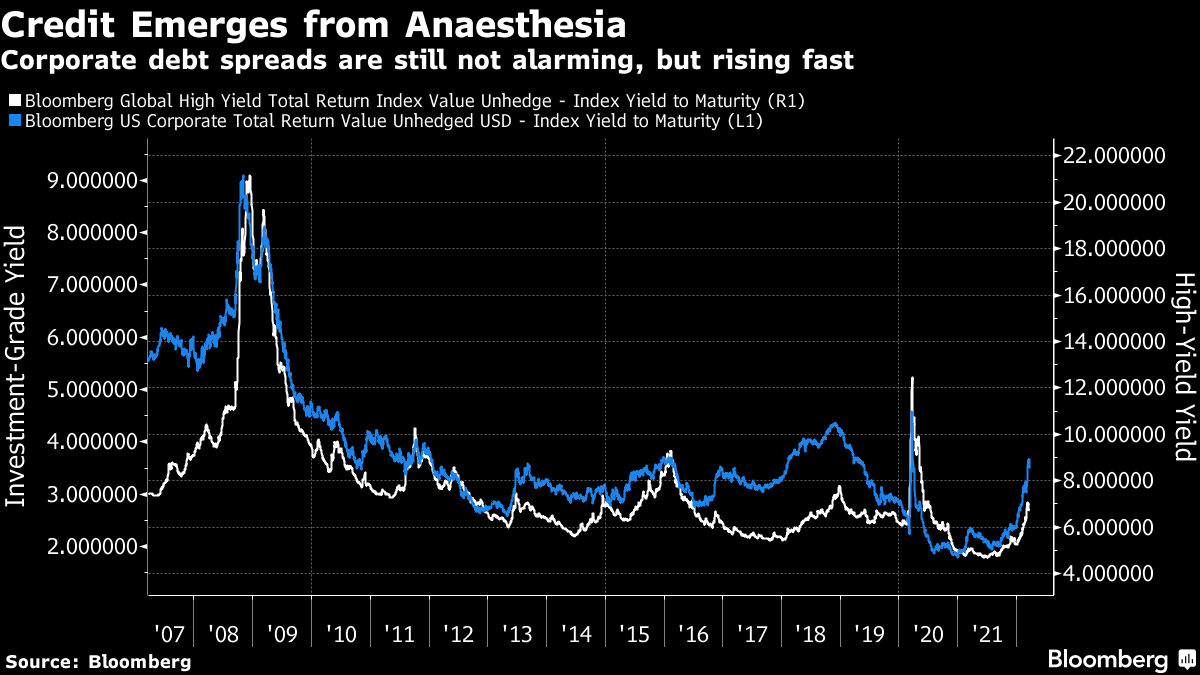
Adding, the impact of rising Treasury rates is magnified further when credit spreads (i.e., the difference in yield between bonds of similar maturities but different credit quality) also rise.

Graphic: Via Bloomberg. “But the speed with which corporate yields are rising again gives the impression of a market process that is coming around from an anaesthetic injected to help it survive the trauma of the credit crisis back in 2008.”

“The performance of stocks relative to bonds suggests we’re at the beginning of a big upswing; the absolute performance of bond yields in their own right suggests we need to bail out now before another crisis engulfs us,” Authers says.

Graphic: Via Goldman Sachs Group Inc (NYSE: GS). Taken from The Market Ear. “GS has lowered GDP a number of times over the past few weeks. Remember that during the fantastic bull from Q220 and 1 year onwards it was the flipside with GS way above consensus…”

Positioning: Dip buying serves investors well.

Graphic: Via Morgan Stanley (NYSE: MS). Taken from The Market Ear. “Buy the dip has worked well during periods of QE but has not historically worked during QT. Better to ‘buy the rally’ during QT (2018-2019), which was also the case during the 80s/90s.”

The near-vertical price rise in markets, over the last week, comes after a long period of weakness during which participants concentrated their activity in negative delta trades (which make money when markets trade lower, all else equal).

From a static delta perspective, now, there is both the covering of shorts and so-called macro buying (pointed to in the above section). 

From a dynamic delta perspective, there are the implications of volatility compression (e.g., Cboe Volatility Index [INDEX: VIX] and term structure dropping), the removal of put-heavy exposures via last week’s options expiration (OPEX), and the market’s trade higher.

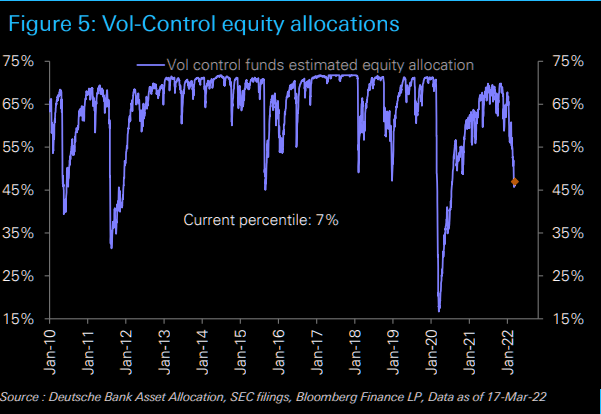
Graphic: Via Deutsche Bank AG (NYSE: DB). Taken from The Market Ear. Volatility control is the concept of managing assets “through continual rebalancing between a risky asset holding – often, but not always, equity – and cash holdings,” via The Actuary.

Taken together (short covering, macro buying, volatility compression, OPEX, and so on), the aforementioned dynamics bolster markets. It is the dynamics of positioning (demand or supply of liquidity) that magnify (add to) the velocity of moves up (or down).

Graphic: Via Refinitiv. Taken from The Market Ear. “Poor liquidity (and short gamma) magnified moves on the way down. It seems poor liquidity works both ways seeing px action during the latest squeeze.”

Earlier this week, this newsletter pointed to the potential non-sustainability of the market’s rise. This was based on metrics that have provided tremendous predictive power, in the past. 

Participants’ commitment to positive delta exposure (i.e., buying calls and selling puts), is a feature of sustained reversals. Data through Tuesday did not show this at the index level. 

As discussed by SpotGamma, yesterday, in the S&P, participants bought puts and sold calls (i.e., a negative delta trade).

This was in the context of aggressive call buying and put selling in heavily weighted index constituents like Tesla Inc (NASDAQ: TSLA).

Graphic: SpotGamma’s Hedging Impact of Real-Time Options (HIRO) indicator for TSLA.

As stated in yesterday’s commentary, markets remain vulnerable to sharp drops. In the case of further volatility suppression (e.g., customer call and put selling), counterparties will tend toward supporting markets and laying the foundation for later-dated rallies.

However, if markets trade down and volatility rises, accordingly, as participants seek protection, the potential exists for magnified moves on the way down.

Straight up could well precede straight down. A bottom (as some strategists are calling for) may take time to hammer out.

Graphic: Via Vix Central.

Technical: As of 6:30 AM ET, Wednesday’s regular session (9:30 AM – 4:00 PM ET), in the S&P 500, will likely open in the lower part of a negatively skewed overnight inventory, inside of prior-range and -value, suggesting a limited potential for immediate directional opportunity.

In the best case, the S&P 500 trades higher; activity above the $4,489.75 low volume area (LVNode) puts in play the $4,515.25 LVNode. Initiative trade beyond the $4,515.25 LVNode could reach as high as the $4,548.75 LVNode and $4,565.00 untested point of control (VPOC), or higher.

In the worst case, the S&P 500 trades lower; activity below the $4,489.75 LVNode puts in play the $4,464.75 LVNode. Initiative trade beyond the $4,464.75 LVNode could reach as low as the $4,438.25 high volume area (HVNode) and $4,409.00 VPOC, or lower.

Considerations: Push-and-pull, as well as responsiveness near key-technical areas (that are discernable visually on a chart), suggests technically-driven traders with short time horizons are very active. 

Such traders often lack the wherewithal to defend retests and, additionally, the type of trade may be indicative of the other time frame participants waiting for more information to initiate trades.

Click here to load today’s key levels into the web-based TradingView charting platform. Note that all levels are derived using the 65-minute timeframe. New links are produced, daily.
Graphic: 65-minute profile chart of the Micro E-mini S&P 500 Futures.

Definitions

Volume Areas: A structurally sound market will build on areas of high volume (HVNodes). Should the market trend for long periods of time, it will lack sound structure, identified as low volume areas (LVNodes). LVNodes denote directional conviction and ought to offer support on any test. 

If participants were to auction and find acceptance into areas of prior low volume (LVNodes), then future discovery ought to be volatile and quick as participants look to HVNodes for favorable entry or exit.

POCs: POCs are valuable as they denote areas where two-sided trade was most prevalent in a prior day session. Participants will respond to future tests of value as they offer favorable entry and exit.

About

After years of self-education, strategy development, mentorship, and trial-and-error, Renato Leonard Capelj began trading full-time and founded Physik Invest to detail his methods, research, and performance in the markets.

Capelj also develops insights around impactful options market dynamics at SpotGamma and is a Benzinga reporter.

Some of his works include conversations with ARK Invest’s Catherine Wood, investors Kevin O’Leary and John Chambers, FTX’s Sam Bankman-Fried, Kai Volatility’s Cem Karsan, The Ambrus Group’s Kris Sidial, among many others.

Disclaimer

In no way should the materials herein be construed as advice. Derivatives carry a substantial risk of loss. All content is for informational purposes only.

Categories
Commentary

Daily Brief For January 7, 2022

The Daily Brief is a free glimpse into the prevailing fundamental and technical drivers of U.S. equity market products. Join the 200+ that read this report daily, below!

What Happened

Equity index futures auctioned sideways, mostly, ahead of important economic releases such as data on Nonfarm payrolls, the unemployment rate, and average hourly earnings (8:30 AM ET), as well as Fed-speak (10:00 AM and 12:15 PM ET), and consumer credit data (3:00 PM ET).

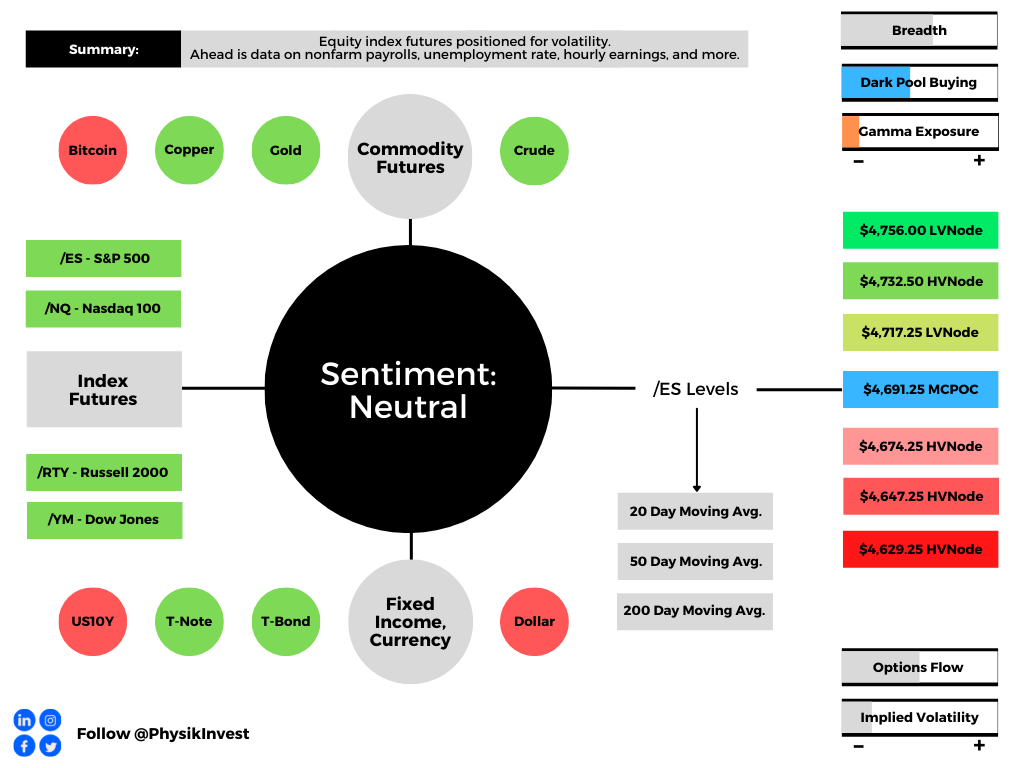
Graphic updated 6:30 AM ET. Sentiment Neutral if expected /ES open is inside of the prior day’s range. /ES levels are derived from the profile graphic at the bottom of the following section. Levels may have changed since initially quoted; click here for the latest levels. SqueezeMetrics Dark Pool Index (DIX) and Gamma (GEX) calculations are based on where the prior day’s reading falls with respect to the MAX and MIN of all occurrences available. A higher DIX is bullish. At the same time, the lower the GEX, the more (expected) volatility. Learn the implications of volatility, direction, and moneyness. SHIFT data used for S&P 500 (INDEX: SPX) options activity. Note that options flow is sorted by the call premium spent; if more positive, then more was spent on call options. Breadth reflects a reading of the prior day’s NYSE Advance/Decline indicator. VIX reflects a current reading of the CBOE Volatility Index (INDEX: VIX) from 0-100.

What To Expect

Fundamental: Participants will receive further clarity around payrolls data.

According to Bloomberg, the expectation is that Friday’s jobs report ought to show the addition of about 450,000 workers, last month. 

“[T]he so-called whisper number has already jumped to 500,000,” in light of this “Wednesday’s consensus-busting ADP Research Institute data that showed U.S. companies added the most jobs in seven months.”

This is all the while major equity indices are down on the week, “fueled by one of the most intense bouts of selling by professional speculators since the financial crisis.”

Per Goldman Sachs Group Inc (NYSE: GS) prime broker data, the sale of highly valued growth stocks reached levels not seen in more than 10 years. Selling worsened after minutes to the Federal Reserve’s last policy meeting pointed to faster hikes and balance sheet normalization.

As higher rates are to fend off inflation, they, too, have the potential to decrease the present value of future earnings making stocks (especially high growth) less attractive. 

“A strong [payrolls] print will see the market factor in hikes/quantitative tightening even earlier,” strategists at Mizuho International Plc said. “We’d therefore prefer to be positioned for more equity downside, and for higher yields.”

Positioning: Bonds down, equities down. Interesting, right?

Fresh in my mind is a conversation I had with Karan Sood, CEO and Managing Director, Head of Product Development at Cboe Vest Financial LLC, regarding his firm’s packaged options and volatility targeting strategies that help investors manage their portfolio volatility.

Moreover, over the past 40 or so years, monetary policy was used as a crutch to support the economy. This promoted deflation, innovation, and the subsequent rise in valuations.

“Bonds have been giving you really good returns because interest rates have been going down since the 1970s when they peaked at about 11%,” Sood explained to me. 

“That’s changing now; we’re at the zero bound, and it’s unlikely that will be as a strong of a tailwind. Worse, it could be a headwind if interest rates start to rise.”

As a result of this dynamic, coupled with participants’ increased exposure to rate and equity market risk which can play into cross-market hedging and de-leveraging cascades, 60/40 can be somewhat of a poor hedge.

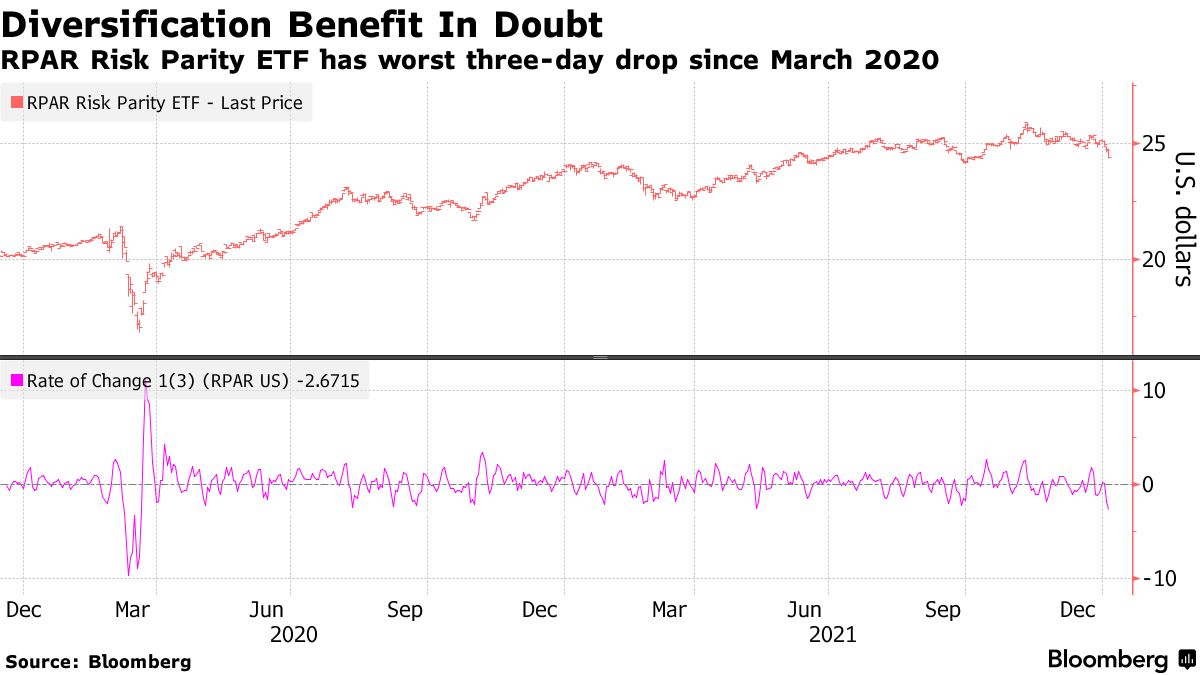
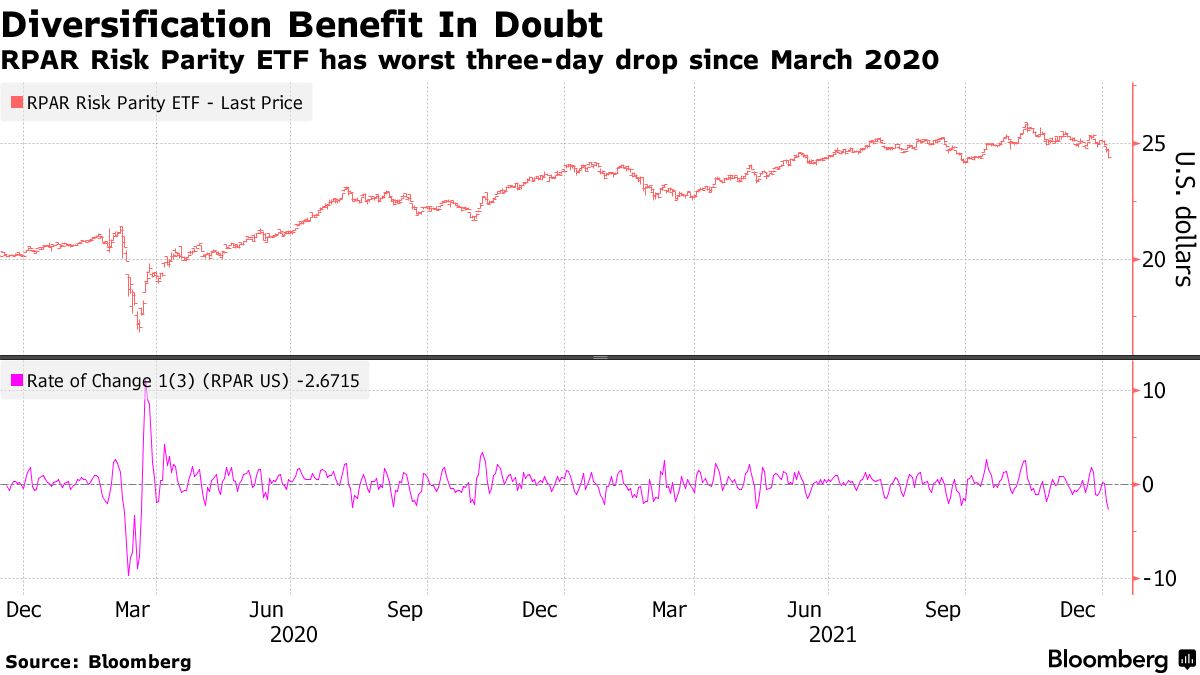
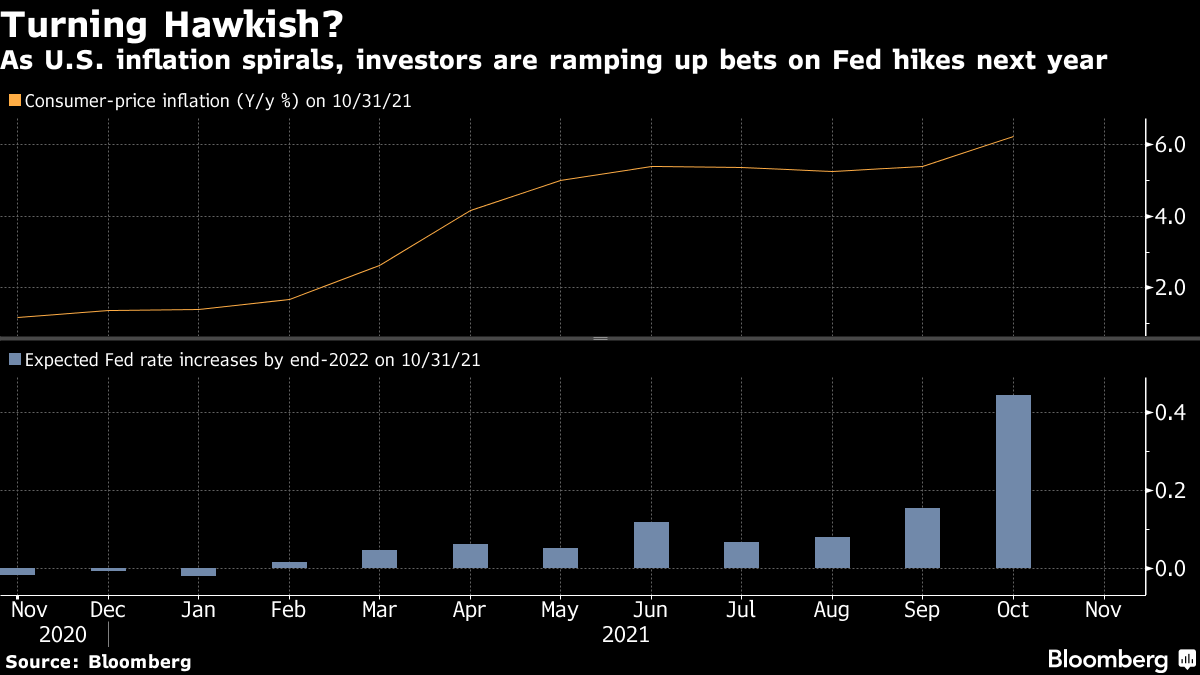
“Now, with the Fed poised to hike interest rates to combat raging inflation, the bond-stock relationship could be upended,” Bloomberg explains

“At stake are trillions of dollars that are managed at risk parity funds, balanced mutual funds, and pension funds that follow the framework of 60/40 asset allocation.”

Graphic: Via Bloomberg.

Why mention any of this? Well, it forces us to look elsewhere for protection. 

In this case, the growing asset class of volatility, so to speak, is that protection. Investors are aware of both the protective and speculative efficiency afforded to them by options and that is the primary reason option volumes are so comparable to stock volumes, now.

Notwithstanding, with option volumes higher, related hedging flows can represent an increased share of volume in underlying stocks. Therefore, the correlation of stock moves, versus options activity, is more pronounced.

To put it simply, we can look to the options market for clues on where to next, for lack of better phrasing. So, let’s do that!

Wednesday’s session unwound some of the single-stock bullishness (in stocks like Tesla) that fed into the S&P 500, itself; an expansion in volatility coincided with the demand for downside (put) protection and supply of upside (call) protection.

Conditions settled, Thursday. Though positioning metrics had little to offer in terms of predicting movement, implied volatility remained heightened and many products did not expand range.

All else equal, higher implied volatility marks up options delta (exposure to direction). 

Knowing that demand for downside protection coincides with customers indirectly taking liquidity and destabilizing the market as the participant short the put will sell underlying to neutralize risk, participants ought to keep their eye out on whether implied volatility expands or contracts.

Graphic: SqueezeMetrics details the implications of customer activity in the options market, on the underlying’s order book.

Higher implied volatility, higher delta, more selling. Hedging pressures will exacerbate weakness, as a result of real selling (as talked about above), at the index and single-stock level.

Graphic: The “Biggest tail risk to SPX isn’t any macro data/virus/war but its own options market.”

Taking into account options positioning, versus buying pressure (measured via short sales or liquidity provision on the market-making side), positioning metrics remain positively skewed, even more so than before.

Graphic: Data SqueezeMetrics. Graph via Physik Invest.

As stated yesterday, though the dip lower and demand for protection may serve to prime the market for upside (when volatility starts to compress again and counterparties unwind hedges thus supporting any attempt higher), markets will tend toward instability so long as volatility is heightened and the market remains in short-gamma territory.

Technical: As of 6:30 AM ET, Friday’s regular session (9:30 AM – 4:00 PM ET), in the S&P 500, will likely open in the middle part of a balanced overnight inventory, inside of prior-range and -value, suggesting a limited potential for immediate directional opportunity.

Spike Scenario In Play: Spike’s mark the beginning of a break from value. Spikes higher (lower) are validated by trade at or above (below) the spike base (i.e., the origin of the spike).

Spike base is at $4,761.25. Above, bullish. Below, bearish.

In the best case, the S&P 500 trades higher; activity above the $4,691.25 micro composite point of control (MCPOC) puts in play the $4,717.25 low volume area (LVNode). Initiative trade beyond the LVNode could reach as high as the $4,732.50 high volume area (HVNode) and $4,756.00 LVNode, or higher.

In the worst case, the S&P 500 trades lower; activity below the $4,691.25 MCPOC puts in play the $4,674.25 HVNode. Initiative trade beyond the latter could reach as low as the $4,647.25 and $4,629.25 HVNode, or lower.

Click here to load today’s key levels into the web-based TradingView charting platform. Note that all levels are derived using the 65-minute timeframe. New links are produced, daily.
Graphic: 65-minute profile chart of the Micro E-mini S&P 500 Futures.

What People Are Saying

Definitions

Volume Areas: A structurally sound market will build on areas of high volume (HVNodes). Should the market trend for long periods of time, it will lack sound structure, identified as low volume areas (LVNodes). LVNodes denote directional conviction and ought to offer support on any test. 

If participants were to auction and find acceptance into areas of prior low volume (LVNodes), then future discovery ought to be volatile and quick as participants look to HVNodes for favorable entry or exit.

DIX: For every buyer is a seller (usually a market maker). Using DIX — which is derived from short sales (i.e., liquidity provision on the market-making side) — we can measure buying pressure.

Gamma: Gamma is the sensitivity of an option to changes in the underlying price. Dealers that take the other side of options trades hedge their exposure to risk by buying and selling the underlying. When dealers are short-gamma, they hedge by buying into strength and selling into weakness. When dealers are long-gamma, they hedge by selling into strength and buying into weakness. The former exacerbates volatility. The latter calms volatility.

Vanna: The rate at which the delta of an option changes with respect to volatility.

Charm: The rate at which the delta of an option changes with respect to time.

Options: If an option buyer was short (long) stock, he or she would buy a call (put) to hedge upside (downside) exposure. Option buyers can also use options as an efficient way to gain directional exposure.

POCs: POCs are valuable as they denote areas where two-sided trade was most prevalent in a prior day session. Participants will respond to future tests of value as they offer favorable entry and exit.

MCPOCs: POCs are valuable as they denote areas where two-sided trade was most prevalent over numerous day sessions. Participants will respond to future tests of value as they offer favorable entry and exit.

About

After years of self-education, strategy development, mentorship, and trial-and-error, Renato Leonard Capelj began trading full-time and founded Physik Invest to detail his methods, research, and performance in the markets.

Capelj is also a Benzinga finance and technology reporter interviewing the likes of Shark Tank’s Kevin O’Leary, JC2 Ventures’ John Chambers, FTX’s Sam Bankman-Fried, and ARK Invest’s Catherine Wood, as well as a SpotGamma contributor developing insights around impactful options market dynamics.

Disclaimer

Physik Invest does not carry the right to provide advice.

In no way should the materials herein be construed as advice. Derivatives carry a substantial risk of loss. All content is for informational purposes only.
Categories
Commentary

Daily Brief For January 4, 2022

What Happened

Overnight, equity index futures auctioned higher alongside most commodities and volatility fell.

This is as investors await data on manufacturing and job openings/quits (10:00 AM ET).

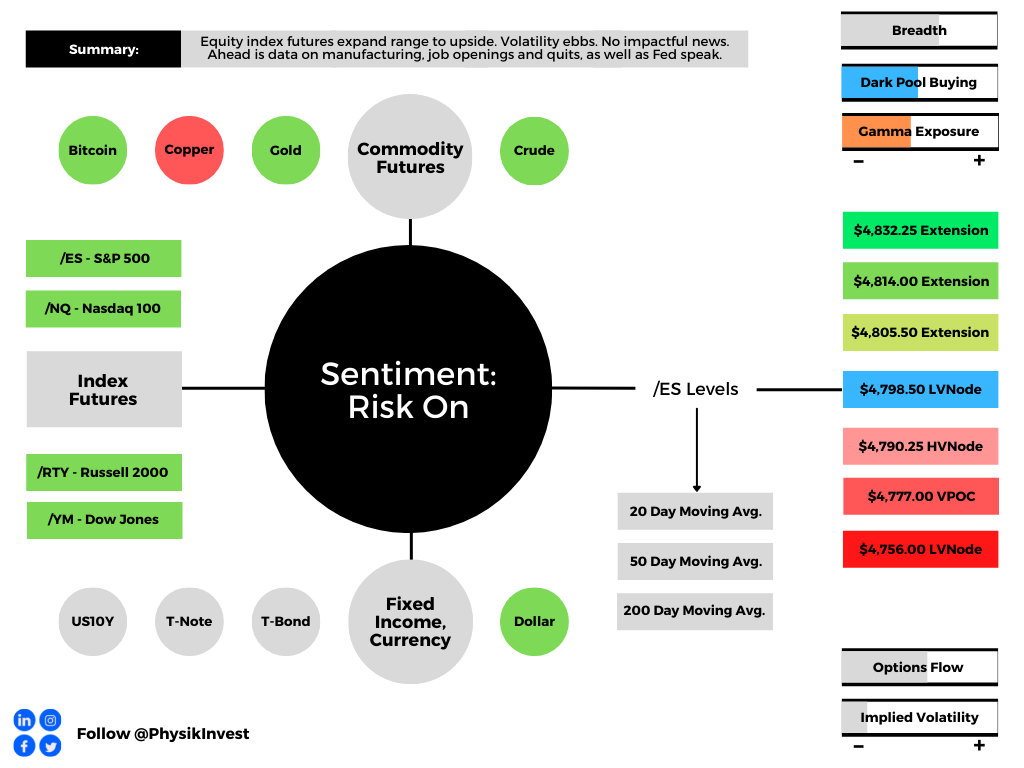
Graphic updated 6:30 AM ET. Sentiment Risk-On if expected /ES open is above the prior day’s range. /ES levels are derived from the profile graphic at the bottom of the following section. Levels may have changed since initially quoted; click here for the latest levels. SqueezeMetrics Dark Pool Index (DIX) and Gamma (GEX) calculations are based on where the prior day’s reading falls with respect to the MAX and MIN of all occurrences available. A higher DIX is bullish. At the same time, the lower the GEX, the more (expected) volatility. Learn the implications of volatility, direction, and moneyness. SHIFT data used for S&P 500 (INDEX: SPX) options activity. Note that options flow is sorted by the call premium spent; if more positive then more was spent on call options. Breadth reflects a reading of the prior day’s NYSE Advance/Decline indicator. VIX reflects a current reading of the CBOE Volatility Index (INDEX: VIX) from 0-100.

What To Expect

Fundamental: The aforementioned trade is happening in the context of a resurgence in the coronavirus, as well as the Federal Reserve’s intent to moderate stimulus, among other things. 

“We expect 2022 to be far more challenging from an investment perspective,” Heather Wald, vice president at Bel Air Investment Advisors, said

“Rarely has a market delivered three consecutive years of double-digit returns, as we have seen from 2019-2021. With the Federal Reserve set to accelerate tightening and a fairly valued stock market, we anticipate more muted returns for the S&P next year but still expect equities to remain attractive versus other liquid asset classes.” 

Wald’s comments align with some metrics posted by LPL Financial’s Ryan Detrick. 

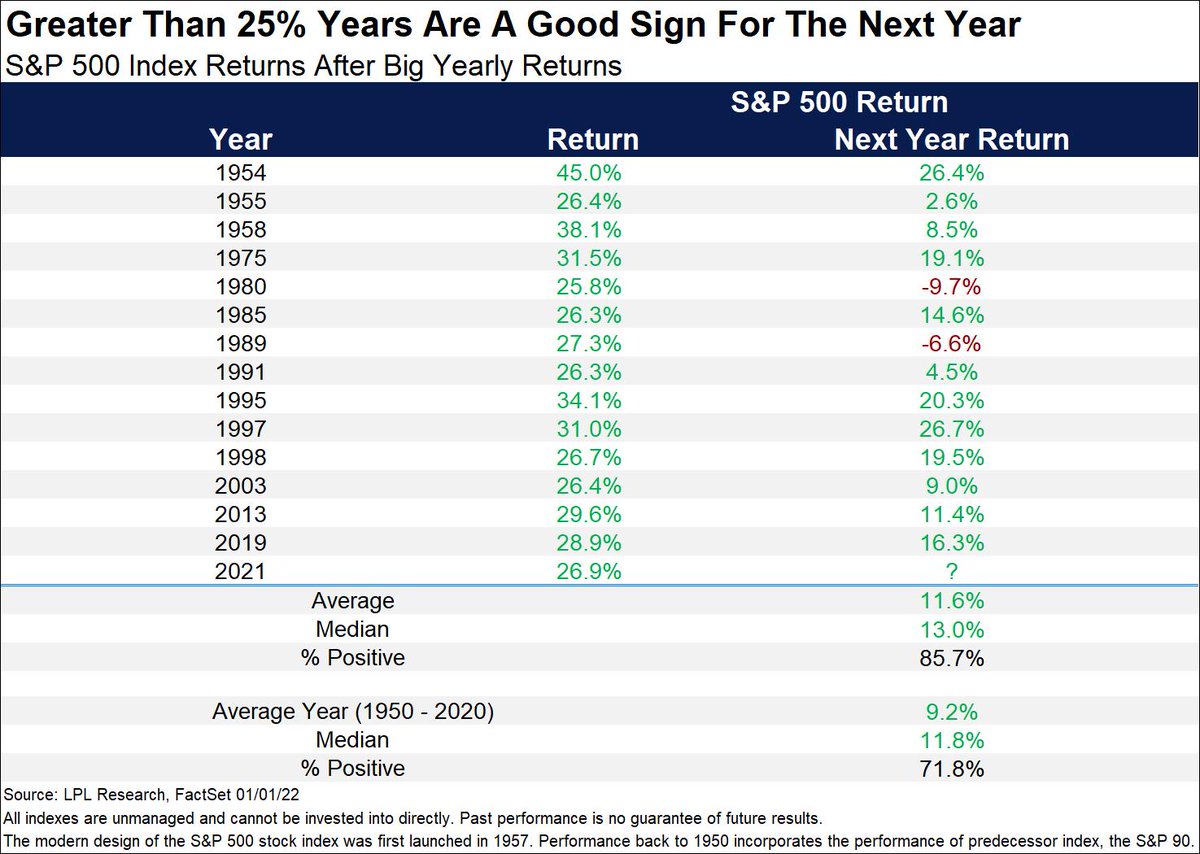
“The bad news is when the S&P 500 gains more than 25% in a year, it has never gained more the following year,” Detrick said. “The good news? That next year can still be pretty darn good. Higher 85% of the time and up a solid 11% on average.”

Graphic: S&P 500 returns via Ryan Detrick. 

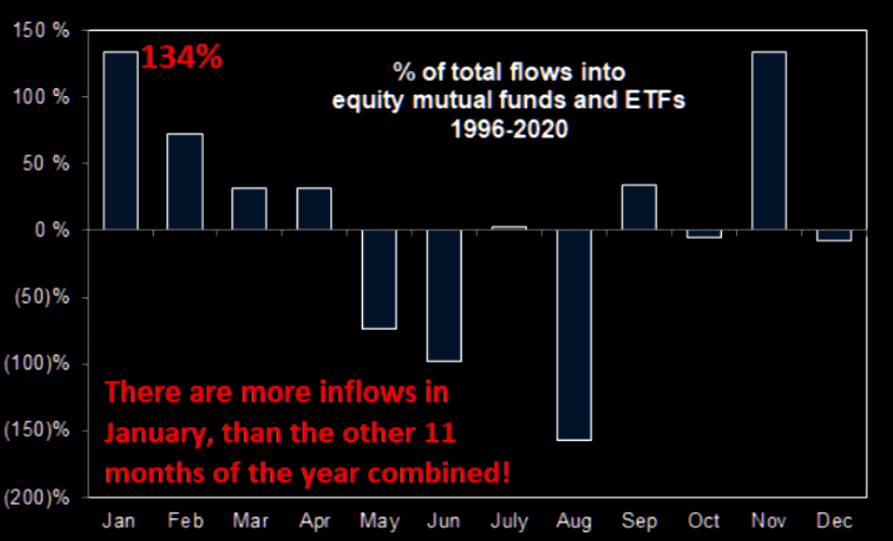
This is as the S&P 500 sticks to its seasonal script; in the face of light positioning metrics, expected are massive inflows in the first few months of this year. 

Graphic: Per The Market Ear, “January typically sees 134% of inflows (the rest of the 11 months -34%). And with every private wealth manager in the world right now pitching increased allocations into equities (out of cash and out of bonds), Goldman calculates that keeping 2021 pace, This would be $125BN worth of inflows quickly in January.”

This year is likely to be “dominated by continued knife-edge judgments by the Fed,” and inflation proving better than the most pessimistic forecasts, potentially. 

The prospects of a rally into the first rate hike are emboldened. Thereafter, the market may decline through the rest of 2022.

Positioning: Interesting Twitter thread by Kris Sidial on the transfer of risk in different areas of the volatility term structure. 

“You are seeing institutions aim to harvest the VRP in single stock land by hammering away at the front of the term structure. Especially the exotics desks that are notorious for carrying this inherent short calendar profile.”

What Sidial is talking about is most easily visualized by the compression and expansion of the VIX term structure in the graphic below. Notice the front move, relative to the back, below.

Graphic: VIX term shifts inward; as mostly short-dated protection is monetized or expired, volatility collapses and dealers’ exposure to the positive delta (via short puts) declines which meant they would cover their short futures hedges. This “vanna” flow bolsters SPX rallies.

The implications of this are staggering.

Participants, having been pushed out the risk curve, are using leverage to juice returns; option volumes are comparable to stock volumes.

As a result, related hedging flows represent an increased share of volume. 

As I once wrote in a Benzinga article: “The reflexive response by the opposing side of options trades — a result of regulatory frameworks, the low-interest-rate environment, as well as growth of the derivatives complex — causes a cascading reaction that exacerbates underlying price movements.”

Sidial adds: “[T]his short gamma profile with more and more people using derivatives will make way for the rapid moves in shorter time frames.”

That explains a lot!

Moreover, if we zoom in more narrow, today, though implied volatility “is well above its pre-COVID level across the term structure,” it is being sold at the front end.

SpotGamma data confirms this. Via the graphic below, the compression of volatility coincides with call and put selling at the index level; note, though, the increased put selling (more bullish).

Graphic: SpotGamma’s Hedging Impact of Real-Time Options (HIRO) indicator.

Participants’ activity in shorter-dated tenors (as evidenced by the compression of VIX term structure mainly at the front-end) where options are more so sensitive to changes in the underlying price, time, and volatility, is promoting choppy (but bullish) price action, for now.

With bullish activity in single stocks like Tesla Inc (which was primed for an options-driven squeeze heading into Monday) feeding into S&P positioning, alongside the removal of hedges to positioning that was pressuring stocks and indices heading into Friday OPEX, and passive buying support, there’s potentially more room for higher, to put it simply.

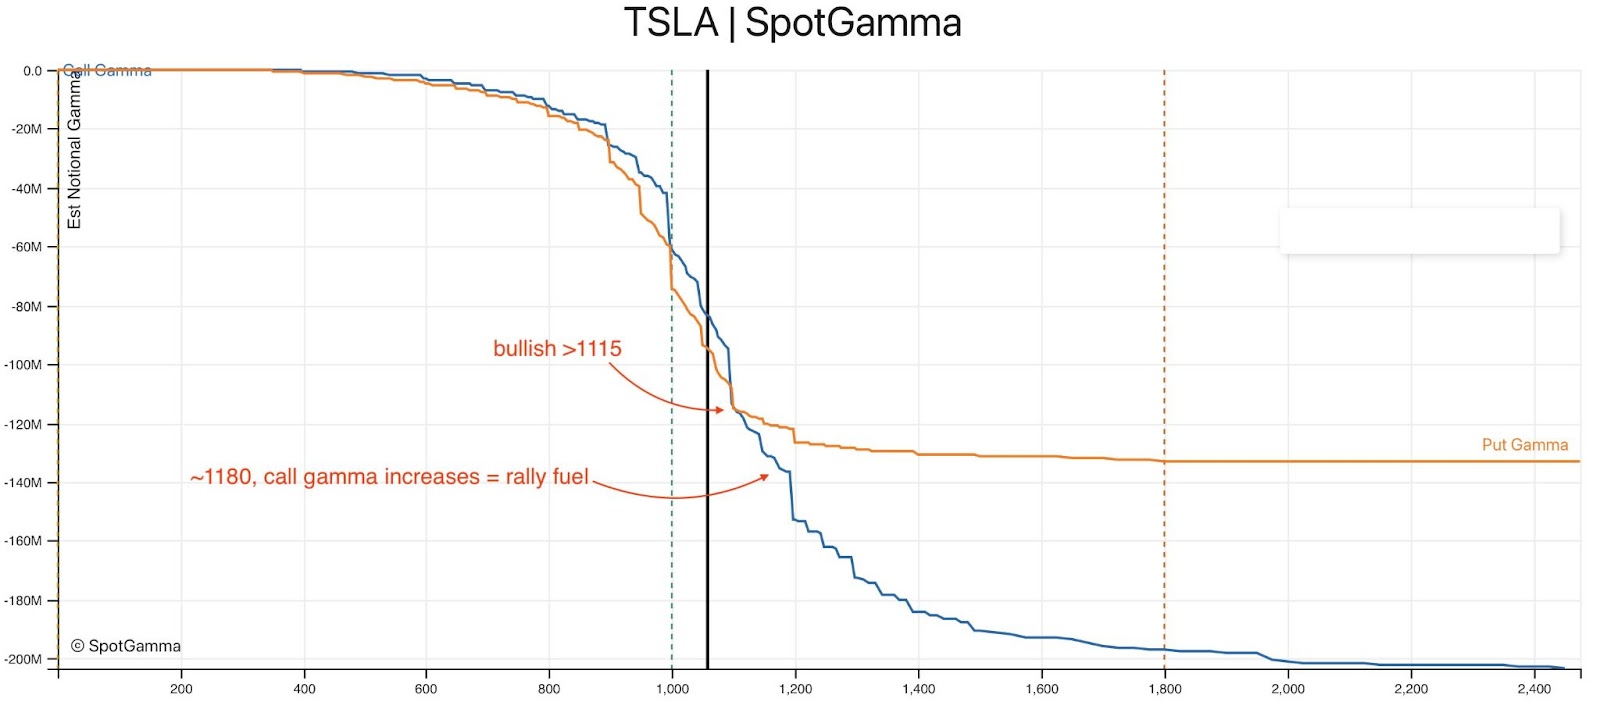
Graphic: SpotGamma posts on TSLA’s options positioning, Monday.

In the end, the concern is whether this bullishness leaves participants reaching for downside (put) protection, later. This would have destabilizing implications, as Sidial alluded to earlier.

Graphic: The “Biggest tail risk to SPX isn’t any macro data/virus/war but its own options market.”

Expectations: As of 6:30 AM ET, Tuesday’s regular session (9:30 AM – 4:00 PM ET), in the S&P 500, will likely open in the upper part of a positively skewed overnight inventory, outside of prior-range and -value, suggesting a potential for immediate directional opportunity.

Balance-Break + Gap Scenarios: A change in the market (i.e., the transition from two-time frame trade, or balance, to one-time frame trade, or trend) is occurring.

Monitor for acceptance (i.e., more than 1-hour of trade) outside of the balance area. 

Leaving value behind on a gap-fill or failing to fill a gap (i.e., remaining outside of the prior session’s range) is a go-with indicator. 

Rejection (i.e., return inside of balance) portends a move to the opposite end of the balance.

In the best case, the S&P 500 trades higher; activity above the $4,798.50 low volume area (LVNode) puts in play the $4,805.50 extension. Initiative trade beyond the $4,805.50 could reach as high as the $4,814.00 and $4,832.25 extension, or higher.

In the worst case, the S&P 500 trades lower; activity below the $4,798.50 LVNode puts in play the $4,790.25 high volume area (HVNode). Initiative trade beyond the HVNode could reach as low as the $4,777.00 untested point of control (VPOC) and $4,756.00 LVNode, or lower.

Click here to load today’s key levels into the web-based TradingView charting platform. Note that all levels are derived using the 65-minute timeframe. New links are produced, daily.
Graphic: 65-minute profile chart of the Micro E-mini S&P 500 Futures.

Definitions

Volume Areas: A structurally sound market will build on areas of high volume (HVNodes). Should the market trend for long periods of time, it will lack sound structure, identified as low volume areas (LVNodes). LVNodes denote directional conviction and ought to offer support on any test. 

If participants were to auction and find acceptance into areas of prior low volume (LVNodes), then future discovery ought to be volatile and quick as participants look to HVNodes for favorable entry or exit.

Gamma: Gamma is the sensitivity of an option to changes in the underlying price. Dealers that take the other side of options trades hedge their exposure to risk by buying and selling the underlying. When dealers are short-gamma, they hedge by buying into strength and selling into weakness. When dealers are long-gamma, they hedge by selling into strength and buying into weakness. The former exacerbates volatility. The latter calms volatility.

Vanna: The rate at which the delta of an option changes with respect to volatility.

Charm: The rate at which the delta of an option changes with respect to time.

POCs: POCs are valuable as they denote areas where two-sided trade was most prevalent in a prior day session. Participants will respond to future tests of value as they offer favorable entry and exit.

Options Expiration (OPEX): Traditionally, option expiries mark an end to pinning (i.e, the theory that market makers and institutions short options move stocks to the point where the greatest dollar value of contracts will expire) and the reduction dealer gamma exposure.

Volume-Weighted Average Prices (VWAPs): A metric highly regarded by chief investment officers, among other participants, for quality of trade. Additionally, liquidity algorithms are benchmarked and programmed to buy and sell around VWAPs.

Rates: Low rates have to potential to increase the present value of future earnings making stocks, especially those that are high growth, more attractive. To note, inflation and rates move inversely to each other. Low rates stimulate demand for loans (i.e., borrowing money is more attractive).

About

After years of self-education, strategy development, mentorship, and trial-and-error, Renato Leonard Capelj began trading full-time and founded Physik Invest to detail his methods, research, and performance in the markets.

Capelj is also a Benzinga finance and technology reporter interviewing the likes of Shark Tank’s Kevin O’Leary, JC2 Ventures’ John Chambers, FTX’s Sam Bankman-Fried, and ARK Invest’s Catherine Wood, as well as a SpotGamma contributor developing insights around impactful options market dynamics.

Disclaimer

At this time, Physik Invest does not carry the right to provide advice. 

In no way should the materials herein be construed as advice. Derivatives carry a substantial risk of loss. All content is for informational purposes only.
Categories
Commentary

Daily Brief For December 10, 2021

What Happened

Overnight, equity index futures staged a reversal, auctioning back from yesterday’s knee-jerk liquidation toward intraday value, the levels at which 70% of Thursday’s volume transacted.

Ahead is data on the Consumer Price Index (CPI) and Core Inflation (8:30 AM ET), University of Michigan Consumer Sentiment and Expected Inflation (10:00 AM ET), as well as the Federal Budget (2:00 PM ET).

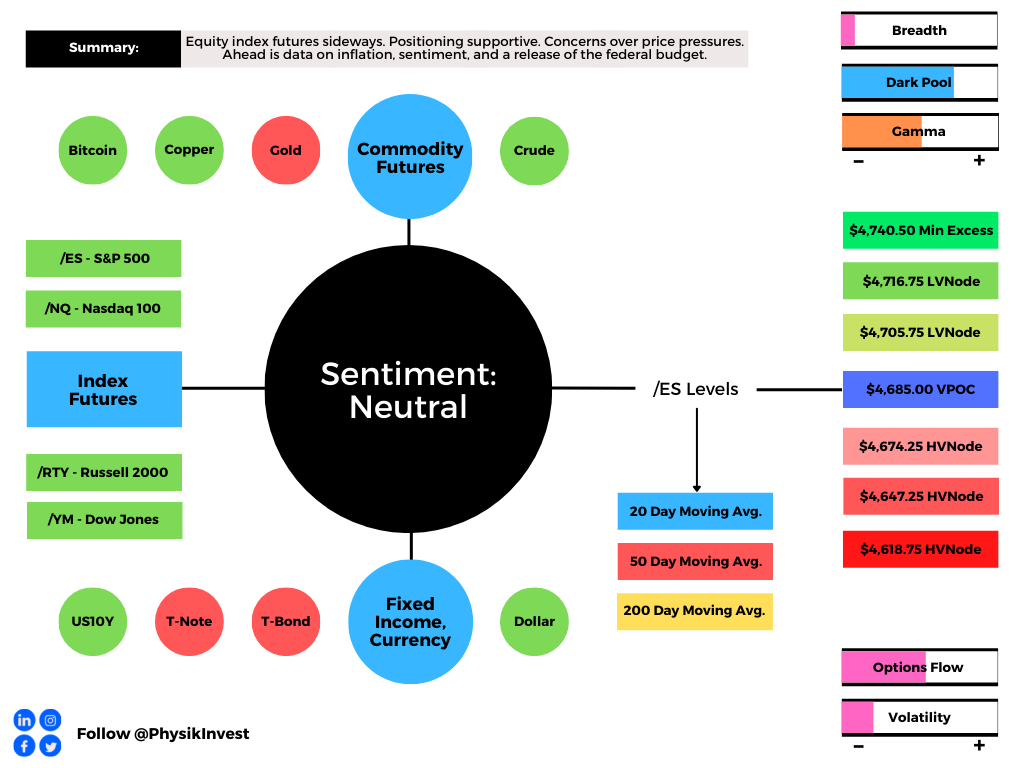
Graphic updated 6:40 AM ET. Sentiment Neutral if expected /ES open is inside of the prior day’s range. /ES levels are derived from the profile graphic at the bottom of the following section. Levels may have changed since initially quoted; click here for the latest levels. SqueezeMetrics Dark Pool Index (DIX) and Gamma (GEX) calculations are based on where the prior day’s reading falls with respect to the MAX and MIN of all occurrences available. A higher DIX is bullish. At the same time, the lower the GEX, the more (expected) volatility. Learn the implications of volatility, direction, and moneyness. SHIFT data used for S&P 500 (INDEX: SPX) options activity. Note that options flow is sorted by the call premium spent; if more positive then more was spent on call options. Breadth reflects a reading of the prior day’s NYSE Advance/Decline indicator. VIX reflects a current reading of the CBOE Volatility Index (INDEX: VIX) from 0-100.

What To Expect

After a multi-day pin against the S&P 500 $4,700.00 area, on weak intraday breadth and market liquidity metrics, the worst-case outcome occurred; participants moved the index away from its intraday value, the levels at which participants found it most favorable to trade at.

As noted in past commentaries, participants’ discovery of higher prices left poor structure; both Monday and Tuesday’s sessions left gaps and p-shaped emotional, multiple-distribution profile structures (i.e., old-money shorts covering).

Thursday’s end-of-day liquidation, ahead of new data on inflation, brought the S&P 500 into a pocket of low volume (LVNode) that participants quickly rejected overnight.

This rejection suggests participants responsively bought the move lower; more information is needed to warrant an expansion of range in either direction.

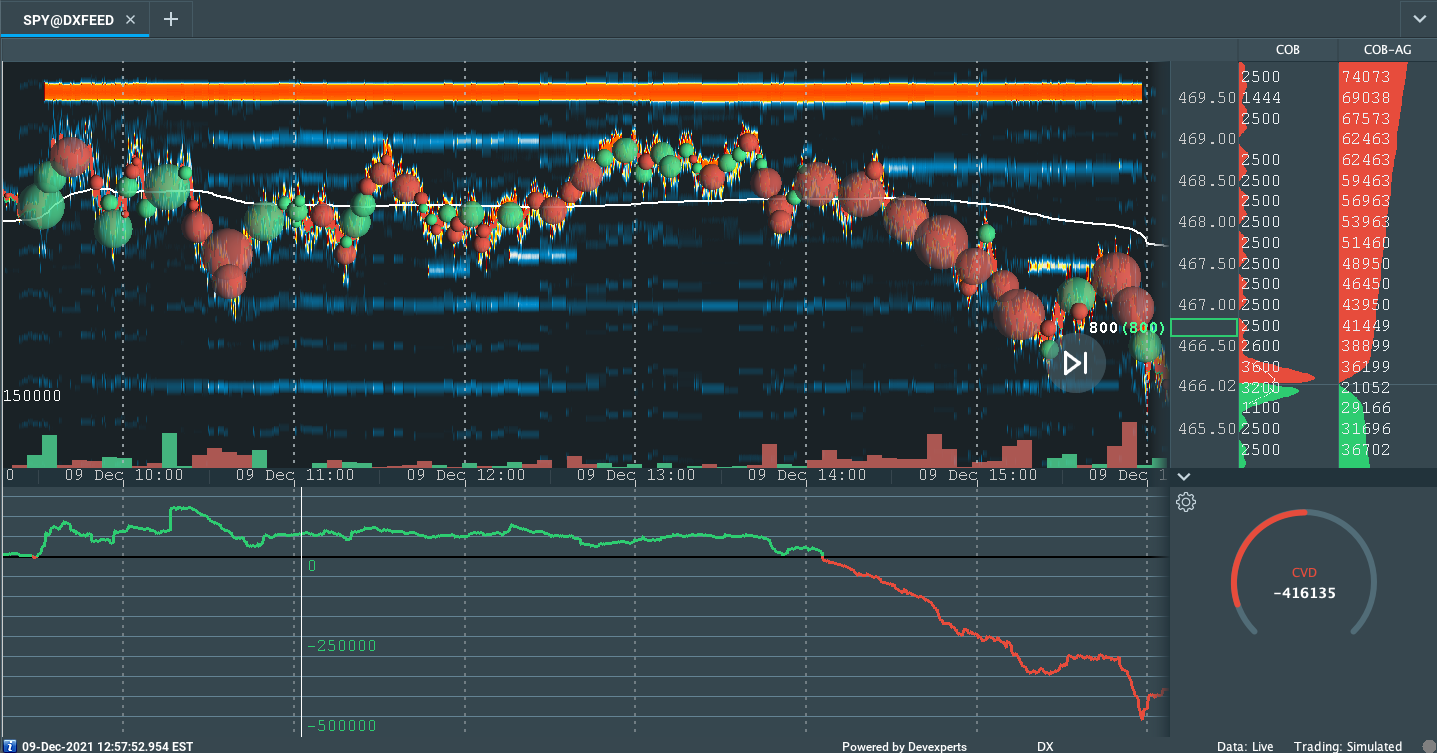
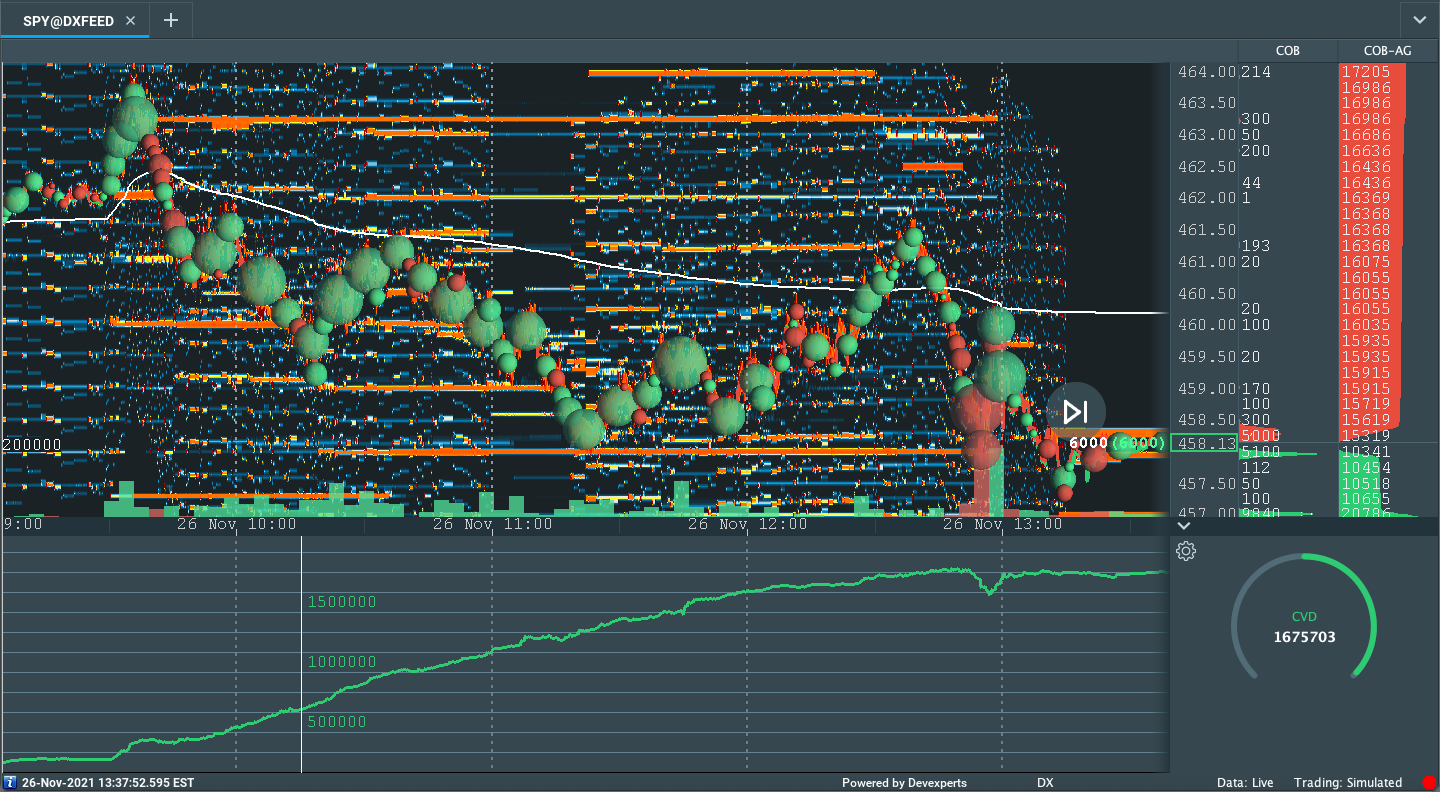
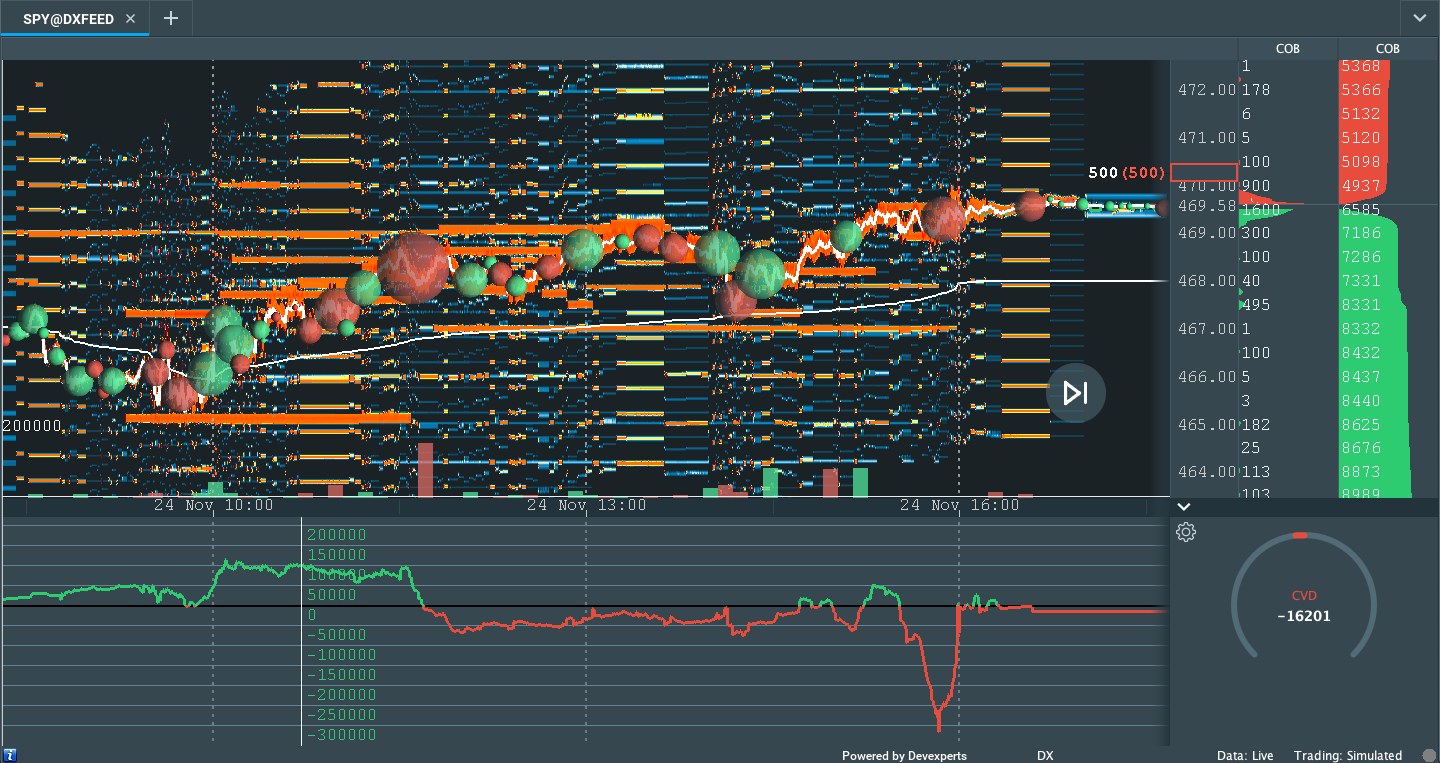
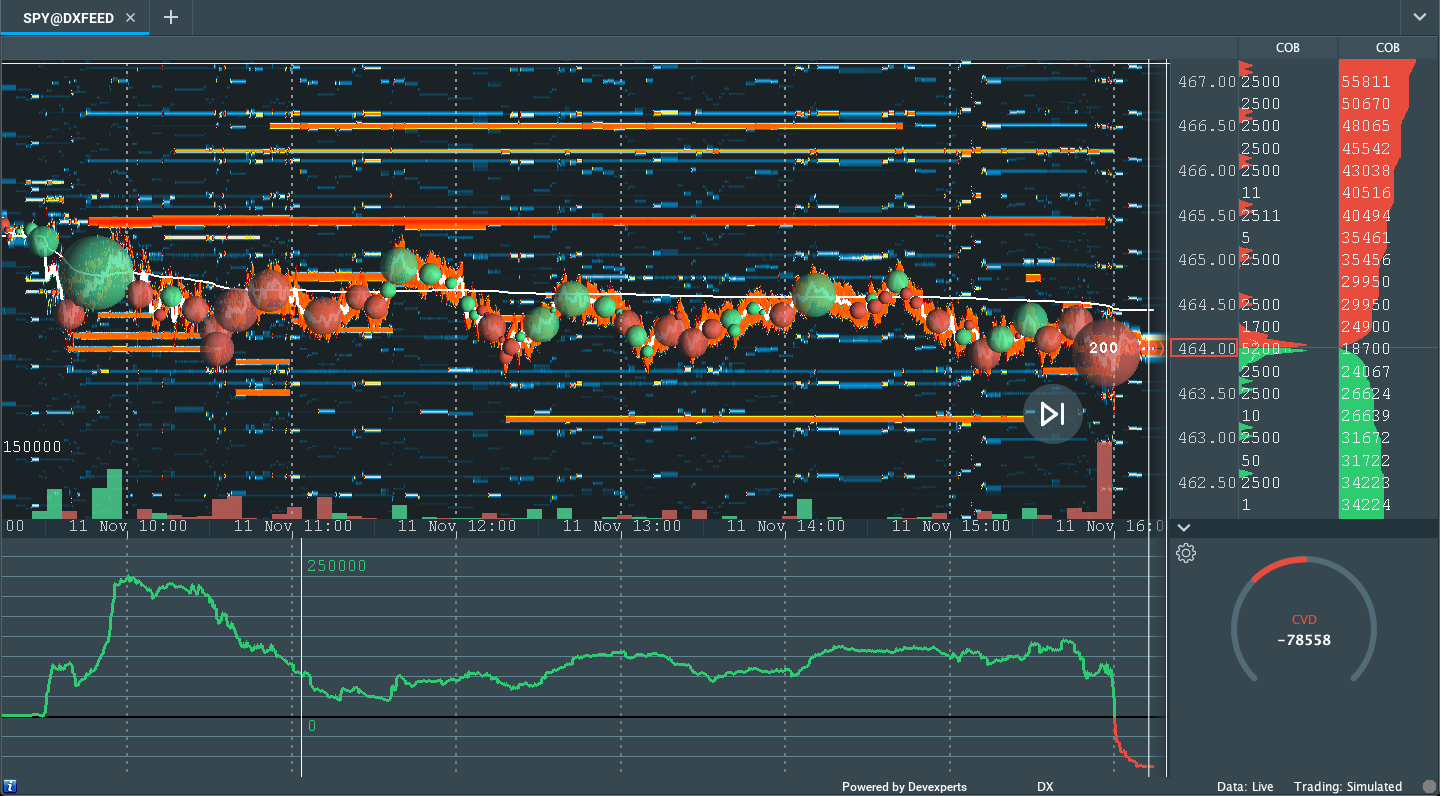
Graphic: Supportive delta (i.e., committed end-of-day selling as measured by volume delta or buying and selling power as calculated by the difference in volume traded at the bid and offer) in SPDR S&P 500 ETF Trust (NYSE: SPY), one of the largest ETFs that track the S&P 500 index, via Bookmap

Context: Inflation is key in gauging monetary policy. 

Per Bloomberg, a CPI figure above (below) of 7% likely sparks a risk-off (risk-on) move.

Either way, next week the Fed ought to announce an acceleration in its taper to bond-buying. 

Upon an end to the taper, there ought to be a tightening; William Dudley, a former New York Fed governor, believes there will be three 0.25-percentage-point rate increases next year. 

In 2023, Dudley sees four rate hikes that bring the median target rate to 1.8%, and then, the target rate will reach 2.5% in 2024.

Rising rates, among other factors, have the potential to decrease the present value of future earnings, thereby making stocks, especially those that are high growth, less attractive.

Higher inflation prints, today, could spark a risk-off move as participants price in more aggressive change to the monetary frameworks and liquidity provision that promoted a large divergence in price form fundamentals.

“[T]he Fed may be making a policy error by essentially overweighting a fight against inflation versus supporting growth,” Bank of America’s (NYSE: BAC) Mark Cabana explained.

Participants are “worried that the Fed is going to be tightening into supply-constrained inflation and reduction of consumer purchasing power and they’re doing that because they’re worried risk assets may be very sensitive to rate levels.”

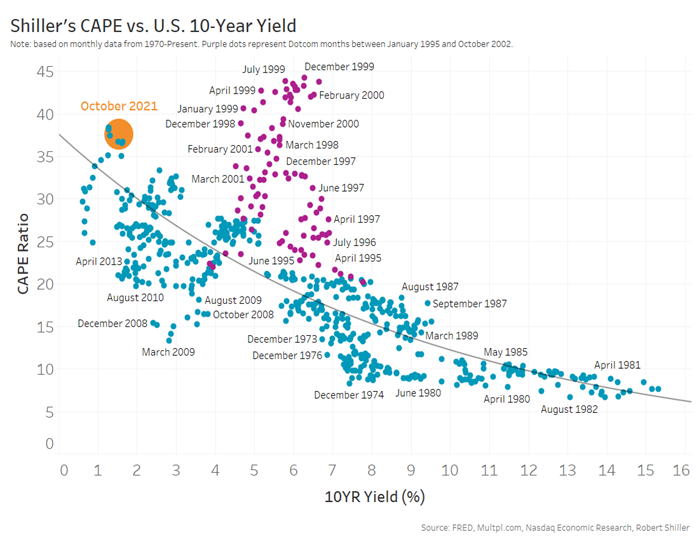
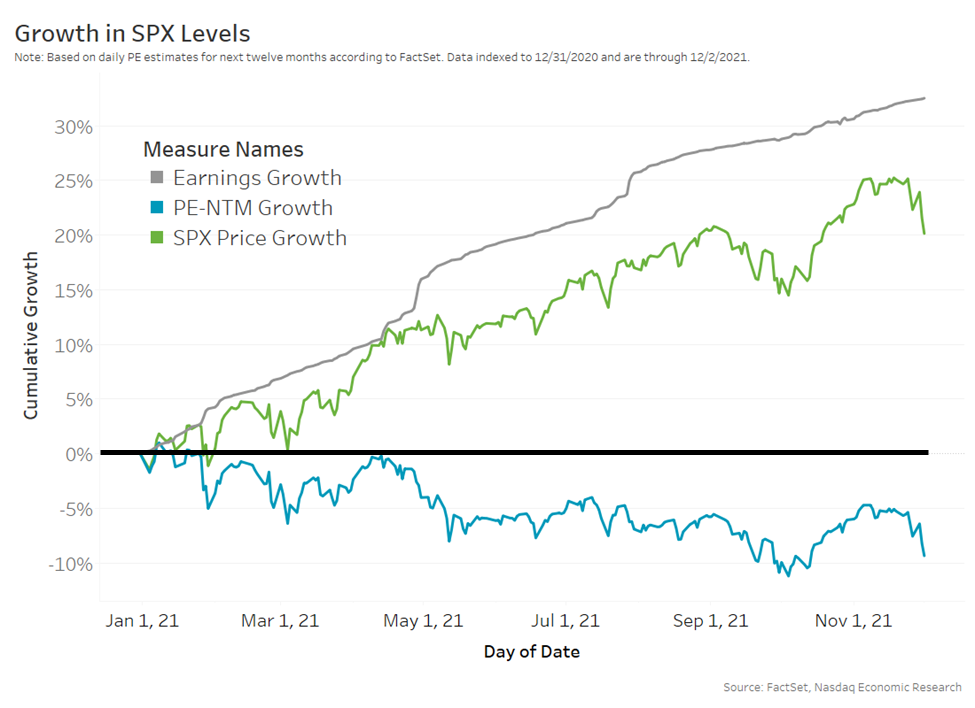
Despite the doom and gloom, it’s worth noting that today’s rates and earnings support validations better than in the ‘90s.

The “growth in earnings is so far stronger than the multiple compression caused by rising rates (blue line),” and that will continue to bolster any rally attempt.

Graphic: Low rates support current valuations better than the ‘90s, according to Nasdaq.

Still, that intent to moderate stimulus serves as a headwind and some high-growth names have been weakening.

For instance, as shares of Tesla Inc (NASDAQ: TSLA) declined, yesterday, SpotGamma data suggested participants were seeking downside protection, in size.

Due to an environment wherein the counterparties to customer option trades buy (sell) into weakness (strength), indices are pinned.

“[D]ealer hedging has suppressed index level volatility, but underlying components are [] exhibiting idiosyncratic volatility,” as one paper puts it.

“The only reconciliation is a decline in correlation.”

If that activity in highly-weighted constituents like Tesla was to feed into the indices, the effects would be destabilizing.

However, in regards to positioning metrics, at present, the return distribution is skewed positive.

Adding, if participants are assuaged of their fears at next week’s Federal Open Market Committee (FOMC) meeting, a collapse in event-related implied volatility ought to bring in positive flows as the long delta (from dealers’ exposure to short puts) decreases; the decrease in dealer supply (short delta), via covering of short stock/futures hedges, would bolster any attempt higher. See below.

Expectations: As of 6:40 AM ET, Friday’s regular session (9:30 AM – 4:00 PM ET), in the S&P 500, will likely open in the upper part of a positively skewed overnight inventory, inside of prior-range and -value, suggesting a limited potential for immediate directional opportunity.

Balance Expected: Rotational trade that denotes current prices offer favorable entry and exit. 

Balance-areas make it easy to spot a change in the market (i.e., the transition from two-time frame trade, or balance, to one-time frame trade, or trend). 

Modus operandi is responsive trade (i.e., fade the edges), rather than initiative trade (i.e., play the break).

In the best case, the S&P 500 trades sideways or higher; activity above the $4,685.00 untested point of control (VPOC) puts in play the $4,705.75 LVNode. Initiative trade beyond the LVNode could reach as high as the $4,716.75 LVNode and $4,740.50 minimal excess high, or higher.

In the worst case, the S&P 500 trades lower; activity below the $4,685.00 VPOC puts in play the $4,674.25 HVNode. Initiative trade beyond the HVNode could reach as low as the $4,647.25 and $4,618.75 HVNode, or lower.

Click here to load today’s key levels into the web-based TradingView charting platform. Note that all levels are derived using the 65-minute timeframe. New links are produced, daily.
Graphic: 65-minute profile chart of the Micro E-mini S&P 500 Futures. Learn about the profile.

What People Are Saying

Definitions

Cave-Fill Process: Widened the area deemed favorable to transact at by an increased share of participants. This is a good development.

Volume Areas: A structurally sound market will build on areas of high volume (HVNodes). Should the market trend for long periods of time, it will lack sound structure, identified as low volume areas (LVNodes). LVNodes denote directional conviction and ought to offer support on any test. 

If participants were to auction and find acceptance into areas of prior low volume (LVNodes), then future discovery ought to be volatile and quick as participants look to HVNodes for favorable entry or exit.

POCs: POCs are valuable as they denote areas where two-sided trade was most prevalent in a prior day session. Participants will respond to future tests of value as they offer favorable entry and exit.

Value-Area Placement: Perception of value unchanged if value overlapping (i.e., inside day). Perception of value has changed if value not overlapping (i.e., outside day). Delay trade in the former case.

Excess: A proper end to price discovery; the market travels too far while advertising prices. Responsive, other-timeframe (OTF) participants aggressively enter the market, leaving tails or gaps which denote unfair prices.

About

After years of self-education, strategy development, and trial-and-error, Renato Leonard Capelj began trading full-time and founded Physik Invest to detail his methods, research, and performance in the markets.

Additionally, Capelj is a Benzinga finance and technology reporter interviewing the likes of Shark Tank’s Kevin O’Leary, JC2 Ventures’ John Chambers, and ARK Invest’s Catherine Wood, as well as a SpotGamma contributor, helping develop insights around impactful options market dynamics.

Disclaimer

At this time, Physik Invest does not carry the right to provide advice. In no way should the materials herein be construed as advice. Derivatives carry a substantial risk of loss. All content is for informational purposes only.
Categories
Commentary

Daily Brief For December 3, 2021

What Happened

Overnight, equity index futures auctioned in-sync, within the confines of yesterday’s recovery. 

This is as participants position themselves for Friday’s data dump that may shed light on how fast the Federal Reserve (Fed) intends to tighten monetary policy.

Ahead is data on nonfarm payrolls, the unemployment rate, and average hourly earnings (8:30 AM ET). Later is Fed-speak by James Bullard (9:15 AM ET), Markit services PMI (9:45 AM ET), as well as ISM services, factory orders, and core capital goods orders (10:00 AM ET).

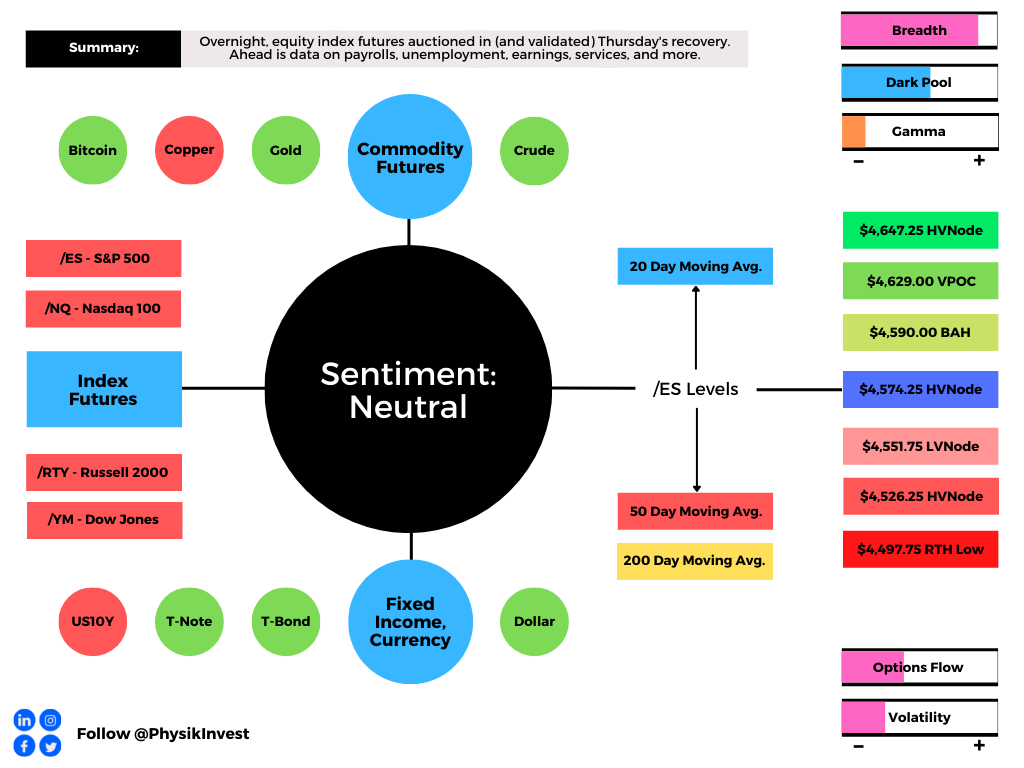
Graphic updated 6:45 AM ET. Sentiment Neutral if expected /ES open is inside of the prior day’s range. /ES levels are derived from the profile graphic at the bottom of the following section. Levels may have changed since initially quoted; click here for the latest levels. SqueezeMetrics Dark Pool Index (DIX) and Gamma (GEX) calculations are based on where the prior day’s reading falls with respect to the MAX and MIN of all occurrences available. A higher DIX is bullish. At the same time, the lower the GEX, the more (expected) volatility. Learn the implications of volatility, direction, and moneyness. SHIFT data used for S&P 500 (INDEX: SPX) options activity. Note that options flow is sorted by the call premium spent; if more positive then more was spent on call options. Breadth reflects a reading of the prior day’s NYSE Advance/Decline indicator. VIX reflects a current reading of the CBOE Volatility Index (INDEX: VIX) from 0-100.

What To Expect

In the face of strong intraday breadth, the best case outcome occurred, evidenced by the recovery of Wednesday’s value (i.e., the prices at which 70% of that day’s volume occurred).

This action negated the knee-jerk selling that coincided with COVID-19 variant news.

As a result, the S&P 500 is back inside of a short-term consolidation; participants had no interest in transacting the S&P 500 on prices advertised below the balance area.

Context: The Fed’s intent to moderate stimulus and uncertainty with regards to how a new COVID-19 variant will impact the global recovery.

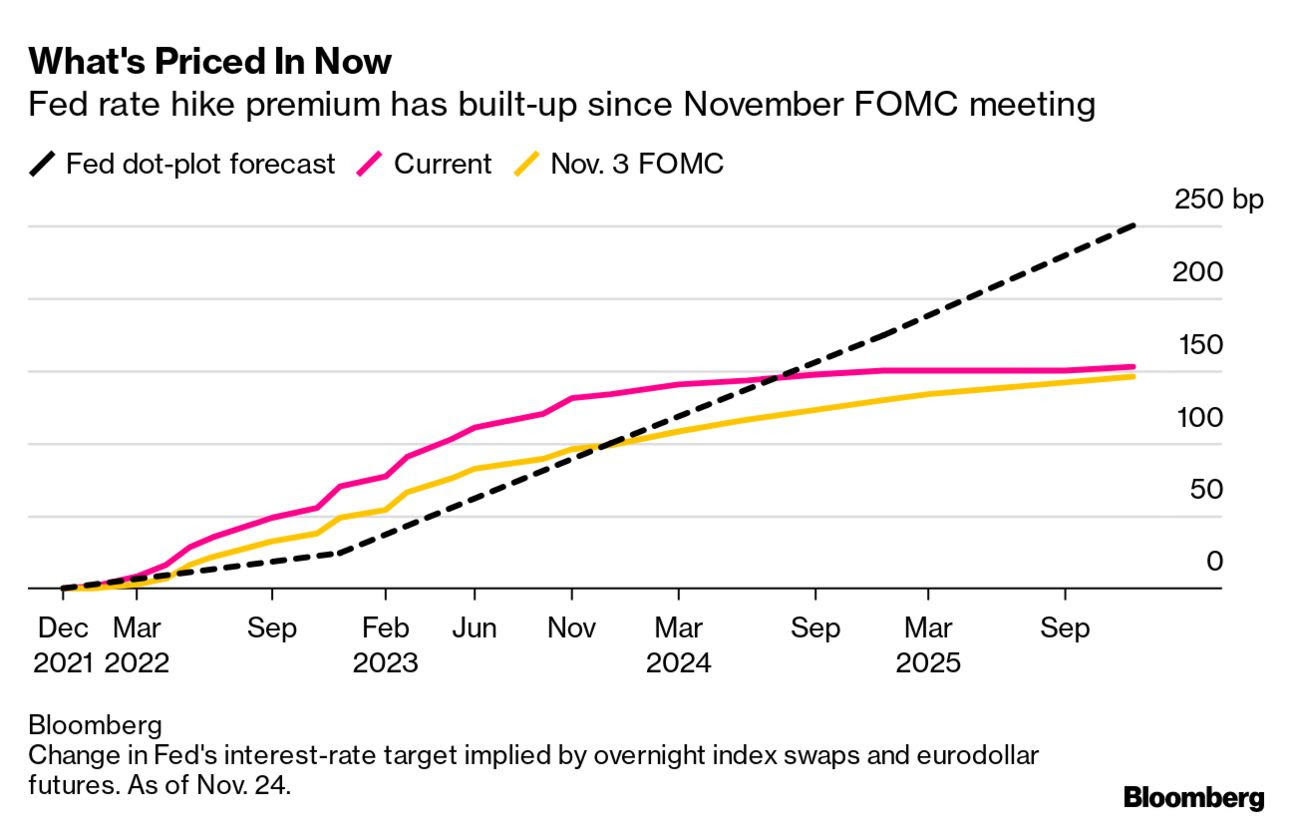
In the face of it all, according to Bloomberg, “The market is again pricing June 2022 as the most likely timing for the first Fed rate hike, same as on Nov. 24. At various stages over the intervening days traders looked at July, or even as late as September.”

This is as an emerging trend from the Fed, confirmed by Chair Jerome Powell’s Congressional testimony – for weeks into this most recent equity – resulted in a re-pricing of bond market risk. 

That fear – demand for protection in the bond market – failed to appear in the equity market. 

Instead, there was an insatiable appetite for stocks, according to Bloomberg, with investors pouring more cash in 2021 than in the past 19 years, combined. 

That appetite for risk fed into the activity of some high-flyers like Tesla Inc (NASDAQ: TSLA), and, more recently Apple Inc (NASDAQ: AAPL). At the same time, the broader market was weakening, evidenced by a decline in breadth. 

With indices pinned, heading into the November monthly options expiration (OPEX), as a result of sticky and supportive hedging flows, correlations declined. 

Think about it. If heavily weighted index constituents are higher and the indices are pinned, then something has to give! 

After OPEX, the removal of certain hedging flows had the market succumb to fundamental forces. The addition of participants’ underexposure to downside put protection, according to SpotGamma, resulted in more rampant two-way volatility.

The reason being? The market quickly entered into an environment known as short-gamma. 

“What the heck is that? Please explain to me like I’m ten.” Okay, hold my beer.

Basically, funds holding long equity, in the interest of lower volatility returns, hedge. The S&P 500 is a benchmark and one of the best places to hedge, given liquidity, and so on.

These participants will sell calls against their long equity exposure. The proceeds from that sale will be put toward downside protection. Long equity, short call, long put. Get it?

The counterparty to this dominant positioning is a buyer (seller) of upside (downside) protection, a carry trade (i.e., long delta). 

This exposure is hedged, yes! However, this exposure will also decay, in time, all else equal. 

Volatility will slide down its term structure (vanna) and time will pass (charm); “as volatility ebbs and time passes, the unwind of these hedges brings in positive flows that can lead to lengthy sprints.” – Cem Karsan of Kai Volatility.

Now, within a certain range, said counterparties are, long-gamma also. Gamma is basically “the rate of change of delta per 1-point move in the underlying,” according to SqueezeMetrics.

As volatility and time to expiration decline, the gamma of at-the-money options rises; “option market-makers will hedge their positions in a fashion that stifles volatility (buying into lows, selling into highs).”

There are times, also, when the market is in a short-gamma; a “negative [gamma] implies the opposite (selling into lows, buying into highs), thus magnifying market volatility.”

With participants underexposed to downside protection, post-OPEX demand kicked the market into short-gamma; the conditions worsened when much of the activity was concentrated in shorter-dated tenors where the sensitivity of options to direction is higher, as stated.

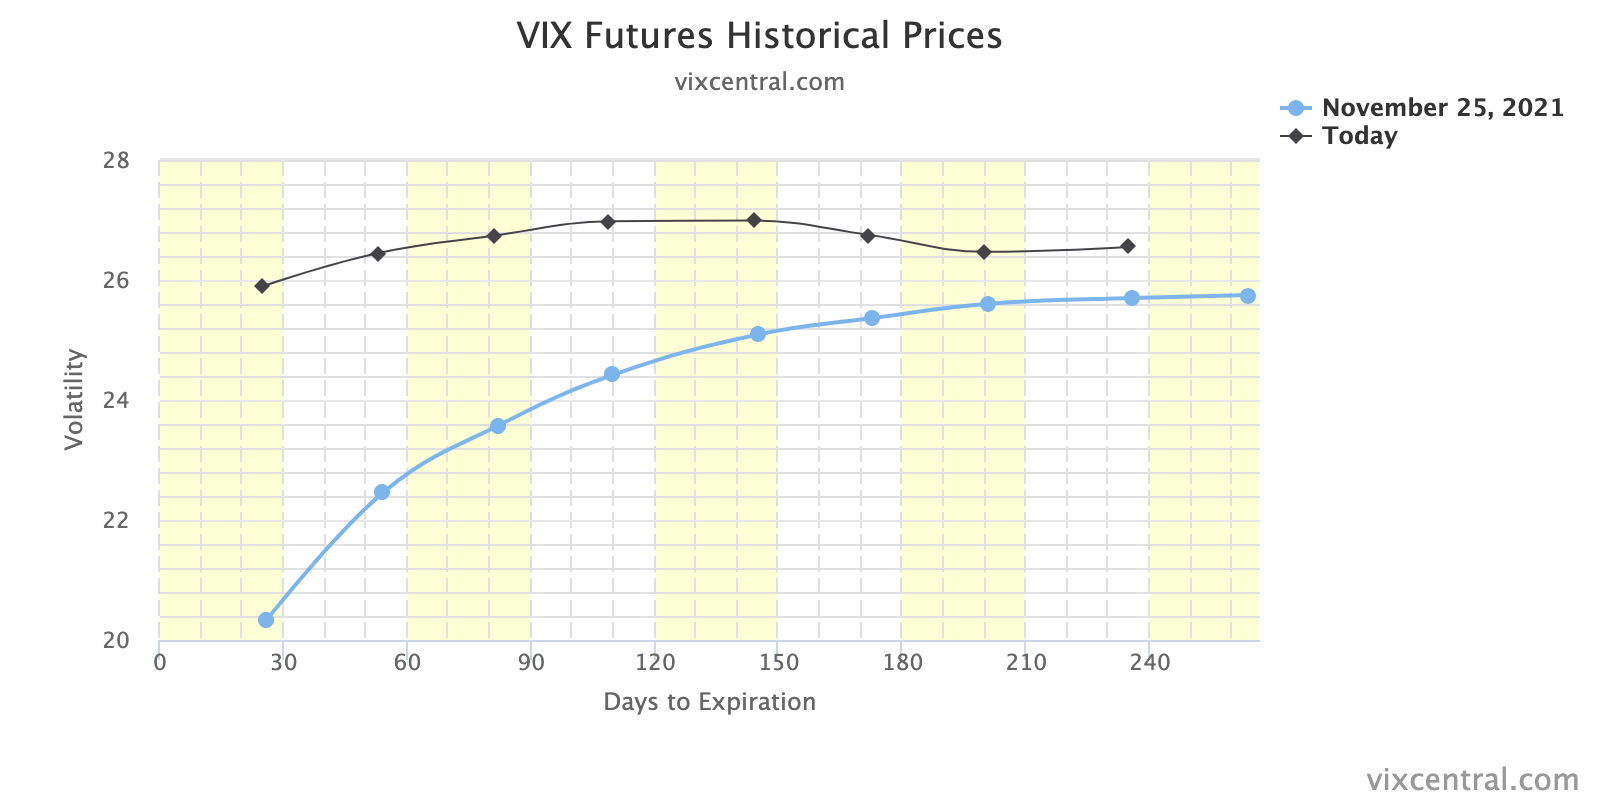
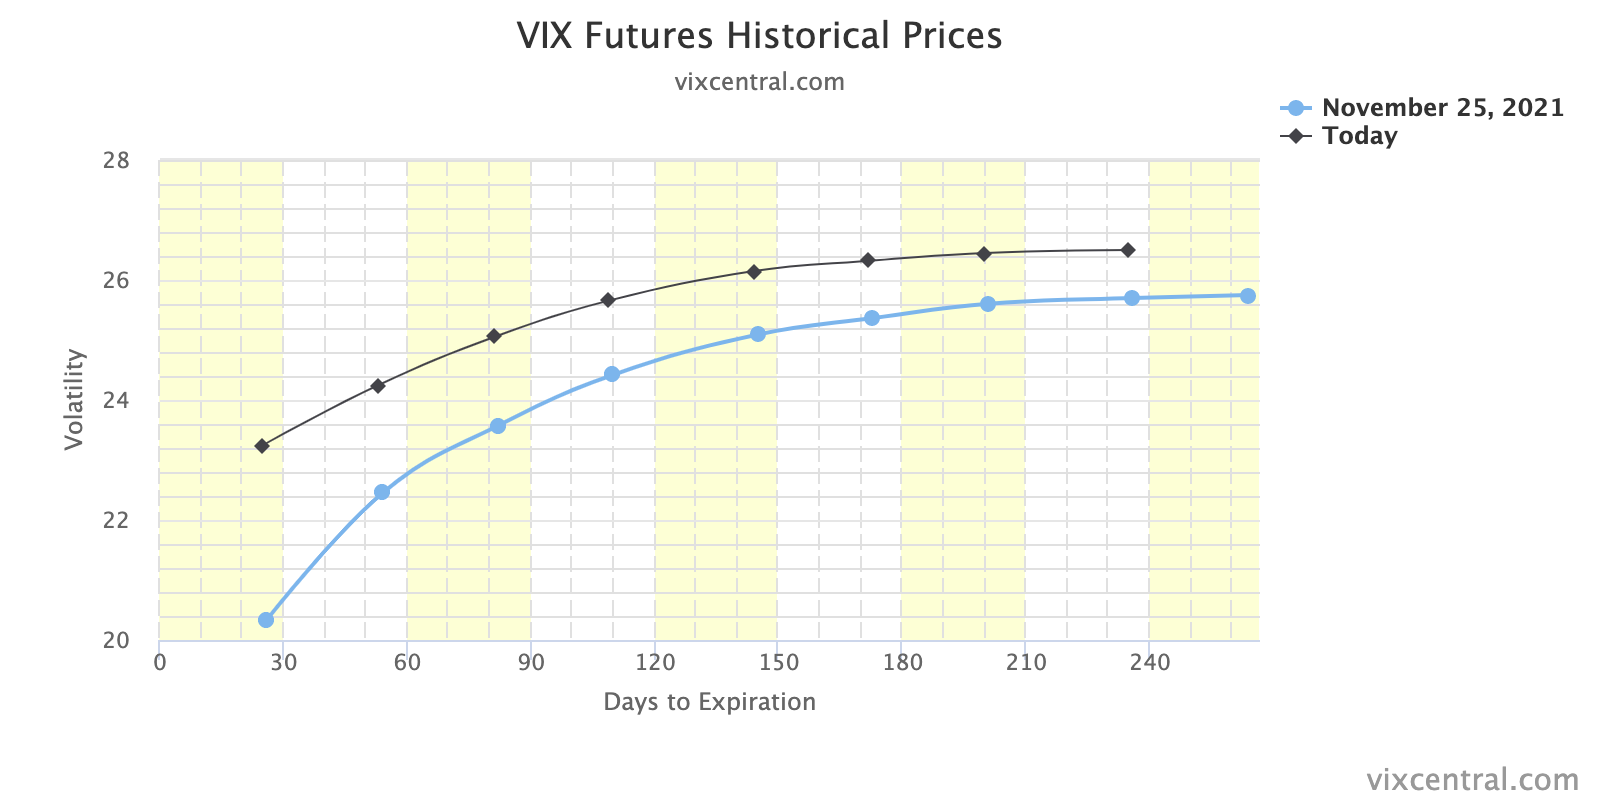
Graphic: VIX term structure 11/25. Backwardation signaled an entry into an unstable environment with activity concentrated at the front-end of the curve.

Once that short-dated protection rolls off the table (and/or is monetized), counterparties will quickly reverse and support the market, buying to close their existing stock/futures hedges.

Graphic: SpotGamma’s Hedging Impact of Real-Time Options (HIRO) indicator on 12/2 shows positive options delta trades firing off, which likely had dealers buying stock/futures into the close.

This flow is stabilizing and may play into a seasonally-aligned rally into Christmas as participants see defenses rolled out against the new COVID-19 variant, and the positive effects of pro-cyclical inflation and economic growth, improvements in global trade, and continuity at the Fed, among other dynamics, play out.

We see participants opportunistically buying the dip, already, via metrics like DIX that’s derived from liquidity provision on the market-making side.

Graphic: Earnings are rising and helping support historic PE multiples, via Nasdaq

Notwithstanding, the market is still in short-gamma and unless participants began betting on the upside (i.e., committing increased capital to calls at strikes higher in price and out in time), and we cross over to long-gamma, volatility ought to remain.

To assuage fears, though, here is a quote from Goldman Sachs Group Inc (NYSE: GS): 

“We find that the market has already priced in a significant downgrade in the growth outlook off the back of Omicron concerns. While we don’t believe that the most extreme downside scenarios are fully reflected in current market pricing, there are clearly still scenarios that could prove better than anticipated by the sharp shift in pricing in recent weeks, in our view”.

Expectations: As of 6:45 AM ET, Friday’s regular session (9:30 AM – 4:00 PM ET), in the S&P 500, will likely open in the upper part of a negatively skewed overnight inventory, inside of prior-range and -value, suggesting a limited potential for immediate directional opportunity.

In the best case, the S&P 500 trades sideways or higher; activity above the $4,574.25 high volume area (HVNode) puts in play the $4,590.00 balance area high (BAH). Initiative trade beyond the BAH could reach as high as the $4,629.00 untested point of control (VPOC) and $4,647.25 HVNode, or higher.

In the worst case, the S&P 500 trades lower; activity below the $4,574.25 HVNode puts in play the $4,551.75 low volume area (LVNode). Initiative trade beyond the LVNode could reach as low as the $4,526.25 HVNode and $4,497.75 regular trade low (RTH Low), or lower.

Click here to load today’s updated key levels into the web-based TradingView charting platform. Note that all levels are derived using the 65-minute timeframe. New links are produced, daily.
Graphic: 65-minute profile chart of the Micro E-mini S&P 500 Futures. Learn about the profile.

What People Are Saying

Definitions

Volume Areas: A structurally sound market will build on areas of high volume (HVNodes). Should the market trend for long periods of time, it will lack sound structure, identified as low volume areas (LVNodes). LVNodes denote directional conviction and ought to offer support on any test. 

If participants were to auction and find acceptance into areas of prior low volume (LVNodes), then future discovery ought to be volatile and quick as participants look to HVNodes for favorable entry or exit.

DIX: For every buyer is a seller (usually a market maker). Using DIX — which is derived from short sales (i.e., liquidity provision on the market-making side) — we can measure buying pressure.

Gamma: Gamma is the sensitivity of an option to changes in the underlying price. Dealers that take the other side of options trades hedge their exposure to risk by buying and selling the underlying. When dealers are short-gamma, they hedge by buying into strength and selling into weakness. When dealers are long-gamma, they hedge by selling into strength and buying into weakness. The former exacerbates volatility. The latter calms volatility.

Vanna: The rate at which the delta of an option changes with respect to volatility.

Charm: The rate at which the delta of an option changes with respect to time.

POCs: POCs are valuable as they denote areas where two-sided trade was most prevalent in a prior day session. Participants will respond to future tests of value as they offer favorable entry and exit.

Options Expiration (OPEX): Traditionally, option expiries mark an end to pinning (i.e, the theory that market makers and institutions short options move stocks to the point where the greatest dollar value of contracts will expire) and the reduction dealer gamma exposure.

Balance (Two-Timeframe Or Bracket): Rotational trade that denotes current prices offer favorable entry and exit. Balance-areas make it easy to spot a change in the market (i.e., the transition from two-time frame trade, or balance, to one-time frame trade, or trend). 

Modus operandi is responsive trade (i.e., fade the edges), rather than initiative trade (i.e., play the break).

Value-Area Placement: Perception of value unchanged if value overlapping (i.e., inside day). Perception of value has changed if value not overlapping (i.e., outside day). Delay trade in the former case.

Rates: Low rates have to potential to increase the present value of future earnings making stocks, especially those that are high growth, more attractive. To note, inflation and rates move inversely to each other. Low rates stimulate demand for loans (i.e., borrowing money is more attractive).

About

After years of self-education, strategy development, and trial-and-error, Renato Leonard Capelj began trading full-time and founded Physik Invest to detail his methods, research, and performance in the markets.

Additionally, Capelj is a Benzinga finance and technology reporter interviewing the likes of Shark Tank’s Kevin O’Leary, JC2 Ventures’ John Chambers, and ARK Invest’s Catherine Wood, as well as a SpotGamma contributor, developing insights around impactful options market dynamics.

Disclaimer

At this time, Physik Invest does not manage outside capital and is not licensed. In no way should the materials herein be construed as advice. Derivatives carry a substantial risk of loss. All content is for informational purposes only.
Categories
Commentary

Daily Brief For November 29, 2021

What Happened

Overnight, equity index futures auctioned sideways to higher as participants looked to take back nearly all of Friday’s shortened holiday trading range. 

According to some metrics, the SPDR S&P 500 ETF Trust (NYSE: SPY), one of the largest ETFs that track the S&P 500 index, experienced one of its most illiquid days, Friday.

At the same time, the CBOE Volatility Index (INDEX: VIX) closed up nearly 50% while the VIX futures term structure settled in backwardation amidst a re-pricing of tail-risk, so to speak.

Moreover, ahead is data on Pending Home Sales (10:00 AM ET).

Graphic updated 5:50 AM ET. Sentiment Neutral if expected /ES open is inside of the prior day’s range. /ES levels are derived from the profile graphic at the bottom of the following section. Levels may have changed since initially quoted; click here for the latest levels. SqueezeMetrics Dark Pool Index (DIX) and Gamma (GEX) calculations are based on where the prior day’s reading falls with respect to the MAX and MIN of all occurrences available. A higher DIX is bullish. At the same time, the lower the GEX, the more (expected) volatility. Learn the implications of volatility, direction, and moneyness. SHIFT data used for S&P 500 (INDEX: SPX) options activity. Note that options flow is sorted by the call premium spent; if more positive then more was spent on call options. Breadth reflects a reading of the prior day’s NYSE Advance/Decline indicator. VIX reflects a current reading of the CBOE Volatility Index (INDEX: VIX) from 0-100.

What To Expect

Despite the lackluster intraday breadth and divergent market liquidity metrics, the worst-case outcome occurred, Friday, evidenced by downside expansion of range and separation of value.

Coming into the session, the experiences associated with ‘Volmageddon’ came to mind; the VIX was up nearly 40.00%, a concern given the exuberance of past weeks and options positioning, as well as a decline in correlations, and unsupportive breadth.

Tempering the fall were divergences; the Russell 2000 was down nearly 4.00% before Friday’s U.S. open while the S&P 500 was off about 2.00% or so, buoyed by the Nasdaq 100 which was only down about 1.00% amidst an 8% dip in the ten-year yield.

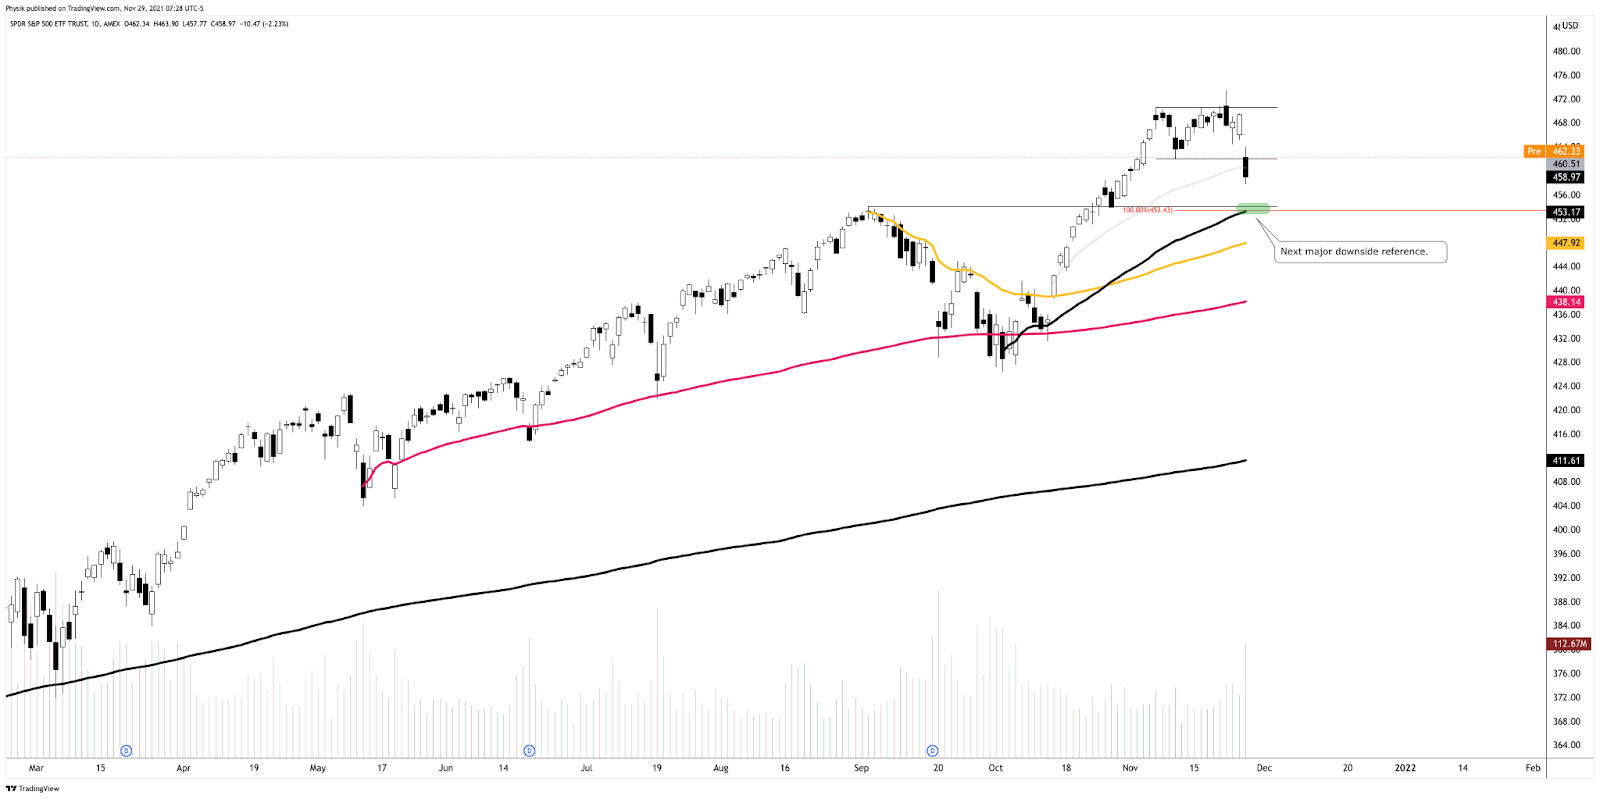
The divergence persisted with the S&P 500 closing firmly below its 20-day simple moving average, a visual level often acted on by short-term, technically-driven participants who generally are unable to defend retests.

Graphic: Divergent delta (i.e., non-committed selling as measured by volume delta or buying and selling power as calculated by the difference in volume traded at the bid and offer) in SPDR S&P 500 ETF Trust (NYSE: SPY), one of the largest ETFs that track the S&P 500 index.

Context: A resurgence in the COVID-19 coronavirus as an improvement in macroeconomic conditions prompts a hawkish shift from the Federal Reserve (Fed). 

“Many risky asset tailwinds in 2021 are turning into at least mild headwinds in 2022,” Nordea says. “Economic growth should decelerate, liquidity conditions are deteriorating, profit margins should be under pressure from rising costs and question marks regarding the Fed/ECB put will arise due to elevated inflation indicators. To us, this spells higher volatility.”

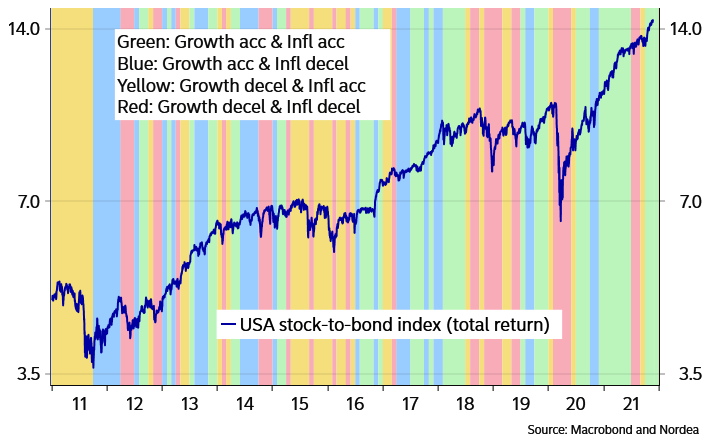
Moreover, for the past two years, almost, equities rallied amidst an acceleration in growth, which is typically correlated with equity outperformance over bonds.

Graphic: Accelerating growth correlates with equity outperformance over bonds.

At the same time, there’s been an insatiable appetite for stocks, according to Bloomberg, with investors pouring “almost $900 billion into equity exchange-traded and long-only funds in 2021 — exceeding the combined total from the past 19 years.”

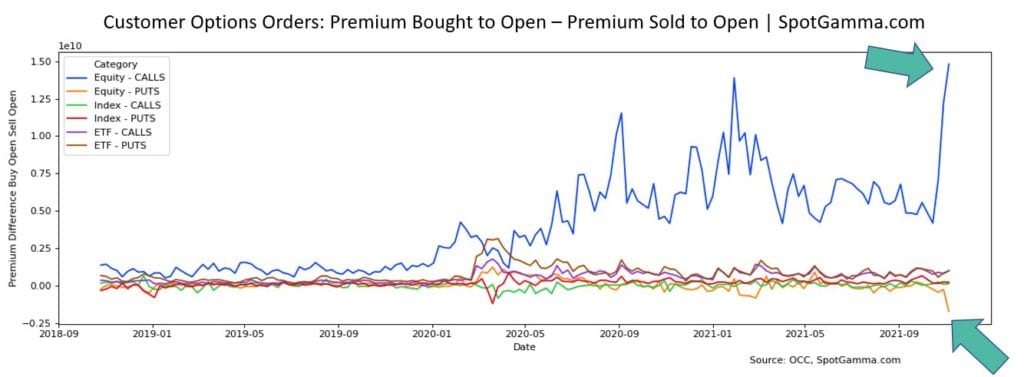
This appetite for risk fed into the activity of some high-flyers like Tesla Inc (NASDAQ: TSLA) with customers, at least in the past weeks, opting to aggressively sell puts and buy calls heading into the November monthly options expiration (OPEX).

Graphic: Per The Market Ear, participants were hating on downside protection for weeks.

Unfortunately, (1) after OPEX, the absence of sticky and supportive hedging flows freed the broader market for directional resolve, and (2) according to SpotGamma, in light of recent exuberance, “participants [were] underexposed to downside put protection.”

Graphic: Customers took on significant leverage in their purchase and sale of options, via SpotGamma.

What this meant was that after OPEX’s unpinning and increase in correlation, fundamental contexts were to matter more.

Therefore, the Fed’s “increased openness to accelerat[e] the taper pace” and hike rates, alongside fresh travel restrictions on a new COVID-19 variant, as well as holiday illiquidity, resulted in a rough re-pricing of tail risk as participants sought after those highly “convex” options which had counterparties exacerbating underlying price movement.

Graphic: According to Bloomberg, markets price “a full quarter-point rate hike into the June Fed meeting with a second by September and a third by December.”

To elaborate, in short, was volatility to pick up, those participants (who were once exuberant) were likely to reach for protection forcing dealers to reflexively hedge in a destabilizing manner. 

Dealers is the term used to describe those participants that take the other side and warehouse customer options risk, at least in the case where orders can’t be matched between customers.

With that, as volatility rose and customers demanded protection, counterparties hedged by selling into weakness. The conditions worsened when much of the activity was concentrated in shorter-dated tenors where the sensitivity of options to direction is higher if we will.

Graphic: VIX term structure. Backwardation signals an entry into an unstable environment.

Once that short-dated protection rolls off the table (and/or is monetized), dealers will reverse and support the market, buying to close their existing stock/futures hedges.

This flow is stabilizing and may play into a seasonally-aligned rally into Christmas as participants see defenses rolled out against the new COVID-19 variant, and the positive effects of pro-cyclical inflation and economic growth, improvements in global trade, and continuity at the Fed, among other dynamics, play out.

We see participants opportunistically buying the dip, already, via metrics like DIX that’s derived from liquidity provision on the market-making side.

Expectations: As of 6:00 AM ET, Monday’s regular session (9:30 AM – 4:00 PM ET), in the S&P 500, will likely open in the middle part of a positively skewed overnight inventory, inside of prior-range and -value, suggesting a limited potential for immediate directional opportunity.

In the best case, the S&P 500 trades sideways or higher; activity above the $4,618.75 high volume area (HVNode) puts in play the $4,647.25 HVNode. Initiative trade beyond the latter HVNode could reach as high as the $4,674.25 micro composite point of control (MCPOC) and $4,691.25 HVNode, or higher.

In the worst case, the S&P 500 trades lower; activity below the $4,618.75 HVNode puts in play the $4,590.00 balance boundary (BAH). Initiative trade beyond the BAH could reach as low as the $4,574.25 HVNode and $4,551.75 LVNode, or lower.

Click here to load today’s updated key levels into the web-based TradingView charting platform. Note that all levels are derived using the 65-minute timeframe. New links are produced, daily.
Graphic: 65-minute profile chart of the Micro E-mini S&P 500 Futures. Learn about the profile.

Charts To Watch

Graphic: (NYSE: SPY). (S~$460 and $453). S is for support.
Graphic: (NASDAQ: QQQ). (S~$389 and $381). S is for support.
Graphic: (NYSE: IWM). (S~$222 and $216). S is for support.

What People Are Saying

Definitions

Overnight Rally Highs (Lows): Typically, there is a low historical probability associated with overnight rally-highs (lows) ending the upside (downside) discovery process.

Volume Areas: A structurally sound market will build on areas of high volume (HVNodes). Should the market trend for long periods of time, it will lack sound structure, identified as low volume areas (LVNodes). LVNodes denote directional conviction and ought to offer support on any test. 

If participants were to auction and find acceptance into areas of prior low volume (LVNodes), then future discovery ought to be volatile and quick as participants look to HVNodes for favorable entry or exit.

Gamma: Gamma is the sensitivity of an option to changes in the underlying price. Dealers that take the other side of options trades hedge their exposure to risk by buying and selling the underlying. When dealers are short-gamma, they hedge by buying into strength and selling into weakness. When dealers are long-gamma, they hedge by selling into strength and buying into weakness. The former exacerbates volatility. The latter calms volatility.

POCs: POCs are valuable as they denote areas where two-sided trade was most prevalent in a prior day session. Participants will respond to future tests of value as they offer favorable entry and exit.

MCPOCs: POCs are valuable as they denote areas where two-sided trade was most prevalent over numerous day sessions. Participants will respond to future tests of value as they offer favorable entry and exit.

Options Expiration (OPEX): Traditionally, option expiries mark an end to pinning (i.e, the theory that market makers and institutions short options move stocks to the point where the greatest dollar value of contracts will expire) and the reduction dealer gamma exposure.

Rates: Low rates have to potential to increase the present value of future earnings making stocks, especially those that are high growth, more attractive. To note, inflation and rates move inversely to each other. Low rates stimulate demand for loans (i.e., borrowing money is more attractive).

About

After years of self-education, strategy development, and trial-and-error, Renato Leonard Capelj began trading full-time and founded Physik Invest to detail his methods, research, and performance in the markets.

Additionally, Capelj is a Benzinga finance and technology reporter interviewing the likes of Shark Tank’s Kevin O’Leary, JC2 Ventures’ John Chambers, and ARK Invest’s Catherine Wood, as well as a SpotGamma contributor, developing insights around impactful options market dynamics.

Disclaimer

At this time, Physik Invest does not manage outside capital and is not licensed. In no way should the materials herein be construed as advice. Derivatives carry a substantial risk of loss. All content is for informational purposes only.
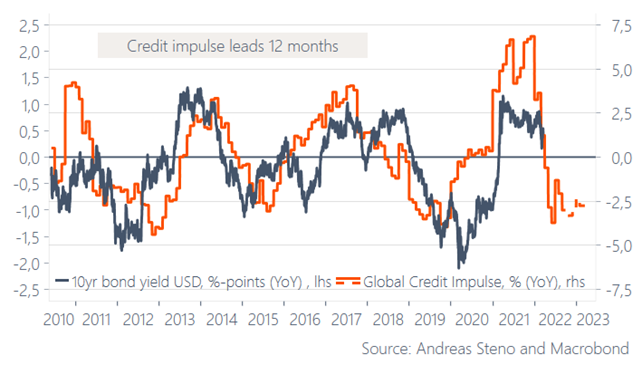
Categories
Commentary

Daily Brief For Black Friday 2021

What Happened

Ahead of a shortened holiday session, equity index futures auctioned lower alongside the narrative of a resurgence in the COVID-19 coronavirus. 

Most affected appears the Russell 2000 which was down nearly 4.00%, at the time of this writing. The S&P 500 was off about 2.00% or so, buoyed by the innovation- and tech-heavy Nasdaq 100 which was only down about 1.00%. 

This shift in relative strength comes as the ten-year yield sits lower about 8.00%. The CBOE Volatility Index (INDEX: VIX) was up over 40.00% and the implications of this are staggering, given the underhedged market I talked about over the past sessions.

Moreover, there are no scheduled economic releases, today.

Graphic updated 6:00 AM ET. Sentiment Risk-Off if expected /ES open is below the prior day’s range. /ES levels are derived from the profile graphic at the bottom of the following section. Levels may have changed since initially quoted; click here for the latest levels. SqueezeMetrics Dark Pool Index (DIX) and Gamma (GEX) calculations are based on where the prior day’s reading falls with respect to the MAX and MIN of all occurrences available. A higher DIX is bullish. At the same time, the lower the GEX, the more (expected) volatility. Learn the implications of volatility, direction, and moneyness. SHIFT data used for S&P 500 (INDEX: SPX) options activity. Note that options flow is sorted by the call premium spent; if more positive then more was spent on call options. Breadth reflects a reading of the prior day’s NYSE Advance/Decline indicator. VIX reflects a current reading of the CBOE Volatility Index (INDEX: VIX) from 0-100.

What To Expect

On Wednesday’s lackluster breadth and market liquidity metrics, the best case occurred. 

The S&P 500 recovered its $4,697.50 spike base, below which selling activity appeared to be the result of weaker-handed participants liquidating as a result of poor location and news.

Overnight, however, the tone shifted. The S&P 500 initiated back through its $4,647.25 high volume area (HVNode) which had corresponded with the 20-day simple moving average.

The 20-day presented participants with a clear way to measure risk, given the mechanical responses in prior trade. As explained, Wednesday, should participants manage to break past the 20-day, then conditions have changed and follow-through was likely

Reason being? Those visual levels are acted on by short-term, technically-driven participants who generally are unable to defend retests.

Graphic: Divergent delta (i.e., non-committed buying as measured by volume delta or buying and selling power as calculated by the difference in volume traded at the bid and offer) in SPDR S&P 500 ETF Trust (NYSE: SPY), one of the largest ETFs that track the S&P 500 index, via Bookmap. The readings were supportive of responsive trade (i.e., rotational trade that suggests current prices did not offer favorable entry and exit; the market was in balance).

Context: The aforementioned trade is happening in the context of an “insatiable appetite for stocks this year,” as Bloomberg explains

“Investors have poured almost $900 billion into equity exchange-traded and long-only funds in 2021 — exceeding the combined total from the past 19 years.”

This appetite fed into the activity of some high-flyers like Tesla Inc (NASDAQ: TSLA) with customers opting to aggressively sell puts and buy calls heading into the November monthly options expiration (OPEX).

Graphic: Customers took on significant leverage in their purchase and sale of options, via SpotGamma.

Unfortunately, (1) after OPEX, the absence of sticky and supportive hedging flows freed the broader market for directional resolve, and (2) according to SpotGamma, in light of recent exuberance, “participants [were] underexposed to downside put protection.”

The implications of the latter are staggering.

In short, should volatility continue to pick up, those participants (who were once exuberant) are likely to reach for protection forcing dealers to reflexively hedge in a destabilizing manner. 

As volatility rises and customers demand protection, counterparties are to hedge by selling into weakness. The conditions worsen when much of the activity is in shorter-dated tenors where options gamma is more sensitive if we will. This is what we’re seeing.

Graphic: The CBOE Volatility Index (INDEX: VIX) was higher, while demand came in most predominantly across the entire area of the VIX futures term structure. That, alongside the market’s entry into short-gamma, suggests participants’ hedging has destabilizing implications.

Note that I said short-dated

Once that exposure rolls off the table (and/or is monetized), dealers/counterparties will reverse and support the market, buying-to-close their existing stock/futures hedges to negative gamma positions. 

This flow is stabilizing and may play into a seasonally-aligned rally into Christmas.

As stated on November 23, 2021: “This last part is educated conjecture. It’s what I also feel as though would frustrate the most amount of participants. Basically, a quick wash (or sideways to lower), followed by a move higher into year-end. Be nimble and responsive!”

Expectations: As of 6:00 AM ET, Friday’s regular session (9:30 AM – 1:00 PM ET), in the S&P 500, will likely open in the lower part of a negatively skewed overnight inventory, outside of prior-range and -value, suggesting a potential for immediate directional opportunity.

Gap Scenarios Are In Play: Gaps ought to fill quickly. Should they not, that’s a signal of strength; do not fade. Leaving value behind on a gap-fill or failing to fill a gap (i.e., remaining outside of the prior session’s range) is a go-with indicator.

Auctioning and spending at least 1-hour of trade back in the prior range suggests a lack of conviction; in such a case, do not follow the direction of the most recent initiative activity.

In the best case, the S&P 500 trades sideways or higher; activity above the $4,618.75 high volume area (HVNode) puts in play the $4,647.25 HVNode. Initiative trade beyond the latter HVNode could reach as high as the $4,674.25 micro composite point of control (MCPOC) and $4,691.25 HVNode, or higher.

In the worst case, the S&P 500 trades lower; activity below the $4,618.75 HVNode puts in play the $4,596.75 overnight low (ONL) and $4,590.00 balance boundary (BAH). Initiative trade beyond the BAH could reach as low as the $4,574.25 HVNode and $4,551.75 LVNode, or lower.

Click here to load today’s updated key levels into the web-based TradingView charting platform. Note that all levels are derived using the 65-minute timeframe. New links are produced, daily.
Graphic: 65-minute profile chart of the Micro E-mini S&P 500 Futures. Learn about the profile.

Charts To Watch

Graphic: (ETF: IWM). (Key VWAP support at ~$223)
Graphic: (ETF: SPY). (Key VWAP support at ~$460)
Graphic: (ETF: QQQ). (Key VWAP support at ~$388)

What People Are Saying

Definitions

Spikes: Spike’s mark the beginning of a break from value. Spikes higher (lower) are validated by trade at or above (below) the spike base (i.e., the origin of the spike).

Overnight Rally Highs (Lows): Typically, there is a low historical probability associated with overnight rally-highs (lows) ending the upside (downside) discovery process.

Volume Areas: A structurally sound market will build on areas of high volume (HVNodes). Should the market trend for long periods of time, it will lack sound structure, identified as low volume areas (LVNodes). LVNodes denote directional conviction and ought to offer support on any test. 

If participants were to auction and find acceptance into areas of prior low volume (LVNodes), then future discovery ought to be volatile and quick as participants look to HVNodes for favorable entry or exit.

Gamma: Gamma is the sensitivity of an option to changes in the underlying price. Dealers that take the other side of options trades hedge their exposure to risk by buying and selling the underlying. When dealers are short-gamma, they hedge by buying into strength and selling into weakness. When dealers are long-gamma, they hedge by selling into strength and buying into weakness. The former exacerbates volatility. The latter calms volatility.

MCPOCs: POCs are valuable as they denote areas where two-sided trade was most prevalent over numerous day sessions. Participants will respond to future tests of value as they offer favorable entry and exit.

Options Expiration (OPEX): Traditionally, option expiries mark an end to pinning (i.e, the theory that market makers and institutions short options move stocks to the point where the greatest dollar value of contracts will expire) and the reduction dealer gamma exposure.

Volume-Weighted Average Prices (VWAPs): A metric highly regarded by chief investment officers, among other participants, for quality of trade. Additionally, liquidity algorithms are benchmarked and programmed to buy and sell around VWAPs.

About

After years of self-education, strategy development, and trial-and-error, Renato Leonard Capelj began trading full-time and founded Physik Invest to detail his methods, research, and performance in the markets.

Additionally, Capelj is a Benzinga finance and technology reporter interviewing the likes of Shark Tank’s Kevin O’Leary, JC2 Ventures’ John Chambers, and ARK Invest’s Catherine Wood, as well as a SpotGamma contributor, developing insights around impactful options market dynamics.

Disclaimer

At this time, Physik Invest does not manage outside capital and is not licensed. In no way should the materials herein be construed as advice. Derivatives carry a substantial risk of loss. All content is for informational purposes only.
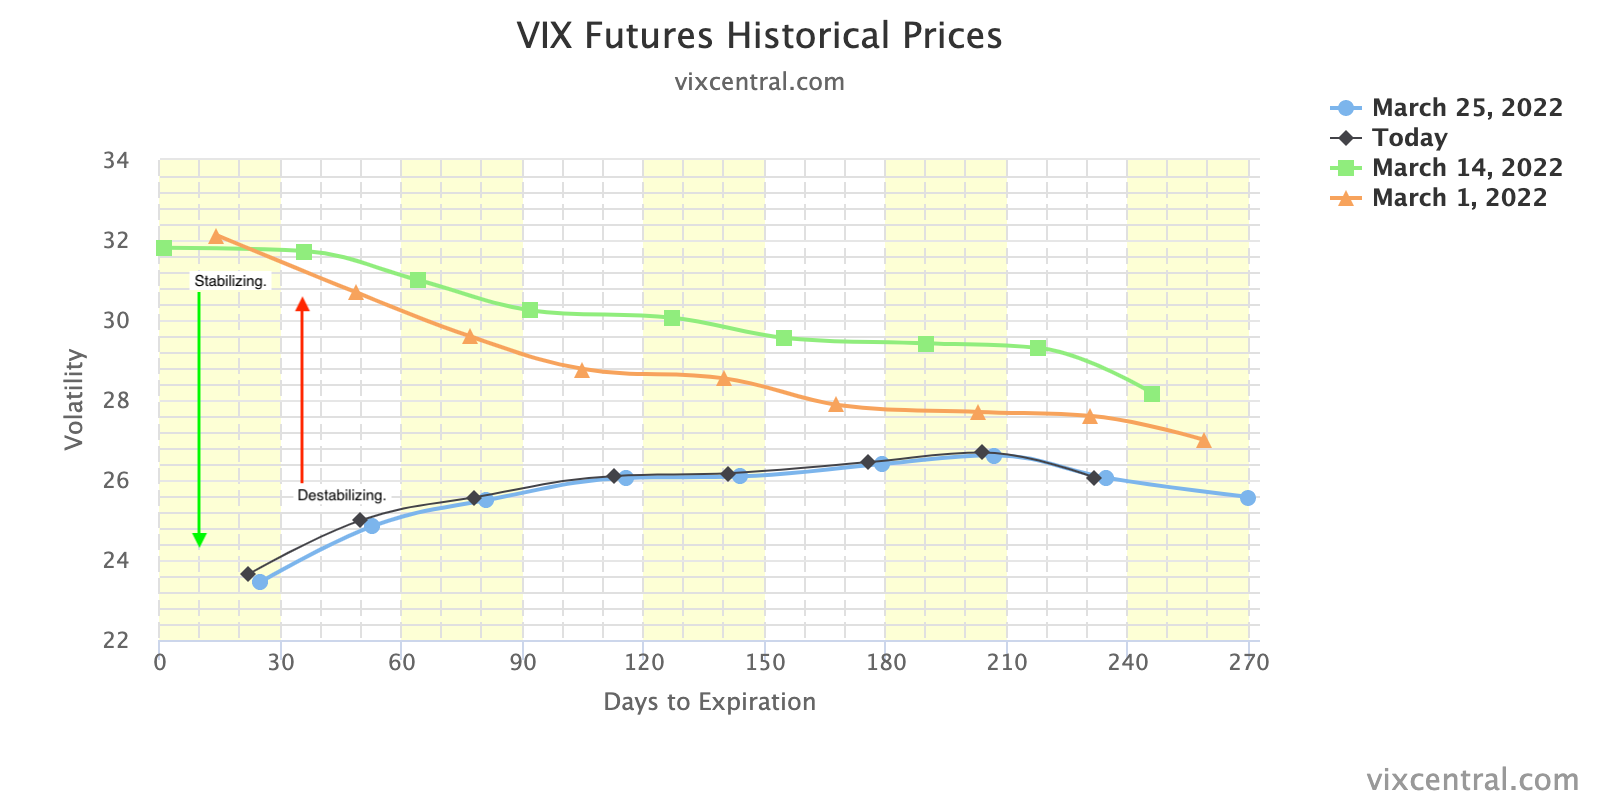
Categories
Commentary

Daily Brief For November 12, 2021

What Happened

Overnight, equity indices were flat-to-up while commodities and bonds were sideways to lower.

The prevailing narratives include the prospects of a Russian invasion of Ukraine, COVID-19 resurgence in the U.S., concerns over the pace of inflation and its impact on the economy, China developer debt payments, and the like. Your typical doom and gloom stuff!

Ahead is data on job openings, University of Michigan consumer sentiment, and five-year inflation expectations (10:00 AM ET).

Graphic updated 5:30 AM ET. Sentiment Neutral if expected /ES open is inside of the prior day’s range. /ES levels are derived from the profile graphic at the bottom of the following section. Levels may have changed since initially quoted; click here for the latest levels. SqueezeMetrics Dark Pool Index (DIX) and Gamma (GEX) calculations are based on where the prior day’s reading falls with respect to the MAX and MIN of all occurrences available. A higher DIX is bullish. At the same time, the lower the GEX, the more (expected) volatility. Learn the implications of volatility, direction, and moneyness. SHIFT data used for S&P 500 (INDEX: SPX) options activity. Note that options flow is sorted by the call premium spent; if more positive then more was spent on call options. Breadth reflects a reading of the prior day’s NYSE Advance/Decline indicator. VIX reflects a current reading of the CBOE Volatility Index (INDEX: VIX) from 0-100.

What To Expect

On lackluster intraday breadth and market liquidity metrics, the best case outcome occurred, evidenced by the balance and overlap of value areas in the S&P 500.

This activity, which suggests participants’ willingness to position for directional resolve, comes alongside the presence of poor structure, a dynamic that adds to technical instability.

Graphic: Divergent delta (i.e., non-committed selling as measured by volume delta or buying and selling power as calculated by the difference in volume traded at the bid and offer) in SPDR S&P 500 ETF Trust (NYSE: SPY), one of the largest ETFs that track the S&P 500 index, via Bookmap. The readings are supportive of responsive trade (i.e., rotational trade that suggests current prices offer favorable entry and exit; the market is in balance).

Context: The aforementioned trade is happening in the context of a lot of big-picture dynamics such as the growth of derivatives exposure and tail risk, the heightened moneyness of nonmonetary assets, trends in seasonality, buybacks, earnings growth, inflation, and more.

Graphic: “Whenever the market has been up 20%+ YTD through to October (like e.g. THIS YEAR), it has *always* had an up month in November (albeit with a n=8). Basically I would say it speaks to the momentum in the market, which despite the September stumble seems pretty much alive and well.” – Callum Thomas

On the topic of inflation, the October consumer price index (CPI) is worrisome, according to some. 

“We think it is time to rethink positioning related to inflation,” Citigroup Inc (NYSE: C) strategists led by Scott Chronert wrote in a note. “A focus on sectors and industry groups negatively correlated to inflation provides a contrarian opportunity.” 

Citi sees value in consumer and health-care stocks, as a result of negative correlations to CPI.

Despite the hot prints, the CPI doesn’t paint the entire picture; it’s too soon to change rate-hike calculations, according to the Federal Reserve’s Mary Daly. 
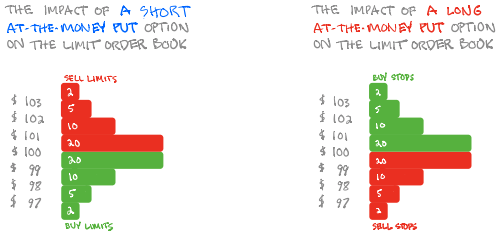
Graphic: U.S. inflation, expected Fed rate increases via Bloomberg

That thinking brings me back to recent comments made by Ark Invest’s Cathie Wood.

Mainly, Wood feels that inflation is on its way out with a decline in the velocity of money and increased moneyness of nonmonetary assets.

A prime example of this is inflation in housing; “Ivy Zelman of Zelman Research came out this week. She made a fantastic call on the housing bubble and bust starting in 05-06, and she was right, just a little early. She is very concerned that the housing prices we’re seeing right now are not sustainable,” because of speculation, as well as iBuying and private equity. 
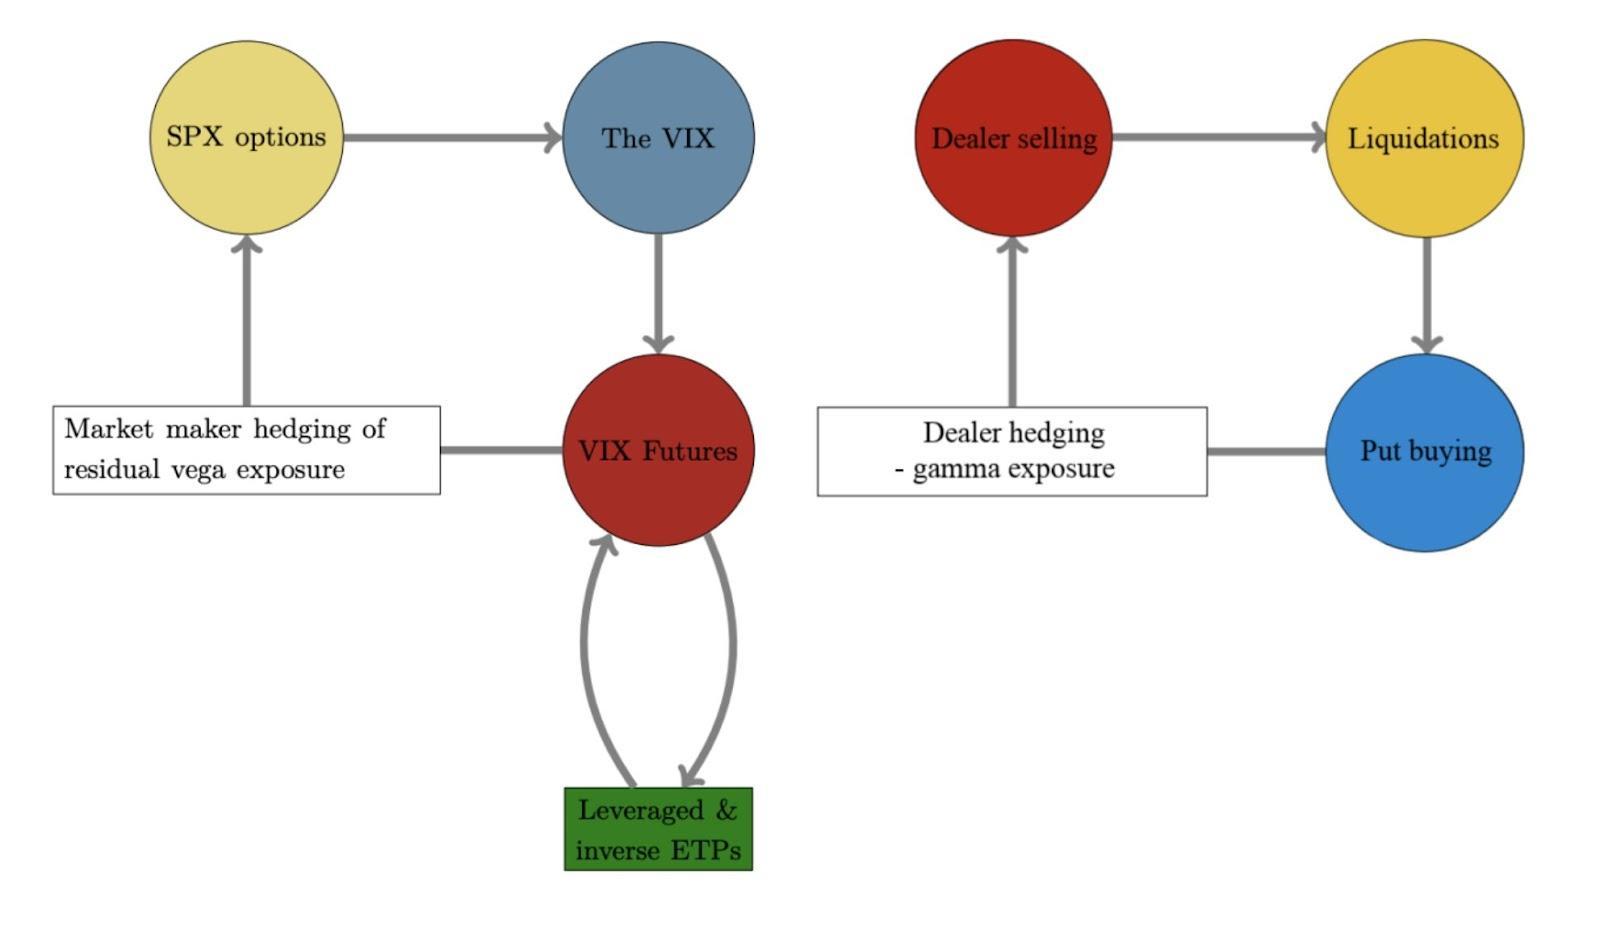
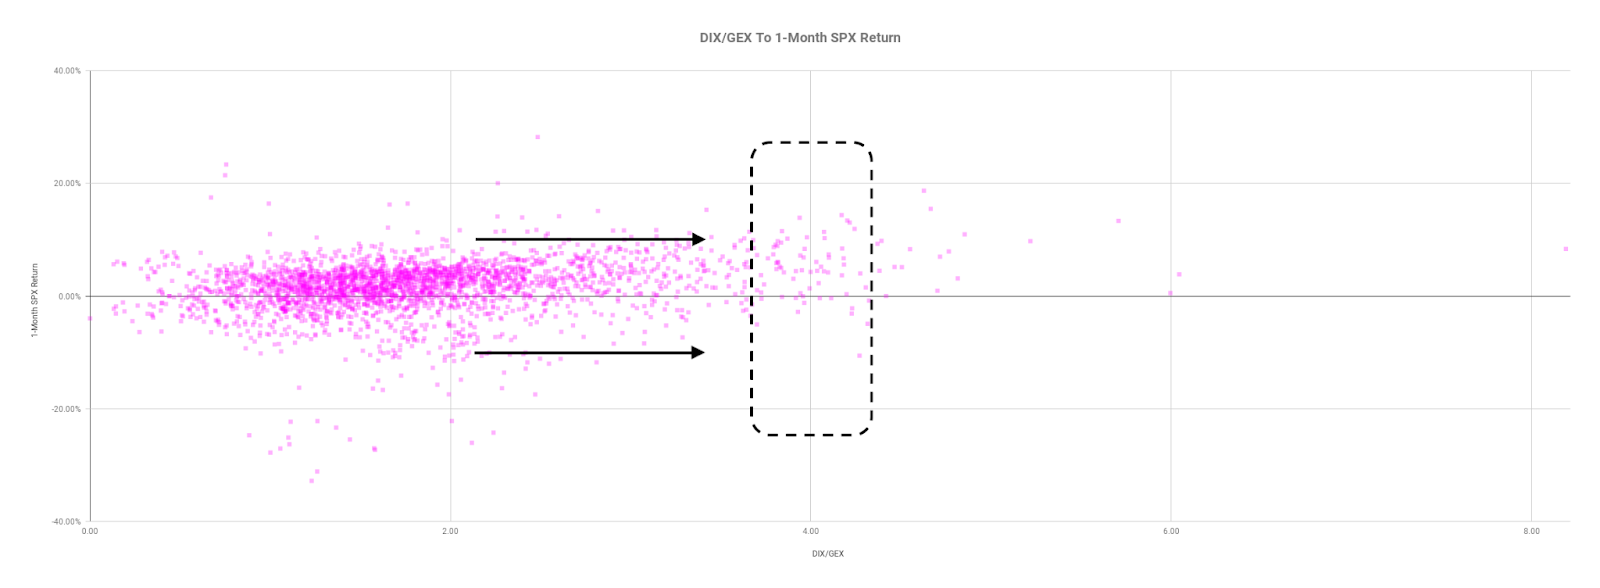
“This is unsustainable … and I’m wondering if even the housing market inflation is going to give way, here,” Wood added. 

For now, with more of the same – bullishness in the face of moderating monetary policy, strong retail participation, seasonality, and buybacks supporting the valuations we’re at, now – what other narratives are there to add (or roll forward)?

Given my interest in the options market – because option volumes are comparable to stock volumes and related hedging flows, as a result, represent an increased share of volume in underlying stocks – I’m in the camp of “the market is fragile, given current positioning.”

According to SpotGamma, single-stock exuberance of the past weeks fed into the S&P complex, itself, evidenced by a lack of interest in put options at lower strikes; the S&P 500 options strike with the largest negative gamma – delta sensitivity to underlying price – failed to roll higher, while the strike of the option with the largest positive gamma did. 

This came as investors marked the S&P 500 up to the $4,700.00 strike, at which positive gamma – delta sensitivity to underlying price – is highest. 

“As volatility continues to decline, the gamma of those options, which are now at the money, ought to increase, forcing counterparties to supply more liquidity,” SpotGamma explained.

Therefore, coming into this week, $4,700.00 was expected to be a magnet (or resistance) into that aforementioned pre-monthly options expiration (OPEX) weakness.

Graphic: @pat_hennessy breaks down returns for the S&P 500, categorized by the week relative to OPEX. 

This was unless (1) volatility declined markedly, “a tailwind for the S&P complex as options slid[ing] down their term structure would cause dealers to continue covering their hedges in an asymmetric manner,” or (2) more capital was committed to options at higher strikes. 

Neither happened.

Instead, the CBOE Volatility Index (INDEX: VIX) was higher, with demand coming in across the front area of the VIX futures term structure. This suggested a demand for hedges and a reduction in the flows (e.g., vanna) that support sideways to higher trade. 

Pictured: SqueezeMetrics highlights implications of volatility, direction, and moneyness. The left orange marker is reflective of a basic reaction to call-buying (as observed during the rise of meme stocks). The right orange marker reflects a reaction to put-buying (as observed during the COVID-19 sell-off).

The implications of customers now covering their levered, long-delta exposure and demanding out-of-the-money hedges may have the effect of forcing counterparties to hedge in a manner that exacerbates underlying price movement to the downside (e.g., Tesla).

With that single-stock exuberance still reflected by positioning in the S&P, itself, as SpotGamma said: “This sets us up for what may be a volatile pre- and post-OPEX week.”
Graphic: S&P 500 (INDEX: SPX) options activity for Thursday, November 11, 2021. SHIFT shows increased volume of put options in strikes prices at and below current prices.

Expectations: As of 5:30 AM ET, Friday’s regular session (9:30 AM – 4:00 PM ET), in the S&P 500, will likely open in the middle part of a positively skewed overnight inventory, inside of prior-range and -value, suggesting a limited potential for immediate directional opportunity.

Balance-Break Scenarios: A change in the market (i.e., transition from two-time frame trade, or balance, to one-time frame trade, or trend) ought to occur on a break of day-session balance.

We monitor for acceptance (i.e., more than 1-hour of trade) outside of the balance area. Rejection (i.e., return inside of balance) portends a move to the opposite end of the balance.

In the best case, the S&P 500 trades sideways or higher; activity above the $4,647.25 high volume area (HVNode) puts in play the $4,673.00 untested point of control (VPOC)

Initiative trade beyond the VPOC could reach as high as the $4,695.25 micro composite point of control (MCPOC) and $4,711.75 regular trade high (RTH High), or higher.

In the worst case, the S&P 500 trades lower; activity below the $4,647.25 HVNode puts in play the $4,619.00 VPOC

Initiative trade beyond the VPOC could reach as low as $4,590.00, a prior balance area high (BAH), and $4,574.25 HVNode, or lower.

To note, a breach of Wednesday’s low likely puts the S&P 500 in a short-gamma environment.

Those participants that take the other side of options trades will hedge their exposure to risk by buying and selling the underlying. 

When dealers are short-gamma, they buy into strength and sell into weakness, exacerbating volatility. 

When dealers are long-gamma, they buy into weakness and sell into strength, calming volatility.

--

Click here to load today’s updated key levels into the web-based TradingView charting platform. Note that all levels are derived using the 65-minute timeframe. New links are produced, daily.
Graphic: 65-minute profile chart of the Micro E-mini S&P 500 Futures. Learn about the profile.

What People Are Saying

Definitions

Cave-Fill Process: Widened the area deemed favorable to transact at by an increased share of participants. This is a good development.

Volume Areas: A structurally sound market will build on areas of high volume (HVNodes). Should the market trend for long periods of time, it will lack sound structure, identified as low volume areas (LVNodes). LVNodes denote directional conviction and ought to offer support on any test. 

If participants were to auction and find acceptance into areas of prior low volume (LVNodes), then future discovery ought to be volatile and quick as participants look to HVNodes for favorable entry or exit.

POCs: POCs are valuable as they denote areas where two-sided trade was most prevalent in a prior day session. Participants will respond to future tests of value as they offer favorable entry and exit.

MCPOCs: POCs are valuable as they denote areas where two-sided trade was most prevalent over numerous day sessions. Participants will respond to future tests of value as they offer favorable entry and exit.

Value-Area Placement: Perception of value unchanged if value overlapping (i.e., inside day). Perception of value has changed if value not overlapping (i.e., outside day). Delay trade in the former case.

About

After years of self-education, strategy development, and trial-and-error, Renato Leonard Capelj began trading full-time and founded Physik Invest to detail his methods, research, and performance in the markets.

Additionally, Capelj is a Benzinga finance and technology reporter interviewing the likes of Shark Tank’s Kevin O’Leary, JC2 Ventures’ John Chambers, and ARK Invest’s Catherine Wood, as well as a SpotGamma contributor, developing insights around impactful options market dynamics.

Disclaimer

At this time, Physik Invest does not manage outside capital and is not licensed. In no way should the materials herein be construed as advice. Derivatives carry a substantial risk of loss. All content is for informational purposes only.