Categories
Commentary

Daily Brief For November 10, 2021

What Happened

Equity index futures sideways, overnight, on powerful derivative market forces, alongside participants’ aims to base ahead of added clarity on the economic outlook.

Ahead is data on inflation and jobless claims (8:30 AM ET), wholesale inventories (10:00 AM ET), and the monthly budget statement (2:00 PM ET).

Graphic updated 5:30 AM ET. Sentiment Neutral if expected /ES open is inside of the prior day’s range. /ES levels are derived from the profile graphic at the bottom of the following section. Levels may have changed since initially quoted; click here for the latest levels. SqueezeMetrics Dark Pool Index (DIX) and Gamma (GEX) calculations are based on where the prior day’s reading falls with respect to the MAX and MIN of all occurrences available. A higher DIX is bullish. At the same time, the lower the GEX, the more (expected) volatility. Learn the implications of volatility, direction, and moneyness. SHIFT data used for S&P 500 (INDEX: SPX) options activity. Note that options flow is sorted by the call premium spent; if more positive then more was spent on call options. Breadth reflects a reading of the prior day’s NYSE Advance/Decline indicator. VIX reflects a current reading of the CBOE Volatility Index (INDEX: VIX) from 0-100.

What To Expect

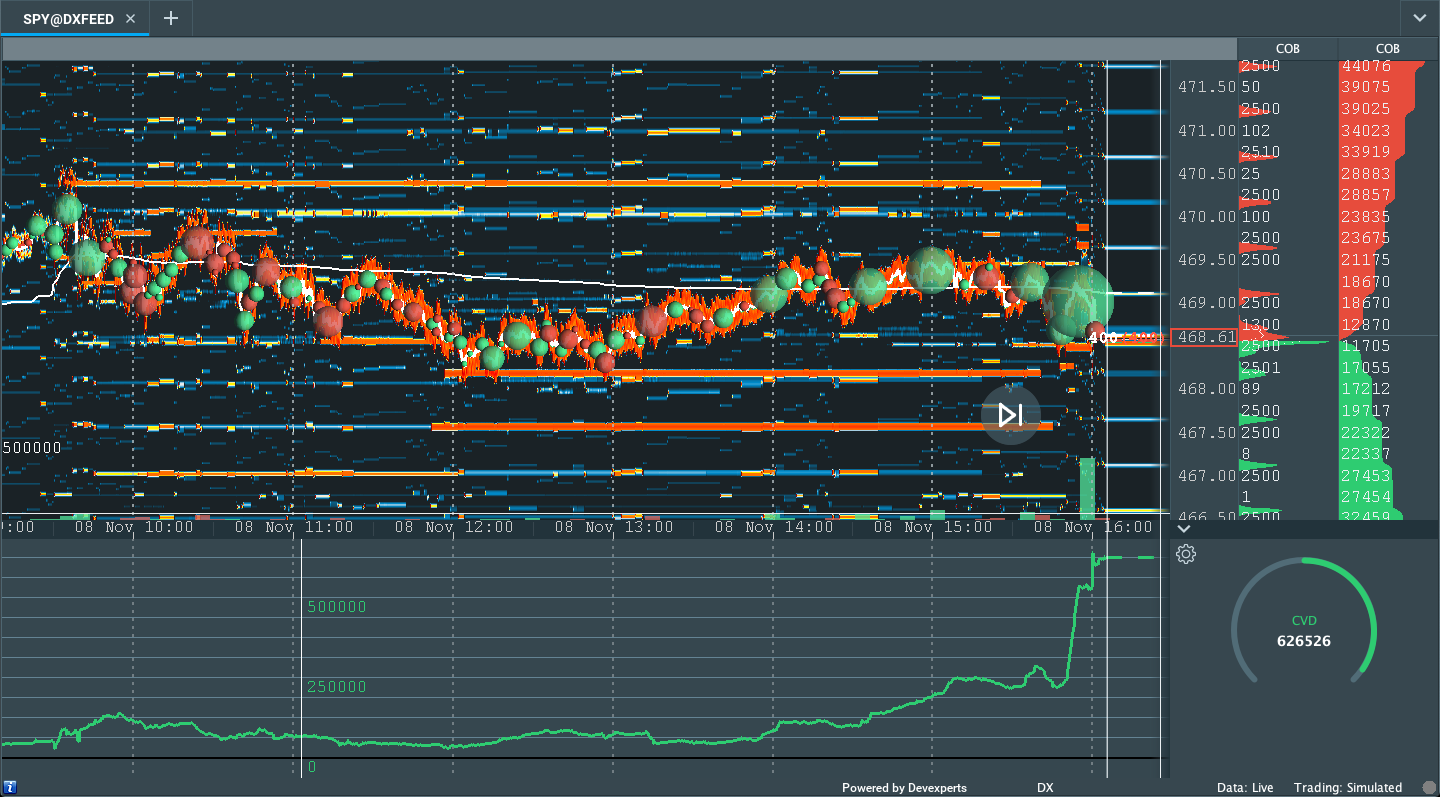
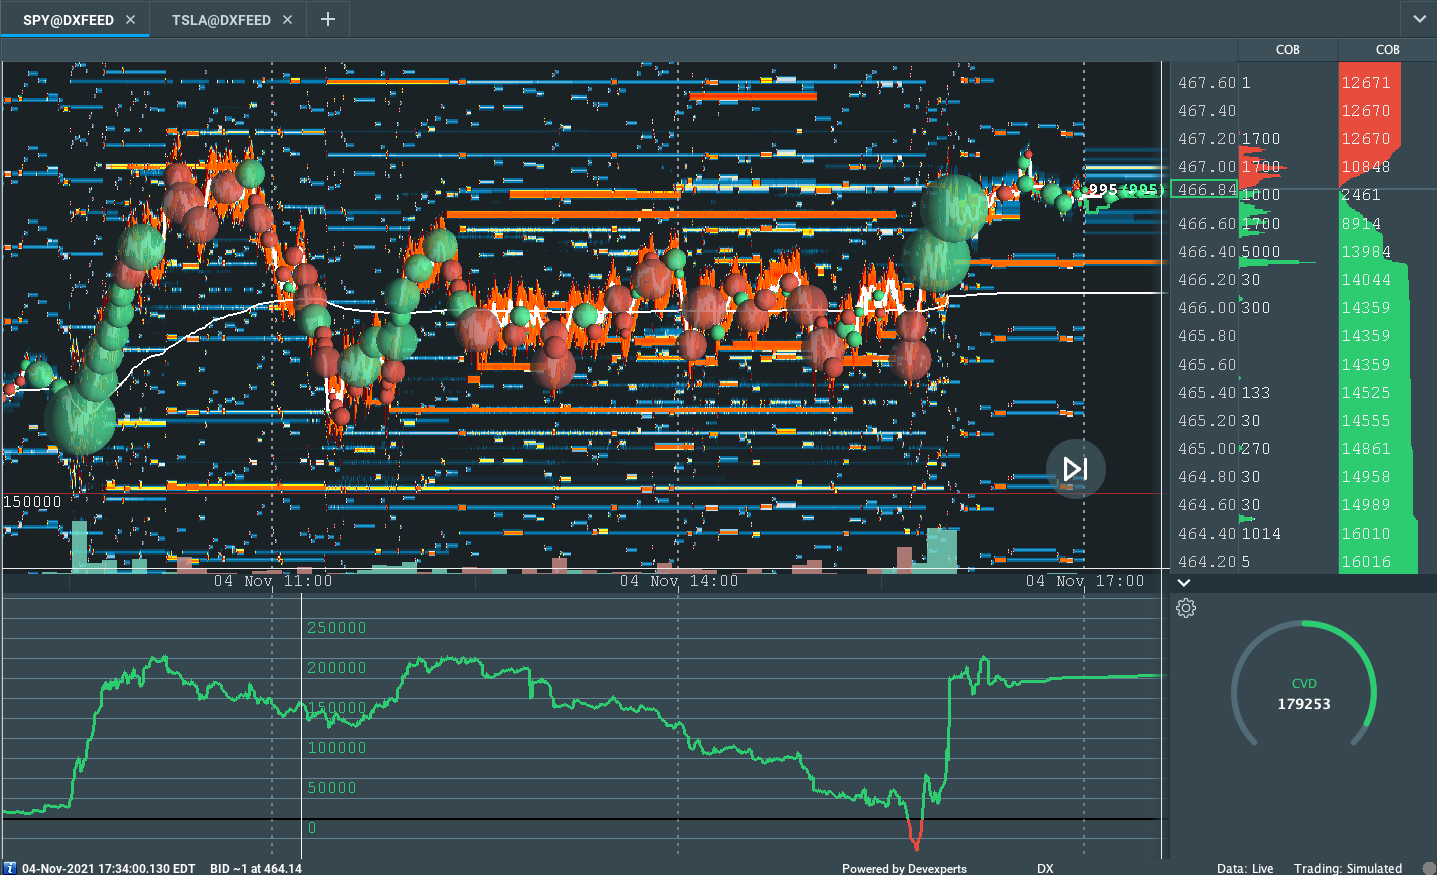
As evidenced by a b-shaped liquidation break profile distribution (i.e., morning drop on fast tempo, followed by sideways trade) there was likely selling by short-term momentum-driven participants who had poor location.

We are confident this may be the case given where the price is, relative to the volume-weighted average price (VWAP) anchored from the Federal Open Market Committee (FOMC) announcement, last week; the average buyer, since then, is losing.

To note, given the context – lackluster breadth and market liquidity metrics – the failure to expand the range, markedly, suggests there was no new money selling.

This activity, which marks a potential willingness to clear stubborn inventory and break balance, is occurring in the face of poor structure down below, a dynamic that adds to technical instability.

Graphic: Divergent delta (i.e., non-committed selling as measured by volume delta or buying and selling power as calculated by the difference in volume traded at the bid and offer) in SPDR S&P 500 ETF Trust (NYSE: SPY), one of the largest ETFs that track the S&P 500 index, via Bookmap. The readings are supportive of responsive trade (i.e., rotational trade that suggests current prices offer favorable entry and exit; the market is in balance).

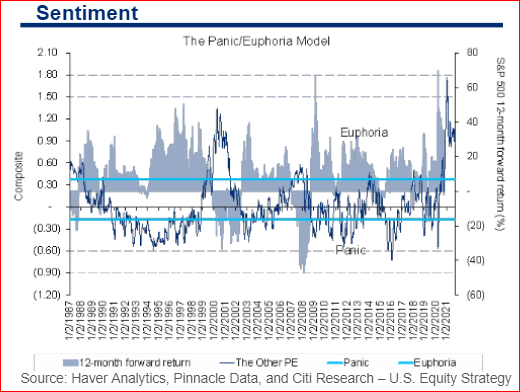
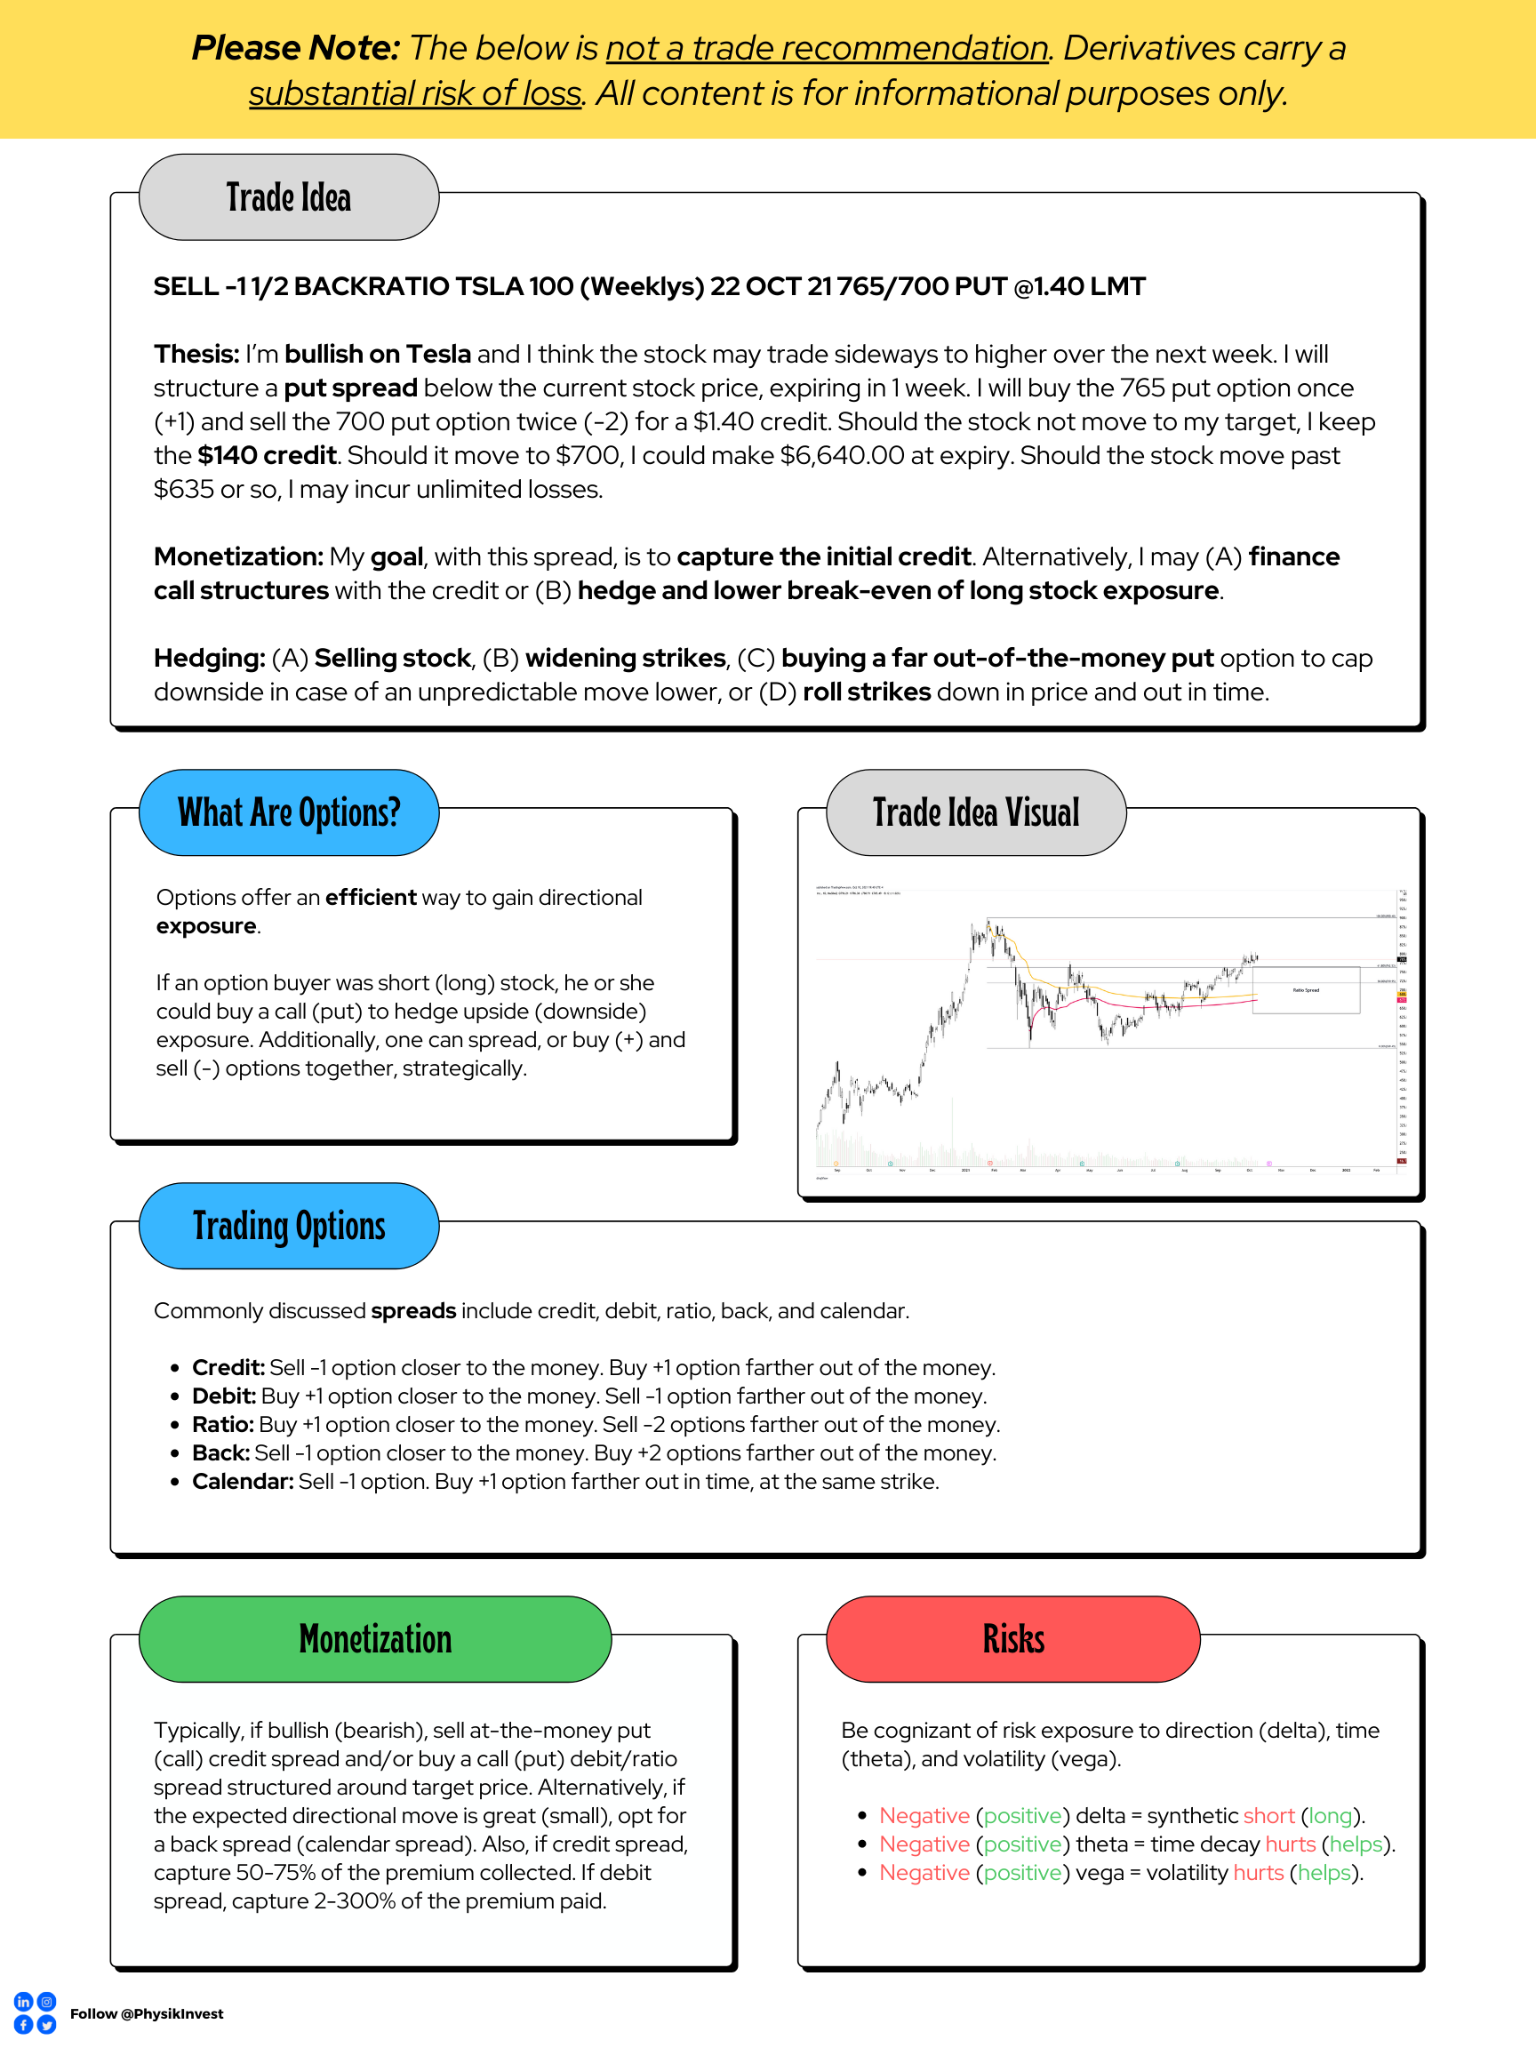
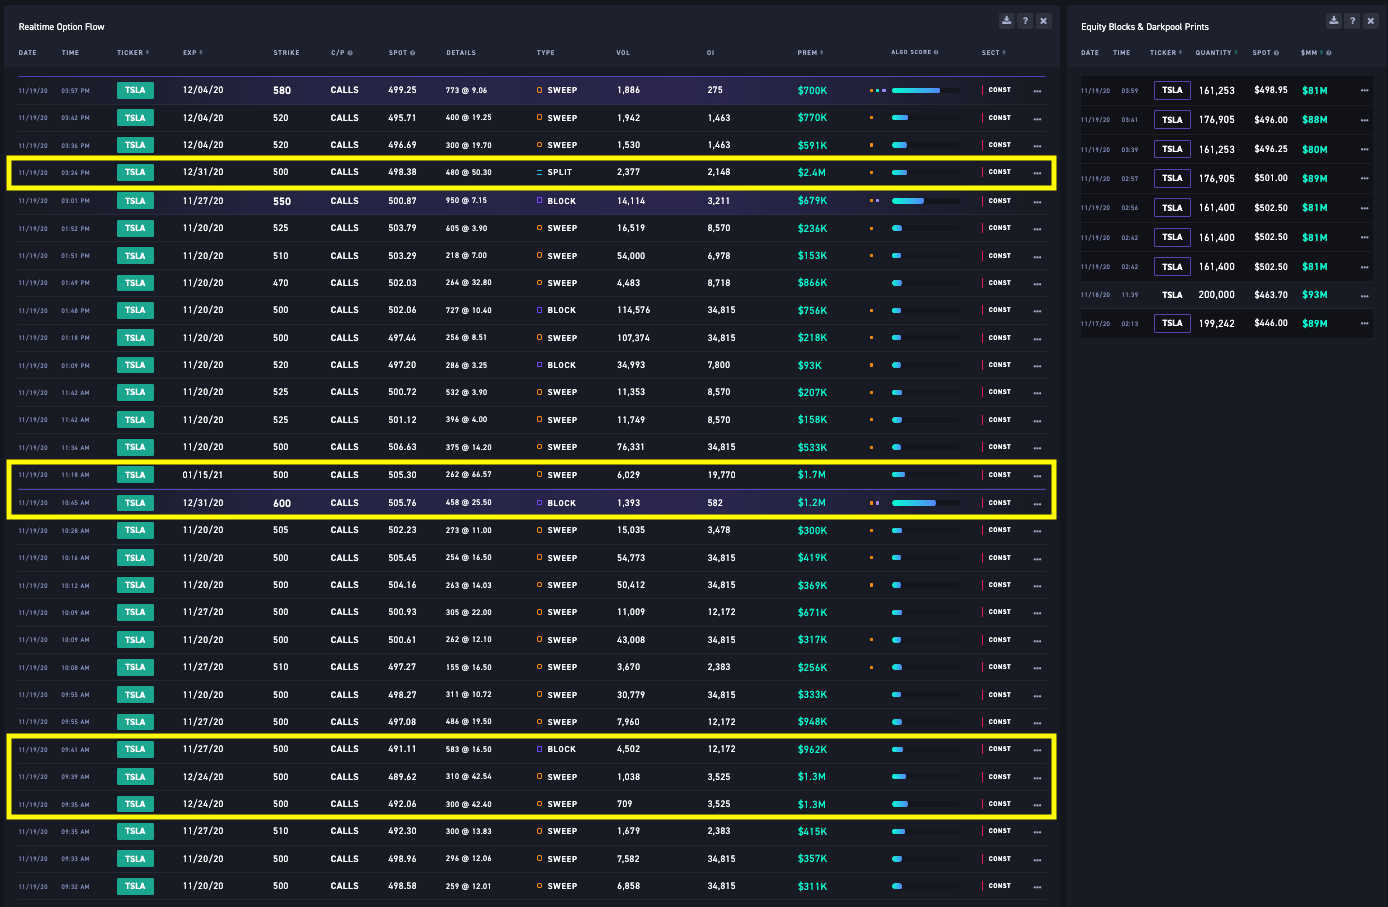
Context: Yesterday, I made an emphasis on some of the “high leverage and risk” short-term speculators’ record call buying and put selling posed on the equity market, at large.

That’s odd. Why? 

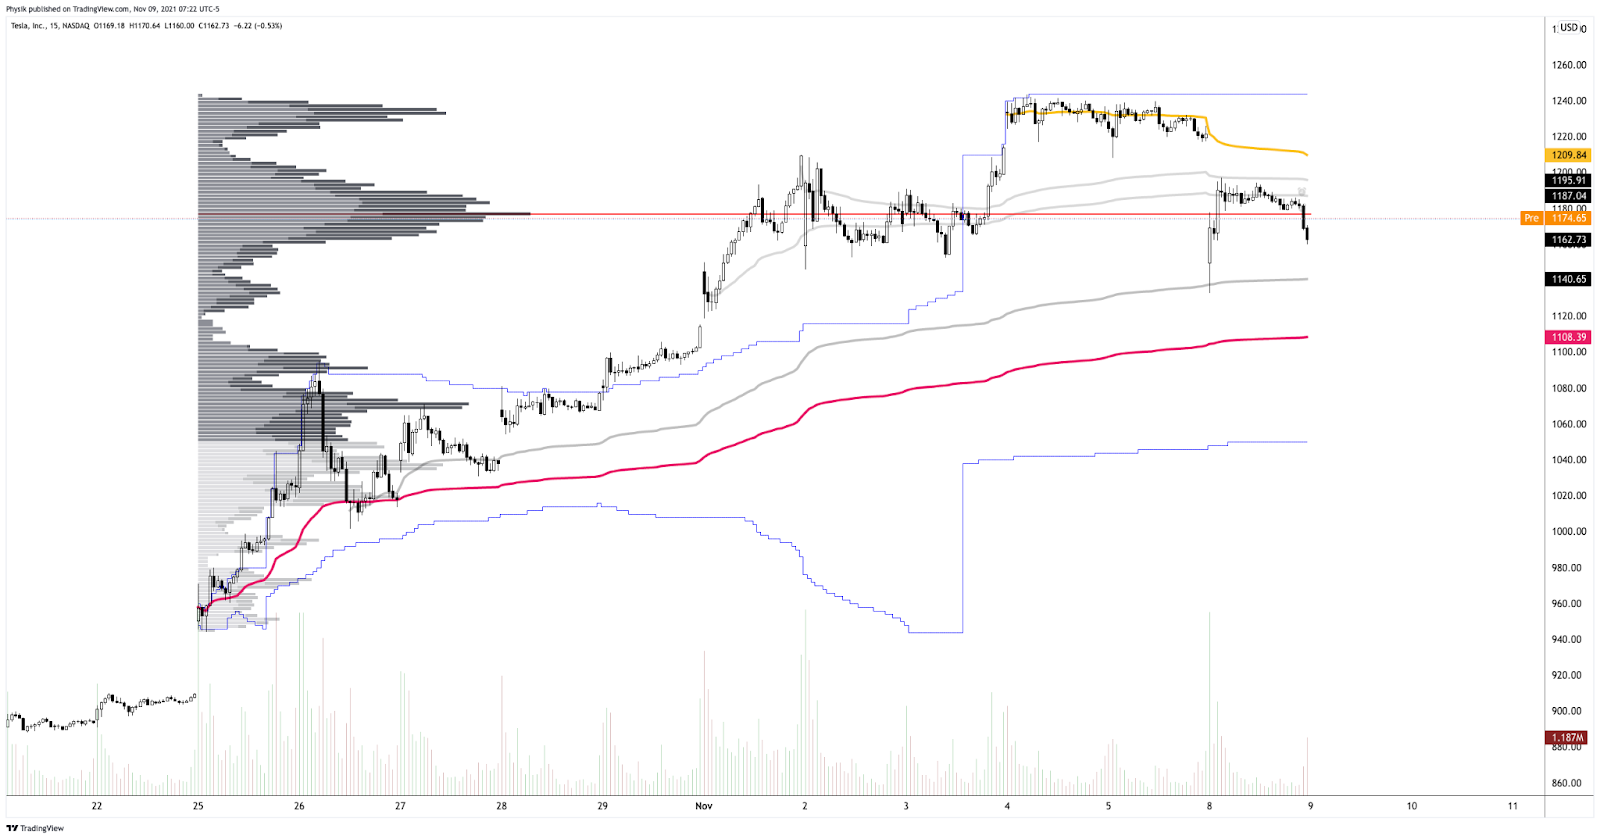
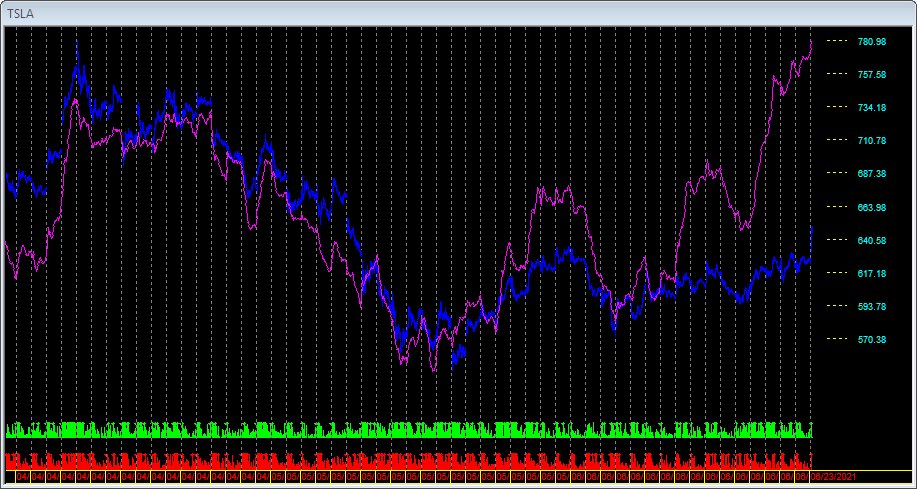
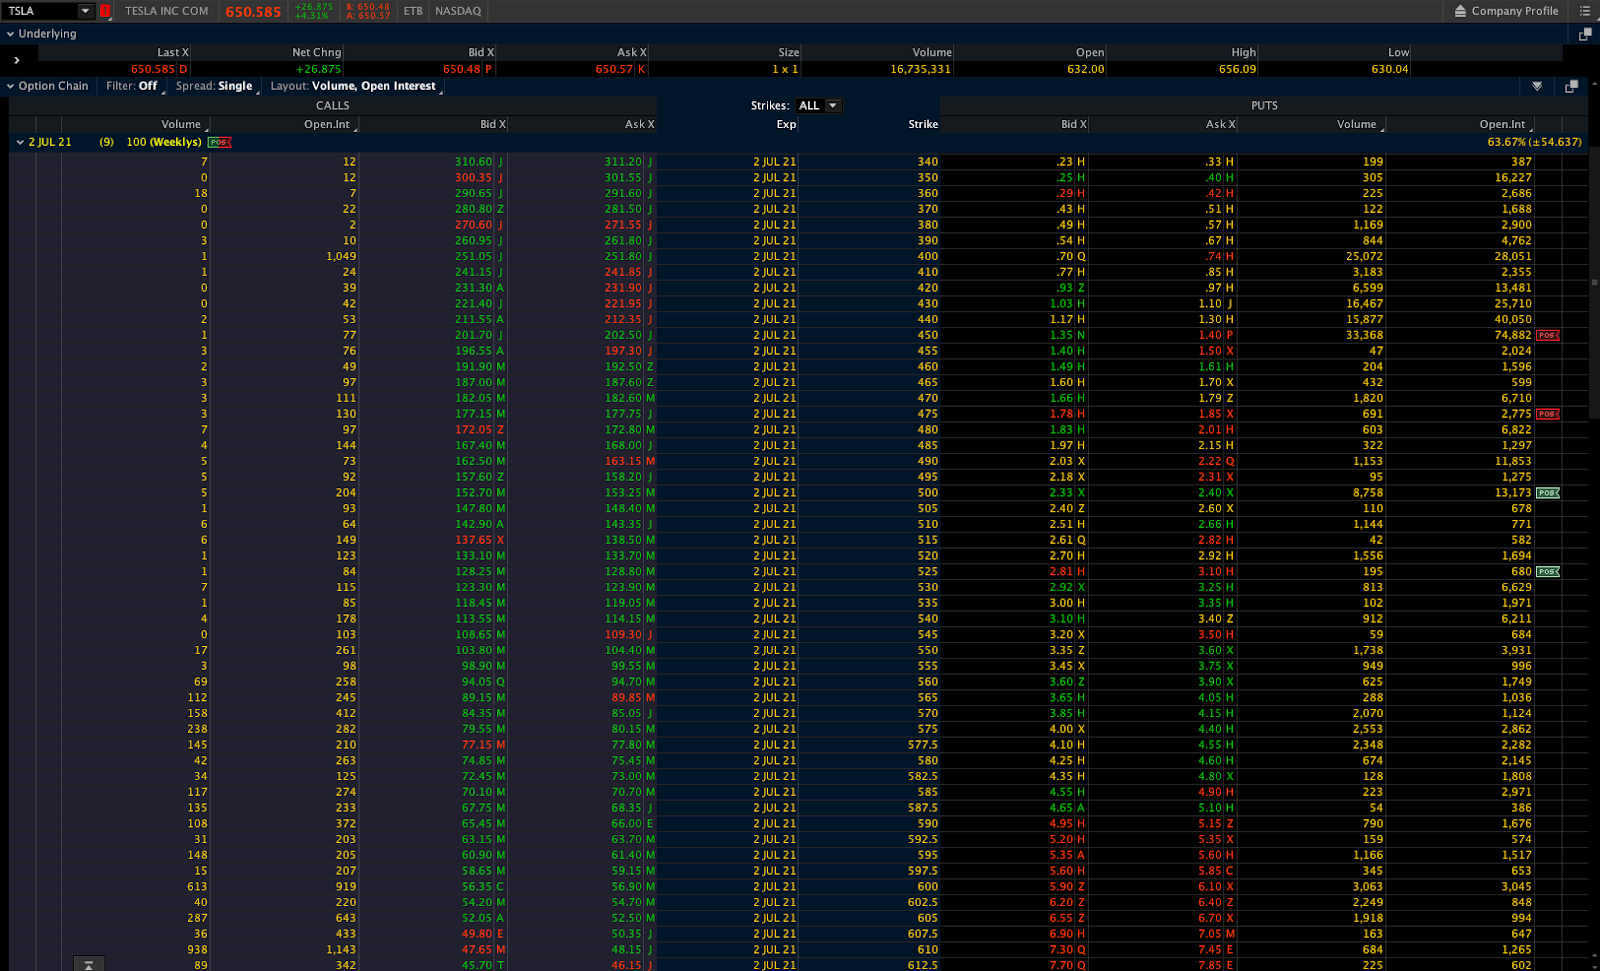
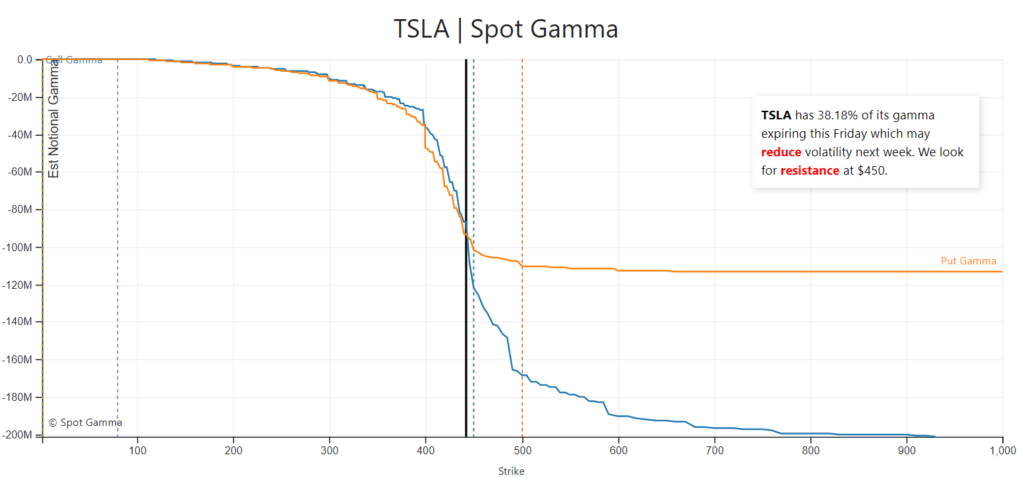
Well, into the near-vertical price rise of highly volatile stocks like Tesla Inc (NASDAQ: TSLA), customers (you and I) signed up, through the agency of counterparties, to add liquidity to the market, via options activity.

Graphic: Customers took on significant leverage in their purchase and sale of options, via SpotGamma.

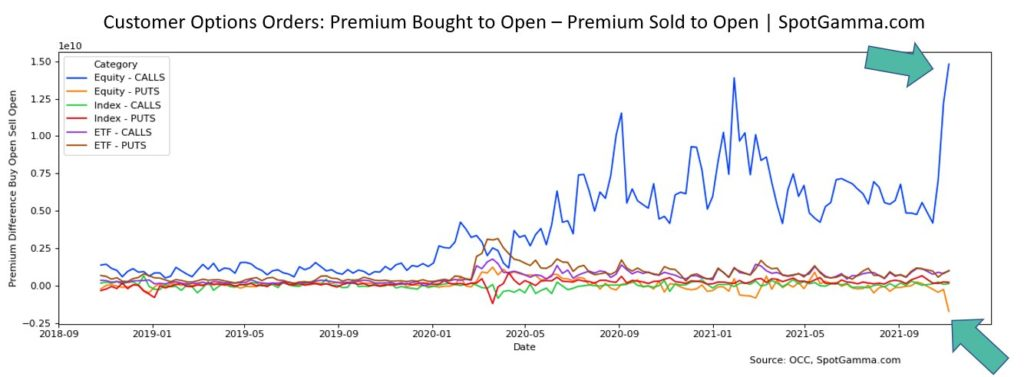
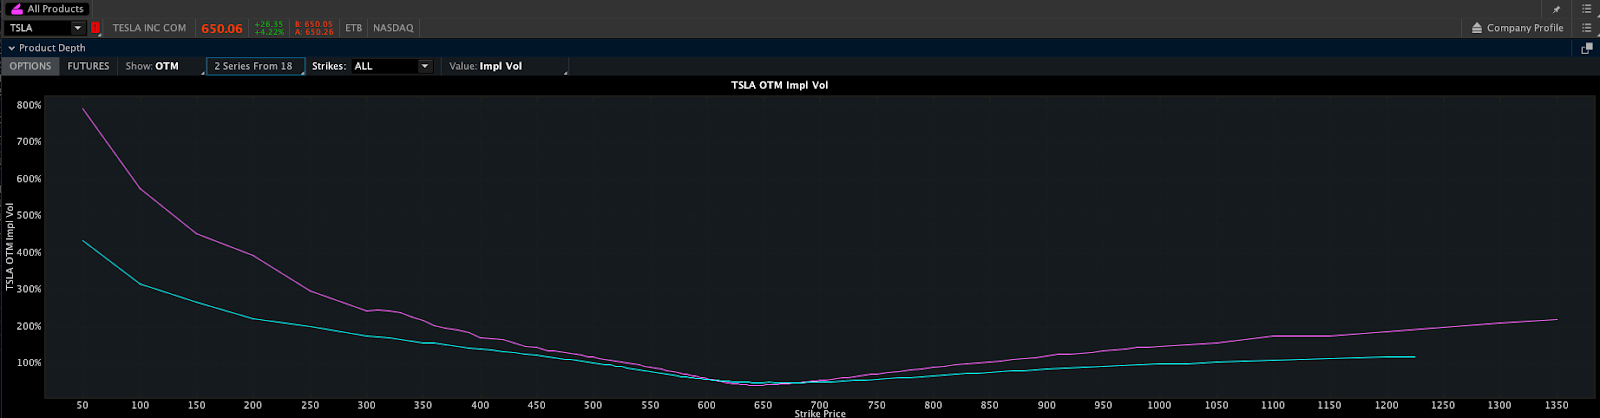
So long as implied volatility remained bid (and stock prices go to the moon) – the effect of inadequate liquidity – counterparties were to exacerbate upside volatility in hedging their exposure to customer positioning. In other words, dealer short-gamma.

Note those participants that take the other side of options trades will hedge their exposure to risk by buying and selling the underlying. 

When dealers are short-gamma (e.g., Tesla), they buy into strength and sell into weakness, exacerbating volatility

When dealers are long-gamma (e.g., S&P 500), counterparties buy into weakness and sell into strength, calming volatility.

Enter shock – Elon Musk selling Tesla stock – alongside a decline in implied volatility, amidst a build of gamma at higher stock prices (which has the effect of dampening realized volatility), we saw the unthinkable happen; high-flying stocks (more so Tesla, which is a large S&P 500 index constituent) turned away from the moon and headed back to earth.

The implications of this were staggering; the bulk of customers’ short puts (long calls) quickly rose (declined) in value and traded in-the-money (out-of-the-money). 

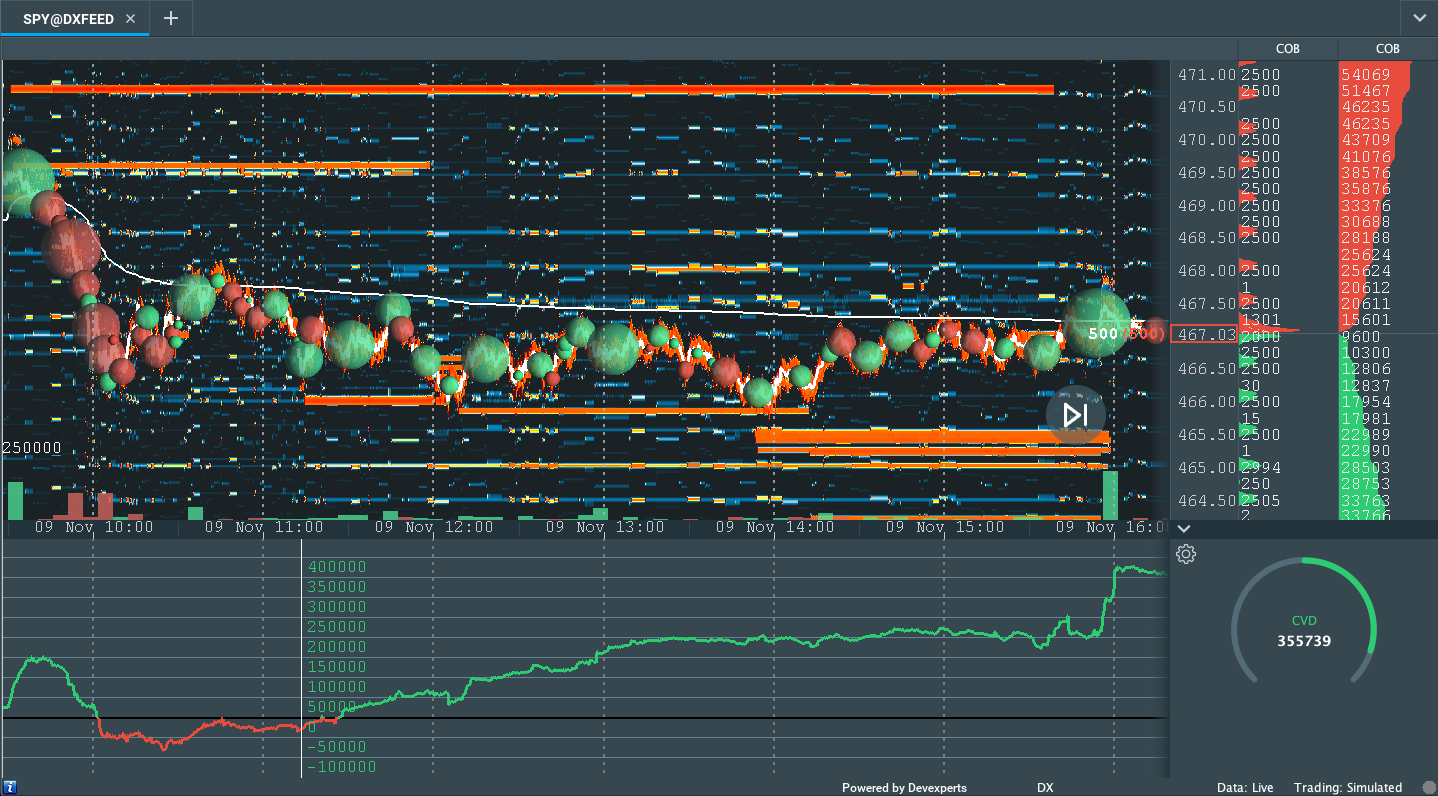
As SpotGamma noted, yesterday, “[t]here was a serious dearth of liquidity to start today’s session,” and volatility rose, as a result, in compensating for that fact.

Now, if customer short put, counterparty long put. 

To hedge, counterparty ought to buy, right? Nope

As SqueezeMetrics explains, “Sold puts are, quite literally, a bunch of huge buy limit orders below the market, and then a bunch of liquidity-taking stop-losses further down.”

Graphic: SqueezeMetrics unpacks implications of short put options on the limit order book.

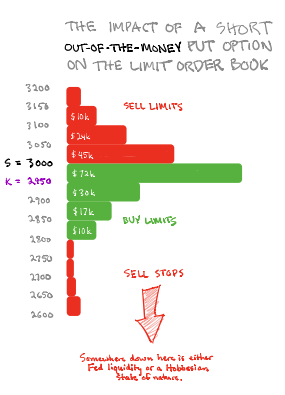
This is, to put it simply, due in part to short-term speculators lacking the wherewithal to stay in these margin-intensive positions; as price falls, put buying (covering of shorts, too) takes liquidity and destabilizes the market.

We’re starting to see this activity, in individual stocks, affect the S&P 500 complex, too

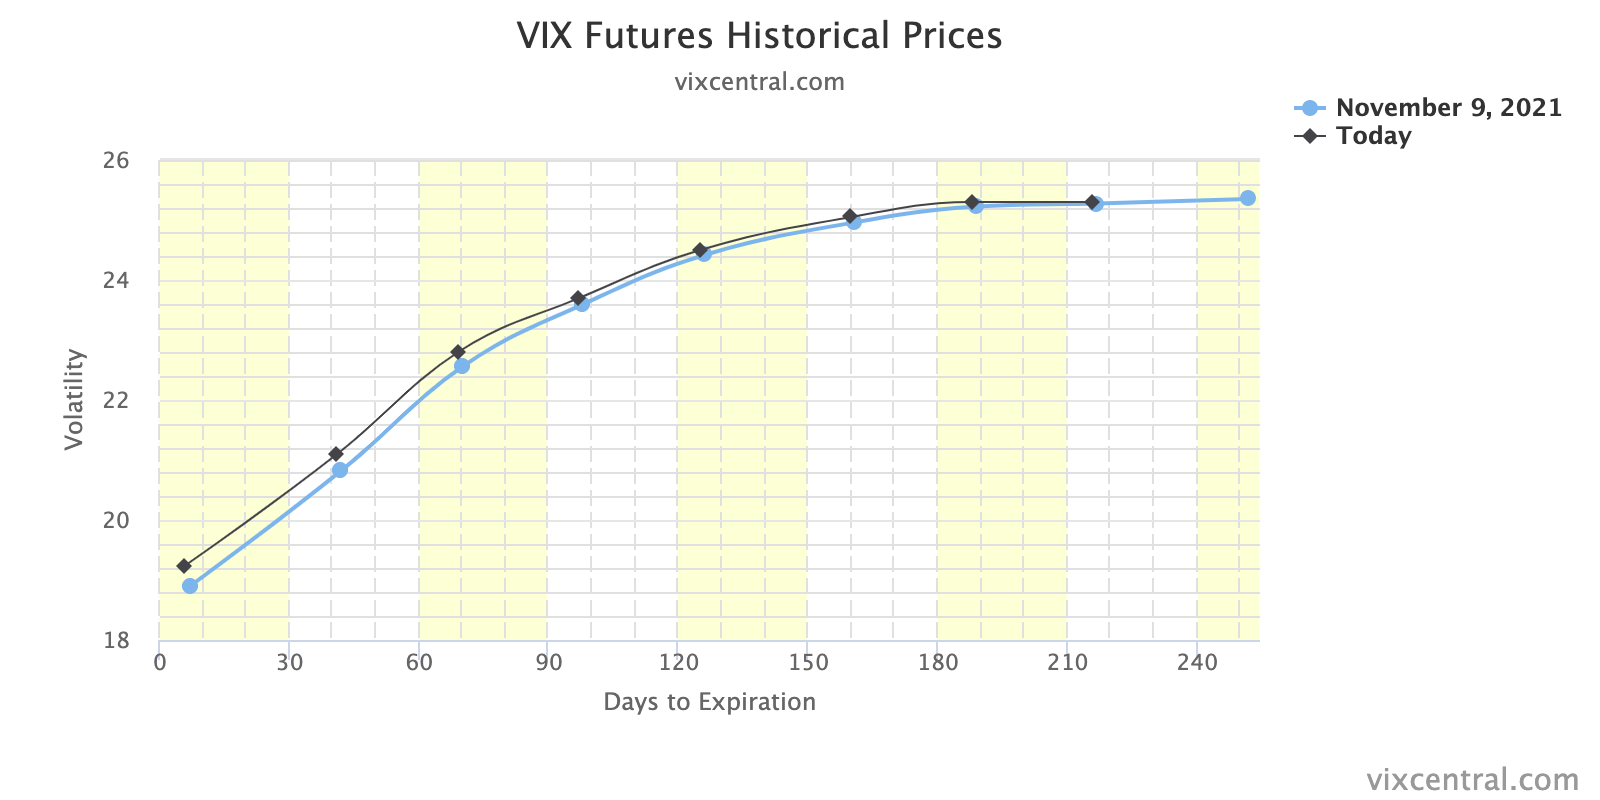
The CBOE Volatility Index (INDEX: VIX) was higher, with demand coming in across the front area of the VIX futures term structure, mostly; both suggest a demand for hedges and a reduction in the flows (e.g., vanna) that support sideways to higher trade. 

Graphic: Demand for options hedges comes in at the front end of the term structure.

That has already been reflected by the trend of outperformance in the extended day. 

In other words, the front-running of increasingly impactful (and supportive) vanna and charm flows (both of which are tied to the hedging of options exposure), as a result of increased options activity (which, at least at this juncture, exposes customers to high leverage and risk), seems to be changing, slowly. 

We’re (likely) opening sideways to lower today. That’s a change, for once!

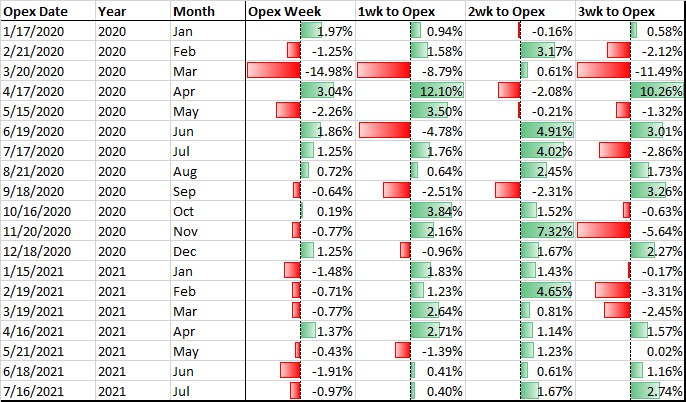
With expectations that there may be a front-running of the monthly (OPEX) options expiration (into which the forces that promote pining usually turn stronger with counterparties supplying more liquidity as their long gamma rises), a time when dealer gamma exposure is to decline, allowing for increased realized volatility (as a result of less liquidity), the added demand for hedges (as evidenced by the bid in volatility and VIX term structure shift), is of concern. 

Participants have been uber bullish, up until early this week. Should sentiment turn, and (1) those participants cover their levered, long delta exposure alongside (2) new money hedging, tempo ought to quicken; an abrupt liquidation could be in the cards.

Graphic: @pat_hennessy breaks down returns for the S&P 500, categorized by the week relative to OPEX. 

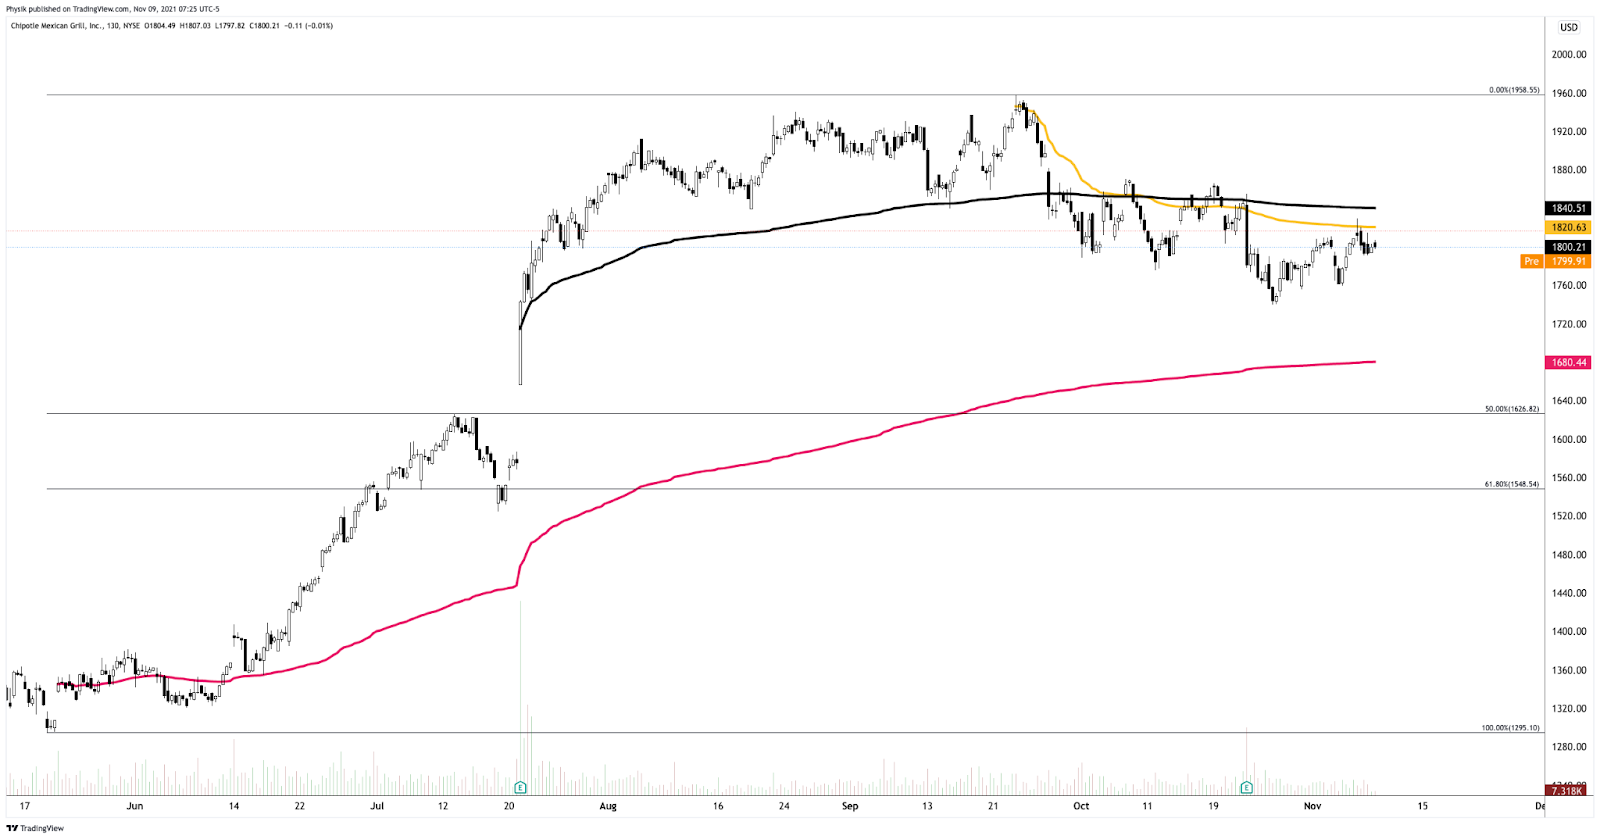
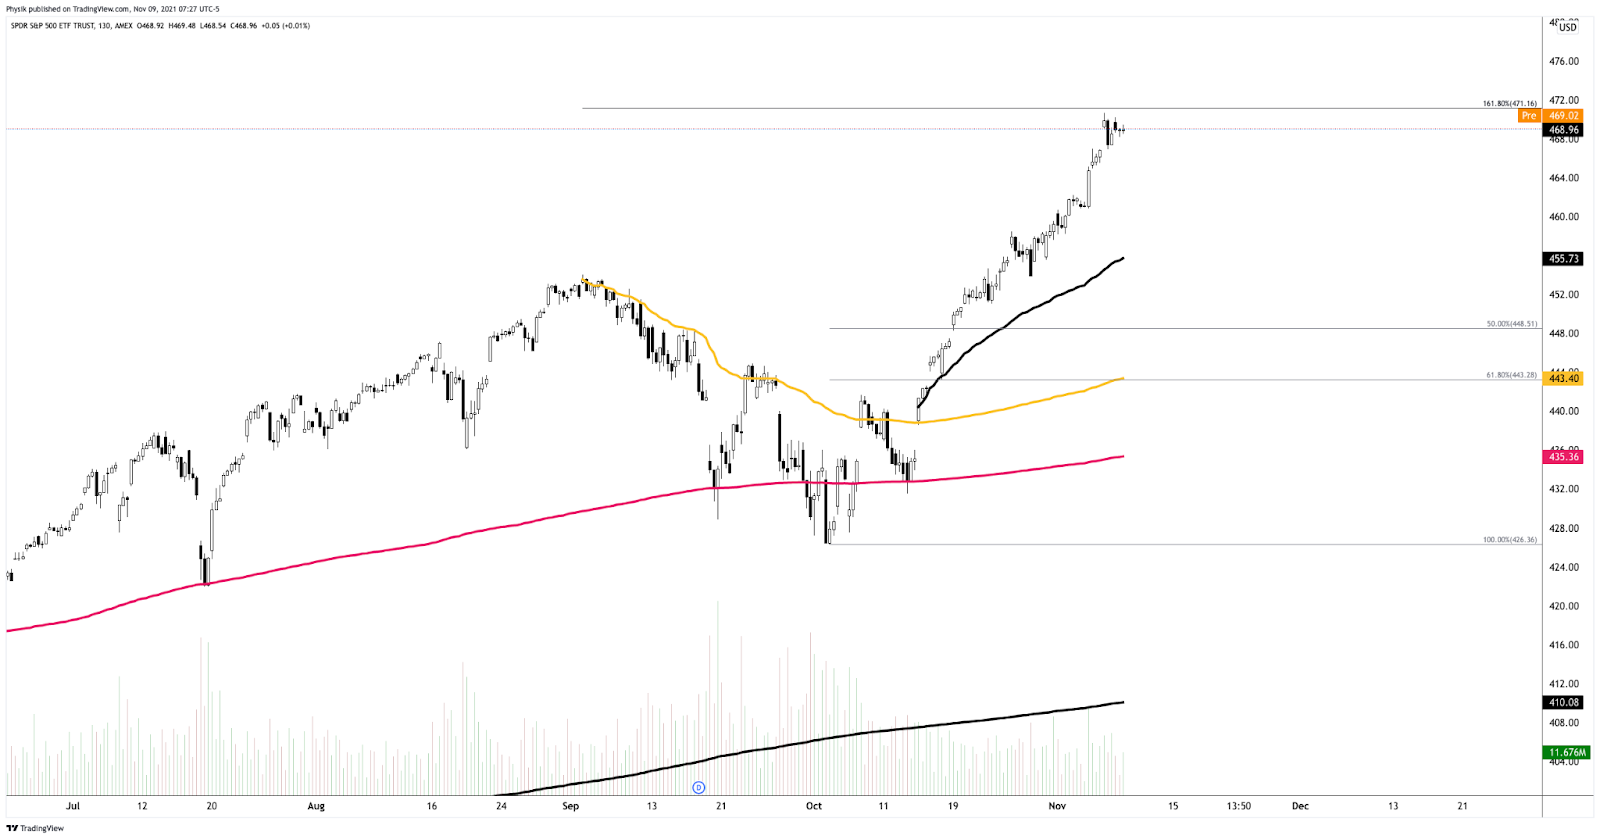
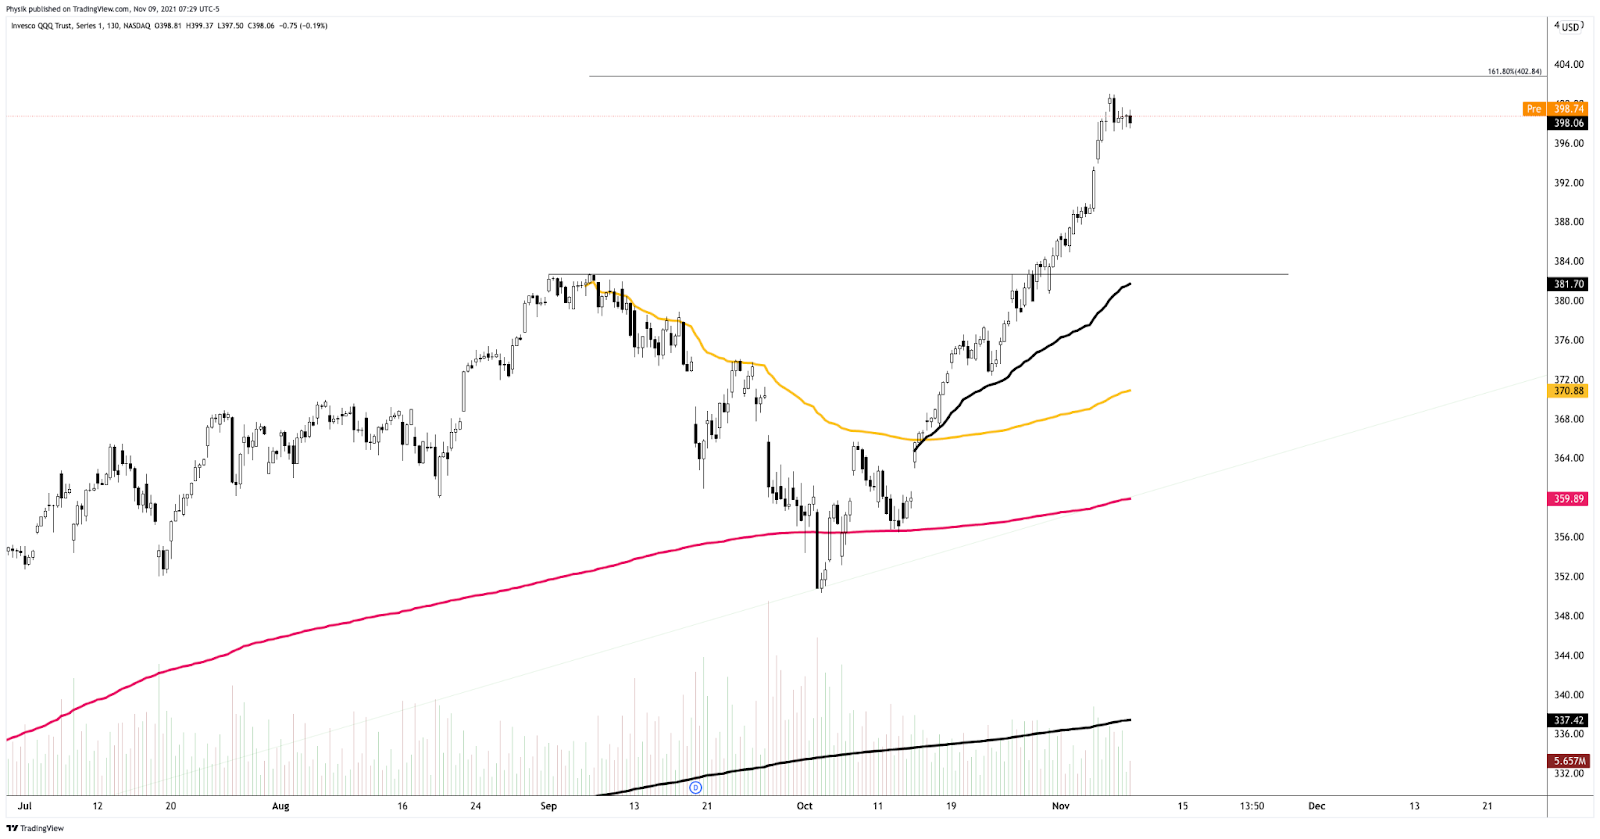
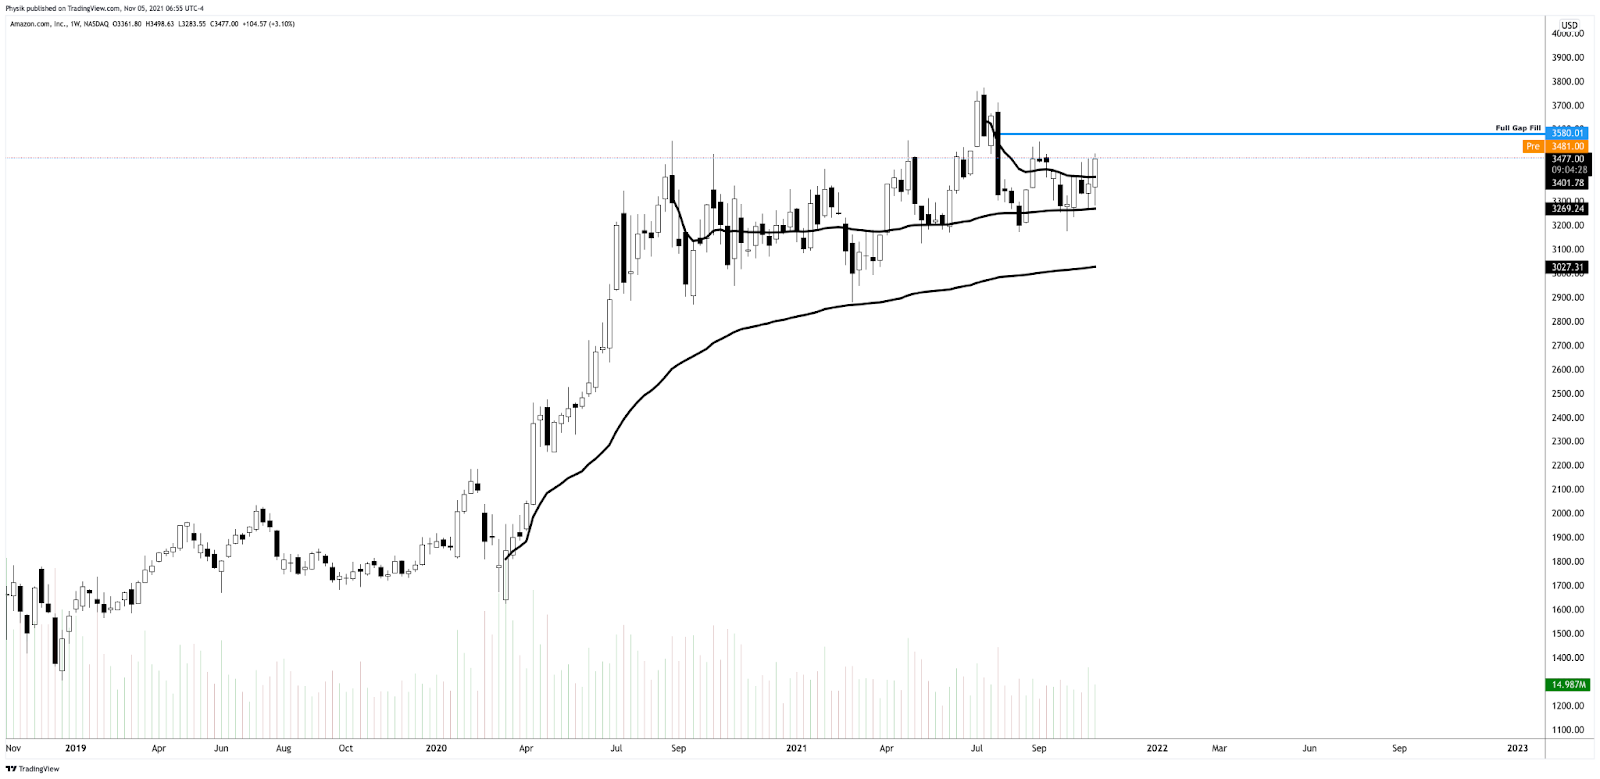
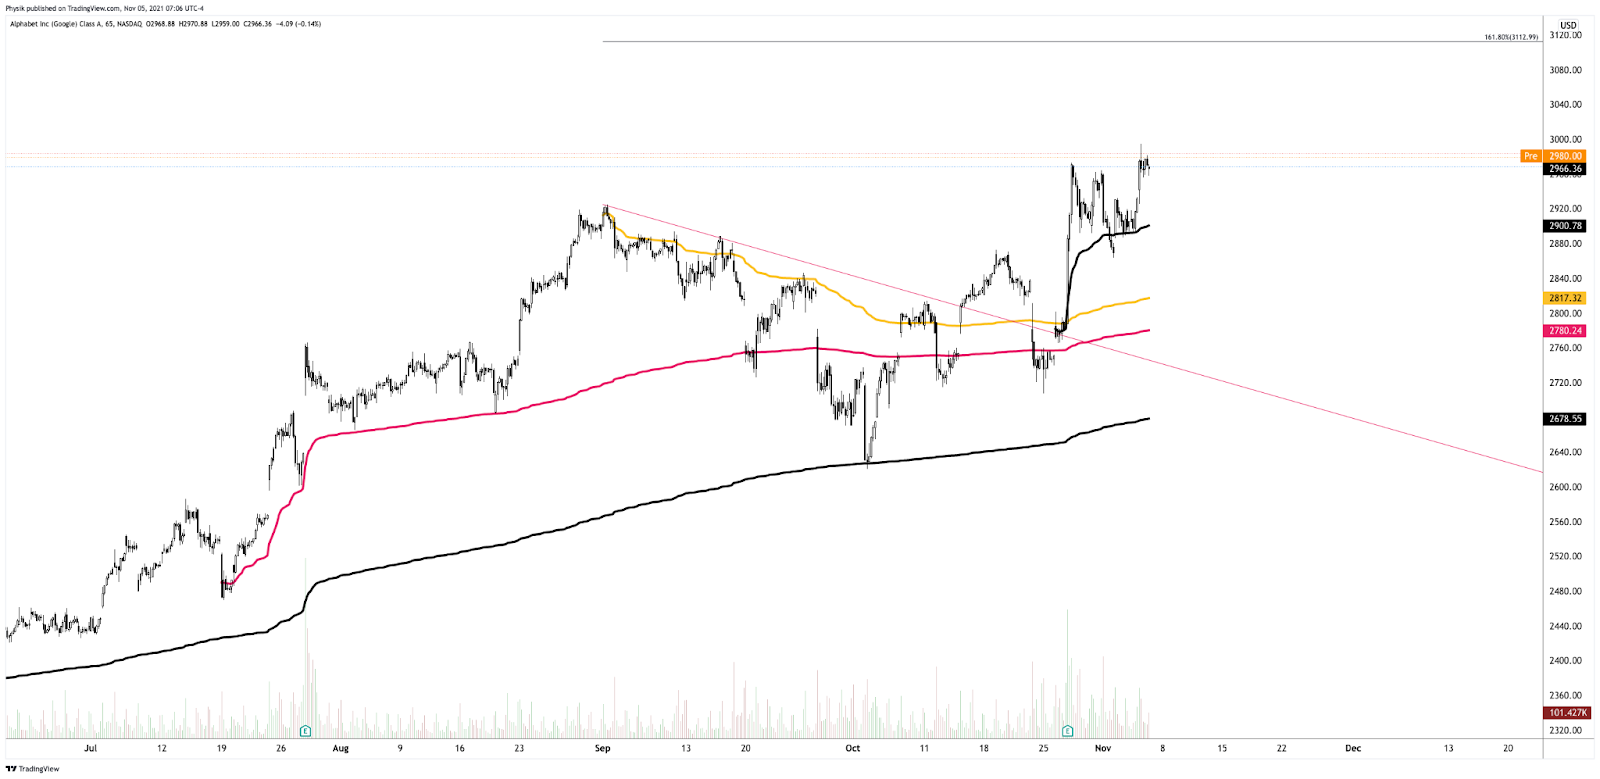
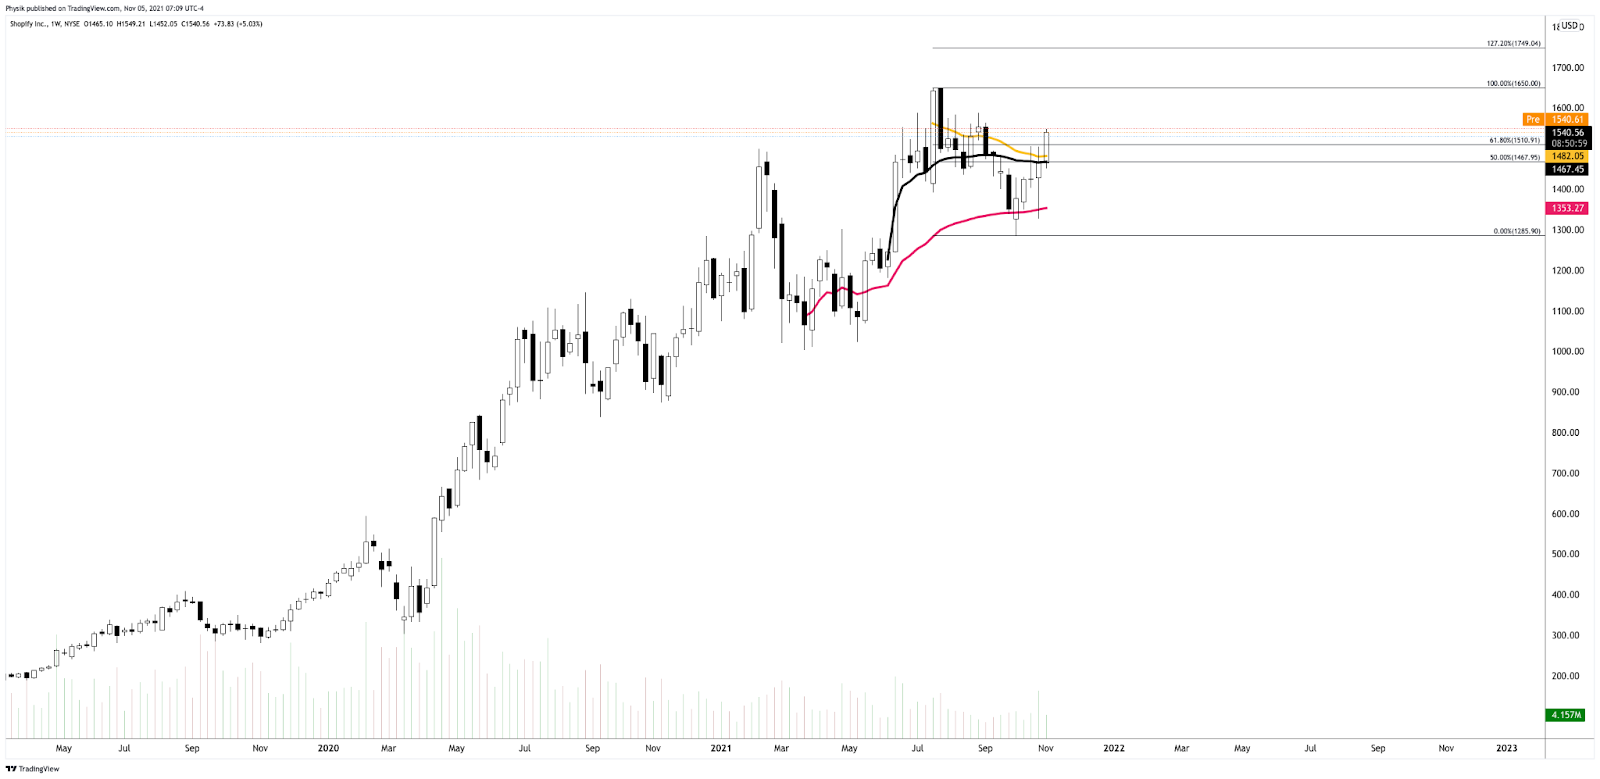
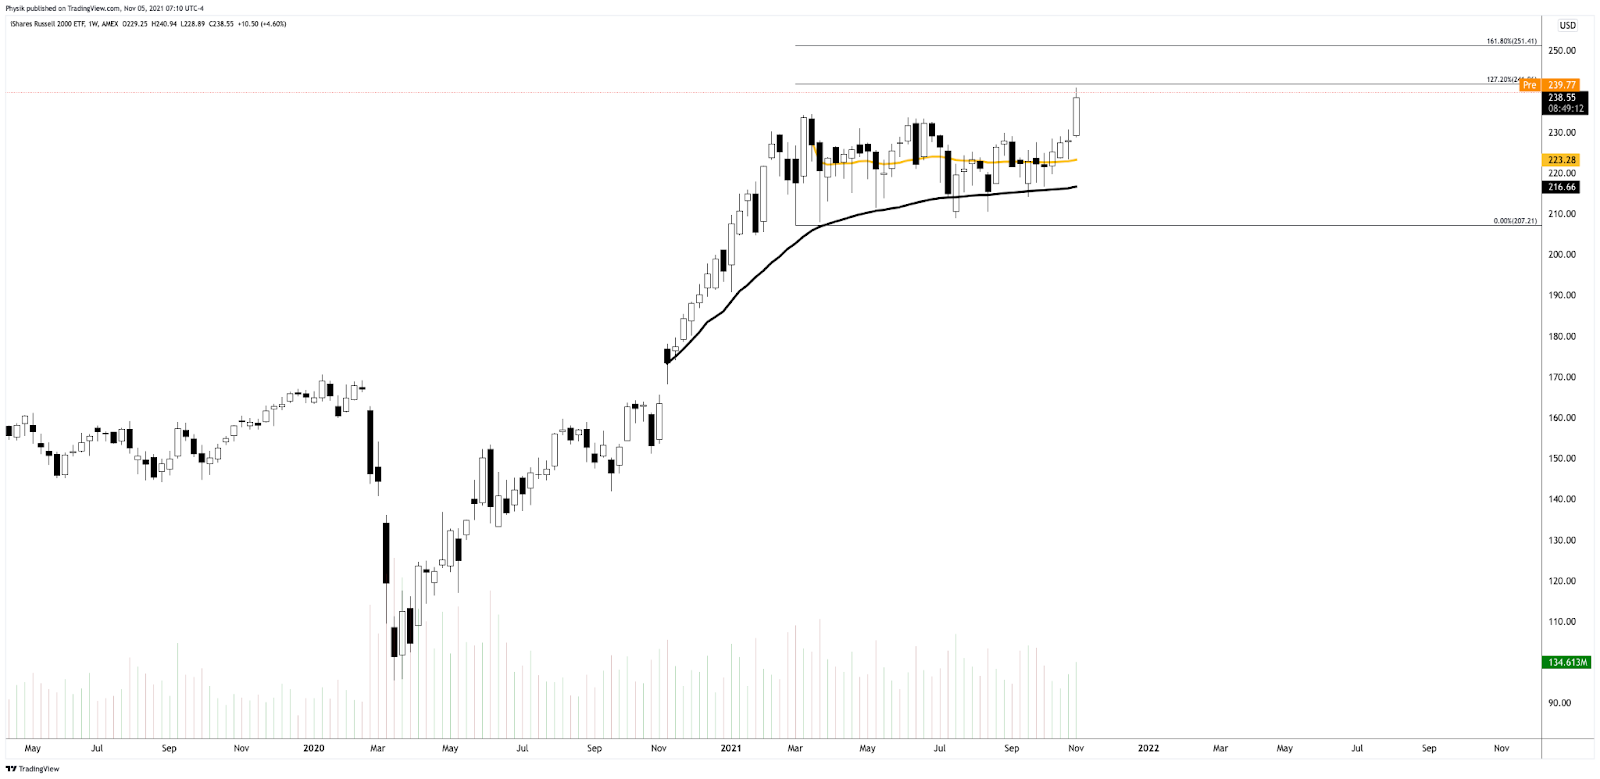
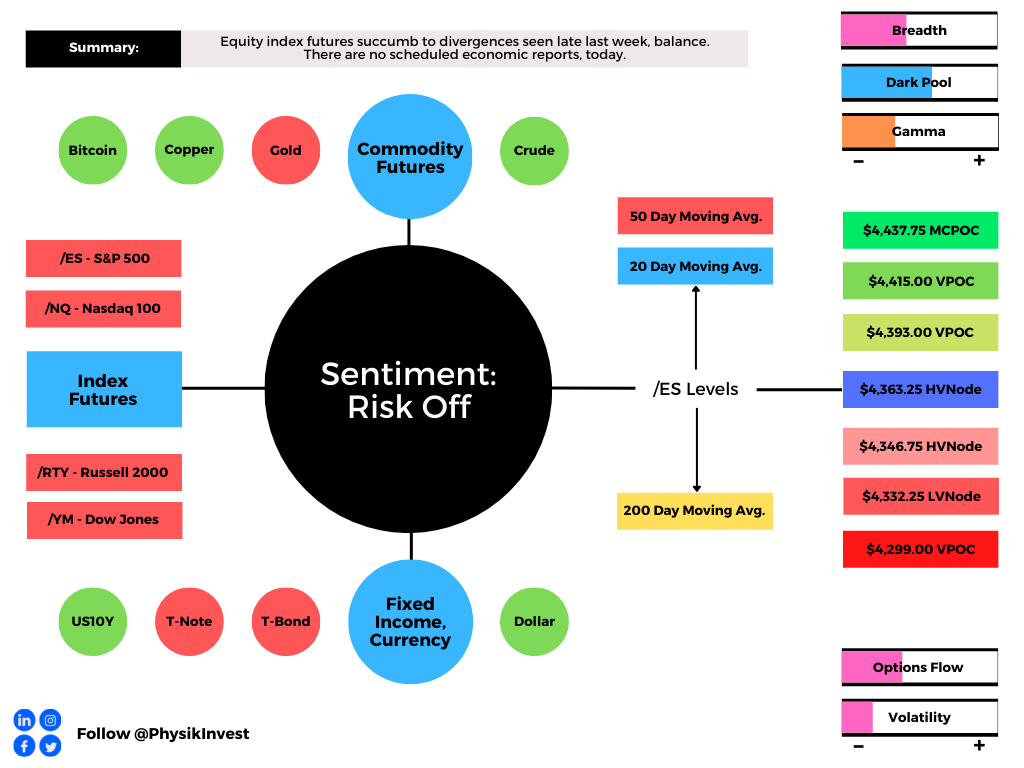
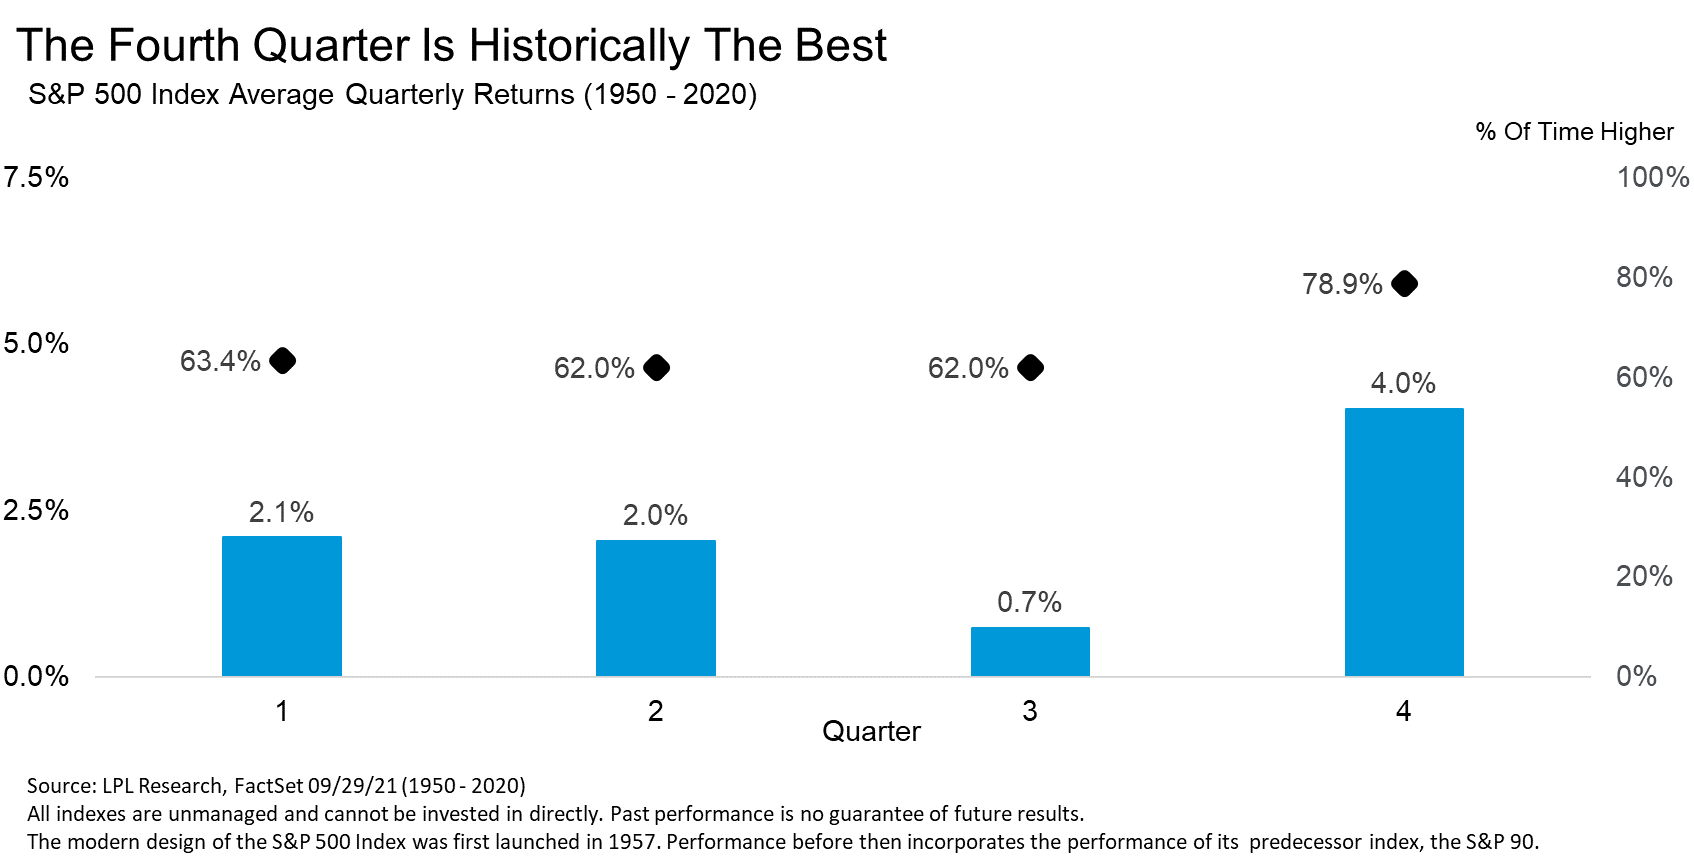
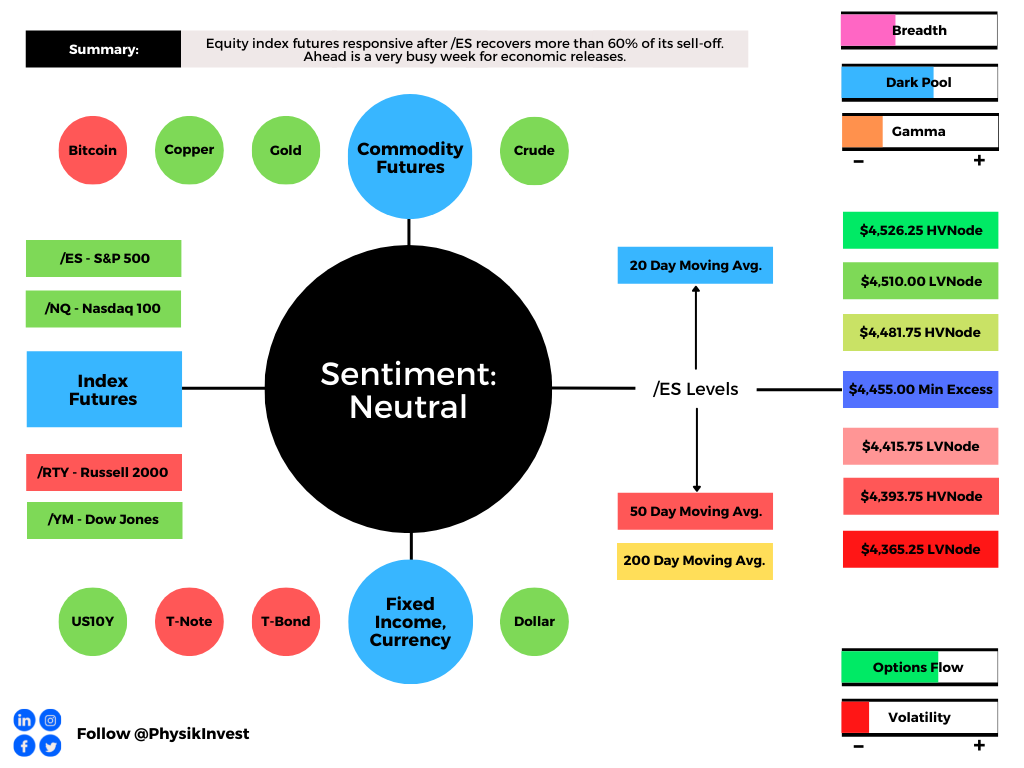
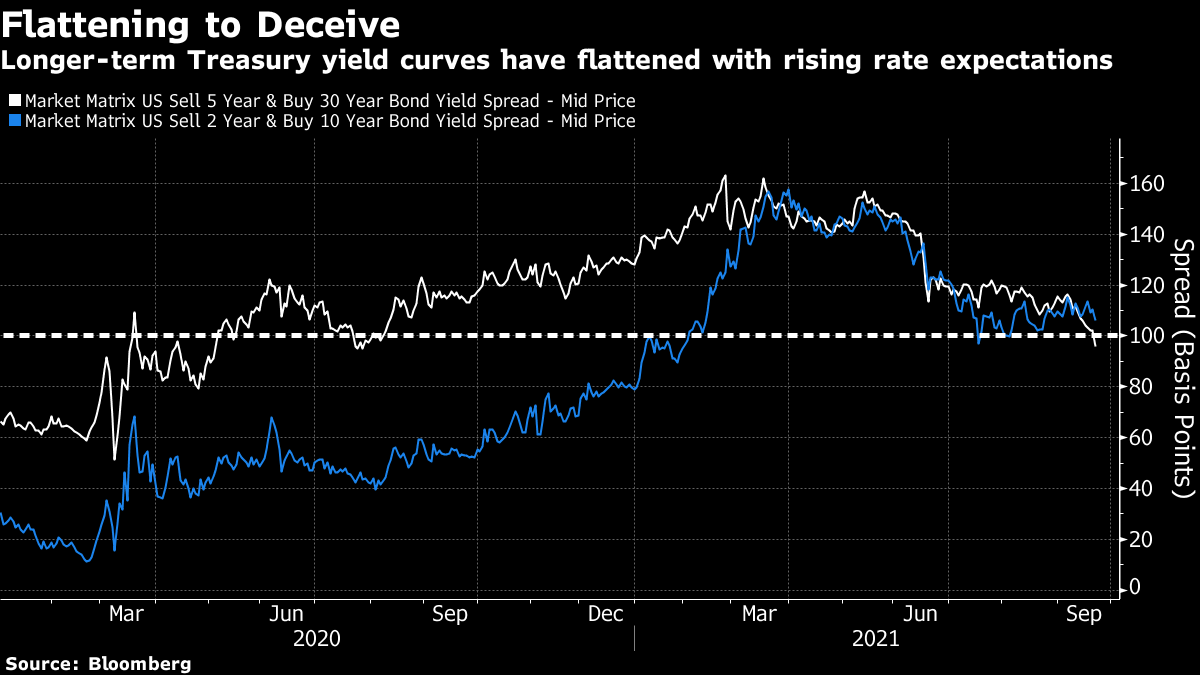
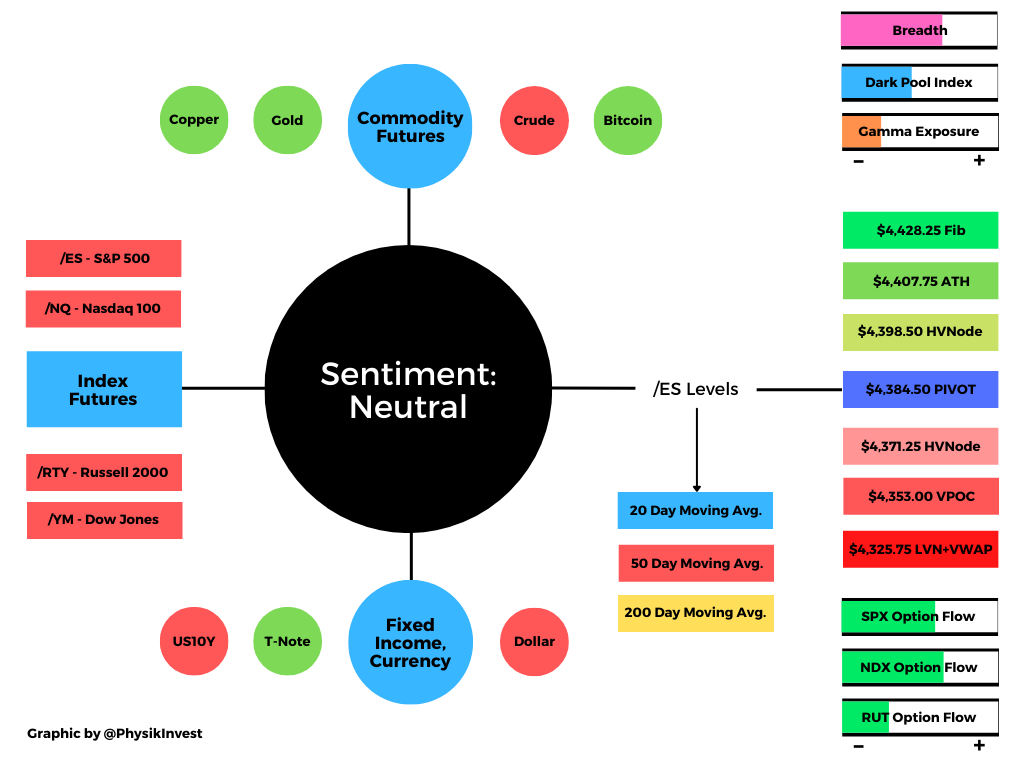
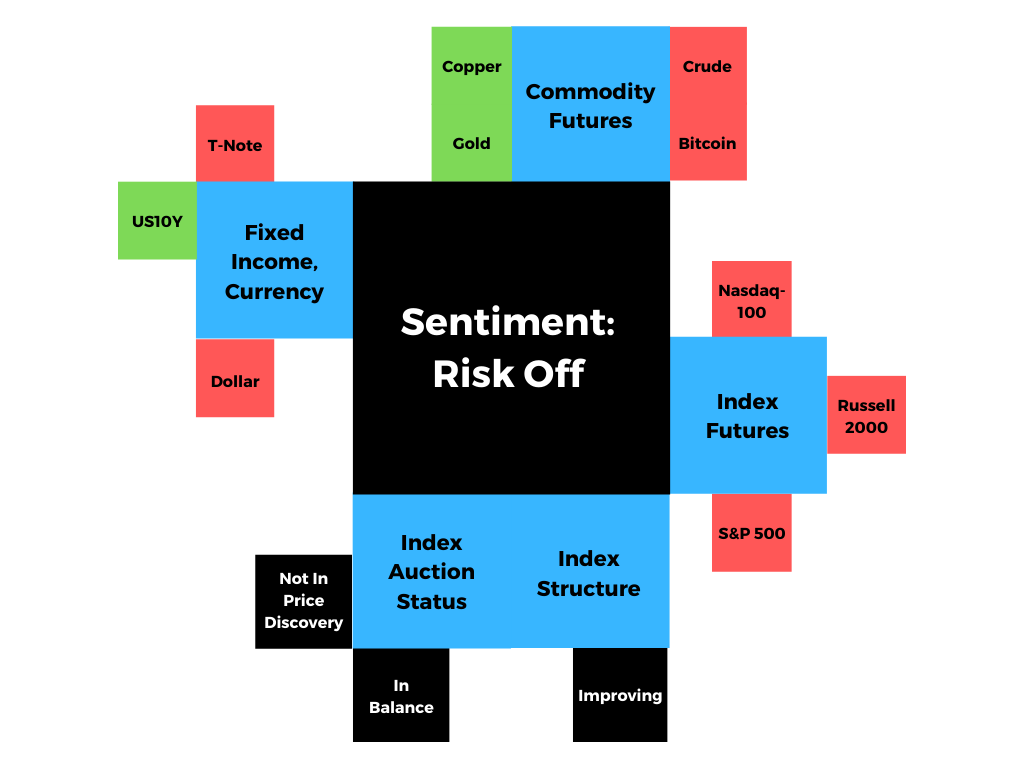
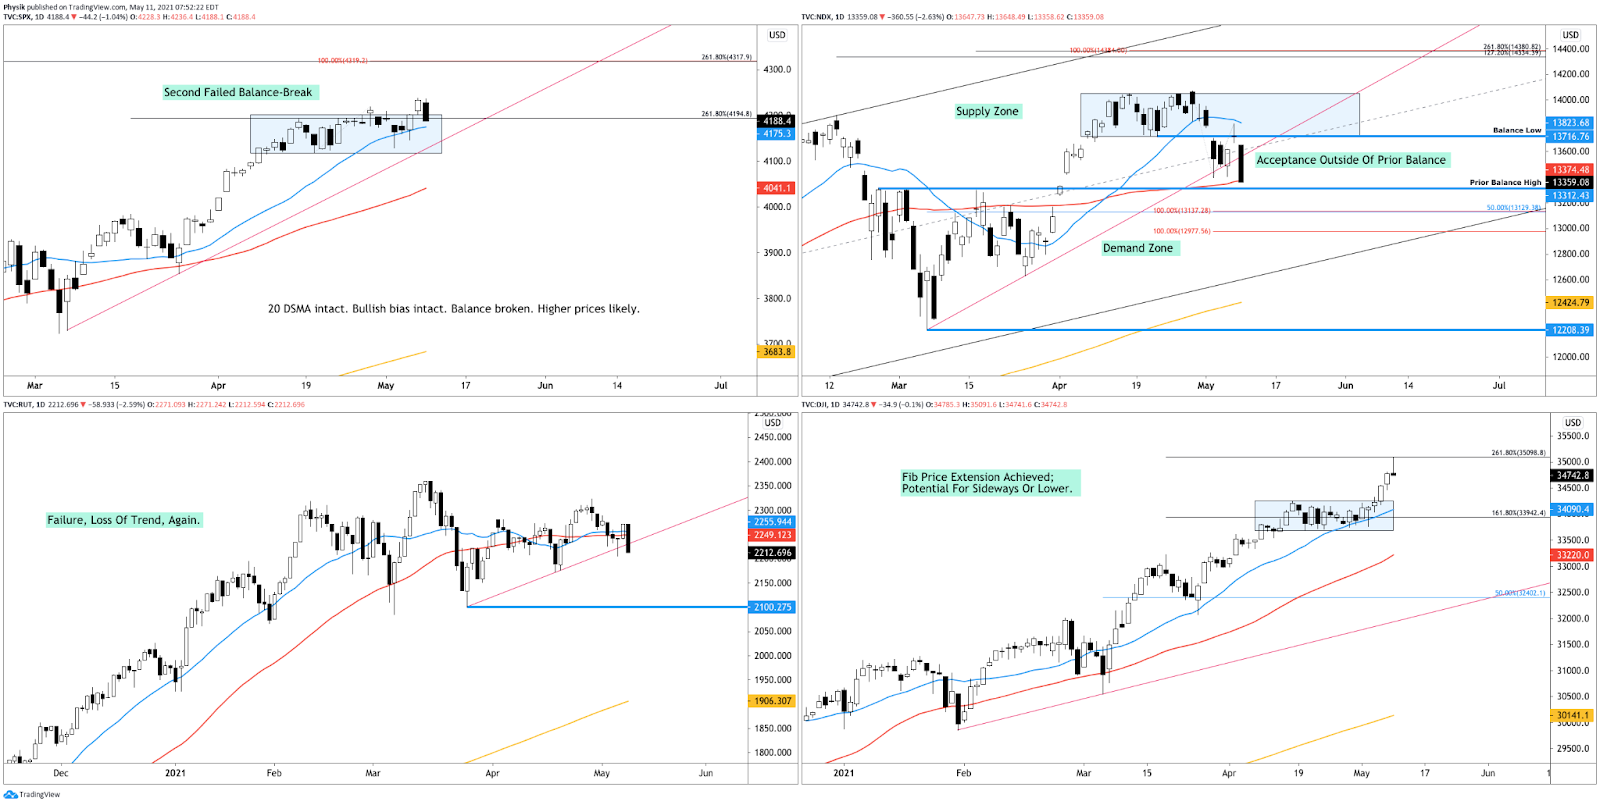
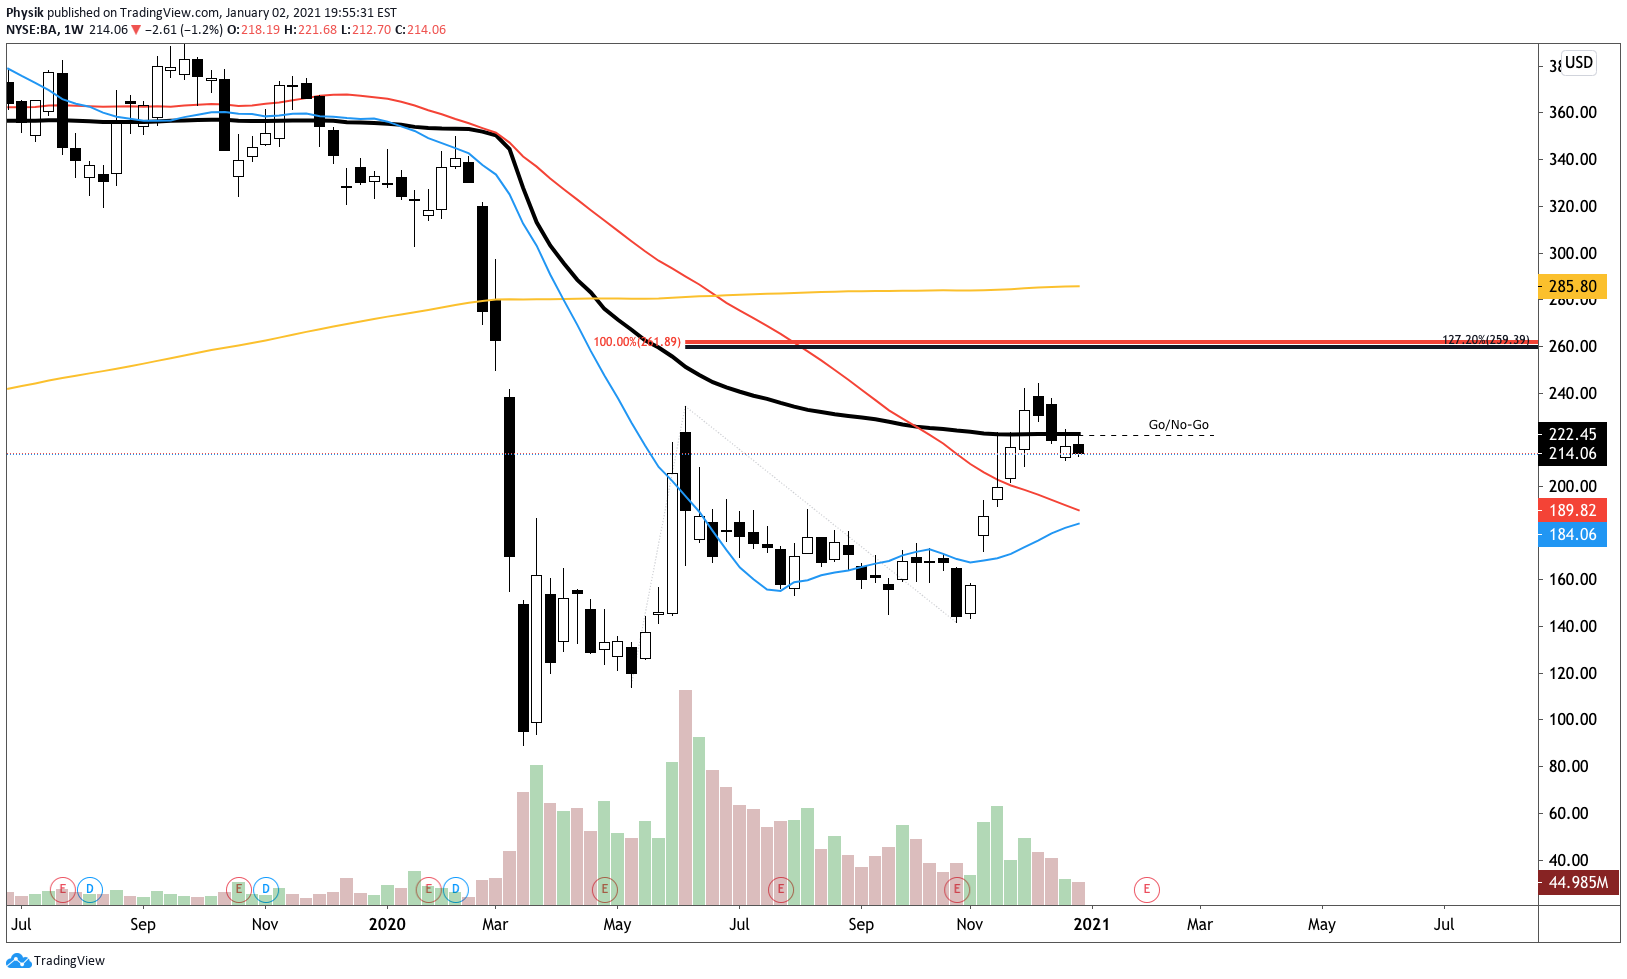
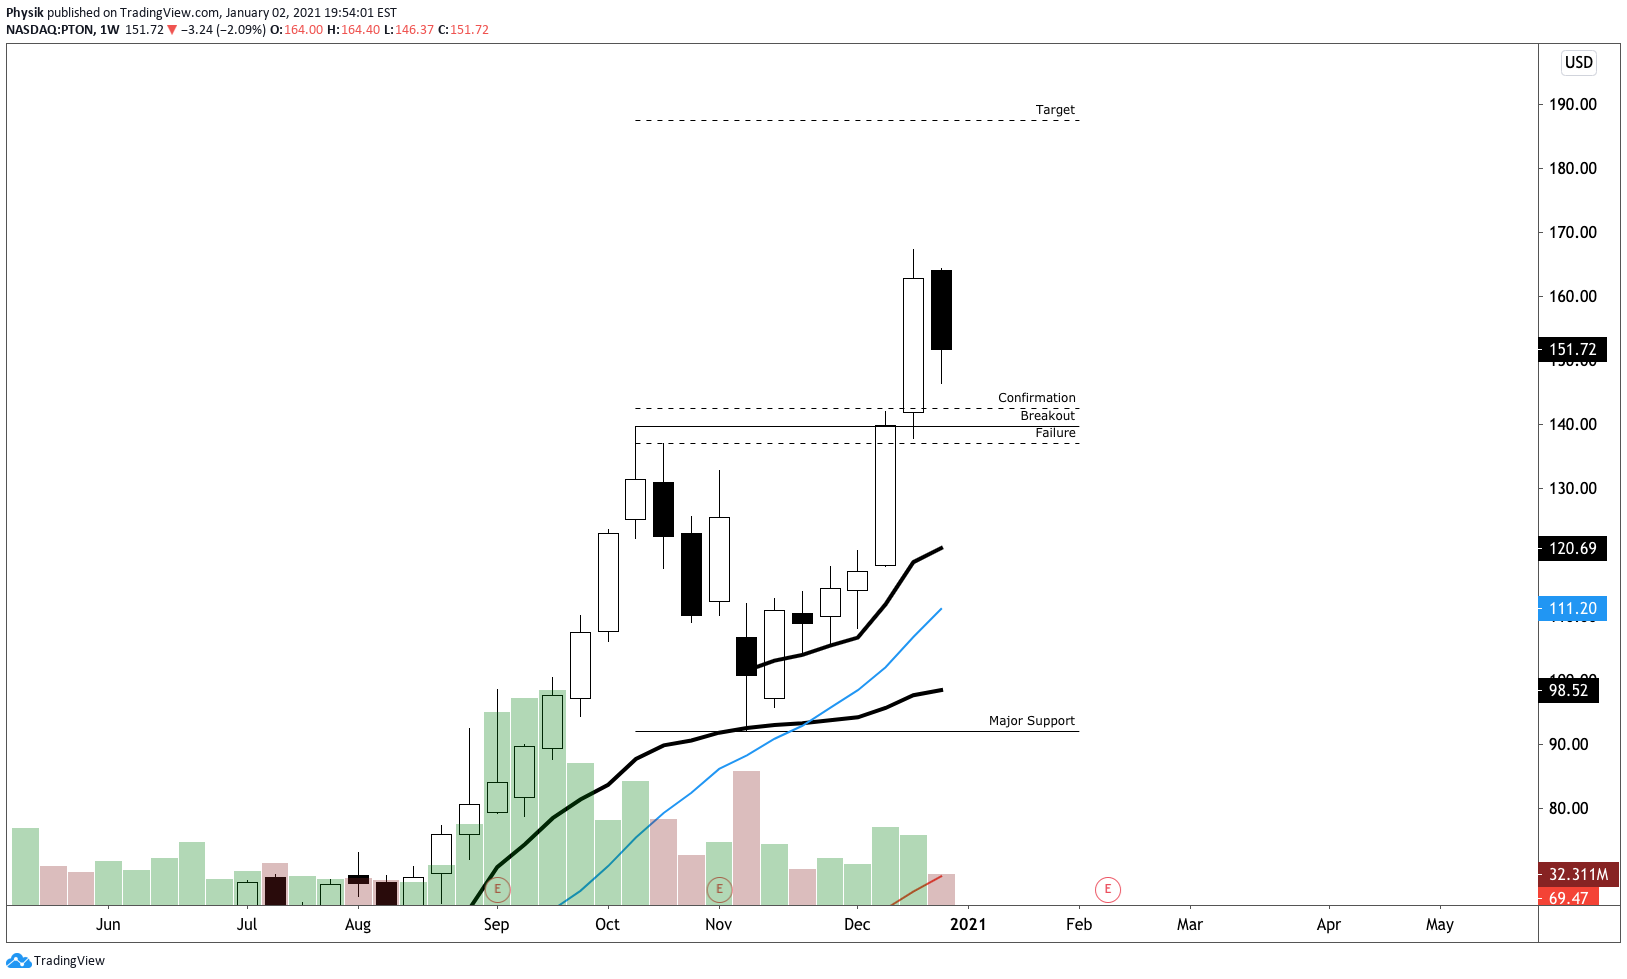
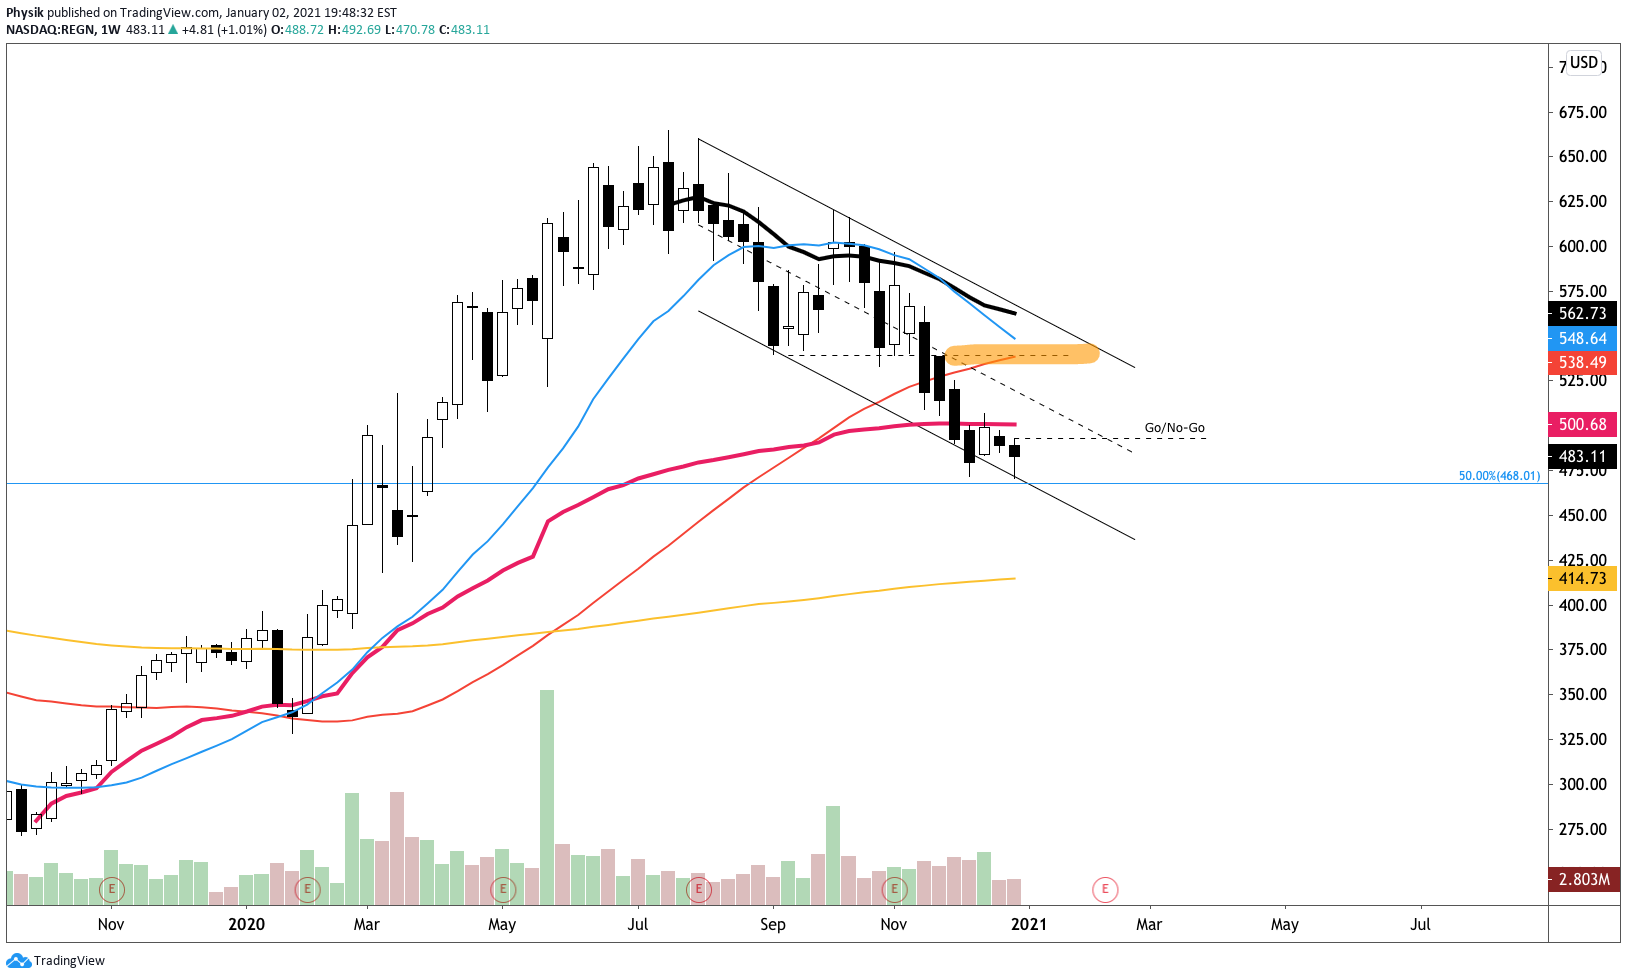
In light of seasonality, buybacks, and earnings surprises, the potential for a rally into the end of the year remains strong. As a result, we start to look for big picture references where we may see responsive buying. See the graphic below!

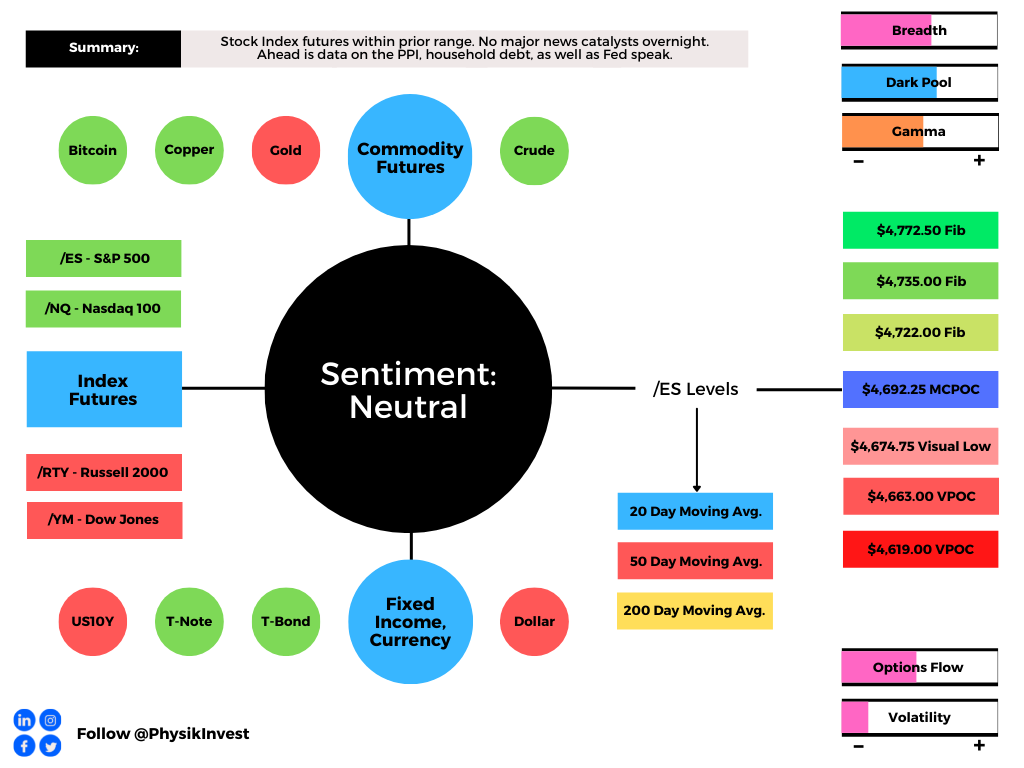
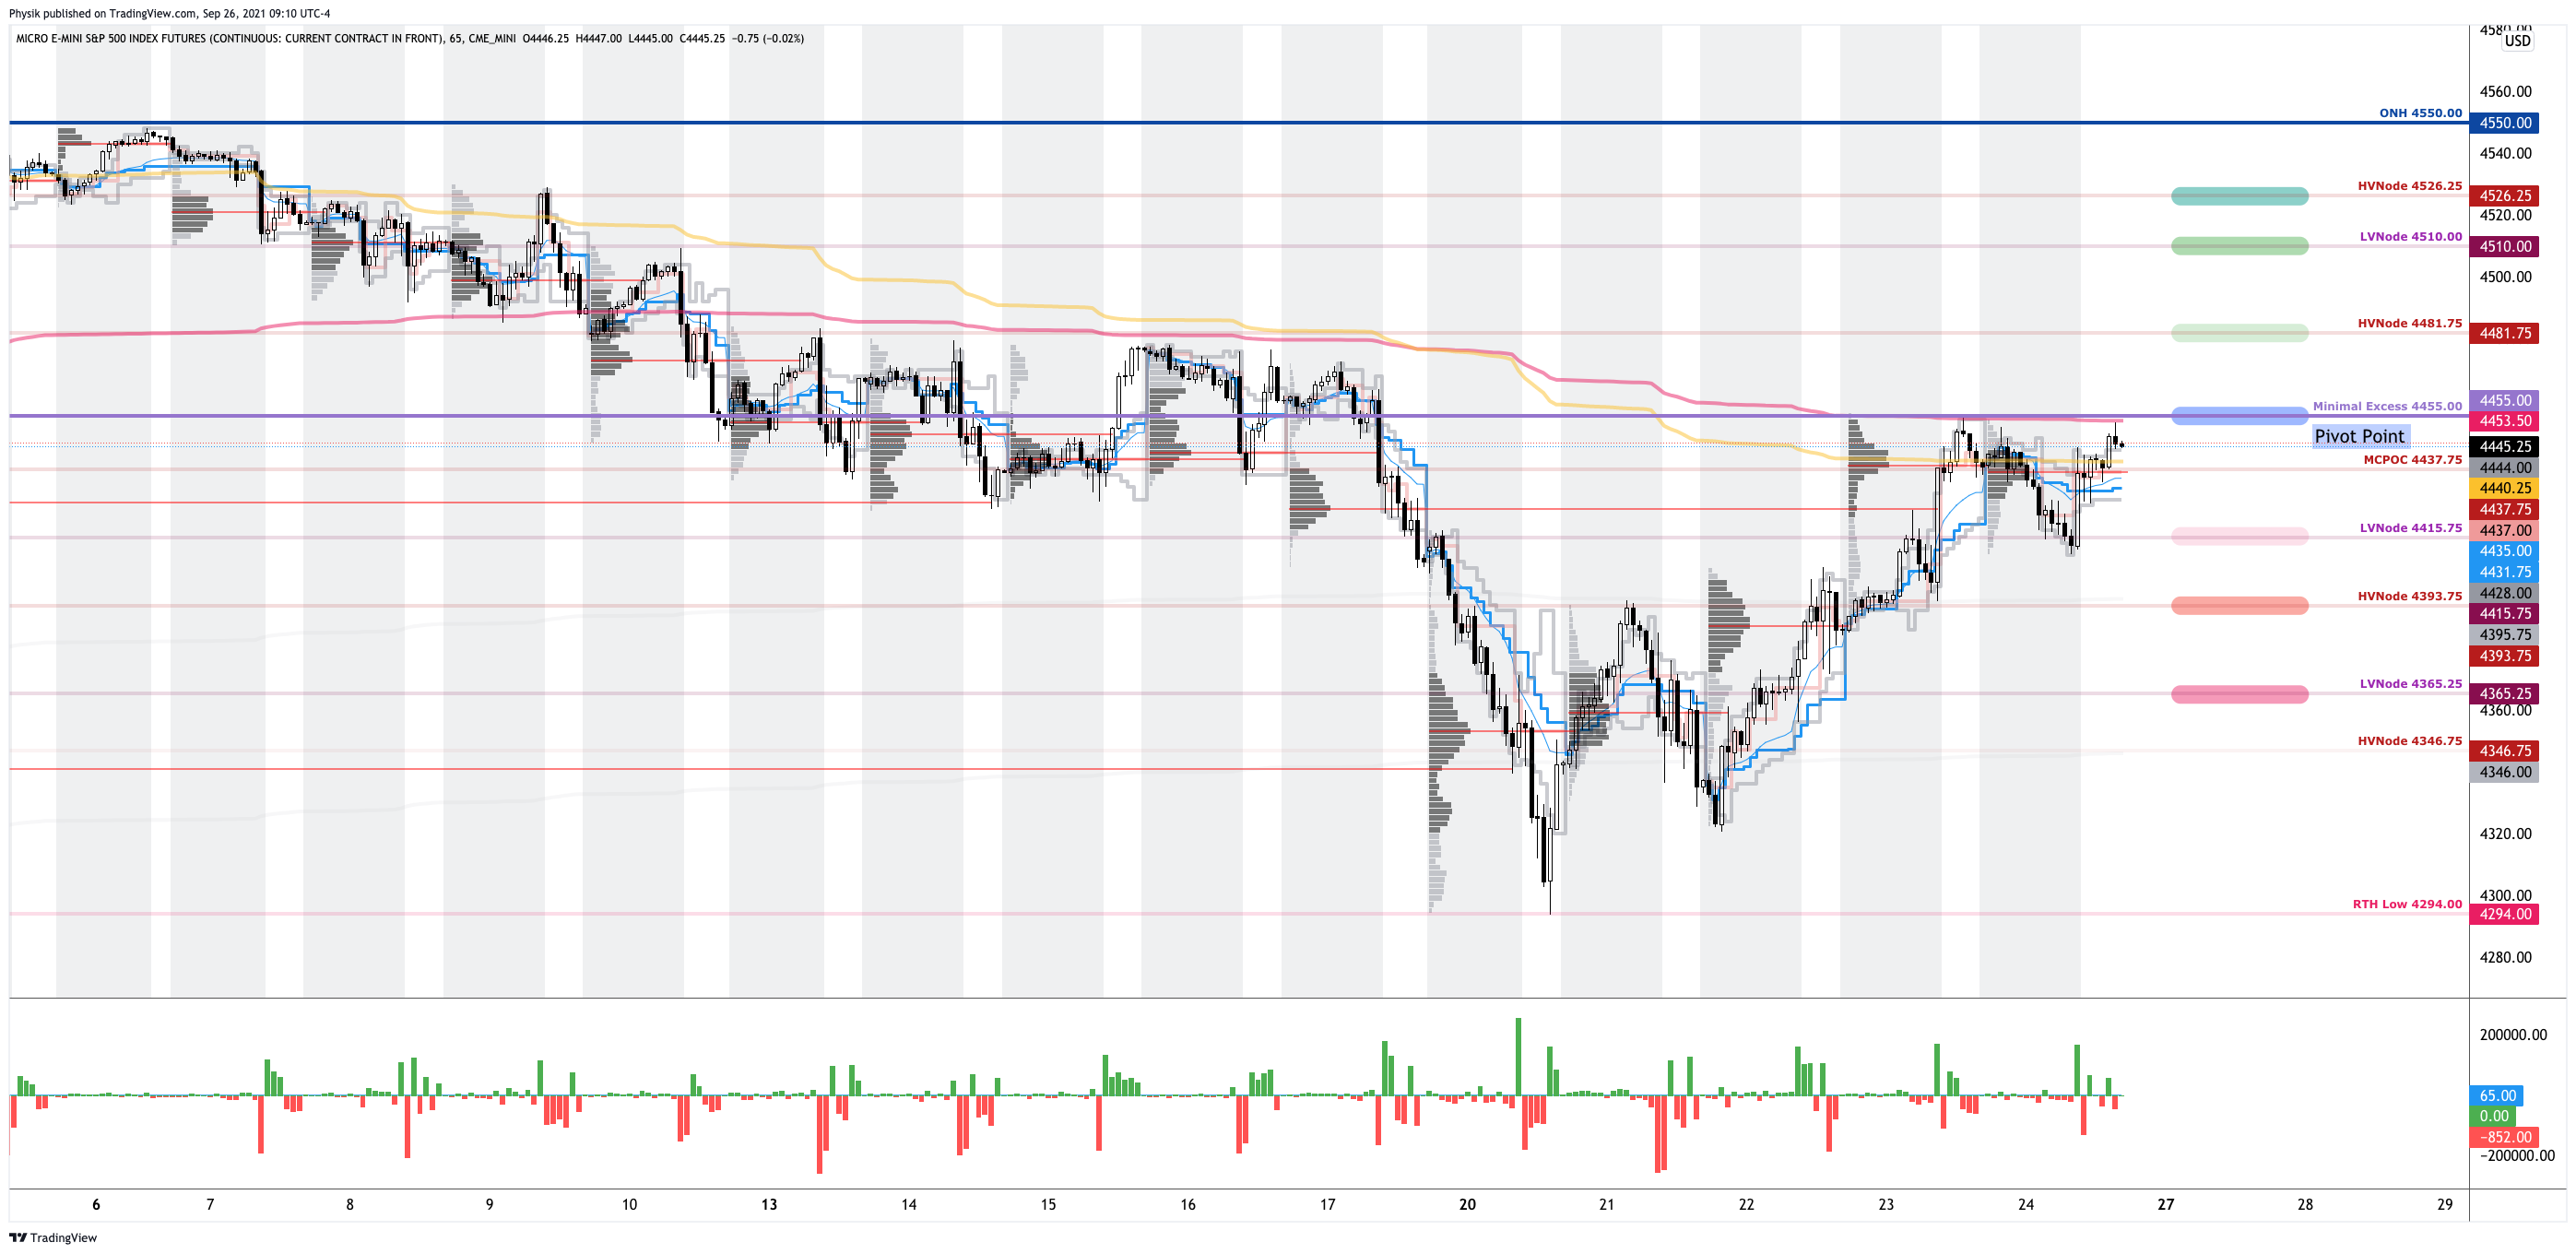
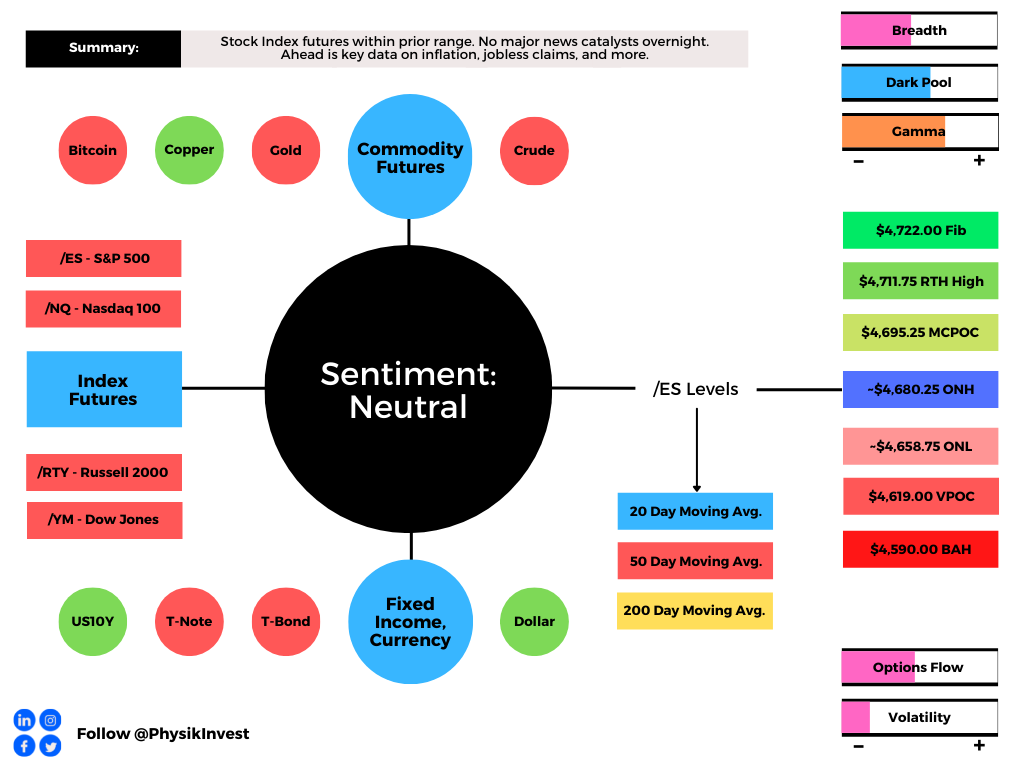
Expectations: As of 5:30 AM ET, Wednesday’s regular session (9:30 AM – 4:00 PM ET), in the S&P 500, will likely open in the middle part of a balanced overnight inventory, inside of prior-range and -value, suggesting a limited potential for immediate directional opportunity.

Balance Scenarios: Modus operandi is responsive trade (i.e., fade the edges), rather than initiative trade (i.e., play the break).

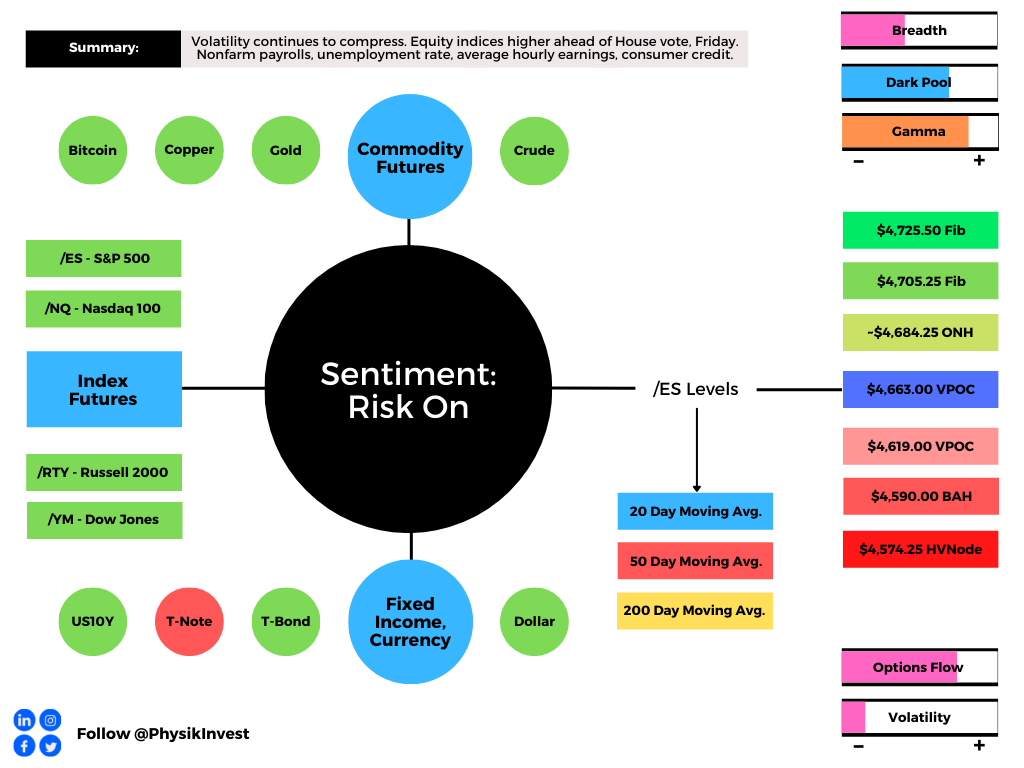
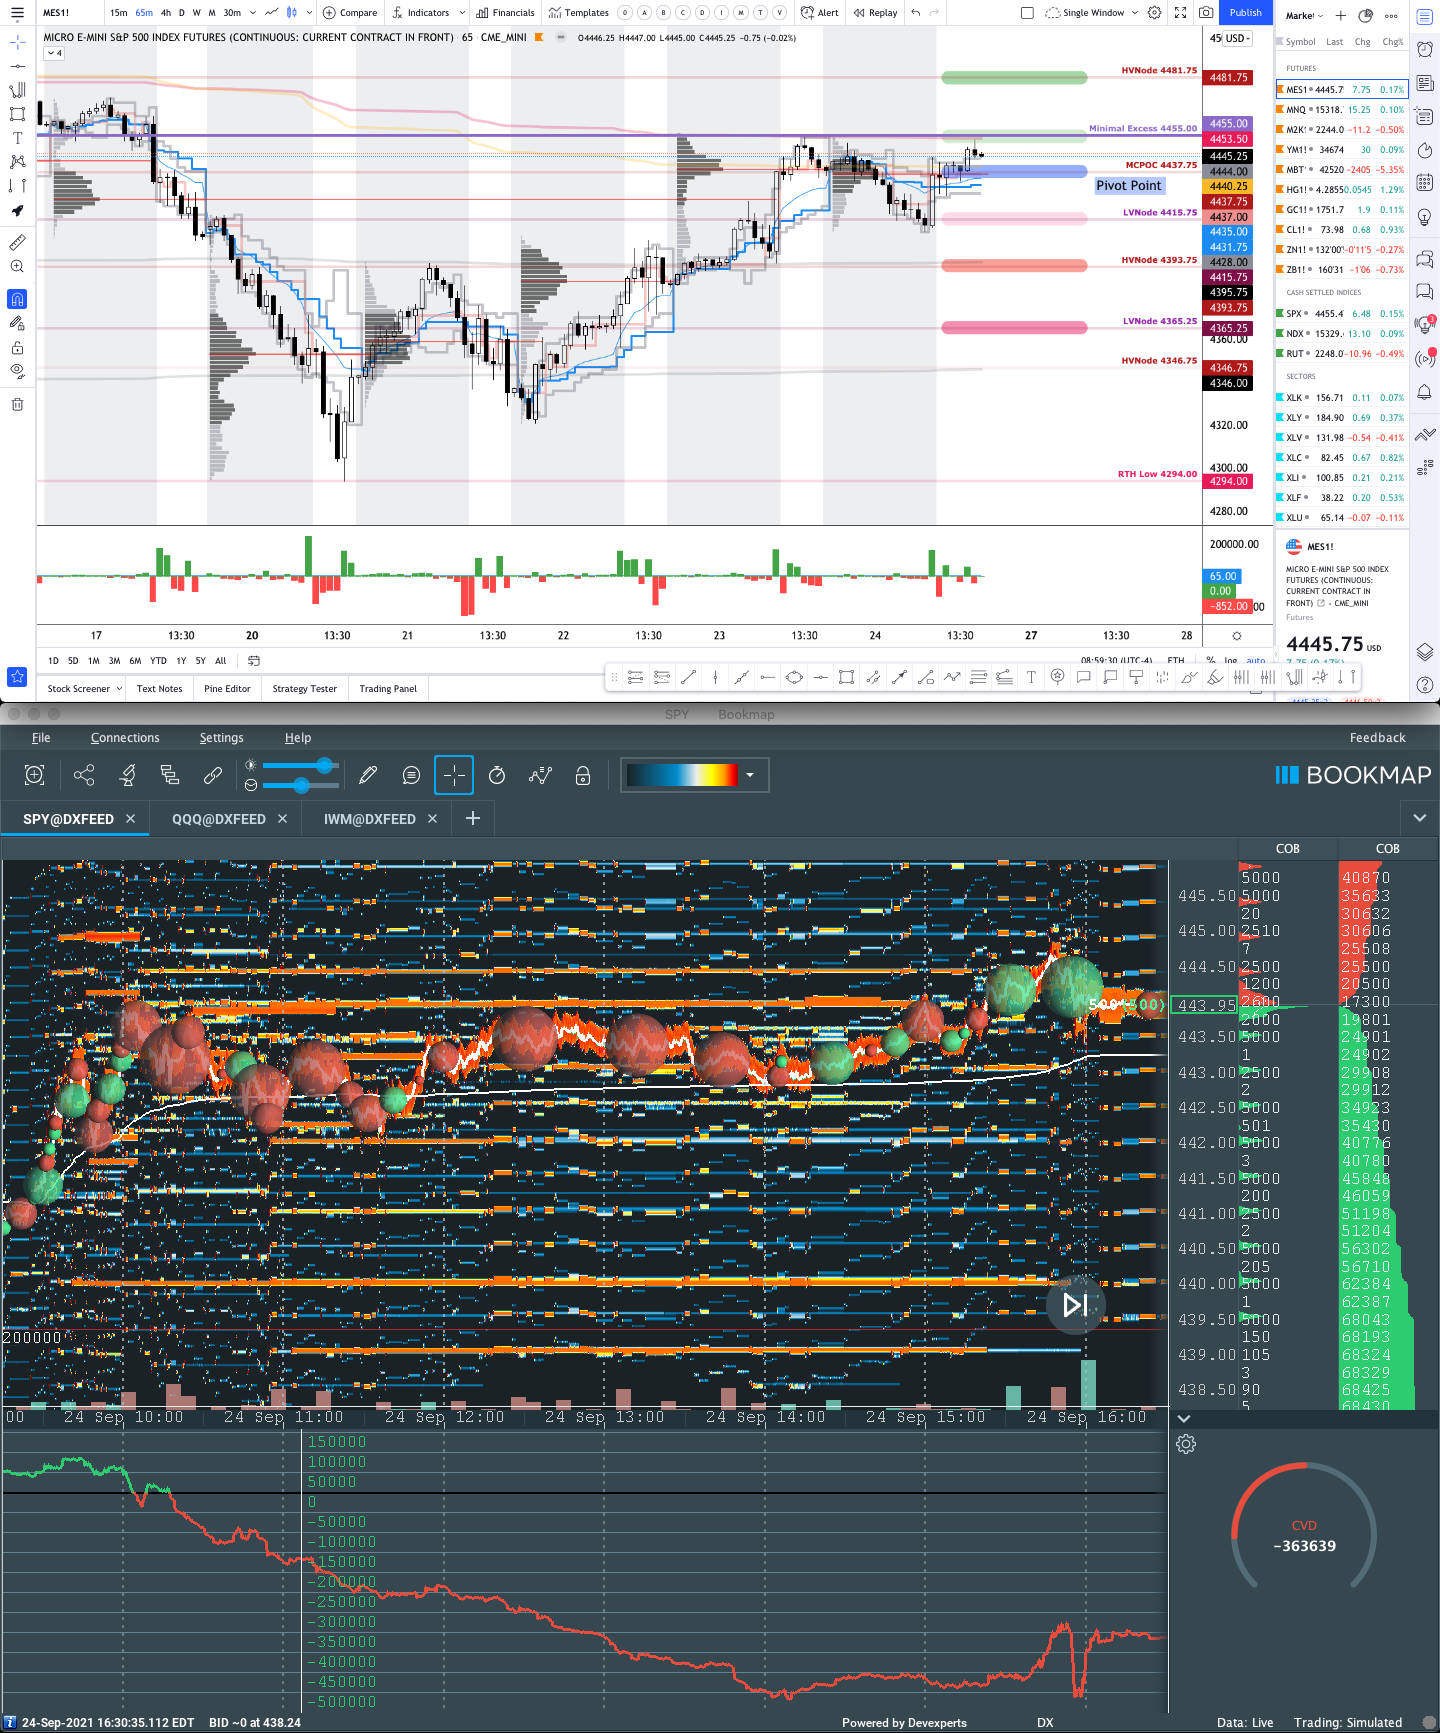
In the best case, the S&P 500 trades sideways or higher; activity above the $4,680.25 overnight high (ONH) puts in play the $4,695.25 micro composite point of control (MCPOC). Initiative trade beyond the MCPOC could reach as high as the $4,711.75 regular trade high and $4,722.00 Fibonacci, or higher.

In the worst case, the S&P 500 trades lower; activity below the $4,680.25 ONH puts in play the $4,658.75 overnight low (ONL). Initiative trade beyond the ONL could reach as low as the $4,619.00 untested point of control (VPOC) and $4,590.00 balance area boundary, or lower.

Click here to load today’s updated key levels into the web-based TradingView charting platform. Note that all levels are derived using the 65-minute timeframe. New links are produced, daily.
Graphic: 65-minute profile chart of the Micro E-mini S&P 500 Futures. Note the low-volume structure beneath current prices. There is the potential for a cave-fill to widen the area deemed favorable to transact at by an increased share of participants. Learn about the profile.

Definitions

Overnight Rally Highs (Lows): Typically, there is a low historical probability associated with overnight rally-highs (lows) ending the upside (downside) discovery process.

Volume Areas: A structurally sound market will build on areas of high volume (HVNodes). Should the market trend for long periods of time, it will lack sound structure, identified as low volume areas (LVNodes). LVNodes denote directional conviction and ought to offer support on any test. 

If participants were to auction and find acceptance into areas of prior low volume (LVNodes), then future discovery ought to be volatile and quick as participants look to HVNodes for favorable entry or exit.

Vanna: The rate at which the delta of an option changes with respect to volatility.

Charm: The rate at which the delta of an option changes with respect to time.

POCs: POCs are valuable as they denote areas where two-sided trade was most prevalent in a prior day session. Participants will respond to future tests of value as they offer favorable entry and exit.

MCPOCs: POCs are valuable as they denote areas where two-sided trade was most prevalent over numerous day sessions. Participants will respond to future tests of value as they offer favorable entry and exit.

About

After years of self-education, strategy development, and trial-and-error, Renato Leonard Capelj began trading full-time and founded Physik Invest to detail his methods, research, and performance in the markets.

Additionally, Capelj is a Benzinga finance and technology reporter interviewing the likes of Shark Tank’s Kevin O’Leary, JC2 Ventures’ John Chambers, and ARK Invest’s Catherine Wood, as well as a SpotGamma contributor, developing insights around impactful options market dynamics.

Disclaimer

At this time, Physik Invest does not manage outside capital and is not licensed. In no way should the materials herein be construed as advice. Derivatives carry a substantial risk of loss. All content is for informational purposes only.

Categories
Commentary

Daily Brief For November 9, 2021

What Happened

Overnight, equity index futures were divergent.

The Nasdaq-100 led while the Russell 2000, which broke out of massive range, recently, slowed its pace of price discovery, trading relatively weak.

Ahead is data on the PPI (8:30 AM ET) and real household debt (11:00 AM ET).

Graphic updated 6:20 AM ET. Sentiment Neutral if expected /ES open is inside of the prior day’s range. /ES levels are derived from the profile graphic at the bottom of the following section. Levels may have changed since initially quoted; click here for the latest levels. SqueezeMetrics Dark Pool Index (DIX) and Gamma (GEX) calculations are based on where the prior day’s reading falls with respect to the MAX and MIN of all occurrences available. A higher DIX is bullish. At the same time, the lower the GEX, the more (expected) volatility. Learn the implications of volatility, direction, and moneyness. SHIFT data used for S&P 500 (INDEX: SPX) options activity. Note that options flow is sorted by the call premium spent; if more positive then more was spent on call options. Breadth reflects a reading of the prior day’s NYSE Advance/Decline indicator. VIX reflects a current reading of the CBOE Volatility Index (INDEX: VIX) from 0-100.

What To Expect

On lackluster intraday breadth and supportive market liquidity metrics, the best case outcome occurred, evidenced by the balance and overlap of value areas (i.e., where 70% of the prior day’s trade occurred, or +/- 1 standard deviation), at the current S&P 500 prices.

This activity, which marks a potential willingness to continue balance as participants seek new information to resolve on, is built on poor structure, a dynamic that adds to technical instability.

Graphic: Supportive delta (i.e., committed buying as measured by volume delta or buying and selling power as calculated by the difference in volume traded at the bid and offer) in SPDR S&P 500 ETF Trust (NYSE: SPY), one of the largest ETFs that track the S&P 500 index, via Bookmap. The readings are supportive of responsive trade (i.e., rotational trade that suggests current prices offer favorable entry and exit; the market is in balance).

Context: The aforementioned trade is happening in the context of a lot of big-picture dynamics such as the growth of derivatives exposure and tail risk, the heightened moneyness of nonmonetary assets, trends in seasonality, buybacks, earnings surprises, and more.

The implications of these themes on price are contradictory.

To elaborate, on one hand, seasonality, buybacks, and earnings surprises have bolstered (and will continue to bolster) the most recent price rise, since early October. 

Similarly, participants are seeing a trend of outperformance in the extended day, due in part to the front-running of increasingly impactful vanna and charm flows (both of which are tied to the hedging of options exposure), as a result of increased options activity (which, at least at this juncture, exposes customers to high leverage and risk). 

I say “high leverage and risk” as a result of short-term speculators’ record call buying and put selling over the past weeks.

As stated in a SpotGamma note, yesterday, “Should there be an adverse move, those short-term speculators are likely to cover (sell) their short put (long call) positions as they lack the wherewithal (capital) to maintain exposure.”

With exposure concentrated in shorter-dated expiries, the November 19 monthly options expiration (OPEX) is somewhat of a concern for us.

The reason being?

Presently, the S&P 500 is pinned near options strikes at which positive options gamma – delta sensitivity to underlying price – is highest. 

I note those participants that take the other side of options trades will hedge their exposure to risk by buying and selling the underlying. 

When dealers are short-gamma (e.g., Tesla), they buy into strength and sell into weakness, exacerbating volatility. 

When long-gamma, counterparties buy into weakness and sell into strength, calming volatility.

Coming into OPEX, the forces that promote pinning turn stronger; counterparties supply more liquidity as their long gamma becomes longer (i.e., rises), so to speak. 

As OPEX is essentially a reset (or reduction) in dealer gamma exposure, participants ought to see an increase in realized volatility as a lot of the exposure that warranted dealers’ supply of liquidity comes off the table, thus necessitating less liquidity

Less liquidity means more movement

More liquidity means less movement

Get it?

With short-term speculators taking on the risks that we’re seeing them take on, and the prospects of a front-running of post-OPEX volatility – given that, according to Pat Hennessy, “OPEX week returns peaked in 2016 and have trended lower since” – there is a potential that adverse moves force those that are off-sides cover (sell) their short put (long call) positions, thereby exacerbating near-term volatility.

We see recent options activity reflected in a sideways to higher CBOE Volatility Index (INDEX: VIX) and shift up in the VIX futures term structure; both suggest a demand for hedges and a reduction in the flows (e.g., vanna) that support sideways to higher trade. 

“The moves have been large and the demand for upside in single stock land insatiable,” said Danny Kirsch of Cornerstone Macro LLC. “Single stock vols clearly feeding into the index.”

Expectations: As of 6:20 AM ET, Tuesday’s regular session (9:30 AM – 4:00 PM ET), in the S&P 500, will likely open in the upper part of a balanced overnight inventory, inside of prior-range and -value, suggesting a limited potential for immediate directional opportunity.

Market Is In Balance: Current prices offer favorable entry and exit. Modus operandi is responsive trade (i.e., fade the edges), rather than initiative trade (i.e., play the break).

In the best case, the S&P 500 trades sideways or higher; activity above the $4,692.25 micro composite point of control (MCPOC) puts in play the $4,722.00 Fibonacci. Initiative trade beyond $4,722.00 could reach as high as the $4,735.00 and $4,772.50 Fibonacci, or higher.

In the worst case, the S&P 500 trades lower; activity below the $4,692.25 MCPOC puts in play the $4,674.75 visual low. Initiative trade beyond the visual low (likely paid attention to by short-term, technically driven market participants who seldom defend retests) could reach as low as the $4,663.00 untested point of control (VPOC) and $4,619.00 VPOC, or lower.

Click here to load today’s updated key levels into the web-based TradingView charting platform. Note that all levels are derived using the 65-minute timeframe. New links are produced, daily.
Graphic: 65-minute profile chart of the Micro E-mini S&P 500 Futures. Notice Monday’s “Cave-Fill” or the act of increasing the area deemed favorable to transact at by participants. This is most obvious by observing where the bulk of Monday’s distribution sits, relative to the pocket of low-volume left behind Friday’s trade. This is a positive development. Learn about the profile.

Charts To Watch

Graphic: (NASDAQ: TSLA). (S~1108, R~1187 to 1195). S is for support. R is for resistance. Looking to buy/sell responsively. 
Graphic: (NYSE: CMG). (S~1680, R~1820). S is for support. R is for resistance. Looking to buy/sell responsively.
Graphic: (NYSE: SPY). (S~456, R~471). S is for support. R is for resistance. Looking to buy responsively.
Graphic: (NASDAQ: QQQ). (S~382, R~403). S is for support. R is for resistance. Looking to buy responsively.

What People Are Saying

Definitions

Vanna: The rate at which the delta of an option changes with respect to volatility.

Charm: The rate at which the delta of an option changes with respect to time.

POCs: POCs are valuable as they denote areas where two-sided trade was most prevalent in a prior day session. Participants will respond to future tests of value as they offer favorable entry and exit.

MCPOCs: POCs are valuable as they denote areas where two-sided trade was most prevalent over numerous day sessions. Participants will respond to future tests of value as they offer favorable entry and exit.

About

After years of self-education, strategy development, and trial-and-error, Renato Leonard Capelj began trading full-time and founded Physik Invest to detail his methods, research, and performance in the markets.

Additionally, Capelj is a Benzinga finance and technology reporter interviewing the likes of Shark Tank’s Kevin O’Leary, JC2 Ventures’ John Chambers, and ARK Invest’s Catherine Wood, as well as a SpotGamma contributor, developing insights around impactful options market dynamics.

Disclaimer

At this time, Physik Invest does not manage outside capital and is not licensed. In no way should the materials herein be construed as advice. Derivatives carry a substantial risk of loss. All content is for informational purposes only.

Categories
Commentary

Daily Brief For November 5, 2021

Abstract

Equity index futures higher. Commodities were higher. Bonds mixed. Volatility compressed.

Ahead is a heavier day of economic releases, in the face of fundamental narratives and positioning metrics that may support intraday price stability.

What Happened

Overnight, equity index futures were marked up ahead of the House’s plan to vote on President Joe Biden’s economic package and infrastructure, as well as October jobs data.

Also, in the news, there were narratives surrounding China’s dollar surplus, a pandemic resurgence in Europe, Pfizer Inc’s (NYSE: PFE) development of a pill for COVID-19.

Ahead is data on payrolls, unemployment, and average hourly earnings (8:30 AM ET), as well as consumer credit (3:00 PM ET). I apologize as this is what I listed yesterday, mistakenly.

Graphic updated 6:30 AM ET. Sentiment Risk-On if expected /ES open is above the prior day’s range. /ES levels are derived from the profile graphic at the bottom of the following section. Levels may have changed since initially quoted; click here for the latest levels. SqueezeMetrics Dark Pool Index (DIX) and Gamma (GEX) calculations are based on where the prior day’s reading falls with respect to the MAX and MIN of all occurrences available. A higher DIX is bullish. At the same time, the lower the GEX, the more (expected) volatility. Learn the implications of volatility, direction, and moneyness. SHIFT data used for S&P 500 (INDEX: SPX) options activity. Note that options flow is sorted by the call premium spent; if more positive then more was spent on call options. Breadth reflects a reading of the prior day’s NYSE Advance/Decline indicator. VIX reflects a current reading of the CBOE Volatility Index (INDEX: VIX) from 0-100.

What To Expect

On weak intraday breadth and lackluster market liquidity metrics, the best case outcome occurred, evidenced by balanced trade at newly discovered S&P 500 prices.

As also evidenced by the separation of value, overnight, the gap out of yesterday’s range marks a potential willingness to continue the uptrend.

To note, poor structure left behind prior initiative trade adds to technical instability, a dynamic mentioned in prior commentaries. Participants will likely look to check old value (i.e., revisit, repair, and strengthen) pockets of low-volume, feverishly, on any breakdown of trend.

Graphic: Flat delta (i.e., non-committed buying/selling as measured by volume delta or buying and selling power as calculated by the difference in volume traded at the bid and offer) in SPDR S&P 500 ETF Trust (NYSE: SPY), via Bookmap. The readings are supportive of responsive trade (i.e., rotational trade that suggests current prices offered favorable entry and exit).

Context: The aforementioned trade is happening in the context of a slowdown in economic growth, increased clarity on the Federal Reserve’s (Fed) intent to moderate stimulus, as well as the prospects of renewed fiscal support.

The implications of these narratives on price are contradictory.

To elaborate, supply chain disruptions slowed the pace of economic growth, while participants saw both the Fed’s decision to taper and keep rates unchanged, as well as the potential passage of President Biden’s economic plan, today, as near-term positives.

In terms of positioning, the CBOE Volatility Index (INDEX: VIX) was lower, while supply came in across the VIX futures term structure. That, alongside the long-gamma environment and increased demand for options above current prices (i.e., bets on the upside), points to increased odds of near-term equity market stability.

To quote options analysis and data provider SpotGamma, “​​the term structure of IV (this is how high the IV is for longer-dated options) remains elevated. That suggests near term options could have more ‘bleed’ which could keep the SPX market price tailwind intact.”

Expectations: As of 6:30 AM ET, Friday’s regular session (9:30 AM – 4:00 PM ET), in the S&P 500, will likely open in the upper part of a positively skewed overnight inventory, outside of prior-range and -value, suggesting a potential for immediate directional opportunity.

Gap Scenarios: Gaps ought to fill quickly. Should they not, that’s a signal of strength; do not fade. Leaving value behind on a gap-fill or failing to fill a gap (i.e., remaining outside of the prior session’s range) is a go-with indicator.

Auctioning and spending at least 1-hour of trade back in the prior range suggests a lack of conviction; in such a case, do not follow the direction of the most recent initiative activity.

In the best case, the S&P 500 trades sideways or higher; activity above the $4,663.00 untested point of control (VPOC) puts in play the $4,684.25 overnight high (ONH). Initiative trade beyond the ONH could reach as high as the $4,705.25 and $4,725.50 Fibonacci, or higher.

In the worst case, the S&P 500 trades lower; activity below the $4,663.00 VPOC puts in play the $4,619.00 VPOC. Initiative trade beyond the VPOC could reach as low as the $4,590.00 balance boundary and $4,574.25 high volume area (HVNode), or lower.

Click here to load today’s updated key levels into the web-based TradingView charting platform. Note that all levels are derived using the 65-minute timeframe. New links are produced, daily.
Graphic: 65-minute profile chart of the Micro E-mini S&P 500 Futures. Learn about the profile.

Charts To Watch

Graphic: (NASDAQ: AMZN). (S~3403, R~3580). S is for support. R is for resistance. I am seeking to initiate short-duration call structures against the 3580 gap fill and prior all-time high. Will initiate for credit or finance with put structures.
Graphic: (NASDAQ: FB). (S~326.45, R~336.90). S is for support. R is for resistance. If the stock was to maintain prices above 336.90, there is a potential change in tone. In such a case, I’m targeting Fibonacci retracements with call structures financed with credits on the put side.
Graphic: (NASDAQ: GOOGL). (S~2900, R~3113). S is for support. R is for resistance. I’m targeting prices between 3000 and 3100 with call structures for low cost or credit.
Graphic: (NYSE: SHOP). (S~1482, R~1650). S is for support. R is for resistance. Potential break of trend, move to an all-time high.
Graphic: (NYSE: IWM). (S~234.53, R~241.96, 251.41). S is for support. R is for resistance. Russell 2000 breaks out of balance. In my opinion, upon acceptance, there are potential opportunities for long trades.

Other charts I’m watching include BABA (S~155.29), ZM (S~245.92), ARKK (S~120.15), PINS (S~42.06), Z (S~58.15), BBY (S~123.65), GOOS (S~40.91), CTSH (R~82.00), LYFT (S~44.41), TMUS (S~118.00), WDC (51.47). S is for support. R is for resistance. 

What People Are Saying

Definitions

Cave-Fill Process: Widened the area deemed favorable to transact at by an increased share of participants. This is a good development.

Overnight Rally Highs (Lows): Typically, there is a low historical probability associated with overnight rally-highs (lows) ending the upside (downside) discovery process.

Volume Areas: A structurally sound market will build on areas of high volume (HVNodes). Should the market trend for long periods of time, it will lack sound structure, identified as low volume areas (LVNodes). LVNodes denote directional conviction and ought to offer support on any test. 

If participants were to auction and find acceptance into areas of prior low volume (LVNodes), then future discovery ought to be volatile and quick as participants look to HVNodes for favorable entry or exit.

Gamma: Gamma is the sensitivity of an option to changes in the underlying price. Dealers that take the other side of options trades hedge their exposure to risk by buying and selling the underlying. When dealers are short-gamma, they hedge by buying into strength and selling into weakness. When dealers are long-gamma, they hedge by selling into strength and buying into weakness. The former exacerbates volatility. The latter calms volatility.

POCs: POCs are valuable as they denote areas where two-sided trade was most prevalent in a prior day session. Participants will respond to future tests of value as they offer favorable entry and exit.

Balance (Two-Timeframe Or Bracket): Rotational trade that denotes current prices offer favorable entry and exit. Balance-areas make it easy to spot a change in the market (i.e., the transition from two-time frame trade, or balance, to one-time frame trade, or trend). 

Modus operandi is responsive trade (i.e., fade the edges), rather than initiative trade (i.e., play the break).

Value-Area Placement: Perception of value unchanged if value overlapping (i.e., inside day). Perception of value has changed if value not overlapping (i.e., outside day). Delay trade in the former case.

About

After years of self-education, strategy development, and trial-and-error, Renato Leonard Capelj began trading full-time and founded Physik Invest to detail his methods, research, and performance in the markets.

Additionally, Capelj is a Benzinga finance and technology reporter interviewing the likes of Shark Tank’s Kevin O’Leary, JC2 Ventures’ John Chambers, and ARK Invest’s Catherine Wood, as well as a SpotGamma contributor, developing insights around impactful options market dynamics.

Disclaimer

At this time, Physik Invest does not manage outside capital and is not licensed. In no way should the materials herein be construed as advice. Derivatives carry a substantial risk of loss. All content is for informational purposes only.

Categories
Commentary

Daily Brief For October 11, 2021

Editor’s Note: The newsletter schedule has changed.

From now on, you can expect to see Daily Briefs only – Monday through Friday – posted shortly before 8:00 AM ET. The Weekly Trade Idea will be packaged into Monday’s commentary, also.

Thanks again for your continued support. I strive to simplify and add value, as best I can.

Market Commentary

Equity index futures trade sideways to lower with bonds. Commodities were mixed.

  • October bottom; a rip up into EOY?
  • Ahead: No economic reports today.

What Happened: Ahead of a busy start to the third-quarter earnings season, this week, U.S. stock index futures auctioned sideways to lower overnight alongside some mixed narratives.

Last night, it was revealed that Goldman Sachs Group (NYSE: GS) cut its U.S. growth forecast on consumption and a fiscal slowdown. Not even a day later, there is news that Goldman, alongside JPMorgan Chase & Co (NYSE: JPM) strategists, suggests the recent dip is a buy.

Given the Columbus Day holiday, today, no economic reports are scheduled.

Graphic updated 6:20 AM ET. Sentiment Risk-Off if expected /ES open is below the prior day’s range. /ES levels are derived from the profile graphic at the bottom of the following section. SqueezeMetrics Dark Pool Index (DIX) and Gamma (GEX) calculations are based on where the prior day’s reading falls with respect to the MAX and MIN of all occurrences available. A higher DIX is bullish. At the same time, the lower the GEX, the more (expected) volatility. SHIFT data used for S&P 500 (INDEX: SPX) options activity. Note that options flow is sorted by the call premium spent; if more positive then more was spent on call options. Breadth reflects a reading of the prior day’s NYSE Advance/Decline indicator. VIX reflects a current reading of the CBOE Volatility Index (INDEX: VIX) from 0-100.

What To Expect: As of 6:20 AM ET, Monday’s regular session (9:30 AM – 4:00 PM EST) in the S&P 500 will likely open outside of prior-range and -value, suggesting a potential for immediate directional opportunity.

Gap Scenarios: Gaps ought to fill quickly. Should they not, that’s a signal of strength; do not fade. Leaving value behind on a gap-fill or failing to fill a gap (i.e., remaining outside of the prior session’s range) is a go-with indicator.

Auctioning and spending at least 1-hour of trade back in the prior range suggests a lack of conviction; in such a case, do not follow the direction of the most recent initiative activity.

Further, during the prior week’s trade, on mostly strong intraday breadth and divergent market liquidity metrics, equity index futures established a rounded bottom and minimal excess low.

Then, a swift recovery ensued; initiative sellers lacked the wherewithal to take prices lower, beyond the S&P 500’s $4,363.25-$4,278.00 balance area. Initiative buyers were then emboldened, expanding range and value the opposite way.

During this recovery process, the S&P 500 – as evidenced by p-shaped emotional, multiple-distribution profile structures – established a minimal excess high before momentum from covering shorts was overpowered by responsive selling at key areas of resting liquidity, at and around /ES $4,410.25 (SPY $441.00), the site of a key anchored volume-weighted average price (VWAP) level.

Note: Liquidity algorithms are benchmarked and programmed to buy and sell around VWAPs.

Friday’s session succumbed to divergences in buying and selling power as calculated by the difference in volume traded at the bid and offer, resolving some of the aforementioned emotional structures through what’s called the “cave-fill” process. 

During this process, participants revisited, repaired, and strengthened – building out areas of high volume (HVNodes), or value – areas low volume (LVNodes).

Note: The cave-fill process widened the area deemed favorable to transact at by an increased share of participants. This is a good development.

Moreover, September’s seasonally-aligned weakness saw the Nasdaq 100 lead lower. Last week – alongside improvement amongst some positioning metrics – the tone shifted with the cash-settled Nasdaq 100 (INDEX: NDX) rising 4.35% versus the S&P 500 (INDEX: SPX) rising 3.25%.

That comes as October traditionally marks an end to weakness amidst a cycle of rebalancing and earnings; according to LPL Financial Research, “Stocks rise 3.8% on average during the fourth quarter, but the past seven times the S&P 500 was up 15% year-to-date heading into the home stretch of the year, the fourth quarter was higher every single time, up a very impressive 5.8%.” 

“Earnings for the third quarter should again be strong and mostly outpace expectations,” Leuthold Group chief investment strategist Jim Paulsen adds. “Hours worked in the third quarter rose by about 5% suggesting real GDP for the quarter may be close to 7%. With most companies reporting strong pricing power, solid real GDP growth should result in another surprisingly strong corporate earnings season.”

Graphic: LPL Financial Research unpacks S&P 500 seasonality.
Graphic: SPDR S&P 500 ETF (NYSE: SPY) top left, Invesco QQQ Trust Series 1 (NASDAQ: QQQ) top right, iShares Russell 2000 ETF (NYSE: IWM) bottom left, SPDR Dow Jones Industrial Average ETF Trust (NYSE: DIA) bottom right. Spending more than a few hours of trade above trend, VWAP (yellow), and the 61.80% Fibonacci retracement suggest good odds of upside continuation.

Notwithstanding, some risks to be aware of include the Federal Reserve’s tapering initiatives and the prospects of a rise in the Fed funds rate, amidst hot sentiment, a decline in top-of-book depth, as well as back and forth entry (exit) into (from) short-gamma.

“What we see in the equity space is a lot of sensitivity to higher real yields,” Joseph Little, chief global strategist at HSBC Holdings Plc (NYSE: HSBC) Asset Management, said. “We are seeing policy normalization everywhere. That creates a little bit of a challenge for [the] equity market because it does change the drivers of equity performance.”

Graphic: A “gentle reminder of the fact tapering matters,” via The Market Ear.
Graphic: Sentiment elevated, “generating a 96% historical probability of down markets in the next 12 months at current levels.”

In addition, to balance some of our Q4 bullishness, in a quote highlighted by The Market Ear, Bank of America Corporation (NYSE: BAC) explained: September 30 “was the 24th time since 1928 that the S&P experienced two or more 3-sigma shocks in 10 trading days, … [and] only in 3 of 23 episodes (and 1 in the last 50yrs) did the S&P surpass the prior month’s peak in the month following the second shock.”

Moreover, for today, participants may make use of the following frameworks.

In the best case, the S&P 500 trades sideways or higher; activity above the $4,363.25 high volume area (HVNode) puts in play the $4,393.00 untested point of control (VPOC). Initiative trade beyond the $4,393.00 VPOC could reach as high as the $4,415.00 VPOC and $4,437.75 micro composite point of control (MCPOC), or higher.

In the worst case, the S&P 500 trades lower; activity below the $4,363.25 HVNode puts in play the $4,346.75 HVNode. Initiative trade beyond the HVNode could reach as low as the $4,332.25 low volume area (LVNode) and $4,299.00 VPOC, or lower.

Graphic: 65-minute profile chart of the Micro E-mini S&P 500 Futures updated 6:20 AM ET.

Definitions

Volume Areas: A structurally sound market will build on areas of high volume (HVNodes). Should the market trend for long periods of time, it will lack sound structure, identified as low volume areas (LVNodes). LVNodes denote directional conviction and ought to offer support on any test. 

If participants were to auction and find acceptance into areas of prior low volume (LVNodes), then future discovery ought to be volatile and quick as participants look to HVNodes for favorable entry or exit.

Gamma: Gamma is the sensitivity of an option to changes in the underlying price. Dealers that take the other side of options trades hedge their exposure to risk by buying and selling the underlying. When dealers are short-gamma, they hedge by buying into strength and selling into weakness. When dealers are long-gamma, they hedge by selling into strength and buying into weakness. The former exacerbates volatility. The latter calms volatility.

POCs: POCs are valuable as they denote areas where two-sided trade was most prevalent in a prior day session. Participants will respond to future tests of value as they offer favorable entry and exit.

MCPOCs: POCs are valuable as they denote areas where two-sided trade was most prevalent over numerous day sessions. Participants will respond to future tests of value as they offer favorable entry and exit.

Excess: A proper end to price discovery; the market travels too far while advertising prices. Responsive, other-timeframe (OTF) participants aggressively enter the market, leaving tails or gaps which denote unfair prices.

Value-Area Placement: Perception of value unchanged if value overlapping (i.e., inside day). Perception of value has changed if value not overlapping (i.e., outside day). Delay trade in the former case.

News And Analysis

Banks bought epic amounts of safe assets; forget inflation.

The Fed is likely to side with growth and keep policy easy.

Merck seeks emergency use authorization for COVID pills.

Europe Economic Snapshot: Faster-than-expected restart.

Latin America settles into new post-pandemic slow growth.

S&P talking stock-flow confusion again – QE and tapering.

What People Are Saying

Weekly Trade Idea

About

After years of self-education, strategy development, and trial-and-error, Renato Leonard Capelj began trading full-time and founded Physik Invest to detail his methods, research, and performance in the markets. 

Additionally, Capelj is a finance and technology reporter. Some of his biggest works include interviews with leaders such as John Chambers, founder and CEO, JC2 Ventures, Kevin O’Leary, businessman and Shark Tank host, Catherine Wood, CEO and CIO, ARK Invest, among others.

Disclaimer

At this time, Physik Invest does not manage outside capital and is not licensed. In no way should the materials herein be construed as advice. Derivatives carry a substantial risk of loss. All content is for informational purposes only.

Categories
Commentary

Weekly Brief For September 26, 2021

Editor’s Note: Market commentaries to pause until Monday, October 4, 2021, due to travel commitments. As a result, I go in-depth today and offer a strong trade idea for the week ahead.

Also, if you’re in a rush, focus on the bolded text!

Market Commentary

Equity index futures recover. Yields break higher. Volatility implodes.

  • Indices have recovered 60% of sell-off.
  • Buying-the-dip psychology is breaking.
  • Watching: Taper, shutdown, debt risks.
  • Fed may stamp out life in the economy.
  • Trade Idea: Capitalizing on TSLA skew.

What Happened: After a series of outlier moves, U.S. stock index futures ended the week range-bound when responsive sellers – as confirmed by measures of market liquidity – stepped in at key moving averages and anchored volume-weighted average price levels.

Ahead is a busy week in terms of economic releases; important data on durable goods orders, consumer confidence, home sales, personal income and spending, PCE deflators, as well as manufacturing data are slated to come out.

Graphic updated 9:00 AM ET Sunday. Sentiment Neutral if expected /ES open is inside of the prior day’s range. /ES levels are derived from the profile graphic at the bottom of the following section. SqueezeMetrics Dark Pool Index (DIX) and Gamma (GEX) calculations are based on where the prior day’s reading falls with respect to the MAX and MIN of all occurrences available. A higher DIX is bullish. At the same time, the lower the GEX, the more (expected) volatility. SHIFT data used for S&P 500 (INDEX: SPX) options activity. Note that options flow is sorted by the call premium spent; if more positive then more was spent on call options. Breadth reflects a reading of the prior day’s NYSE Advance/Decline indicator. VIX reflects a current reading of the CBOE Volatility Index (INDEX: VIX) from 0-100.

What To Expect: Be patient with me, there is a lot to condense. 

During the prior week’s trade, on mostly strong intraday breadth and divergent market liquidity metrics, equity index futures briefly liquidated; the S&P 500 went as low as $4,300.00. 

Then, a swift recovery ensued; participants took back nearly 60% of the most recent sell-off.

During the recovery process, the S&P 500 – as evidenced by emotional, multiple distribution profile structures – established a minimal excess rally high at $4,455.00 before the momentum from covering shorts was overpowered by responsive selling at key areas of resting liquidity, at and around $4,455.00, or so. 

Friday’s session, however, resolved some of the aforementioned emotional structures through what’s called the “cave-fill” process; revisiting, repairing, and strengthening – building out areas of high volume (HVNodes), or value – areas low volume (LVNodes). 

To put it simply, the cave-fill process widened the area deemed favorable to transact at by an increased share of participants. This is a good development.

Graphic: Divergent delta (i.e., non-committed buying as measured by volume delta or buying and selling power as calculated by the difference in volume traded at the bid and offer) in SPDR S&P 500 ETF Trust (NYSE: SPY), one of the largest ETFs that track the S&P 500 index, via Bookmap. The readings are supportive of responsive trade or balance (i.e., rotational trade that suggests current prices offer favorable entry and exit).

Further, the aforementioned trade is happening in the context of narratives surrounding a taper to Federal Reserve asset purchases, a government shutdown, and the debt ceiling.

The implications of these themes on price are contradictory; to elaborate, in the most recent meeting of the Federal Open Market Committee (FOMC), it was announced that the economy made substantial progress toward the central bank’s goals and, if progress continued as expected, a moderation in the pace of asset purchases was likely. 

“Powell said that the tapering process could be wrapped up by mid-2022, which would require either an earlier start or larger reductions,” Moody’s said. 

“In other words, as long as September employment isn’t a disaster, the Fed will begin tapering at its November meeting. Therefore, it would skip a formal announcement and a one-meeting delay to dive right into the tapering process. It seems we’re headed for an eight-month taper, or [a] $15 billion reduction per month.”

The Fed’s dot plot saw movement, too; there are increased odds of a rate hike in 2022.

In regards to the debt ceiling, which caused a kink in the Treasury bill curve and may portend financial market volatility if not resolved, Powell voiced concern, noting that it must be raised. 

This is a likely development given that “lawmakers know that voting against raising the debt ceiling would have enormous economic costs,” Moody’s noted.

Graphic: “​​The spread between 5- and 30-year yields dropped below 100 basis points after the FOMC meeting, for the first time since just before last year’s Jackson Hole’s conference. Such a flat curve … signal[s] that the bond market thinks the Fed is going to make a hawkish mistake, and stamp out the life in the economy when previously there had been a belief that the Fed would be easy and let inflation move higher.” The source is Bloomberg.

Adding, after the September 17 options expiry which cut S&P 500 dealer gamma in half and opened the window to volatility, alongside threats posed by China’s Evergrande complications, the tone changed markedly, given a fraying in the buy-the-dip psychology.

While strategists at JPMorgan Chase & Co (NYSE: JPM) suggest the selling was knee-jerk and technical, the truth is that, according to Reuters, “global stock funds lost the most since March 2020 as investors moved in [favor] of cash where they [plowed] in $39.6 billion of funds.”

Still, in the face of comments by the Fed, as well as the Evergrande and debt ceiling debacle, the liquidation resolved some fragility with respect to positioning and stocks rallied, affirming the beliefs held by Goldman Sachs Group Inc’s (NYSE: GS) Peter Oppenheimer and HSBC Holdings Plc (NYSE: HSBC) strategists that dip-buying is a go as “we’re still in the relatively early stages of this economic cycle.” 

To put it differently, per one Bloomberg article, “the lasting impression … is that for markets the tapir no longer has the power to induce fear in the way that it did eight years ago, … [and] [t]he post-Evergrande bounce has some life in it. It’s no dead cat.” A 4,700 or 5,000 S&P 500, as some strategists see it, could be in the cards.

Moreover, for next week, participants may make use of the following frameworks.

In the best case, the S&P 500 trades sideways or higher; activity above the $4,455.00 minimal excess high puts in play the $4,481.75 HVNode. Initiative trade beyond the HVNode could reach as high as the $4,510.00 LVNode and $4,526.25 HVNode, or higher.

In the worst case, the S&P 500 trades lower; activity below the $4,455.00 minimal excess high puts in play the $4,415.75 LVNode. Initiative trade beyond the LVNode could reach as low as the $4,393.75 HVNode and $4,365.25 LVNode, or lower.

Graphic: 65-minute profile chart of the Micro E-mini S&P 500 Futures updated 9:00 AM ET Sunday.

Definitions

Volume Areas: A structurally sound market will build on areas of high volume (HVNodes). Should the market trend for long periods of time, it will lack sound structure, identified as low volume areas (LVNodes). LVNodes denote directional conviction and ought to offer support on any test. 

If participants were to auction and find acceptance into areas of prior low volume (LVNodes), then future discovery ought to be volatile and quick as participants look to HVNodes for favorable entry or exit.

Gamma: Gamma is the sensitivity of an option to changes in the underlying price. 

Dealers that take the other side of options trades hedge their exposure to risk by buying and selling the underlying. 

When dealers are short-gamma, they hedge by buying into strength and selling into weakness. When dealers are long-gamma, they hedge by selling into strength and buying into weakness. 

The former exacerbates volatility. The latter calms volatility.

Options Expiration (OPEX): Option expiries mark an end to pinning (i.e, the theory that market makers and institutions short options move stocks to the point where the greatest dollar value of contracts will expire worthless) and the reduction dealer gamma exposure.

Excess: A proper end to price discovery; the market travels too far while advertising prices. Responsive, other-timeframe (OTF) participants aggressively enter the market, leaving tails or gaps which denote unfair prices.

More On Volume-Weighted Average Prices (VWAPs): A metric highly regarded by chief investment officers, among other participants, for quality of trade. Additionally, liquidity algorithms are benchmarked and programmed to buy and sell around VWAPs.

Rates: Low rates have to potential to increase the present value of future earnings making stocks, especially those that are high growth, more attractive. 

To note, inflation and rates move inversely to each other. 

Low rates stimulate demand for loans (i.e., borrowing money is more attractive). In conjunction with the rapid recovery, lower rates solicit hawkish commentary as policymakers look to inhibit inflation.

Weekly Trade Idea

News And Analysis

Weakening U.S. economy threatens swelling corporate debt mountain.

Ongoing debt limit fight is as much about 2022 politics as fiscal policy.

Alhambra Investments: Next steps to watch for a scarcity of collateral. 

From New York To Sydney: See the supply shocks spanning the globe.

Economic Outlooks U.S. Q4 2021: The rocket is beginning to level off.

Nancy Pelosi: The infrastructure plan will likely pass House this week. 

Treasuries at risk as Federal Reserve paves way for breakout in yields.

The SEC’s Gary Gensler doesn’t see cryptocurrencies lasting that long.

Bear market is unlikely, but stumble in stocks may lead to a bigger fall.

What People Are Saying

Let’s Hang Out

Salt Lake City, UT September 28-30

Las Vegas, NV October 1-3

About

After years of self-education, strategy development, and trial-and-error, Renato Leonard Capelj began trading full-time and founded Physik Invest to detail his methods, research, and performance in the markets. 

Additionally, Capelj is a finance and technology reporter. Some of his biggest works include interviews with leaders such as John Chambers, founder and CEO, JC2 Ventures, Kevin O’Leary, businessman and Shark Tank host, Catherine Wood, CEO and CIO, ARK Invest, among others.

Disclaimer

At this time, Physik Invest does not manage outside capital and is not licensed. In no way should the materials herein be construed as advice. Derivatives carry a substantial risk of loss. All content is for informational purposes only.

Categories
Results

Case Study: Trading Skew With Ratio Spreads

What Happened: On June 23, 2021, shares of Tesla Inc (NASDAQ: TSLA) surged on news the company opened a Chinese-based solar-powered charging station with on-site power storage.

Prior to the development, the stock endured months of corrective activity during which negative narratives were out in full force. From calls against Tesla’s biggest bull – ARK Invest – to famed Michael Burry’s synthetic short position on the stock, it seemed as though the end was near.

However, as evidenced by Tesla’s June 23 breakout from consolidation and subsequent upside continuation in light of a 300,000 vehicle recall in China, it is obvious the fear was unwarranted.

Those who understand that markets are most influenced by credit and positioning knew this all along.

Taking a look at market liquidity metrics – such as those offered by services like HFT Alert – market participants had been aggressively accumulating shares of the company from its mid-May low.

Graphic 1: Buying accelerates (as evidenced by the purple line), in Tesla, after its mid-May bottom, via HFT Alert

Still, with skepticism out in full force, there was a heightened demand for protection, as evidenced by metrics like volatility skew, in options at and below the current stock price.

Skew: The difference in implied volatility (IV) – an estimate of potential price changes given the fear of movement – between option strikes that are close and far from the underlying stock price. 

To put it simply, the fear of corrective activity in Tesla fueled demand for protection via put option strikes farther below the stock. This, in turn, bid volatility in downside strikes, more than upside strikes. Because volatility is input in option pricing models, put options, further down the chain, were valued more relative to their call-side counterparts.

Graphic 2: June 23, 2021 screenshot implies increased demand for put options, further below (left of) the stock price, relative to calls (right) for the expiries traded. 
Graphic 3: Notice the increased volume and open interest in put option strike prices at and below $500. This dynamic results in skew, as observed in Graphic 2. 

Given this dynamic, the following sequence analysis unpacks how Physik Invest traded options tied to the carmaker leading up to, and through, the June 23, 2021 upside consolidation break.

Note: Click here to view all transactions. Adding, positions were structured in a way that would potentially net higher credits had the stock moved markedly lower or higher.

Sequence 1: After skew was observed, through 6/18/2021, the following positions were initiated against the $500 support level for a $1,011.00 credit.

  • June 11 Expiry 500P+1, 450P-2
  • June 25 Expiry 490P+9, 440P-18 
  • June 25 Expiry 550P+2, 500P-4
  • June 25 Expiry 300P+2

By 6/21/2021, all aforementioned positions were closed for a $271.00 debit, netting a $691.58 credit after commissions and fees.

Sequence 2: Through 6/29/2021, skew improved and the following positions were initiated for a $5,651.38 credit.

  • July 2 Expiry 500P+3, 450P-6 
  • July 2 Expiry 525P+7, 475P-14
  • July 2 Expiry 545P+1, 495P-2 
  • July 9 Expiry 850C+2, 900C-4 
  • July 9 Expiry 580P+11, 530P-22 
  • July 9 Expiry 350P+3 
  • July 16 Expiry 850C+4, 900C-8

Through 7/12/2021, the above structures were removed for a $90.00 debit, netting a $5,443.93 credit after commissions and fees.

Sequence 3: Through 7/6/2021, skew remained and the following positions were initiated for a $3,566.00 credit.

  • July 16 Expiry 575P+11, 525P-22
  • July 16 Expiry 600P+1, 550P-2
  • July 16 Expiry 350P+3 

Through 7/14/2021, the above structures were removed for a $473.00 debit, netting a $3,043.29 credit after commissions and fees.

Summary: In total, the sequence of trades net a $9,178.80 credit after commissions and fees. 

The above strategies were employed per Physik Invest’s core edge: the trade of ratioed, multi-leg strategies that combine short and long positions to reduce risk and increase returns. 

By leveraging the dynamics of time and volatility, through complex spreads, Physik Invest was paid to express a neutral stance on underlying Tesla stock with the potential to further capitalize on an expansion of range in either direction.

Disclaimer: There is a $0.77 discrepancy between the transaction sheet and the numbers provided in this case study. This is attributable to differences in rounding.

Categories
Commentary

Daily Brief For July 26, 2021

Market Commentary

Equity index futures trade sideways to lower. Yields lead lower.

  • China tension, infrastructure, COVID talk.
  • Ahead are new home sales and earnings.
  • S&P plays with a potential auction failure.

What Happened: U.S. stock index futures auctioned sideways to lower overnight alongside narratives surrounding a U.S. and China stalemate, progress on infrastructure, as well as the spread of COVID-19 variants.

On COVID-19, Nordea analysts conclude: “Delta is a cause for concern around the globe, but judging from the case to hospitalization ratio, it seems as if the crisis is already mostly over. Central banks will conclude the same soon, even if the initial reaction to Delta is clearly dovish.”

Moreover, ahead is data on new home sales, as well as earnings reports by Tesla Inc (NASDAQ: TSLA) and Lockheed Martin Corporation (NYSE: LMT), among other companies.

Graphic updated 6:40 AM ET. Sentiment Neutral if expected /ES open is inside of the prior day’s range. See here for more on the Dark Pool Index and Gamma. A positive Dark Pool Index reading is bullish. At the same time, the higher (lower) the gamma, the less (more) volatility. SHIFT Search data used for options activity. Note that options flow is sorted by the call premium spent; if green and more (less) positive then more (less) was spent on call options. Breadth reflects a reading of the prior day’s Advance/Decline indicator.

What To Expect: As of 6:40 AM ET, Monday’s regular session (9:30 AM – 4:00 PM EST) in the S&P 500 will likely open inside of prior-range and -value, suggesting a limited potential for immediate directional opportunity.

Adding, during Friday’s trade, the best case outcome occurred, evidenced by trade above $4,384.50, a prior all-time high (ATH) and balance-area high (BAH).

Balance (Two-Timeframe Or Bracket): Rotational trade in which current prices offer favorable entry and exit. Balance-areas make it easy to spot a change in the market (i.e., the transition from two-time frame trade, or balance, to one-time frame trade, or trend).

To note, Friday’s trade happened on positive, albeit weaker breadth. This is in comparison to Thursday’s session during which breadth, measured by the Advance/Decline indicator, was negative and not supportive of an advance in price.

A key thing to watch for is acceptance (i.e., more than 1-hour of trade) and whether an auction failure transpires.

If initiative buyers were to further expand the range, then all is well. However, in a failure to move higher, confirmed by trade below Friday’s $4,372.50 regular trade low (RTH Low), an auction failure may foreshadow a liquidation break.

Liquidation Breaks: A profile shape that suggests participants were “too” long and had poor location.

For today, participants can trade from the following frameworks. 

In the best case, the S&P 500 trades sideways or higher; activity above the $4,384.50 pivot puts in play the $4,398.50 high volume area (HVNode). Initiative trade beyond the $4,398.50 HVNode could reach as high as the $4,407.75 ATH and $4,428.25 Fibonacci-derived target.

In the worst case, the S&P 500 trades lower; activity below the $4,384.50 pivot puts in play a potential auction failure confirmed by trade below the $4,372.50 RTH Low. Initiative trade beyond the RTH Low may reach as low as the $4,353.00 untested Point of Control (VPOC) and $4,325.75 LVNode.

To note, the last key level corresponds with two anchored Volume Weighted Average Price (VWAP) levels, a metric highly regarded by chief investment officers, among other participants, for quality of trade. Additionally, liquidity algorithms are benchmarked and programmed to buy and sell around VWAPs.

POCs: POCs are valuable as they denote areas where two-sided trade was most prevalent. Participants will respond to future tests of value as they offer favorable entry and exit.

Volume Areas: A structurally sound market will build on past areas of high volume. Should the market trend for long periods of time, it will lack sound structure (identified as a low volume area which denotes directional conviction and ought to offer support on any test). 

If participants were to auction and find acceptance into areas of prior low volume, then future discovery ought to be volatile and quick as participants look to areas of high volume for favorable entry or exit.
Graphic: 65-minute profile chart of the Micro E-mini S&P 500 Futures. Graphic updated 6:30 AM ET.

News And Analysis

China stocks tumble in panic selling amid a broad crackdown.

U.S. infrastructure talks near finish as Senators face pressure.

U.S. real yields fell to a record low alongside growth concerns.

The COVID-19 coronavirus crisis is officially over (in the West).

U.S. home price appreciation to moderate as supply increases.

What People Are Saying

About

After years of self-education, strategy development, and trial-and-error, Renato Leonard Capelj began trading full-time and founded Physik Invest to detail his methods, research, and performance in the markets. Additionally, Capelj is a finance and technology reporter. Some of his biggest works include interviews with leaders such as John Chambers, founder and CEO, JC2 Ventures, Kevin O’Leary, businessman and Shark Tank host, Catherine Wood, CEO and CIO, ARK Invest, among others.

Disclaimer

At this time, Physik Invest does not manage outside capital and is not licensed. In no way should the materials herein be construed as advice. Derivatives carry a substantial risk of loss. All content is for informational purposes only.

Categories
Commentary

Daily Brief For May 11, 2021

Market Commentary

Index futures in balance.

  • Inflation fears stoking weakness.
  • Ahead is JOLTS data, Fed speak.
  • Index futures lower, tech weighs.
Graphic updated 7:55 AM EST.

What Happened: U.S. stock index futures auctioned lower, overnight, alongside fears of rising inflation. Most affected were heavily-weighted index constituents (e.g., Facebook, Netflix, Google, Microsoft, Amazon, Nvidia, and Tesla), or stocks that have the most to lose in an environment that favors cyclical and value assets.

Adding, despite the Federal Reserve’s commitment to limiting talk of taper and rate hikes, traders are positioning themselves for a change in tone. Activity in the 98.00 put strike options, in the Eurodollar, suggests traders are betting on a potential surprise at the Jackson Hole symposium.

Graphic: Eurodollar bet on SHIFT’s institutional platform. The purchase of 98.00 strike put options suggests traders are looking to add “two Fed hikes to [current] expectations.”

What To Expect: Tuesday’s regular session (9:30 AM – 4:00 PM EST) in the S&P 500 will open far from prior-range and -value, suggesting a limited potential for immediate directional opportunity. Reason being — a state of shock, as a result of a severe overnight drop.

Adding, during the prior day’s regular trade, the worst-case outcome occurred, evidenced by initiative trade below the $4,216.00 low volume area (LVNode). The HVNodes at $4,199.25, $4,190.75, and $4,177.25 (a major pivot) all were in play, yesterday.

Volume Areas: A structurally sound market will build on past areas of high volume. Should the market trend for long periods of time, it will lack sound structure (identified as a low volume area which denotes directional conviction and ought to offer support on any test). 

If participants were to auction and find acceptance into areas of prior low volume, then future discovery ought to be volatile and quick as participants look to areas of high volume for favorable entry or exit.

For today, participants can trade from the following frameworks. 

In the best case, the S&P 500 trades sideways or higher; activity above the $4,169.75 overnight pullback high targets the $4,177.25 HVNode pivot. Initiative trade beyond the pivot puts in play the $4,191.25, $4,199.25, $4,211.50, and $4,224.75 HVNodes. 

In the worst case, the S&P 500 trades lower; activity below the $4,177.25 pivot targets the $4,141.00 VPOC. Thereafter, if lower, participants may look for responses at the $4,137.25 and $4,122.75 HVNodes. Auctioning through $4,130.25 increases the odds of trade to the poor structure at $4,110.50.

POCs: POCs (like HVNodes described above) are valuable as they denote areas where two-sided trade was most prevalent. Participants will respond to future tests of value as they offer favorable entry and exit.
Graphic: 65-minute profile chart of the Micro E-mini S&P 500 Futures.
Graphic: Daily candlestick charts of the S&P 500 (top left), Nasdaq 100 (top right), Russell 2000 (bottom left), and Dow Jones Industrial Average (bottom right). The Dow is the strongest of the four. The Nasdaq is the weakest.
Graphic: SHIFT search suggests participants were very interested in put strikes at and below $4,200.00 in the cash-settled S&P 500 Index (INDEX: SPX), May 10.

News And Analysis

Economy | The Fed is playing with fire by clinging to emergency policies. (WSJ)

Economy | Homebuying sentiment negative despite economic improvement. (MND)

Markets | Pipeline shutdown could push prices at the pump above $3 a gallon. (CNBC)

Economy | Near-term activity data unlikely to affect Fed’s policy rate outlook. (BLK)

Economy | COVID one year on, global infrastructure proves its resilience. (Moody’s)

Recovery | New U.S. COVID infections fall to the lowest level in 11 months. (FT)

What People Are Saying

Innovation And Emerging Trends

Markets | What happens to stocks after the Fed stops raining money? (WSJ)

Housing | Americans moved during the pandemic. Where did they go? (WSJ)

Commodities | The role of critical minerals in the clean energy transition. (IEA)

Markets | More whacks around the head for investors after jobs data. (BBG)

About

Renato founded Physik Invest after going through years of self-education, strategy development, and trial-and-error. His work reporting in the finance and technology space, interviewing leaders such as John Chambers, founder, and CEO, JC2 Ventures, Kevin O’Leary, businessman and Shark Tank host, Catherine Wood, CEO and CIO, ARK Invest, among others, afforded him the perspective and know-how very few come by.

Having worked in engineering and majored in economics, Renato is very detailed and analytical. His approach to the markets isn’t built on hope or guessing. Instead, he leverages the unique dynamics of time and volatility to efficiently act on opportunity.

Disclaimer

At this time, Physik Invest does not manage outside capital and is not licensed. In no way should the materials herein be construed as advice. Derivatives carry a substantial risk of loss. All content is for informational purposes only.

Categories
Commentary

Market Commentary For The Week Ahead: ‘Hello, Goodbye’

Key Takeaways:

What Happened: Coming into the extended holiday weekend, on tapering volumes, U.S. index futures balanced for four regular trading sessions (9:30 AM – 4:00 PM ET), before breaking out.

Pictured: Profile overlays on a 15-minute candlestick chart of the Micro E-mini S&P 500 Futures

What To Expect: Thursday’s session found initiative buying surface above the $3,731.00 high-volume node (HVNode), the market’s most recent perception of value.

Given four-sessions worth of unchanged value, and the failure to fill the gap beneath a weak low (i.e., a visual level that attracts the business of short-term, technically-driven market participants) at $3,714.50, participants will come into Monday’s session knowing the following:

  1. Amid Thursday’s late-day buying, price diverged from value.
  2. The overnight rally high at $3,747.75 was recovered (i.e., based on historical trade, there were low odds that the overnight all-time high would end the upside discovery process).
  3. The multi-month upside breakout targeting S&P 500 prices as high as $4,000.00 remains intact.

In light of the above dynamics, the following frameworks apply for next week’s trade.

In the best case, the S&P 500 remains above its $3,731.00 HVNode. Expectations thereafter include continued balance, or a response followed by initiative buying to take out the price extension at $3,756.75.

In the worst case, the S&P 500 initiates below its $3,731.00 HVNode. Expectations thereafter include a test of the weak, minimal excess low at $3,714.50, and subsequent follow-through as low as the $3,691.00 break-point. 

Noting: Excess forms after an auction has traveled too far in a particular direction and portends a sustained reversal. Absence of excess, in the case of a low, suggests minimal conviction; participants will cover (i.e., back off the low) and weaken the market, before following through.

Two go, no-go levels exist; trade that finds increased involvement above $3,752.75 and below $3,714.50 would suggest a change in conviction. Anything in-between favors responsive trade.

Conclusion: From an uneven recovery, stimulus, elections, trade, and the like, it helps to boil it down to what actually matters: price and value. 

Though risks remain, markets are pricing in the odds of a continued rebound. All broad-market indices are in an uptrend. A break below $3,600.00 in the S&P 500 would denote a substantial change in tone.

Pictured: Retest of the upside breakpoint on a weekly candlestick chart of the cash S&P 500 Index

Levels Of Interest: $3,752.75 rally-high, $3,714.50 weak low, $3,731.00 HVNode, $3,756.75 price extension, $3,691.00 break-point.

Bonus: Here is a look at some of the opportunities unfolding.

Photo by Max Walter from Pexels.

Categories
Results

Case Study: Trading Tesla’s S&P 500 Inclusion

What Happened: On November 17, 2020, shares of Tesla Inc (NASDAQ: TSLA) surged on news that S&P Dow Jones Indices would include the stock in the S&P 500, the most liquid index in the world.

Since markets are most influenced by credit and positioning, news of the inclusion was impactful. Funds tied to the S&P 500 would purchase Tesla shares from a dealer by the addition date. This means that dealers would look to purchase shares of the stock heading into the event, to later supply funds at the close of Friday, December 18, the last session before the inclusion.

In the simplest of terms, the event was a positive since it meant that (1) speculative derivatives activity and associated hedging, (2) short-term traders, as well as (3) dealers and index funds would now support the stock.

The following sequence analysis unpacks how Physik Invest traded equity and derivatives tied to the carmaker’s stock leading up to the December 21, 2020 index inclusion.

Note: Click here to view all transactions.

Sequence 1: On news of the inclusion, market participants initiated shares of Tesla out of balance, beyond trend resistance. Thereafter, in accordance with a typical give and go scenario, the stock faded, filling 50% of the low-volume area left after the initial move higher, before aggressive buying resurfaced to continue the new trend.

Through November 19, the following positions were added for a $61.00 debit, in total. At this point if all legs were to remain out of the money (i.e., expire worthless) by November 20, the maximum loss would be $61.00, approximately 1/10 of a standard risk unit, or the capital risked in a typical position.

  • 500+1/530-2 call ratio spread
  • 490+2/505-3 call ratio spread
  • 525+1/550-2 call ratio spread
  • 510+1/525-2 call ratio spread
  • 445-1 put
  • 460-1 put

By November 20, all aforementioned positions were closed for an $827.00 credit, a 1,255.74% return on initial investment.

All the above call-side structures were initiated against the $500 high open interest strike. Reason being, option expiries mark an end to pinning (i.e, the theory that market makers and institutions short options move stocks to the point where the greatest dollar value of contracts will expire worthless) and the reduction dealer gamma exposure.

On November 20, nearly 40% of Tesla’s gamma was to roll off. 

Pictured: November options gamma by Spot Gamma
Pictured: Speculative call-side options activity after the index inclusion announcement 

Moreover, since derivatives exposure was rolled into farther dated expiries, the stock would now be supported by dealers buying to hedge their derivatives exposure and facilitate the index inclusion.

Noting, at a simplistic level, prices often encounter resistance at prior highs due to the supply of old business. These areas take time to resolve. Breaking and establishing value (i.e., trading more than 15-minutes above this level) portends continuation.

Sequence 2: On November 20, the following structures expiring on December 4 were initiated for a $644.00 credit.

  • 450-1 put
  • 520+1/550-1 call ratio spread
  • 570+1/600-2 call ratio spread
  • 490-1/475+1 put ratio spread

Through November 24, the above structures were removed for a $876.00 credit.

Sequence 3: On November 24, the cost basis from November 19 ($61.00 debit) was reduced via an intraday long stock delta hedge that bought 10 shares at an average of $539.50.

The initial cost basis, after this particular trade, was brought down to a $0.20 debit.

Sequence 4: On November 25 the following positions were opened and closed the same day for a $179.30 credit.

  • Bought stock at $550.14 average
  • 480+1/500-2 call ratio spread

Sequence 5: On November 27, the following positions were initiated and closed by December 3 for a $117.10 debit.

  • Bought stock at $595.55 average
  • 475+1/437.5-2 put ratio spread

Sequence 6: On December 1 through December 3, the following positions were initiated, and then exited from by December 7 for a $1.77 debit.

  • Bought stock at $589.20 average
  • Bought stock at $563.77 average
  • 740+1/780C-2 call ratio spread

Sequence 7: Through December 17, the following positions were initiated and closed for a total $452.30 credit.

  • 720+1/820-2 call ratio spread
  • 740+1/830-2 call ratio spread
  • Bought stock at $632.17 average
  • 720+1/820-2 call ratio spread
  • Bought stock at $606.88 average
  • 800+1/860-2 call ratio spread
  • 500+1/480-2 put ratio spread

Sequence 8: From December 17 through December 23 the following positions were entered and exited from for a $322.00 credit.

  • 500+2/450-4 put ratio spread
  • 800+2/850-4 call ratio spread
  • 670+1/685-2 call ratio spread

Summary: In total, the above sequence of trades net a $3,098.29 credit after commissions and fees.

The strategies employed were in accordance with Physik Invest’s methodology: the trade of ratioed, multi-leg strategies that combine short and long positions to reduce risk and increase returns. 

Yes, in hindsight, one could have opted for something as simple as risk-reversals (e.g., buying calls and selling puts). However, the risks tied to such strategies are immense. By leveraging the dynamics of time and volatility, through complex spreads, risk was reduced.

Note: There were many times, during these sequences, that positions were structured in a way that would net no loss had the security moved sideways or lower into expiry.

Adding, per Fibonacci principles, one core aspect of Physik Invest’s market structure analysis, an upside target of $675.10 was established early on in the process. Tesla spent the majority of its December 18 session at this level.

Disclaimer: There is a $0.11 discrepancy between the transaction sheet and numbers provided in this case study. This is attributable to differences in rounding.