Categories
Commentary

Daily Brief For August 16, 2022

The daily brief is a free glimpse into the prevailing fundamental and technical drivers of U.S. equity market products. Join the 800+ that read this report daily, below!

Graphic updated 7:00 AM ET. Sentiment Neutral if expected /ES open is inside of the prior day’s range. /ES levels are derived from the profile graphic at the bottom of the following section. Levels may have changed since initially quoted; click here for the latest levels. SqueezeMetrics Dark Pool Index (DIX) and Gamma (GEX) calculations are based on where the prior day’s reading falls with respect to the MAX and MIN of all occurrences available. A higher DIX is bullish. At the same time, the lower the GEX, the more (expected) volatility. Learn the implications of volatility, direction, and moneyness. Breadth reflects a reading of the prior day’s NYSE Advance/Decline indicator. VIX reflects a current reading of the CBOE Volatility Index (INDEX: VIX) from 0-100.

Fundamental

The Daily Brief for Monday, August 15, 2022, provided us with a great start to the week. Today, unfortunately, we add only lightly to this narrative, and we will elaborate in later sessions.

In short, markets experienced one of the largest, wide-ranging, short-covering rallies, in years, bolstered by machines “hell-bent on pushing the financial conditions easing trade,” as well put by Dennis DeBusschere, the founder of 22V Research.

Graphic: Retrieved from Bloomberg.

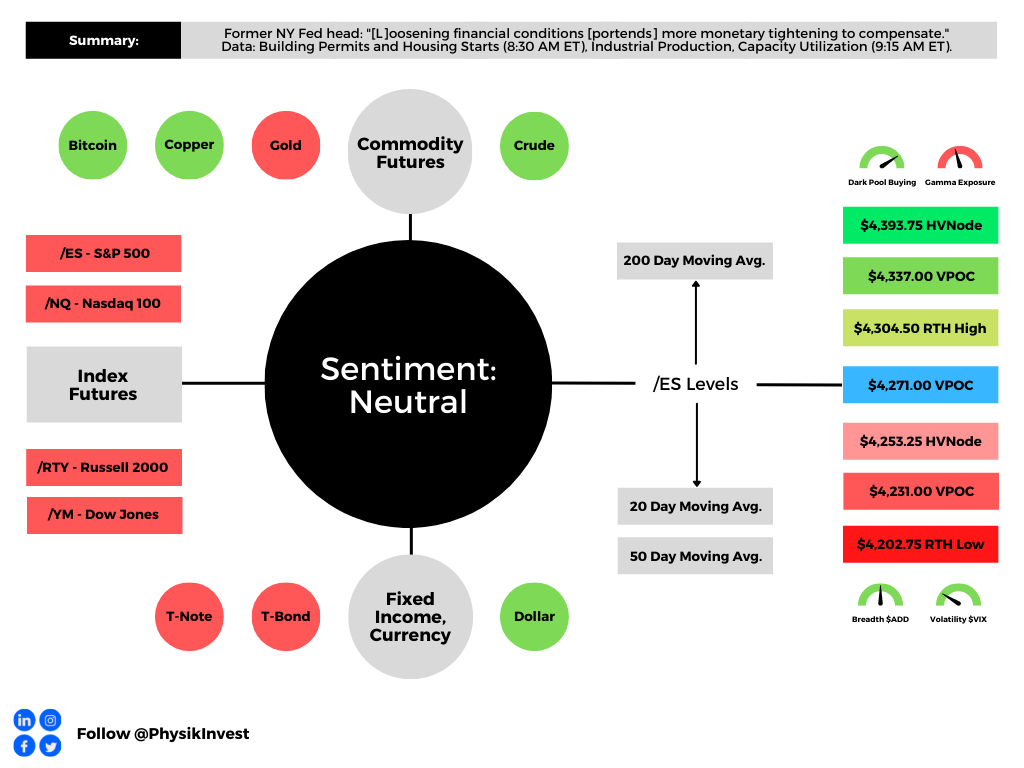
Notwithstanding improving sentiment and data on jobs, as well as cooler inflation figures, former New York Federal Reserve (Fed) President William Dudley, thinks markets have underestimated the Fed’s determination to stem inflation.

To summarize, the Fed will keep hiking until inflation is back to its 2% target and there is more slack in the labor market

“I think the Fed is going to be higher for longer than what market participants understand at this point,” he explained. This action ought to last at least until the unemployment rate is “well above 4%,” above today’s 3.5%.

Accordingly, “whenever the unemployment rate has risen by a half percentage point or more, the result has been a full-blown recession.”

There is also quantitative tightening (QT), the direct flow of capital from capital markets.

Bank of America Corporation (NYSE: BAC) strategists see the prevailing assumption as if “QT is already priced into the market.”

“The market does not seem to be looking ahead,” the strategists said, suggesting the S&P 500 could print 7% lower, at least. “If financial conditions tighten in a meaningful way, then that could make QT a more important topic.”

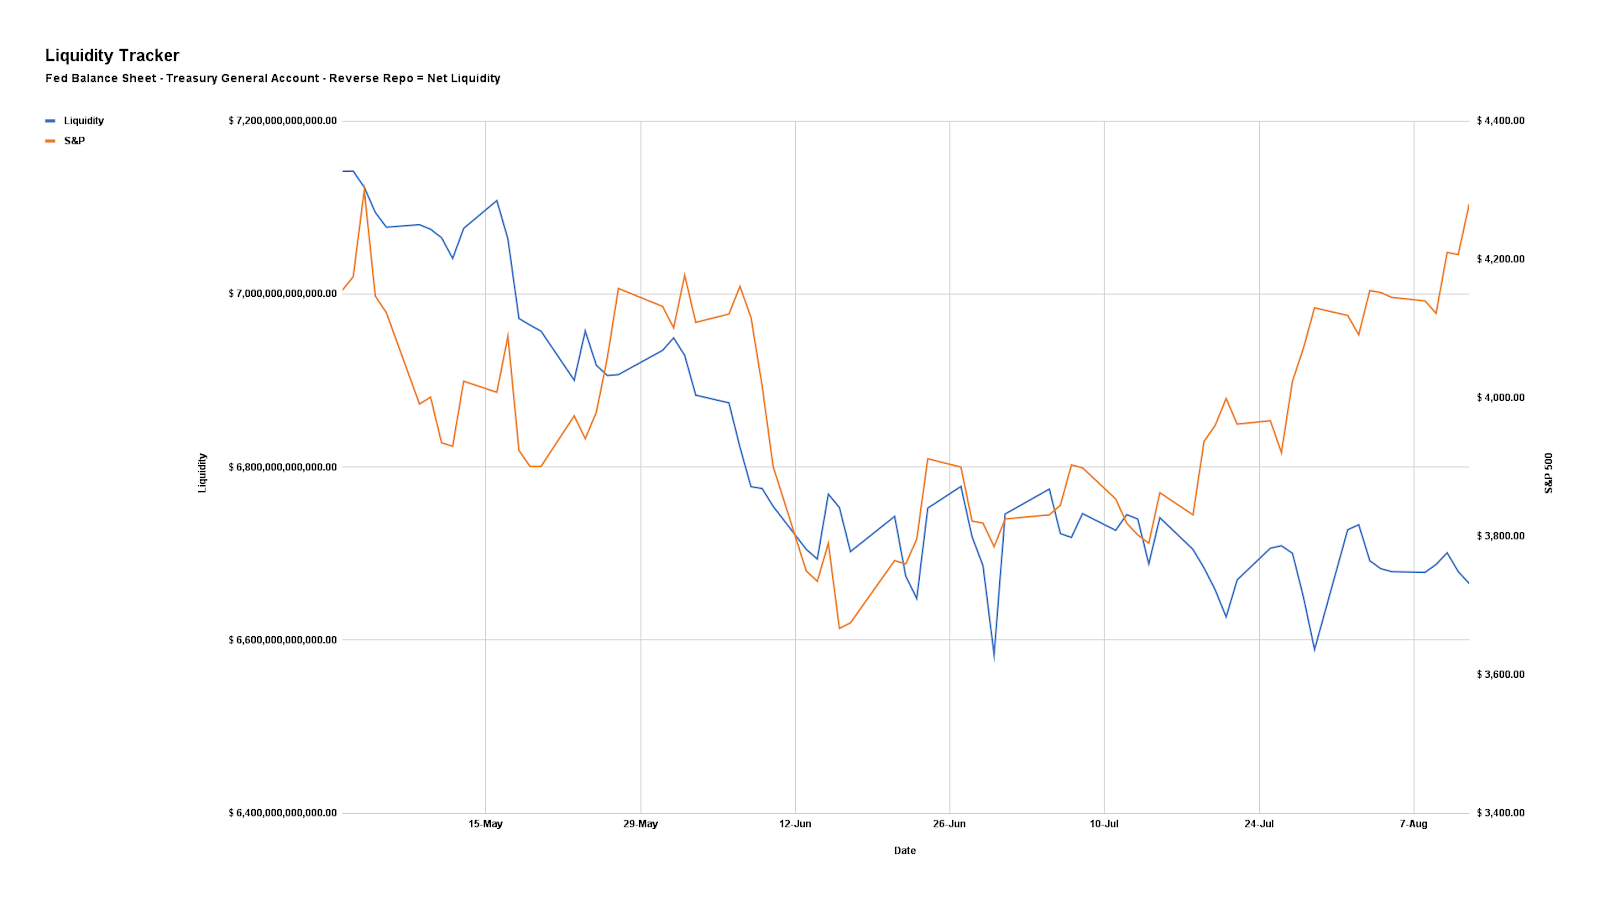
Still, Treasury buybacks are among the tools that could be used to strengthen markets against the rising tide of “issuance and potential structural inflation, … [easing] QT by moving liquidity out of the RRP and into the banking sector,” per Joseph Wang.

More on this, later!

Graphic: Via Physik Invest. Data compiled by @jkonopas623. Fed Balance Sheet data, here. Treasury General Account Data, here. Reverse Repo data, here. NL = BS – TGA – RRP.

Positioning

Please refer to our detailed Daily Brief for August 12, 2022. We shall add to this narrative in the coming sessions.

Technical

As of 7:00 AM ET, Tuesday’s regular session (9:30 AM – 4:00 PM ET), in the S&P 500, is likely to open in the middle part of a negatively skewed overnight inventory, inside of prior-range and -value, suggesting a limited potential for immediate directional opportunity.

In the best case, the S&P 500 trades higher.

Any activity above the $4,271.00 VPOC puts into play the $4,304.50 RTH High. Initiative trade beyond the RTH High could reach as high as the $4,337.00 VPOC and $4,393.75 HVNode, or higher.

In the worst case, the S&P 500 trades lower.

Any activity below the $4,271.00 VPOC puts into play the $4,253.25 HVNode. Initiative trade beyond the HVNode could reach as low as the $4,231.00 VPOC and $4,202.75 RTH Low, or lower.

Click here to load today’s key levels into the web-based TradingView charting platform. Note that all levels are derived using the 65-minute timeframe. New links are produced, daily.
Graphic: 65-minute profile chart of the Micro E-mini S&P 500 Futures.

Considerations: Responsiveness near key-technical areas (that are discernable visually on a chart), suggests technically-driven traders with short time horizons are very active. 

Such traders often lack the wherewithal to defend retests and, additionally, the type of trade may be indicative of the other time frame participants waiting for more information to initiate trades.

Definitions

Volume Areas: A structurally sound market will build on areas of high volume (HVNodes). Should the market trend for long periods of time, it will lack sound structure, identified as low volume areas (LVNodes). LVNodes denote directional conviction and ought to offer support on any test. 

If participants were to auction and find acceptance into areas of prior low volume (LVNodes), then future discovery ought to be volatile and quick as participants look to HVNodes for favorable entry or exit.

POCs: POCs are valuable as they denote areas where two-sided trade was most prevalent in a prior day session. Participants will respond to future tests of value as they offer favorable entry and exit.

About

After years of self-education, strategy development, mentorship, and trial-and-error, Renato Leonard Capelj began trading full-time and founded Physik Invest to detail his methods, research, and performance in the markets.

Capelj also develops insights around impactful options market dynamics at SpotGamma and is a Benzinga reporter.

Some of his works include conversations with ARK Invest’s Catherine Wood, investors Kevin O’Leary and John Chambers, FTX’s Sam Bankman-Fried, ex-Bridgewater Associate Andy Constan, Kai Volatility’s Cem Karsan, The Ambrus Group’s Kris Sidial, among many others.

Disclaimer

In no way should the materials herein be construed as advice. Derivatives carry a substantial risk of loss. All content is for informational purposes only.

Categories
Commentary

Daily Brief For December 10, 2021

What Happened

Overnight, equity index futures staged a reversal, auctioning back from yesterday’s knee-jerk liquidation toward intraday value, the levels at which 70% of Thursday’s volume transacted.

Ahead is data on the Consumer Price Index (CPI) and Core Inflation (8:30 AM ET), University of Michigan Consumer Sentiment and Expected Inflation (10:00 AM ET), as well as the Federal Budget (2:00 PM ET).

Graphic updated 6:40 AM ET. Sentiment Neutral if expected /ES open is inside of the prior day’s range. /ES levels are derived from the profile graphic at the bottom of the following section. Levels may have changed since initially quoted; click here for the latest levels. SqueezeMetrics Dark Pool Index (DIX) and Gamma (GEX) calculations are based on where the prior day’s reading falls with respect to the MAX and MIN of all occurrences available. A higher DIX is bullish. At the same time, the lower the GEX, the more (expected) volatility. Learn the implications of volatility, direction, and moneyness. SHIFT data used for S&P 500 (INDEX: SPX) options activity. Note that options flow is sorted by the call premium spent; if more positive then more was spent on call options. Breadth reflects a reading of the prior day’s NYSE Advance/Decline indicator. VIX reflects a current reading of the CBOE Volatility Index (INDEX: VIX) from 0-100.

What To Expect

After a multi-day pin against the S&P 500 $4,700.00 area, on weak intraday breadth and market liquidity metrics, the worst-case outcome occurred; participants moved the index away from its intraday value, the levels at which participants found it most favorable to trade at.

As noted in past commentaries, participants’ discovery of higher prices left poor structure; both Monday and Tuesday’s sessions left gaps and p-shaped emotional, multiple-distribution profile structures (i.e., old-money shorts covering).

Thursday’s end-of-day liquidation, ahead of new data on inflation, brought the S&P 500 into a pocket of low volume (LVNode) that participants quickly rejected overnight.

This rejection suggests participants responsively bought the move lower; more information is needed to warrant an expansion of range in either direction.

Graphic: Supportive delta (i.e., committed end-of-day selling as measured by volume delta or buying and selling power as calculated by the difference in volume traded at the bid and offer) in SPDR S&P 500 ETF Trust (NYSE: SPY), one of the largest ETFs that track the S&P 500 index, via Bookmap

Context: Inflation is key in gauging monetary policy. 

Per Bloomberg, a CPI figure above (below) of 7% likely sparks a risk-off (risk-on) move.

Either way, next week the Fed ought to announce an acceleration in its taper to bond-buying. 

Upon an end to the taper, there ought to be a tightening; William Dudley, a former New York Fed governor, believes there will be three 0.25-percentage-point rate increases next year. 

In 2023, Dudley sees four rate hikes that bring the median target rate to 1.8%, and then, the target rate will reach 2.5% in 2024.

Rising rates, among other factors, have the potential to decrease the present value of future earnings, thereby making stocks, especially those that are high growth, less attractive.

Higher inflation prints, today, could spark a risk-off move as participants price in more aggressive change to the monetary frameworks and liquidity provision that promoted a large divergence in price form fundamentals.

“[T]he Fed may be making a policy error by essentially overweighting a fight against inflation versus supporting growth,” Bank of America’s (NYSE: BAC) Mark Cabana explained.

Participants are “worried that the Fed is going to be tightening into supply-constrained inflation and reduction of consumer purchasing power and they’re doing that because they’re worried risk assets may be very sensitive to rate levels.”

Despite the doom and gloom, it’s worth noting that today’s rates and earnings support validations better than in the ‘90s.

The “growth in earnings is so far stronger than the multiple compression caused by rising rates (blue line),” and that will continue to bolster any rally attempt.

Graphic: Low rates support current valuations better than the ‘90s, according to Nasdaq.

Still, that intent to moderate stimulus serves as a headwind and some high-growth names have been weakening.

For instance, as shares of Tesla Inc (NASDAQ: TSLA) declined, yesterday, SpotGamma data suggested participants were seeking downside protection, in size.

Due to an environment wherein the counterparties to customer option trades buy (sell) into weakness (strength), indices are pinned.

“[D]ealer hedging has suppressed index level volatility, but underlying components are [] exhibiting idiosyncratic volatility,” as one paper puts it.

“The only reconciliation is a decline in correlation.”

If that activity in highly-weighted constituents like Tesla was to feed into the indices, the effects would be destabilizing.

However, in regards to positioning metrics, at present, the return distribution is skewed positive.

Adding, if participants are assuaged of their fears at next week’s Federal Open Market Committee (FOMC) meeting, a collapse in event-related implied volatility ought to bring in positive flows as the long delta (from dealers’ exposure to short puts) decreases; the decrease in dealer supply (short delta), via covering of short stock/futures hedges, would bolster any attempt higher. See below.

Expectations: As of 6:40 AM ET, Friday’s regular session (9:30 AM – 4:00 PM ET), in the S&P 500, will likely open in the upper part of a positively skewed overnight inventory, inside of prior-range and -value, suggesting a limited potential for immediate directional opportunity.

Balance Expected: Rotational trade that denotes current prices offer favorable entry and exit. 

Balance-areas make it easy to spot a change in the market (i.e., the transition from two-time frame trade, or balance, to one-time frame trade, or trend). 

Modus operandi is responsive trade (i.e., fade the edges), rather than initiative trade (i.e., play the break).

In the best case, the S&P 500 trades sideways or higher; activity above the $4,685.00 untested point of control (VPOC) puts in play the $4,705.75 LVNode. Initiative trade beyond the LVNode could reach as high as the $4,716.75 LVNode and $4,740.50 minimal excess high, or higher.

In the worst case, the S&P 500 trades lower; activity below the $4,685.00 VPOC puts in play the $4,674.25 HVNode. Initiative trade beyond the HVNode could reach as low as the $4,647.25 and $4,618.75 HVNode, or lower.

Click here to load today’s key levels into the web-based TradingView charting platform. Note that all levels are derived using the 65-minute timeframe. New links are produced, daily.
Graphic: 65-minute profile chart of the Micro E-mini S&P 500 Futures. Learn about the profile.

What People Are Saying

Definitions

Cave-Fill Process: Widened the area deemed favorable to transact at by an increased share of participants. This is a good development.

Volume Areas: A structurally sound market will build on areas of high volume (HVNodes). Should the market trend for long periods of time, it will lack sound structure, identified as low volume areas (LVNodes). LVNodes denote directional conviction and ought to offer support on any test. 

If participants were to auction and find acceptance into areas of prior low volume (LVNodes), then future discovery ought to be volatile and quick as participants look to HVNodes for favorable entry or exit.

POCs: POCs are valuable as they denote areas where two-sided trade was most prevalent in a prior day session. Participants will respond to future tests of value as they offer favorable entry and exit.

Value-Area Placement: Perception of value unchanged if value overlapping (i.e., inside day). Perception of value has changed if value not overlapping (i.e., outside day). Delay trade in the former case.

Excess: A proper end to price discovery; the market travels too far while advertising prices. Responsive, other-timeframe (OTF) participants aggressively enter the market, leaving tails or gaps which denote unfair prices.

About

After years of self-education, strategy development, and trial-and-error, Renato Leonard Capelj began trading full-time and founded Physik Invest to detail his methods, research, and performance in the markets.

Additionally, Capelj is a Benzinga finance and technology reporter interviewing the likes of Shark Tank’s Kevin O’Leary, JC2 Ventures’ John Chambers, and ARK Invest’s Catherine Wood, as well as a SpotGamma contributor, helping develop insights around impactful options market dynamics.

Disclaimer

At this time, Physik Invest does not carry the right to provide advice. In no way should the materials herein be construed as advice. Derivatives carry a substantial risk of loss. All content is for informational purposes only.