
What Happened
Overnight, equity index futures auctioned higher alongside most commodities and volatility fell.
This is as investors await data on manufacturing and job openings/quits (10:00 AM ET).
What To Expect
Fundamental: The aforementioned trade is happening in the context of a resurgence in the coronavirus, as well as the Federal Reserve’s intent to moderate stimulus, among other things.
“We expect 2022 to be far more challenging from an investment perspective,” Heather Wald, vice president at Bel Air Investment Advisors, said.
“Rarely has a market delivered three consecutive years of double-digit returns, as we have seen from 2019-2021. With the Federal Reserve set to accelerate tightening and a fairly valued stock market, we anticipate more muted returns for the S&P next year but still expect equities to remain attractive versus other liquid asset classes.”
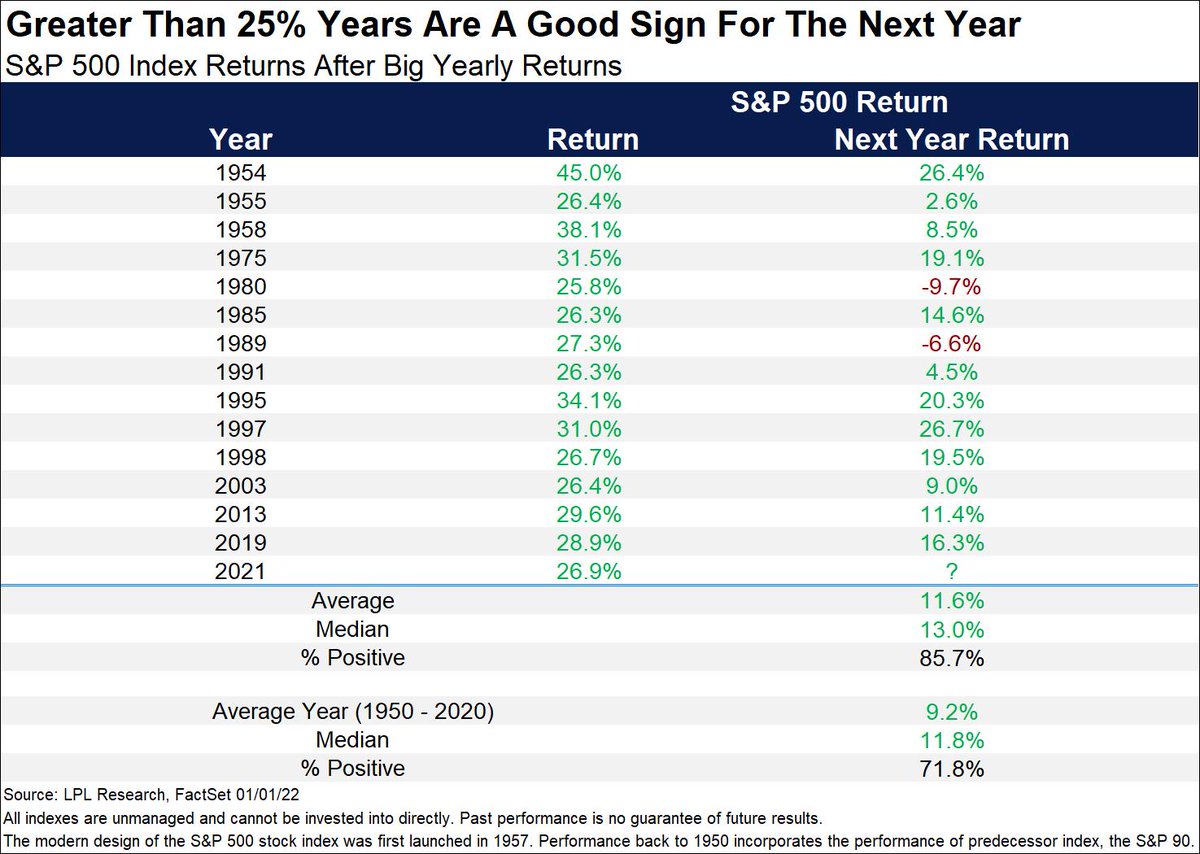
Wald’s comments align with some metrics posted by LPL Financial’s Ryan Detrick.
“The bad news is when the S&P 500 gains more than 25% in a year, it has never gained more the following year,” Detrick said. “The good news? That next year can still be pretty darn good. Higher 85% of the time and up a solid 11% on average.”
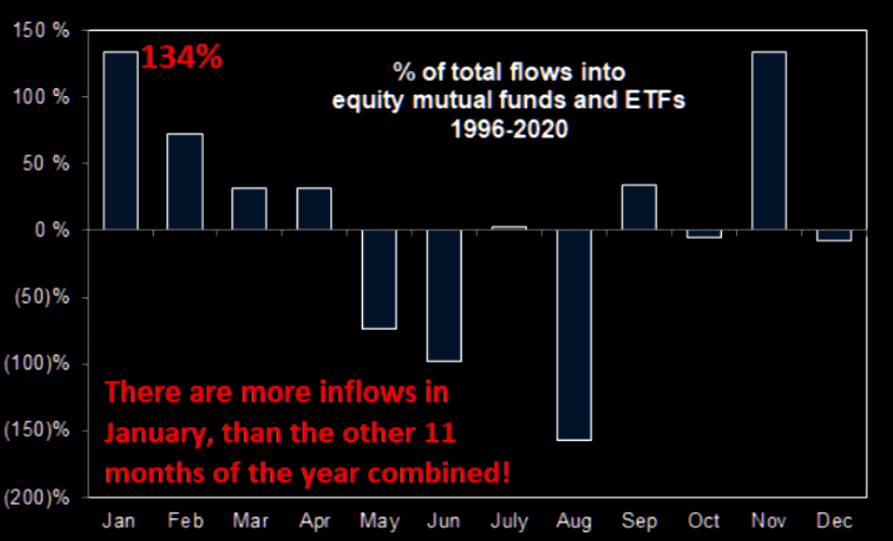
This is as the S&P 500 sticks to its seasonal script; in the face of light positioning metrics, expected are massive inflows in the first few months of this year.
This year is likely to be “dominated by continued knife-edge judgments by the Fed,” and inflation proving better than the most pessimistic forecasts, potentially.
The prospects of a rally into the first rate hike are emboldened. Thereafter, the market may decline through the rest of 2022.
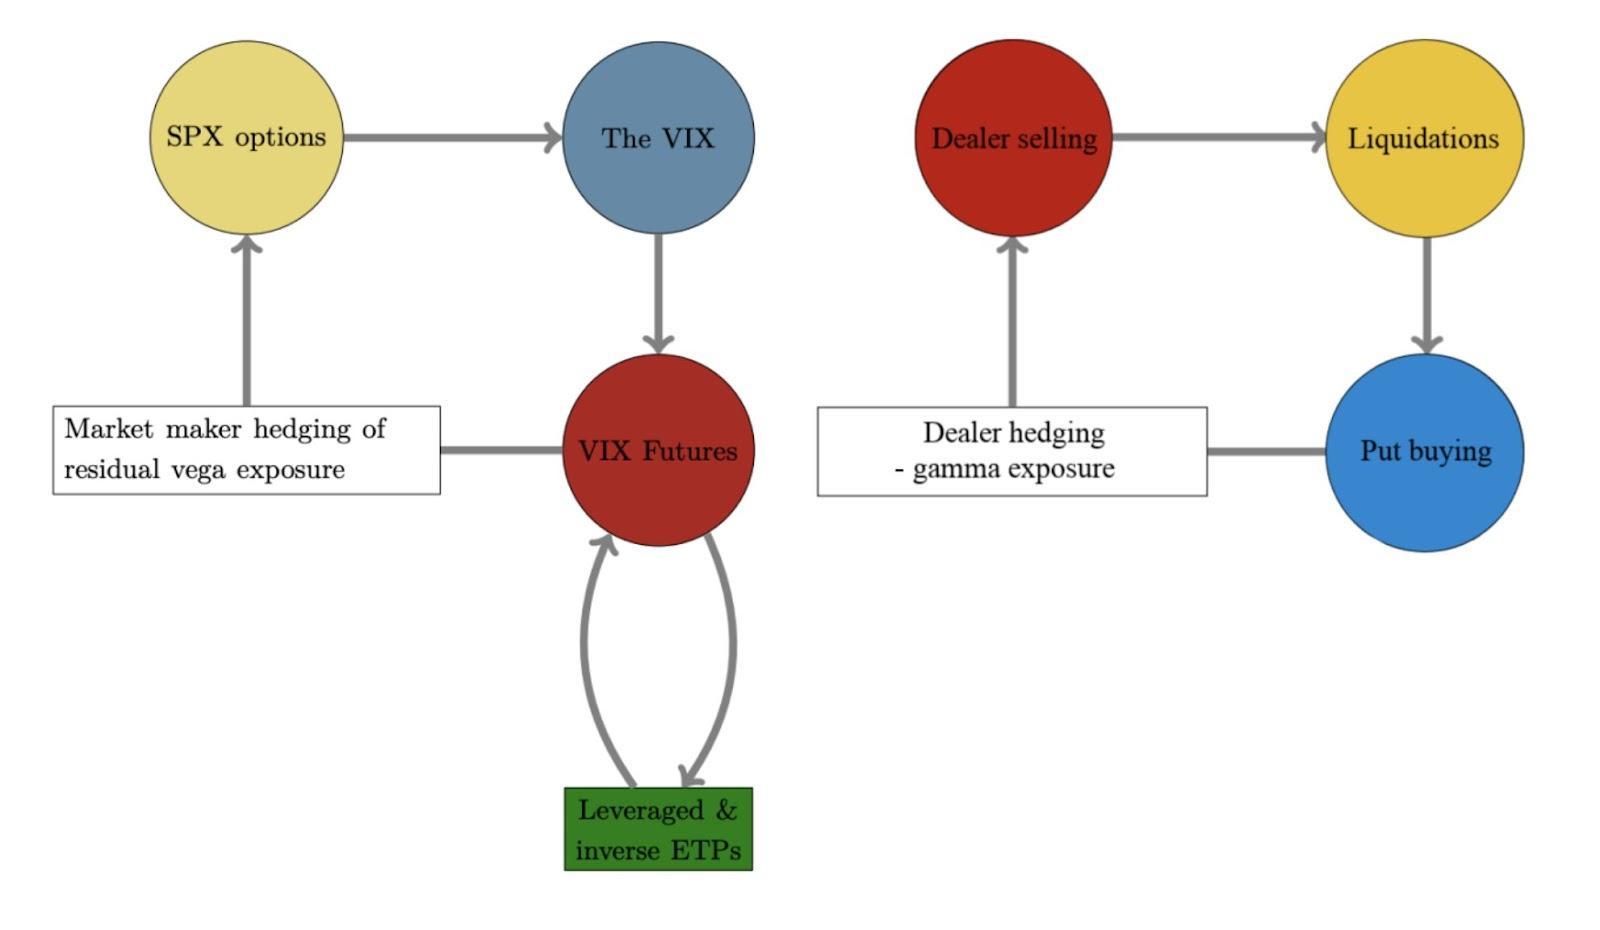
Positioning: Interesting Twitter thread by Kris Sidial on the transfer of risk in different areas of the volatility term structure.
“You are seeing institutions aim to harvest the VRP in single stock land by hammering away at the front of the term structure. Especially the exotics desks that are notorious for carrying this inherent short calendar profile.”
What Sidial is talking about is most easily visualized by the compression and expansion of the VIX term structure in the graphic below. Notice the front move, relative to the back, below.
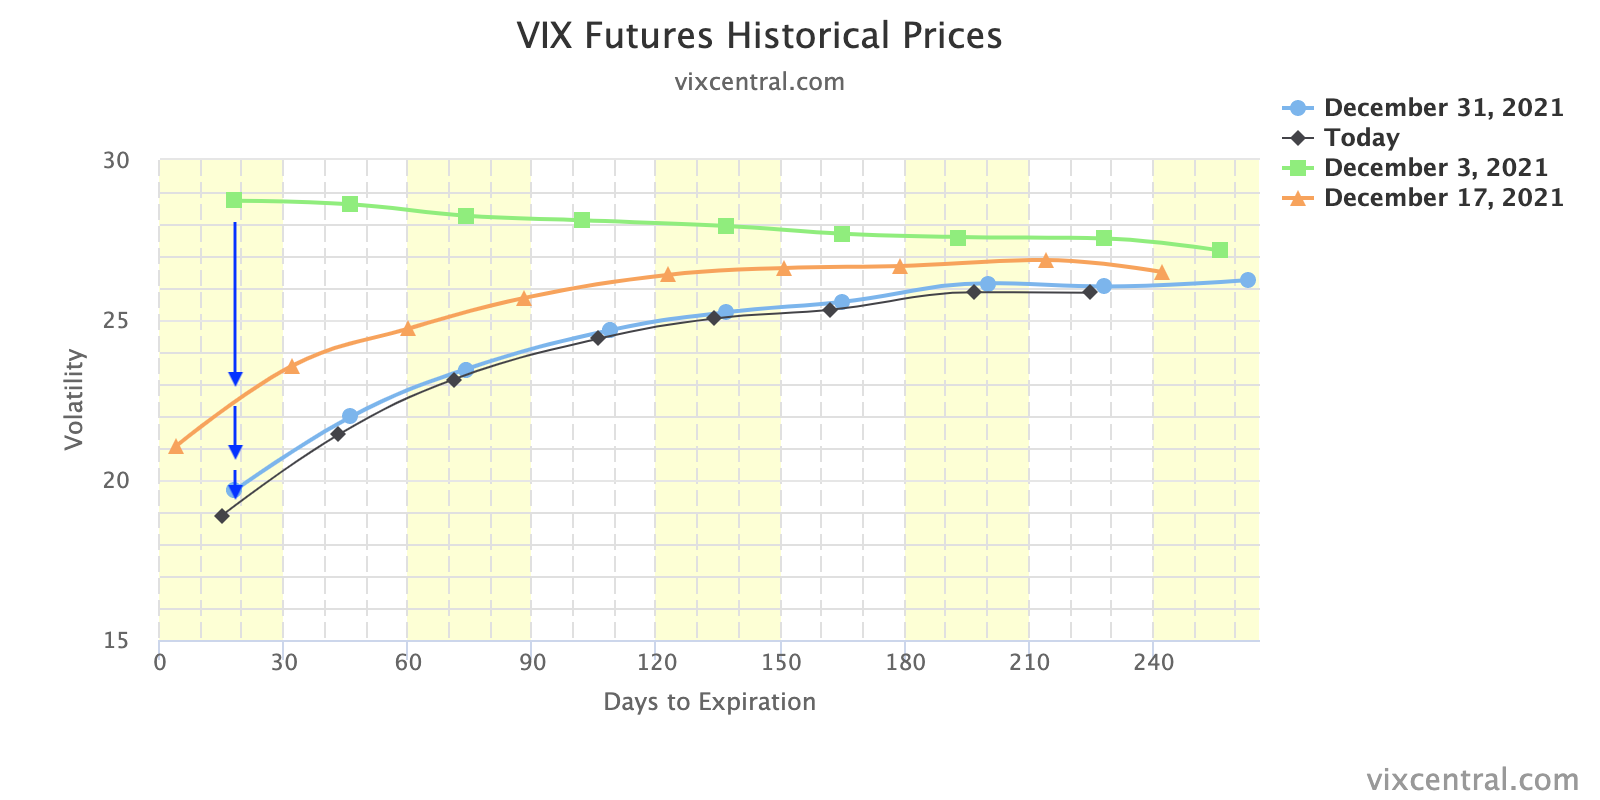
The implications of this are staggering.
Participants, having been pushed out the risk curve, are using leverage to juice returns; option volumes are comparable to stock volumes.
As a result, related hedging flows represent an increased share of volume.
As I once wrote in a Benzinga article: “The reflexive response by the opposing side of options trades — a result of regulatory frameworks, the low-interest-rate environment, as well as growth of the derivatives complex — causes a cascading reaction that exacerbates underlying price movements.”
Sidial adds: “[T]his short gamma profile with more and more people using derivatives will make way for the rapid moves in shorter time frames.”
That explains a lot!
Moreover, if we zoom in more narrow, today, though implied volatility “is well above its pre-COVID level across the term structure,” it is being sold at the front end.
SpotGamma data confirms this. Via the graphic below, the compression of volatility coincides with call and put selling at the index level; note, though, the increased put selling (more bullish).
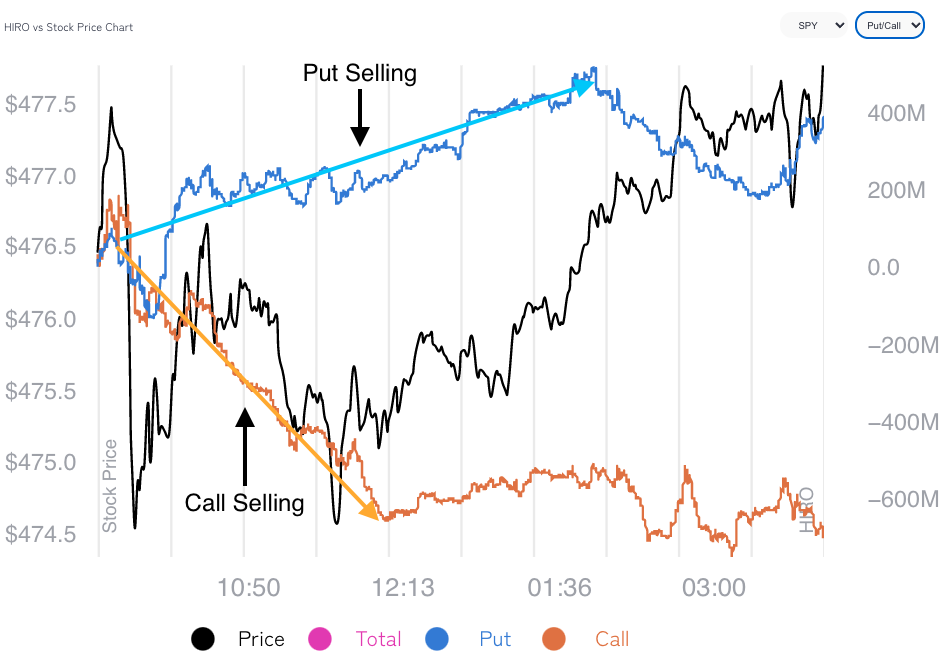
Participants’ activity in shorter-dated tenors (as evidenced by the compression of VIX term structure mainly at the front-end) where options are more so sensitive to changes in the underlying price, time, and volatility, is promoting choppy (but bullish) price action, for now.
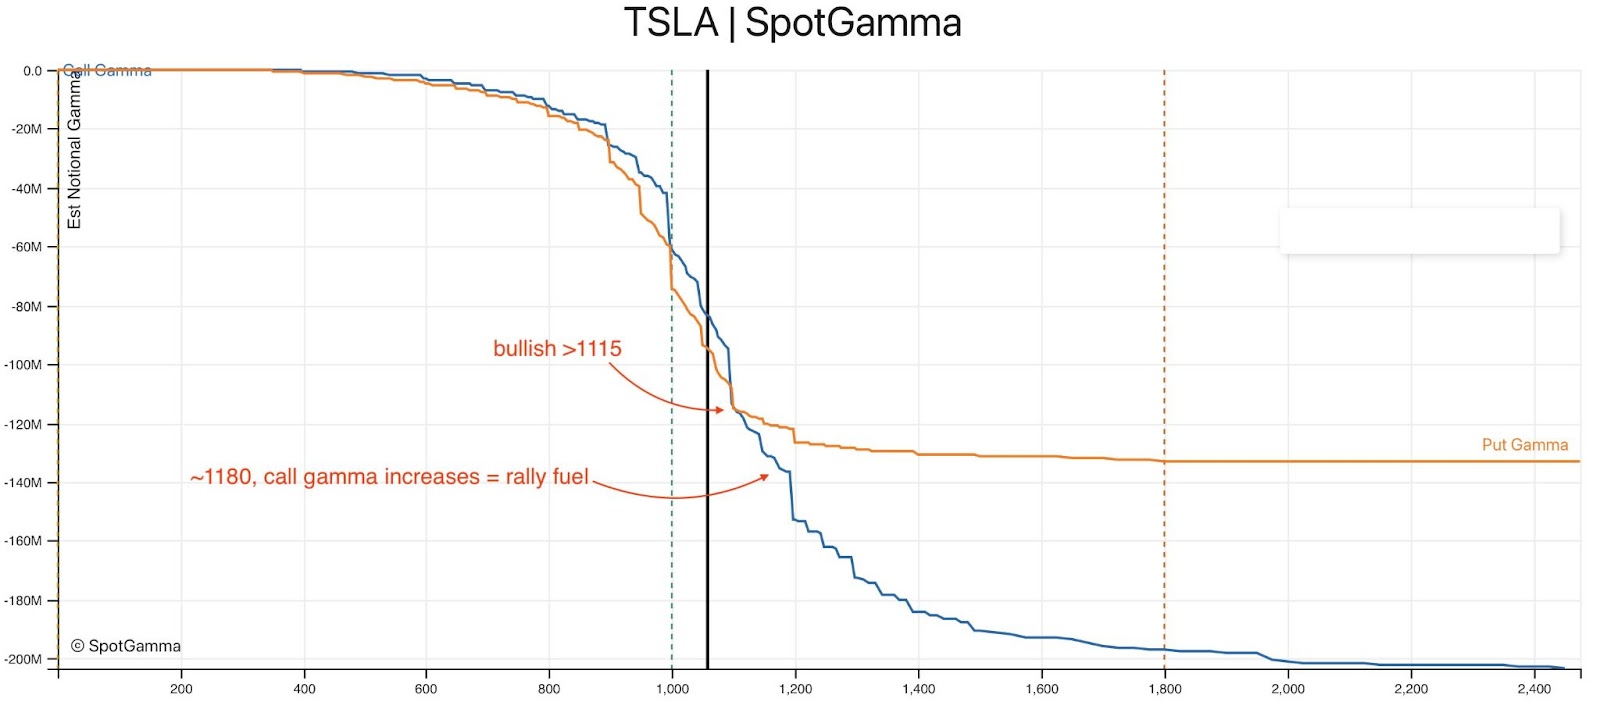
With bullish activity in single stocks like Tesla Inc (which was primed for an options-driven squeeze heading into Monday) feeding into S&P positioning, alongside the removal of hedges to positioning that was pressuring stocks and indices heading into Friday OPEX, and passive buying support, there’s potentially more room for higher, to put it simply.
In the end, the concern is whether this bullishness leaves participants reaching for downside (put) protection, later. This would have destabilizing implications, as Sidial alluded to earlier.
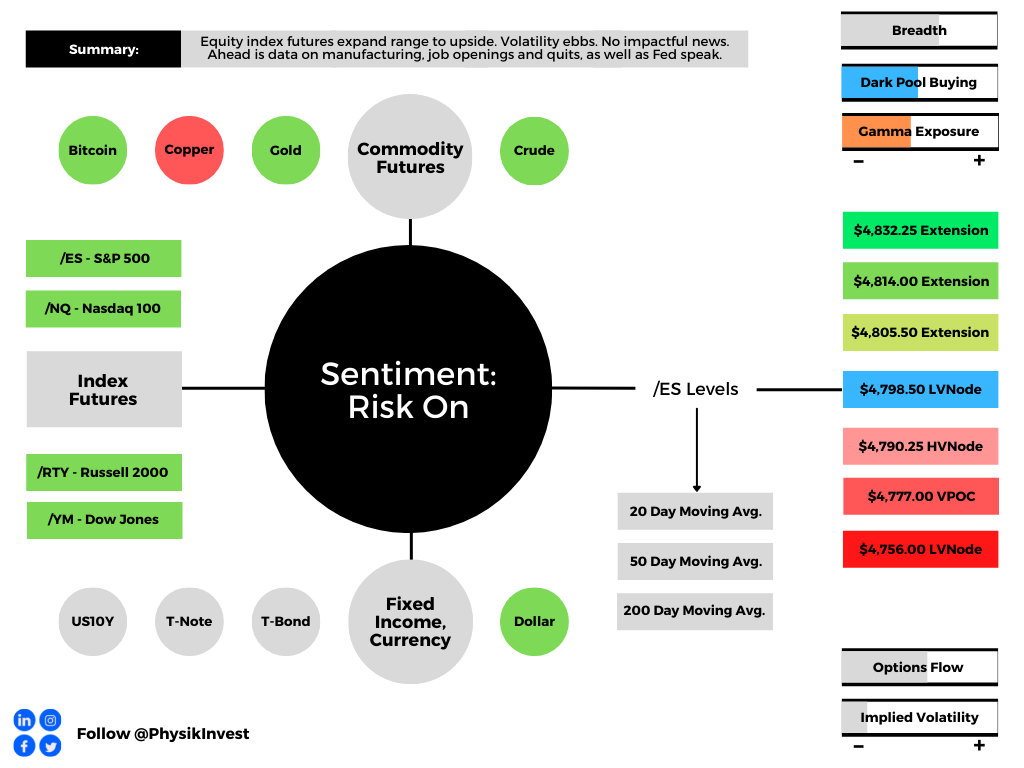
Expectations: As of 6:30 AM ET, Tuesday’s regular session (9:30 AM – 4:00 PM ET), in the S&P 500, will likely open in the upper part of a positively skewed overnight inventory, outside of prior-range and -value, suggesting a potential for immediate directional opportunity.
Balance-Break + Gap Scenarios: A change in the market (i.e., the transition from two-time frame trade, or balance, to one-time frame trade, or trend) is occurring.

Monitor for acceptance (i.e., more than 1-hour of trade) outside of the balance area.

Leaving value behind on a gap-fill or failing to fill a gap (i.e., remaining outside of the prior session’s range) is a go-with indicator.

Rejection (i.e., return inside of balance) portends a move to the opposite end of the balance.
In the best case, the S&P 500 trades higher; activity above the $4,798.50 low volume area (LVNode) puts in play the $4,805.50 extension. Initiative trade beyond the $4,805.50 could reach as high as the $4,814.00 and $4,832.25 extension, or higher.
In the worst case, the S&P 500 trades lower; activity below the $4,798.50 LVNode puts in play the $4,790.25 high volume area (HVNode). Initiative trade beyond the HVNode could reach as low as the $4,777.00 untested point of control (VPOC) and $4,756.00 LVNode, or lower.
Click here to load today’s key levels into the web-based TradingView charting platform. Note that all levels are derived using the 65-minute timeframe. New links are produced, daily.

Definitions
Volume Areas: A structurally sound market will build on areas of high volume (HVNodes). Should the market trend for long periods of time, it will lack sound structure, identified as low volume areas (LVNodes). LVNodes denote directional conviction and ought to offer support on any test.
If participants were to auction and find acceptance into areas of prior low volume (LVNodes), then future discovery ought to be volatile and quick as participants look to HVNodes for favorable entry or exit.
Gamma: Gamma is the sensitivity of an option to changes in the underlying price. Dealers that take the other side of options trades hedge their exposure to risk by buying and selling the underlying. When dealers are short-gamma, they hedge by buying into strength and selling into weakness. When dealers are long-gamma, they hedge by selling into strength and buying into weakness. The former exacerbates volatility. The latter calms volatility.
Vanna: The rate at which the delta of an option changes with respect to volatility.
Charm: The rate at which the delta of an option changes with respect to time.
POCs: POCs are valuable as they denote areas where two-sided trade was most prevalent in a prior day session. Participants will respond to future tests of value as they offer favorable entry and exit.
Options Expiration (OPEX): Traditionally, option expiries mark an end to pinning (i.e, the theory that market makers and institutions short options move stocks to the point where the greatest dollar value of contracts will expire) and the reduction dealer gamma exposure.
Volume-Weighted Average Prices (VWAPs): A metric highly regarded by chief investment officers, among other participants, for quality of trade. Additionally, liquidity algorithms are benchmarked and programmed to buy and sell around VWAPs.
Rates: Low rates have to potential to increase the present value of future earnings making stocks, especially those that are high growth, more attractive. To note, inflation and rates move inversely to each other. Low rates stimulate demand for loans (i.e., borrowing money is more attractive).
About
After years of self-education, strategy development, mentorship, and trial-and-error, Renato Leonard Capelj began trading full-time and founded Physik Invest to detail his methods, research, and performance in the markets.
Capelj is also a Benzinga finance and technology reporter interviewing the likes of Shark Tank’s Kevin O’Leary, JC2 Ventures’ John Chambers, FTX’s Sam Bankman-Fried, and ARK Invest’s Catherine Wood, as well as a SpotGamma contributor developing insights around impactful options market dynamics.
Disclaimer
At this time, Physik Invest does not carry the right to provide advice.
In no way should the materials herein be construed as advice. Derivatives carry a substantial risk of loss. All content is for informational purposes only.