
The daily brief is a free glimpse into the prevailing fundamental and technical drivers of U.S. equity market products. Join the 750+ that read this report daily, below!
Fundamental
Pardon the light read, today!
Jefferies Financial Group Inc (NYSE: JEF) analyses suggest that after the S&P 500’s nearly two standard deviation rally, outcomes are quite large in both directions.
However, “when the six-month performance into the rally is negative, there is a much greater chance of negative outcomes,” The Market Ear summarizes.
What is bolstering this relief rally?
This relief is the product of a “knee-jerk re-leveraging flow,” as explained by some, bolstered by a “cohort of quantitative-based investment strategies [buying] equities when volatility is lower.”
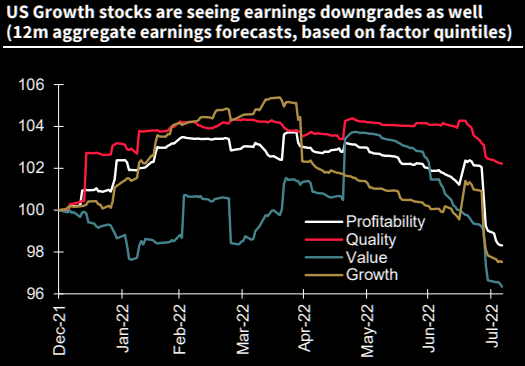
From hereon, some, like JPMorgan Chase & Co (NYSE: JPM) strategists, see equities rising on “robust corporate earnings [and] … better-than-feared economic data,” all the while others, from Morgan Stanley (NYSE: MS) and Goldman Sachs Group Inc (NYSE: GS), don’t see corporate profit margins expanding into 2023 because of “sticky cost pressures and receding demand.”
That said, however, MS explains said that “the next leg lower may have to wait until September when [their] negative operating leverage thesis is more reflected in earnings estimates.”
The outlooks by corporates are far more positive, though, it appears.
Tesla Inc (NASDAQ: TSLA) CEO Elon Musk explained the trend in commodity prices is down, “which suggests we are past peak inflation.” This is as Loews Corporation (NYSE: L) CEO Jim Tisch says that the “significant reduction in inflation in the coming 6 to 12 months” should help avoid a “truly damaging wage-price inflation spiral that was so problematic in the 1970s.”
Full employment, healing supply chains, and easier consumer spending is among the factors balancing commitments to tighten and, potentially, put the economy on an “L” trajectory (i.e., drop and flatline for a period), as explained in our August 3 letter.

Positioning
As of 6:35 AM ET, Tuesday’s expected volatility, via the Cboe Volatility Index (INDEX: VIX), sits at ~1.14%. Net gamma exposures decreasing may promote larger trading ranges.
Given the market environment, read the August 5 letter for an in-depth take on how to position for the next move higher or lower, while lowering costs (and potential losses), if wrong.
Technical
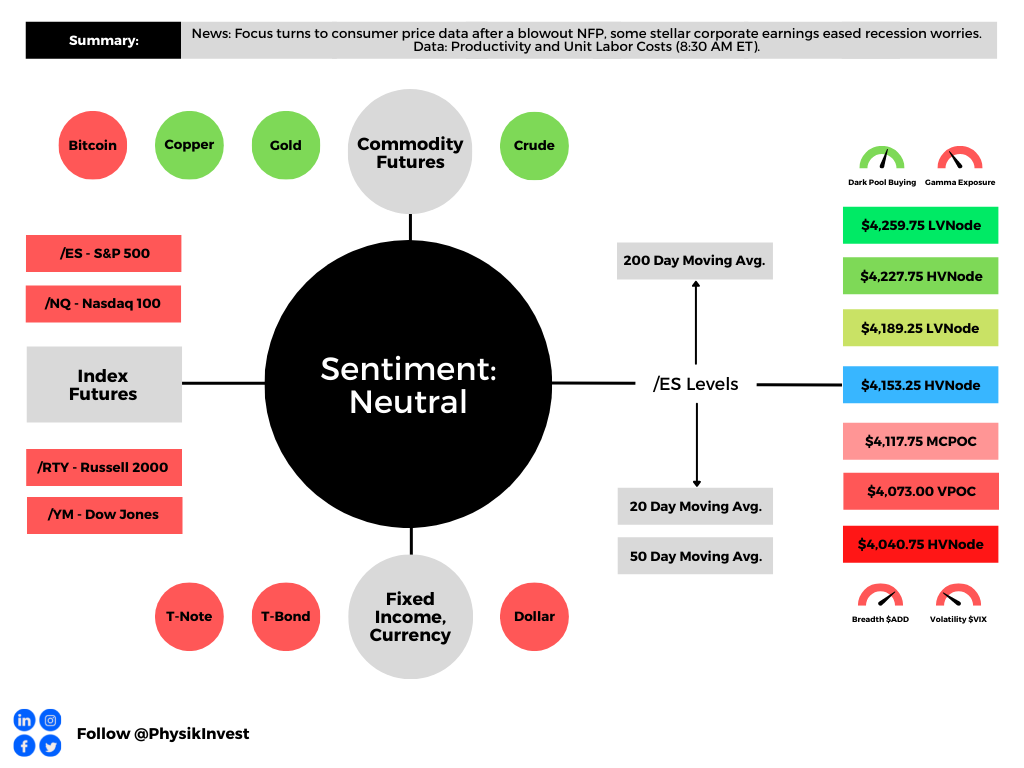
As of 6:25 AM ET, Tuesday’s regular session (9:30 AM – 4:00 PM ET), in the S&P 500, is likely to open in the lower part of a negatively skewed overnight inventory, inside of prior-range and -value, suggesting a limited potential for immediate directional opportunity.
In the best case, the S&P 500 trades higher.
Any activity above the $4,153.25 HVNode puts into play the $4,189.25 LVNode. Initiative trade beyond the LVNode could reach as high as the $4,227.75 HVNode and $4,259.75 LVNode, or higher.
In the worst case, the S&P 500 trades lower.
Any activity below the $4,153.25 HVNode puts into play the $4,117.75 MCPOC. Initiative trade beyond the MCPOC could reach as low as the $4,073.00 VPOC and $4,040.75 HVNode, or lower.
Click here to load today’s key levels into the web-based TradingView charting platform. Note that all levels are derived using the 65-minute timeframe. New links are produced, daily.

Considerations: Responsiveness near key-technical areas (that are discernable visually on a chart), suggests technically-driven traders with short time horizons are very active.
Such traders often lack the wherewithal to defend retests and, additionally, the type of trade may be indicative of the other time frame participants waiting for more information to initiate trades.
Definitions
Volume Areas: A structurally sound market will build on areas of high volume (HVNodes). Should the market trend for long periods of time, it will lack sound structure, identified as low volume areas (LVNodes). LVNodes denote directional conviction and ought to offer support on any test.
If participants were to auction and find acceptance into areas of prior low volume (LVNodes), then future discovery ought to be volatile and quick as participants look to HVNodes for favorable entry or exit.
POCs: POCs are valuable as they denote areas where two-sided trade was most prevalent in a prior day session. Participants will respond to future tests of value as they offer favorable entry and exit.
MCPOCs: POCs are valuable as they denote areas where two-sided trade was most prevalent over numerous day sessions. Participants will respond to future tests of value as they offer favorable entry and exit.
Volume-Weighted Average Prices (VWAPs): A metric highly regarded by chief investment officers, among other participants, for quality of trade. Additionally, liquidity algorithms are benchmarked and programmed to buy and sell around VWAPs.
About
After years of self-education, strategy development, mentorship, and trial-and-error, Renato Leonard Capelj began trading full-time and founded Physik Invest to detail his methods, research, and performance in the markets.
Capelj also develops insights around impactful options market dynamics at SpotGamma and is a Benzinga reporter.
Some of his works include conversations with ARK Invest’s Catherine Wood, investors Kevin O’Leary and John Chambers, FTX’s Sam Bankman-Fried, ex-Bridgewater Associate Andy Constan, Kai Volatility’s Cem Karsan, The Ambrus Group’s Kris Sidial, among many others.
Disclaimer
In no way should the materials herein be construed as advice. Derivatives carry a substantial risk of loss. All content is for informational purposes only.


