Big news includes Netflix Inc (NASDAQ: NFLX) beating earnings estimates but having a weaker-than-expected forecast, Tesla Inc (NASDAQ: TSLA) cutting prices the sixth time this year, Meta Platforms Inc (NASDAQ: META) and Walt Disney Co (NYSE: DIS) commencing layoffs, and mortgage rates edging higher to ~6.4%.
Graphic: Retrieved from Bloomberg. “US mortgage rates increased last week by the most in two months to 6.43%, denting already sluggish demand.”
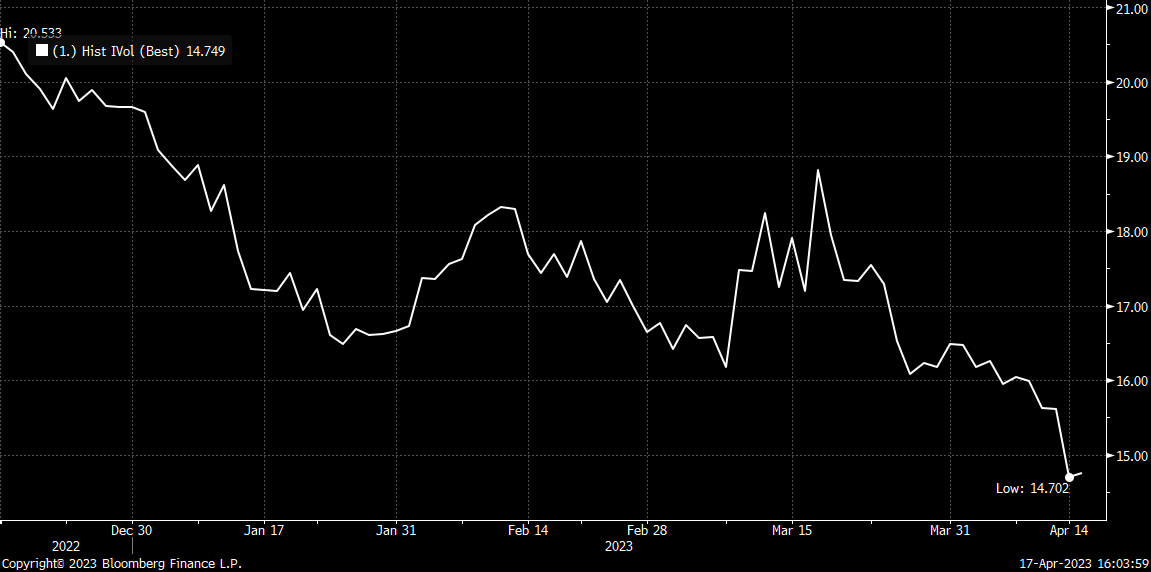
Equity markets are down, and equity implied volatility (IVOL) measures, including the Cboe Volatility Index or VIX, are climbing. Notwithstanding, the trend lower in IVOL is intact, and that’s good for traders biased short volatility.
Graphic: Retrieved from Bloomberg via Danny Kirsch of Piper Sandler Companies (NYSE: PIPR). Call option volatility for the $4,150.00 strike. May monthly expiration.
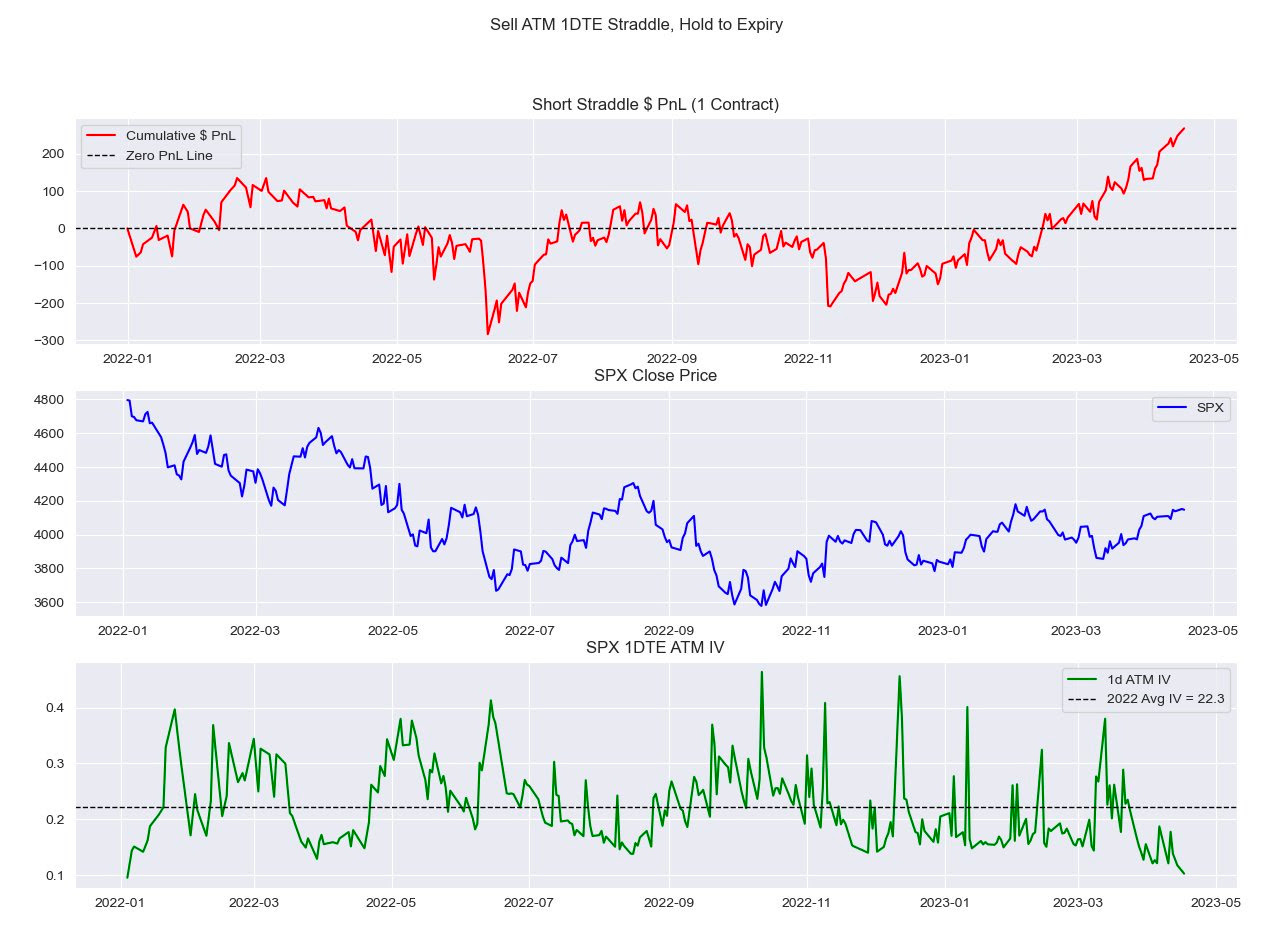
“With all the focus [on S&P 500 (INDEX: SPX)] 0 DTE lately, I look at how expensive these have been since 2022,” IPS Strategic Capital’s Pat Hennessy says, referencing a backtest he conducted selling a 1 DTE straddle and holding till maturity.
“Performance since the November CPI has been stellar, with a 63% win rate and an average gain of $20.00.”
Graphic: Retrieved from IPS Strategic Capital’s Pat Hennessy.
Volatility trader Darrin John agrees, noting volatility remains expensive, a detriment to those who may be biased long volatility.
“The VRP is so wide across all of the tenors I track,” John elaborates. “It’s going to be hard for gamma buyers to cover daily theta bills.”
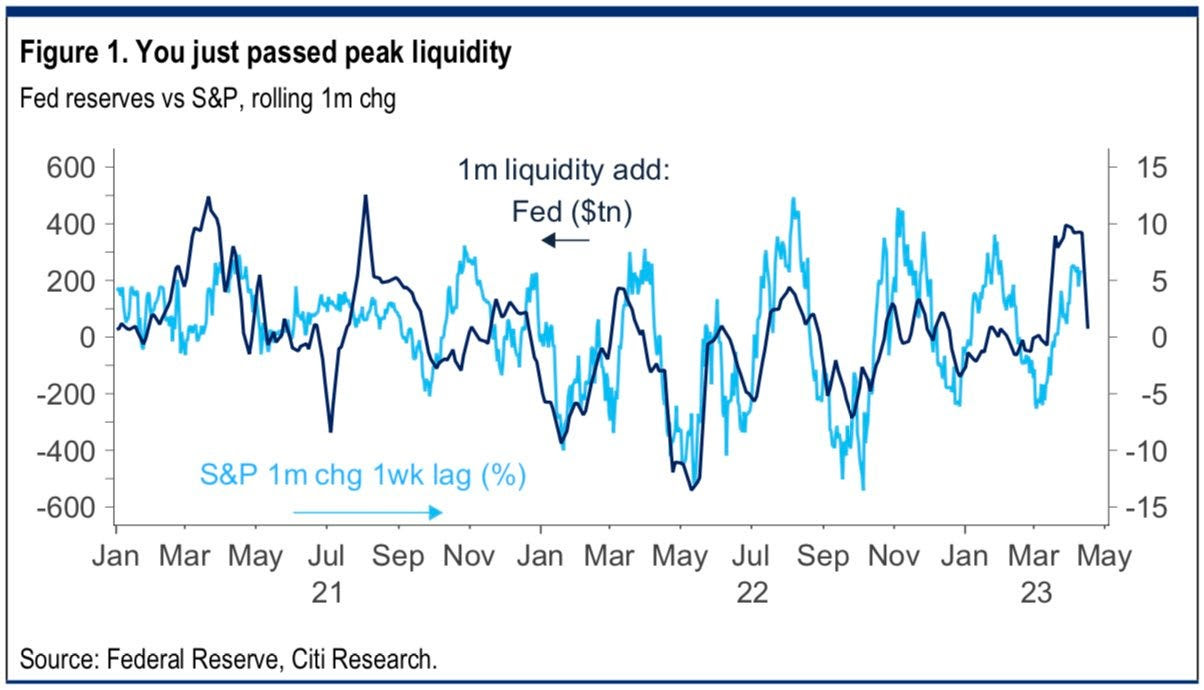
Clouds are appearing on the horizon, however, and the trend higher (lower) in stocks (volatility) may not last. Bloomberg forecasts the largest fall in SPX earnings since the start of 2020. Notwithstanding, strength can continue for longer …
Graphic: Retrieved from Citigroup Inc Research (NYSE: C) via @tr8derz. “YTD rally stems from $1tn in CB liquidity. High-frequency indicators suggest this is already stalling, and coming weeks seem increasingly likely to bring a sharp reversal. Higher TGA and RRP, ECB QT and reduced China easing could easily see a net drain of some $6-800bn.”
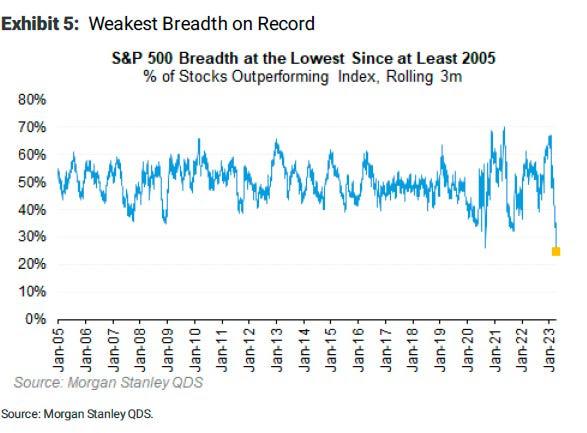
… even with the SPX breadth reading poor. The SPX has rallied with multiples rising; strength came with positive earnings surprises, bond demand, and other things.
Graphic: Retrieved from Morgan Stanley (NYSE: MS) via Bloomberg.
Hence, at the risk of sounding like a broken record, the low-cost call structures we’ve talked about in the past remain attractive.
If markets move higher, you can monetize and roll profits into put spreads (i.e., buy put and sell another at a lower strike). This may work well if JPMorgan Chase & Co’s (NYSE: JPM) call that “even a mild recession would warrant retesting the previous lows” is realized.
Such structures work well as “a big pop in the market can result in a decent drop in the VIX…and vice versa, a market sell-off will result in a greater increase in the VIX now than it did in 2022,” says Alpha Exchange.
Alternatively, lean neutral and buy into cash or bonds yielding 4-5%. Some long box spreads yield 5.4% as of yesterday’s close.
In other news, Physik Invest’s first in-depth note is nearing completion and will be available for public viewing in short order. Take care and watch your risk!
About
Welcome to the Daily Brief by Physik Invest, a soon-to-launch research, consulting, trading, and asset management solutions provider. Learn about our origin story here, and consider subscribing for daily updates on the critical contexts that could lend to future market movement.
Separately, please don’t use this free letter as advice; all content is for informational purposes, and derivatives carry a substantial risk of loss. At this time, Capelj and Physik Invest, non-professional advisors, will never solicit others for capital or collect fees and disbursements. Separately, you may view this letter’s content calendar at this link.
Physik Invest’s Daily Brief is read free by thousands of subscribers. Join this community to learn about the fundamental and technical drivers of markets.
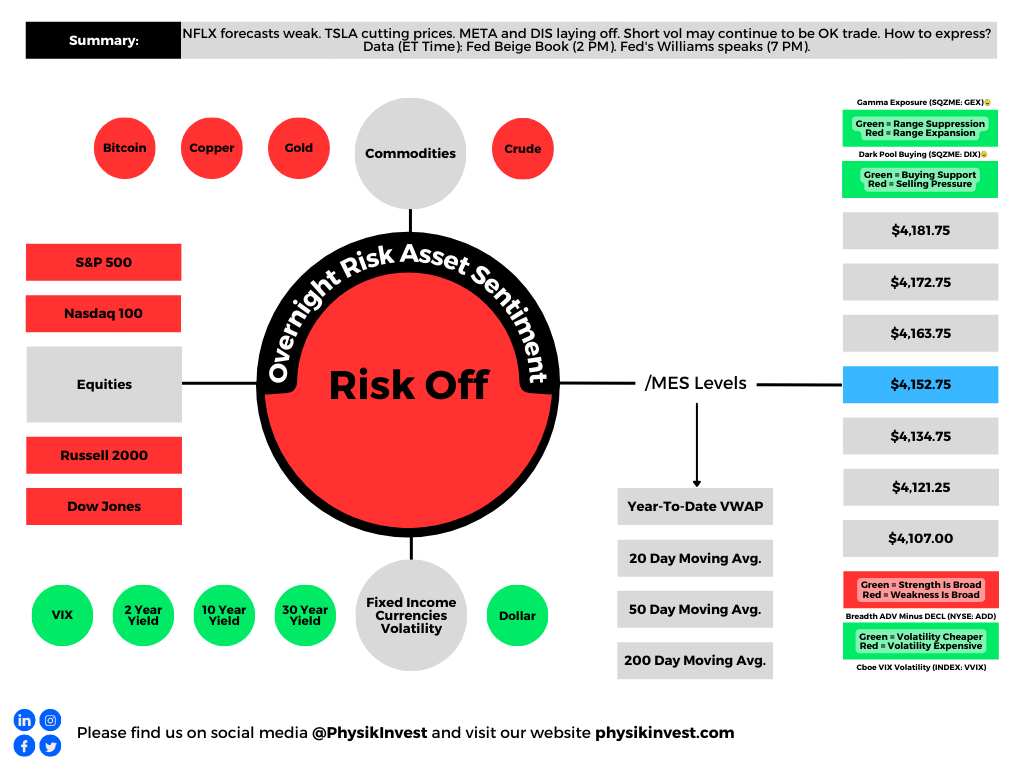
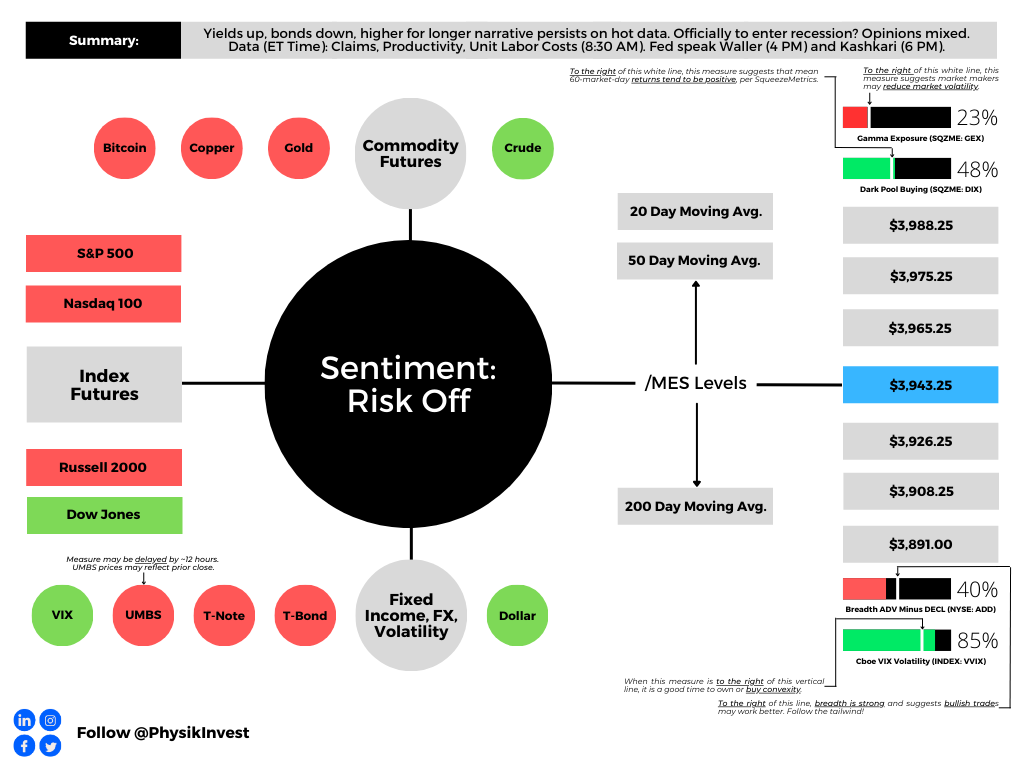
Graphic updated 6:15 AM ET. Sentiment Risk-Off if expected /MES open is below the prior day’s range. /MES levels are derived from the profile graphic at the bottom of this letter. Click here for the latest levels. SqueezeMetrics Dark Pool Index (DIX) and Gamma (GEX) with the latter calculated based on where the prior day’s reading falls with respect to the MAX and MIN of all occurrences available. A higher DIX is bullish. The lower the GEX, the more (expected) volatility. Click to learn the implications of volatility, direction, and moneyness. Breadth reflects a reading of the prior day’s NYSE Advance/Decline indicator. The CBOE VIX Volatility Index (INDEX: VVIX) reflects the attractiveness of owning volatility. UMBS prices via MND. Click here for the economic calendar.
Fundamental
A tight monetary environment resulted in a hesitation to take risks. With inflation high, in the face of exogenous events (e.g., geopolitics disrupting deflationary influences) and beyond, assets were sold.
With inflation still hot and the economy on solid footing (i.e., “stronger growth for longer” per Unlimited’s Bruce McNevin), traders price even “tighter monetary policy and a harder eventual landing to ease inflation pressure.” This is not good for assets.
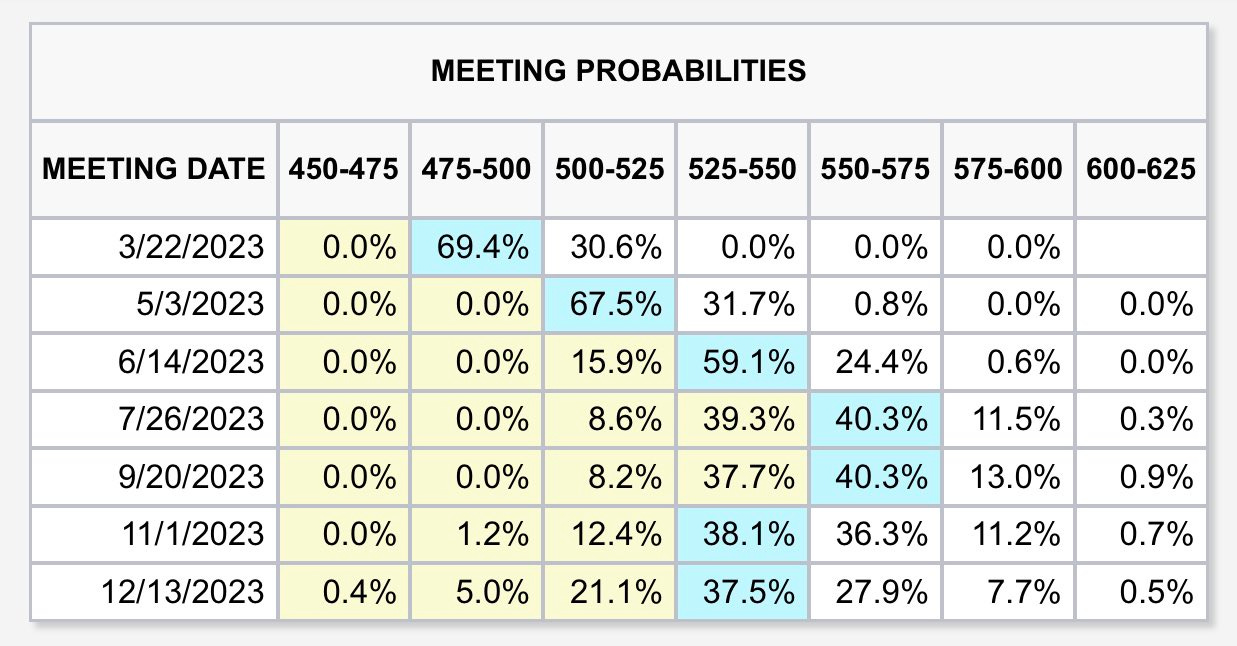
In fact, for a moment yesterday, traders put the terminal rate at 5.50-5.75%, up from 5.25-5.50% prior to the market opening.
Graphic: Retrieved from CME Group Inc’s (NASDAQ: CME) via The Kobeissi Letter on March 1, 2023, at 10:55 AM.
For the Federal Reserve (Fed) to hit its inflation target, likely in the range of 2-4% per Oaktree Capital Management’s Howard Marks said the real Fed Funds rate has to be positive. This effort puts the economy at risk of recession, said the Federal Reserve’s Neel Kashkari.
“Typically when the Fed raises rates to cool down inflation, it leads to a recession,” Kashkari explained, adding that “getting inflation down is job number one.”
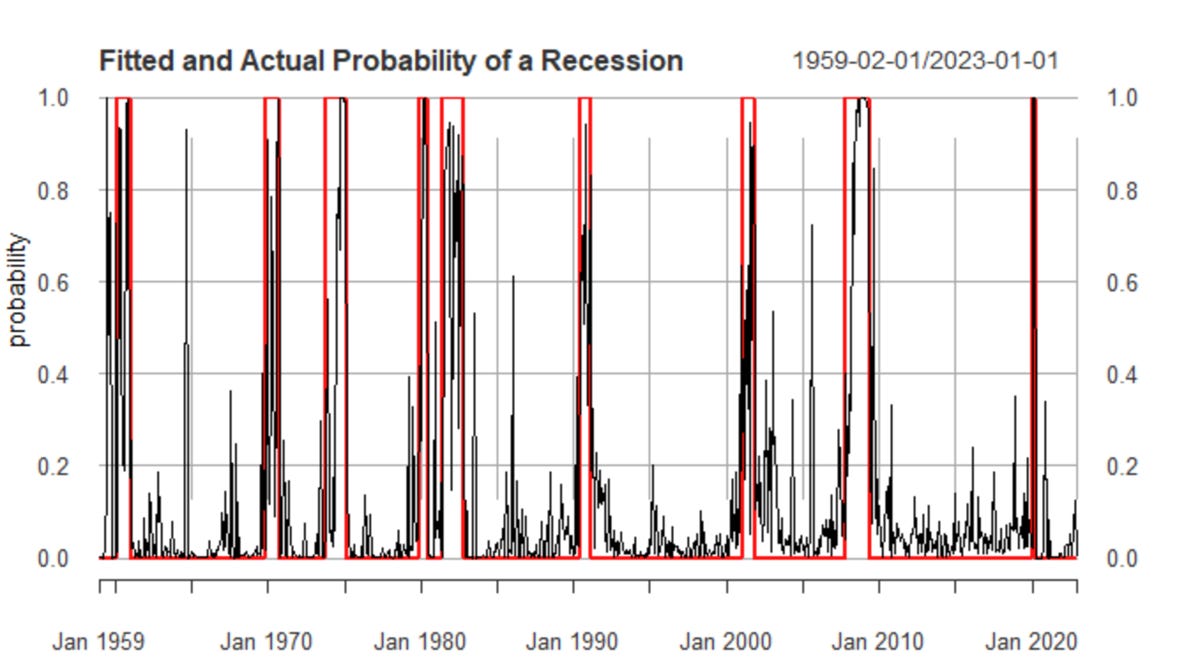
Per Unlimited’s McNevin, the probability the economy is in a recession is lower than it was at the end of last year. For probabilities to change, there would have to be a large increase in unemployment. For instance, if the unemployment rate rises by about 1%, recession odds go up by 29%. If non-farm payroll employment falls by about 2% or 3 million jobs, recession odds jump by 74%.
Per last month’s remarks by Kai Volatility’s Cem Karsan, quoted in Physik Invest’s Daily Brief for February 17, 2023, if the market was to not breakdown sharply after February monthly options expiration (OpEx), as we see today, then options decay could build a platform for a FOMO-driven call buying rally that ends in a blow-off.
Consequently, trades this letter put forth last month (e.g., call verticals sold to finance put verticals expiring months from now) would suffer greatly.
“We’ve had an intraday range of 33.5 [points] thus far. That’s not vol[atility] expansion, which is what I’d want to see if I was short,” volatility trader Darrin John put well. “If the market doesn’t do what you think it should, in a reasonable amount of time, then it’s best to [exit].”
At the same time, with portfolio constructions like 60/40 not as attractive in this macroeconomic environment (i.e., asset headwind from monetary tightening, as well as slowing growth and inflation headwind to bonds and commodities), traders can look to Physik Invest’s Daily Brief for February 28, 2023, for ideas on how to navigate. In that letter, we talked about how traders can participate in the upside by about the same amount they would with a traditional construction (e.g., 60/40) while eliminating their downside risk exposure.
For instance, one can buy enough bonds/box spreads so that, at their maturity, the principal is returned. The cash remaining can be invested in leverage potential.
Ending with a supporting quote from Oaktree’s Howard Marks: “Investors can now potentially get solid returns from credit instruments, meaning they no longer have to rely as heavily on riskier investments to achieve their overall return targets.”
Technical
As of 6:00 AM ET, Thursday’s regular session (9:30 AM – 4:00 PM ET), in the S&P 500, is likely to open in the middle part of a negatively skewed overnight inventory, outside of the prior day’s range, suggesting a potential for immediate directional opportunity.
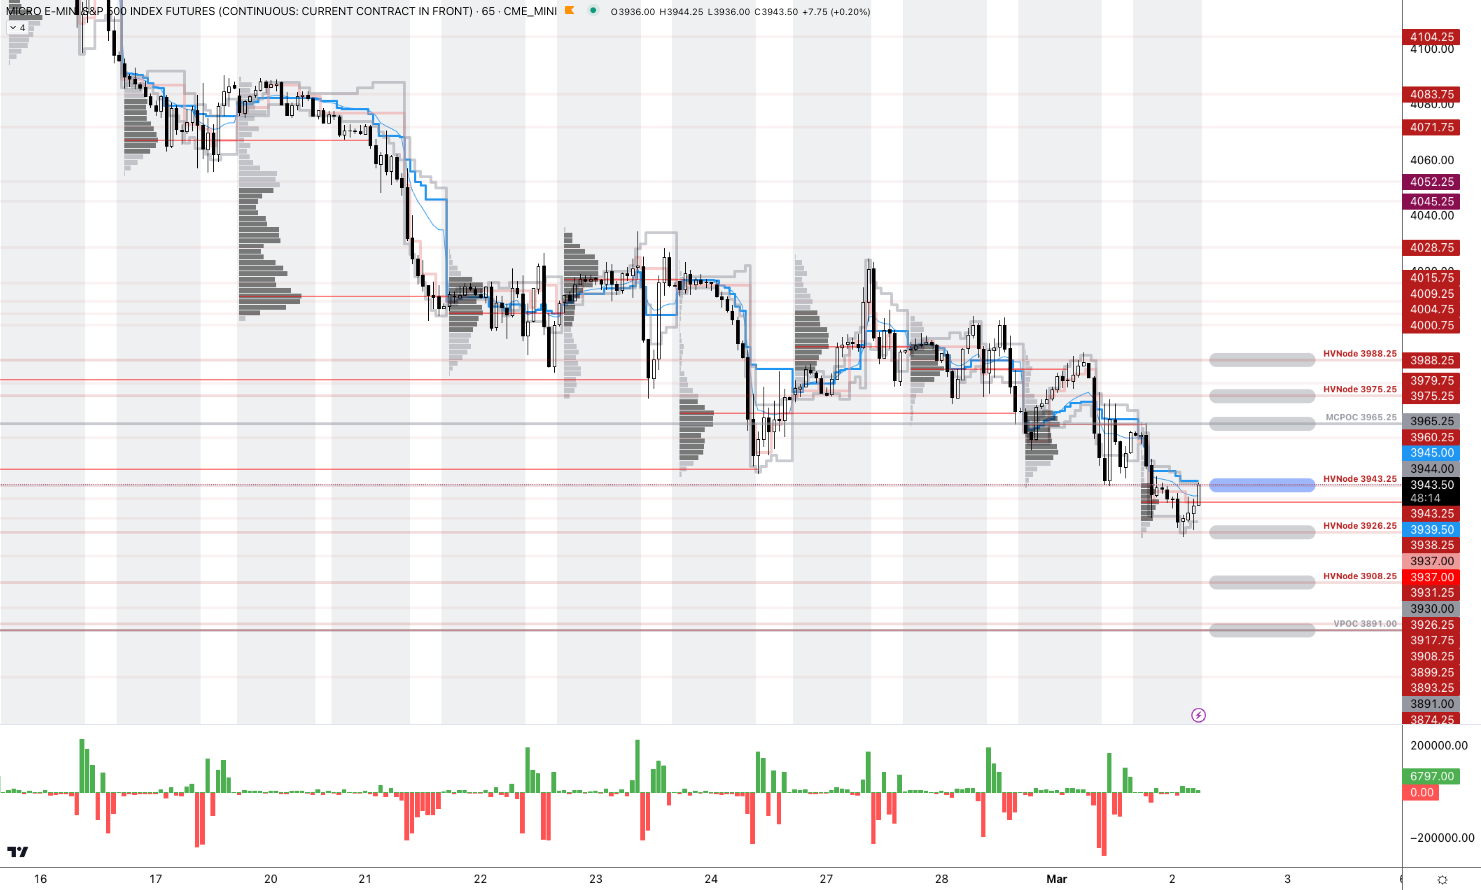
The S&P 500 pivot for today is $3,943.25.
Key levels to the upside include $3,965.25, $3,975.25, and $3,988.25.
Key levels to the downside include $3,926.25, $3,908.25, and $3,891.00.
Disclaimer: Click here to load the updated key levels via the web-based TradingView platform. New links are produced daily. Quoted levels likely hold barring an exogenous development.
Graphic: 65-minute profile chart of the Micro E-mini S&P 500 Futures.
Definitions
Volume Areas: Markets will build on areas of high-volume (HVNodes). Should the market trend for a period of time, this will be identified by a low-volume area (LVNodes). The LVNodes denote directional conviction and ought to offer support on any test.
If participants auction and find acceptance in an area of a prior LVNode, then future discovery ought to be volatile and quick as participants look to the nearest HVNodes for more favorable entry or exit.
MCPOCs: Denote areas where two-sided trade was most prevalent over numerous sessions. Participants will respond to future tests of value as they offer favorable entry and exit.
POCs: Areas where two-sided trade was most prevalent in a prior day session. Participants will respond to future tests of value as they offer favorable entry and exit.
Options Expiration (OPEX): Reduction in dealer Gamma exposure. There is usually an increase in volatility after the removal of large options positions and associated hedging.
About
The author, Renato Leonard Capelj, spends the bulk of his time at Physik Invest, an entity through which he invests and publishes free daily analyses to thousands of subscribers. The analyses offer him and his subscribers a way to stay on the right side of the market.
You may view this letter’s content calendar at this link.
Disclaimer
Do not construe this newsletter as advice. All content is for informational purposes. Capelj and Physik Invest manage their own capital and will not solicit others for it.
Physik Invest’s Daily Brief is read by thousands of subscribers. You, too, can join this community to learn about the fundamental and technical drivers of markets.
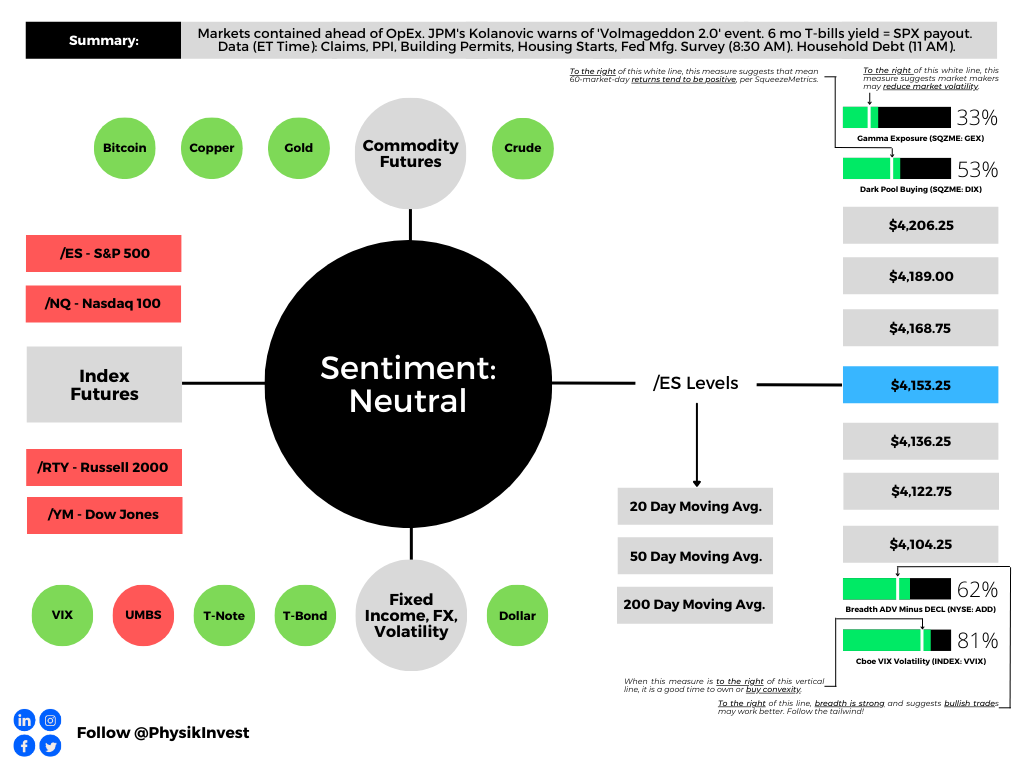
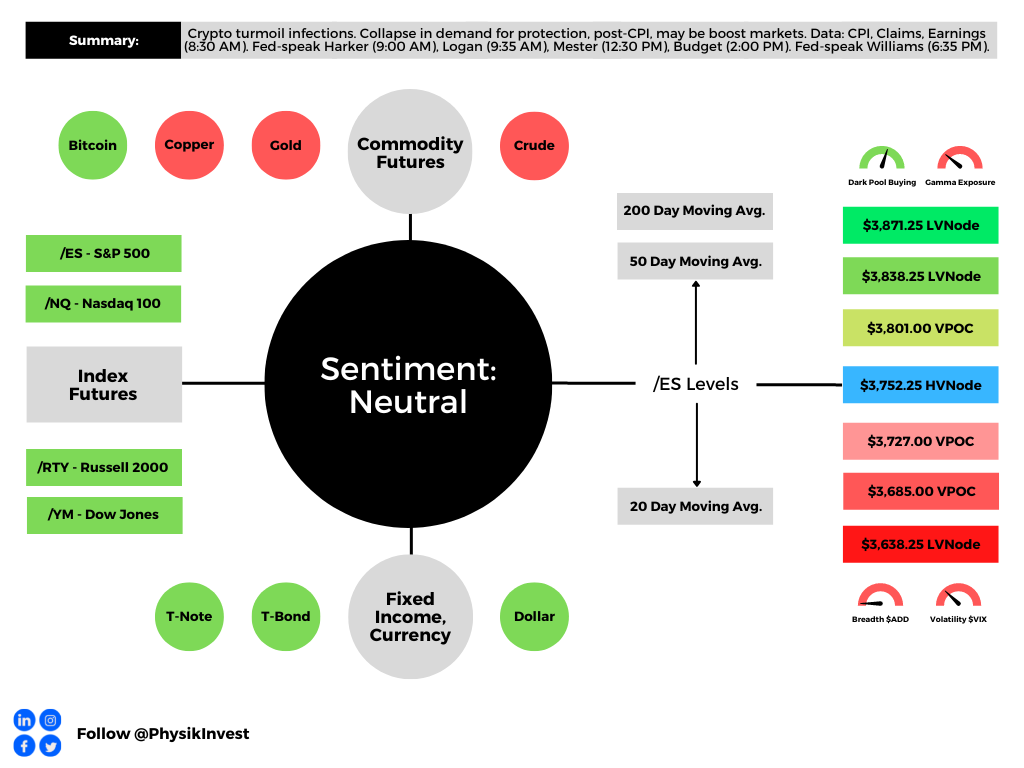
Graphic updated 6:15 AM ET. Sentiment Neutral if expected /ES open is inside of the prior day’s range. /ES levels are derived from the profile graphic at the bottom of this letter. Click here for the latest levels. SqueezeMetrics Dark Pool Index (DIX) and Gamma (GEX) with the latter calculated based on where the prior day’s reading falls with respect to the MAX and MIN of all occurrences available. A higher DIX is bullish. At the same time, the lower the GEX, the more (expected) volatility. Click to learn the implications of volatility, direction, and moneyness. Breadth reflects a reading of the prior day’s NYSE Advance/Decline indicator. The CBOE VIX Volatility Index (INDEX: VVIX) reflects the attractiveness of owning volatility. UMBS price via MND. Click here for the calendar.
Positioning
In the news is quite a bit of noise surrounding ultra-short-dated options with little time to expiry. To quote Nomura Holdings Inc’s (NYSE: NMR) Charlie McElligott, the trading of these options is adding noise; “US equities are such an untradable mess right now.”
However, your letter writer, who mainly trades complex spreads on the cash-settled indexes, thinks there has never been a better time to trade. Ultra-short-dated options enable you to express your opinion in more efficient ways. Additionally, the trade of these options, in the aggregate, can influence market movements, and this is added opportunity if you understand it.
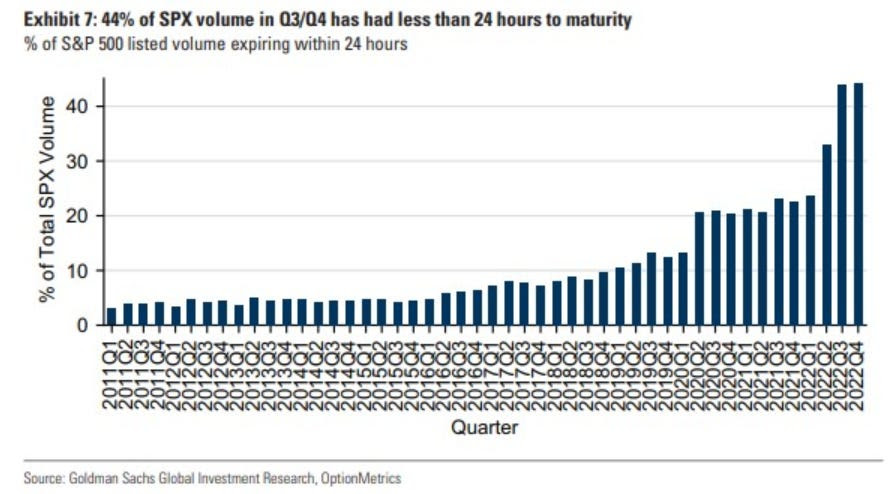
Graphic: Retrieved from Goldman Sachs Group Inc (NYSE: GS) via Bloomberg.
Darrin Johnson, a volatility trader, recently discussed sharp ways to use these options.
Heading into some big events this week, John noted S&P 500 (INDEX: SPX) implied volatility (IVOL) was trading at ~25% on a five-day straddle. Traders could buy this structure while, in the interim, selling other structures like it “against CPI, Retail Sales, and PPI” where IVOL was higher. This would enable you to lower the cost of having positive exposure to movement or positive gamma via the five-day straddle, though this is operating on the premise “that Friday’s volatility will hold mostly steady, while the other 3 deflate.”
Moreover, the ultra-short-dated options are palatable if we will, and other traders, potentially much bigger in size, are observant of this too. The growing interest in these products (e.g., in the second half of last year, ultra-short-dated options made up more than 40% of the S&P 500’s trading volume) is growing in impact on underlying products like the SPX.
In fact, JPMorgan Chase & Co’s (NYSE: JPM) Peng Cheng found these options have an impact that “can vary from a drag of as much as 0.6% to a boost of up to 1.1%.”
To explain, though as of late options counterparties may be playing a smaller role as “customers have taken equal and opposite sides” of positions, per SqueezeMetrics, we can naively look at there being a pool of liquidity to absorb the demand for these ultra-short-dated options which are very sensitive to time, price, and volatility. These increased sensitivities are hedged in a way that impacts this available pool of liquidity. If the trade or impact is large enough, it is transmitted onto underlying market prices.
For instance, consider so-called meme mania and stocks like GameStop Corporation (NYSE: GME) that rocketed as traders’ interest in short-dated options demands rose. To hedge increased demand in call options, for instance, counterparties must buy the underlying stock. This demand boosts the stock.
Likewise, if traders’ consensus is that markets won’t move much until some large macroeconomic events, then their bets against market movement (i.e., sell ultra-short-dated options) will result in counterparties having more exposure to bets on market movement (i.e., positive gamma) which they will hedge in a way that reduces market movement (i.e., buy weakness or sell strength in the underlying stock). So, if traders bet against the movement, resulting in more counterparty positive gamma, then market movement is reduced due to the reaction to this positioning.
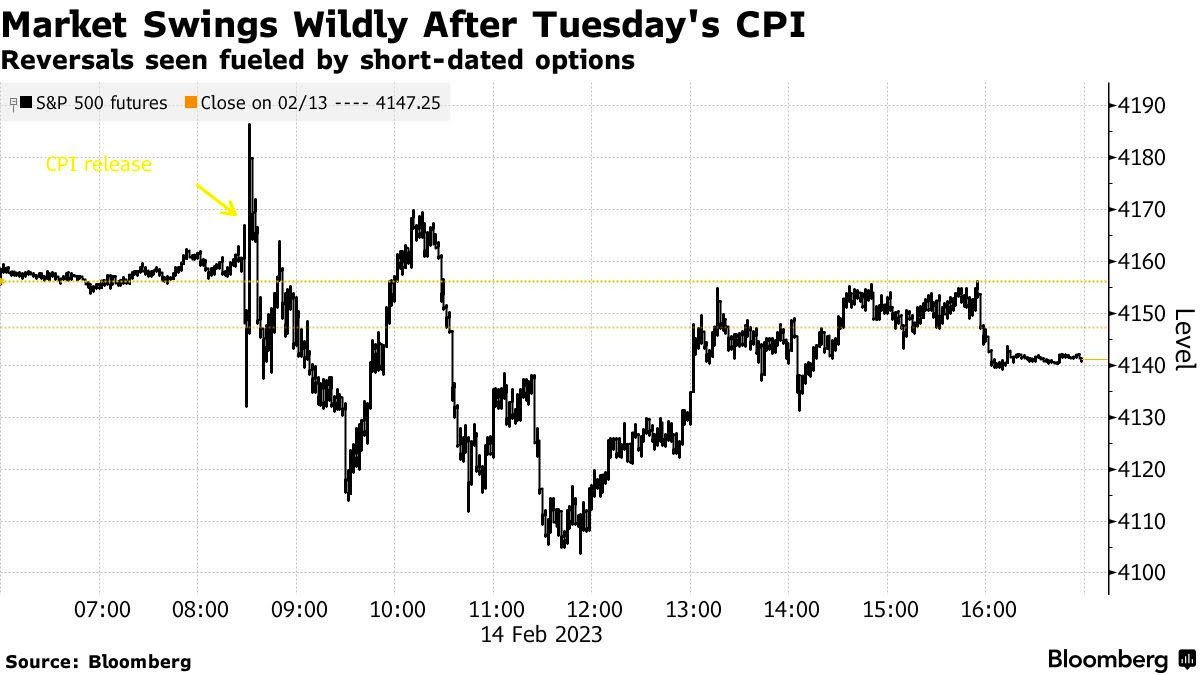
On the other hand, if traders’ consensus is that markets may move a lot, particularly to the downside, their bets on market movement (e.g., buy ultra-short-dated put) will result in counterparties having more exposure to bets against market movement (i.e., negative gamma). This demand for protection will bid options prices, particularly at the front-end of the IVOL term structure as counterparties price this demand in, and the counterparty will sell underlying to hedge. If fears are assuaged and traders no longer demand these bets on market movements, the counterparty can unwind their hedge which, in the put buying example provided, may provide a market boost, such as that which we saw immediately following the release of consumer price updates (CPI) this week; to quote Bloomberg, “[w]hen the worst didn’t happen, these hedges were unwound, helping propel a recovery in futures. It’s partly why the Cboe Volatility Index, or VIX, dropped 7% in a seemingly outsize reaction in a market when the S&P 500 ended the session basically flat.”
Additionally, the re-hedging-inspired recovery was short-lived as well; the impact of ultra-short-dated options, as this letter has stated before, is short-dated. It, too, does much less to influence measures like the Cboe Volatility Index (INDEX: VIX), a floating measure of ~30 day-to-expiry SPX options trading at a fixed-strike IVOL, though it does have an impact. Thus, the dis-interest to hedge stocks traders do not own (or hedge further stocks that may be hedged) out in time, does less to boost the VIX.
Anyways, in January, your letter writer interviewed The Ambrus Group’s co-CIO Kris Sidial about major risks to markets in 2023, as well as reasons why volatility could outperform in 2023 and beyond. Some of the information in that Benzinga interview made it into this newsletter in the days following its release.
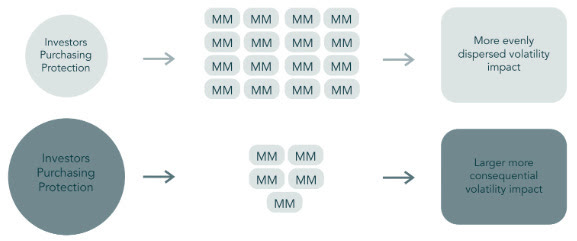
Basically, the SPX and VIX complexes are growing and, on the other side, are a small concentrated group of market makers taking on far more exposure to risk.
Graphic: Retrieved from Ambrus’ publicly available research.
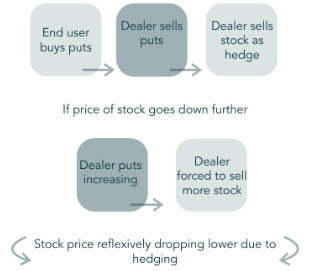
During moments of stress, as we’ve seen in the past with GME for example, options counterparties may be unable to keep up with the demands of investors, so you get a reflexive dynamic that helps push the stock higher. “That same dynamic can happen on the way down”; counterparties will mark up options prices during intense selling. As the options prices rise, options deltas (i.e., their exposure to direction) rise and this prompts so-called bearish vanna counterparty hedging flows in the underlying.
“Imagine a scenario where [some disaster happens] and everybody starts buying 0 DTE puts. That’s going to reflexively drive the S&P lower,” Sidial said. “Take, for example, the JPMorgan collar position that clearly has an effect on the market, and people are starting to understand that effect. That’s just one fund. Imagine the whole derivative ecosystem” leaning one way.
Graphic: Retrieved from Ambrus’ publicly available research.
Well, that’s what JPM’s Marko Kolanovic just said is a major risk and could exacerbate market volatility. “While history doesn’t repeat, it often rhymes,” he explained, noting that the trade of ultra-short-dated options portends a Volmageddon 2.0. If you recall, in 2018, Volmageddon 1.0 turned successful long-running short-volatility trades on their head when traders who were betting against big movements in the market saw their profits erode in days.
Further, to conclude this section since your letter writer is running short on time, as Sidial said, “if you’re trading volatility, let there be an underlying catalyst for doing so.” From a “risk-to-reward perspective, … it’s a better bet to be on the long volatility side,” given “that there are so many things that … keep popping up” from a macro perspective. Check out our letters from the past weeks where we talked about protecting profits (e.g., sell call vertical to finance and buy a put vertical with a lot of time to expiry).
For Ambrus’ publicly available research, click here. Also, follow Sidial on Twitter, here. Consider reading your letter writer’s past two conversations with Sidial, as well. Here is an article on 2021 and the meme stock debacle. Here is another article talking more about Ambrus’ processes.
Technical
As of 6:15 AM ET, Thursday’s regular session (9:30 AM – 4:00 PM ET), in the S&P 500, is likely to open in the lower part of a balanced overnight inventory, inside of the prior day’s range, suggesting a limited potential for immediate directional opportunity.
The S&P 500 pivot for today is $4,153.25.
Key levels to the upside include $4,168.75, $4,189.00, and $4,206.25.
Key levels to the downside include $4,136.25, $4,122.75, and $4,104.25.
Disclaimer: Click here to load the updated key levels via the web-based TradingView platform. New links are produced daily. Quoted levels likely hold barring an exogenous development.
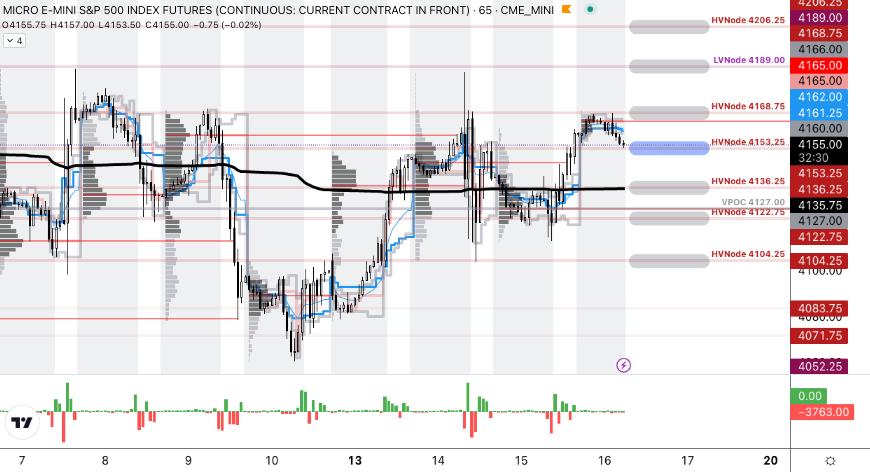
Graphic: 65-minute profile chart of the Micro E-mini S&P 500 Futures.
Definitions
Volume Areas: Markets will build on areas of high-volume (HVNodes). Should the market trend for a period of time, this will be identified by a low-volume area (LVNodes). The LVNodes denote directional conviction and ought to offer support on any test.
If participants auction and find acceptance in an area of a prior LVNode, then future discovery ought to be volatile and quick as participants look to the nearest HVNodes for more favorable entry or exit.
POCs: Areas where two-sided trade was most prevalent in a prior day session. Participants will respond to future tests of value as they offer favorable entry and exit.
About
The author, Renato Leonard Capelj, works in finance and journalism.
Capelj spends the bulk of his time at Physik Invest, an entity through which he invests and publishes free daily analyses to thousands of subscribers. The analyses offer him and his subscribers a way to stay on the right side of the market. Separately, Capelj is an options analyst at SpotGamma and an accredited journalist.
The daily brief is a free glimpse into the prevailing fundamental and technical drivers of U.S. equity market products. Join the 1,200+ that read this report daily, below!
Graphic updated 8:00 AM ET. Sentiment Neutral if expected /ES open is inside of the prior day’s range. /ES levels are derived from the profile graphic at the bottom of the following section. Levels may have changed since initially quoted; click here for the latest levels. SqueezeMetrics Dark Pool Index (DIX) and Gamma (GEX) calculations are based on where the prior day’s reading falls with respect to the MAX and MIN of all occurrences available. A higher DIX is bullish. At the same time, the lower the GEX, the more (expected) volatility. Learn the implications of volatility, direction, and moneyness. Breadth reflects a reading of the prior day’s NYSE Advance/Decline indicator. VIX reflects a current reading of the CBOE Volatility Index (INDEX: VIX) from 0-100.
Administrative
Yesterday, this letter unpacked the events surrounding recent crypto-market turmoil. There were some loose ends we will continue to clean up below and in the coming letters.
Fundamental
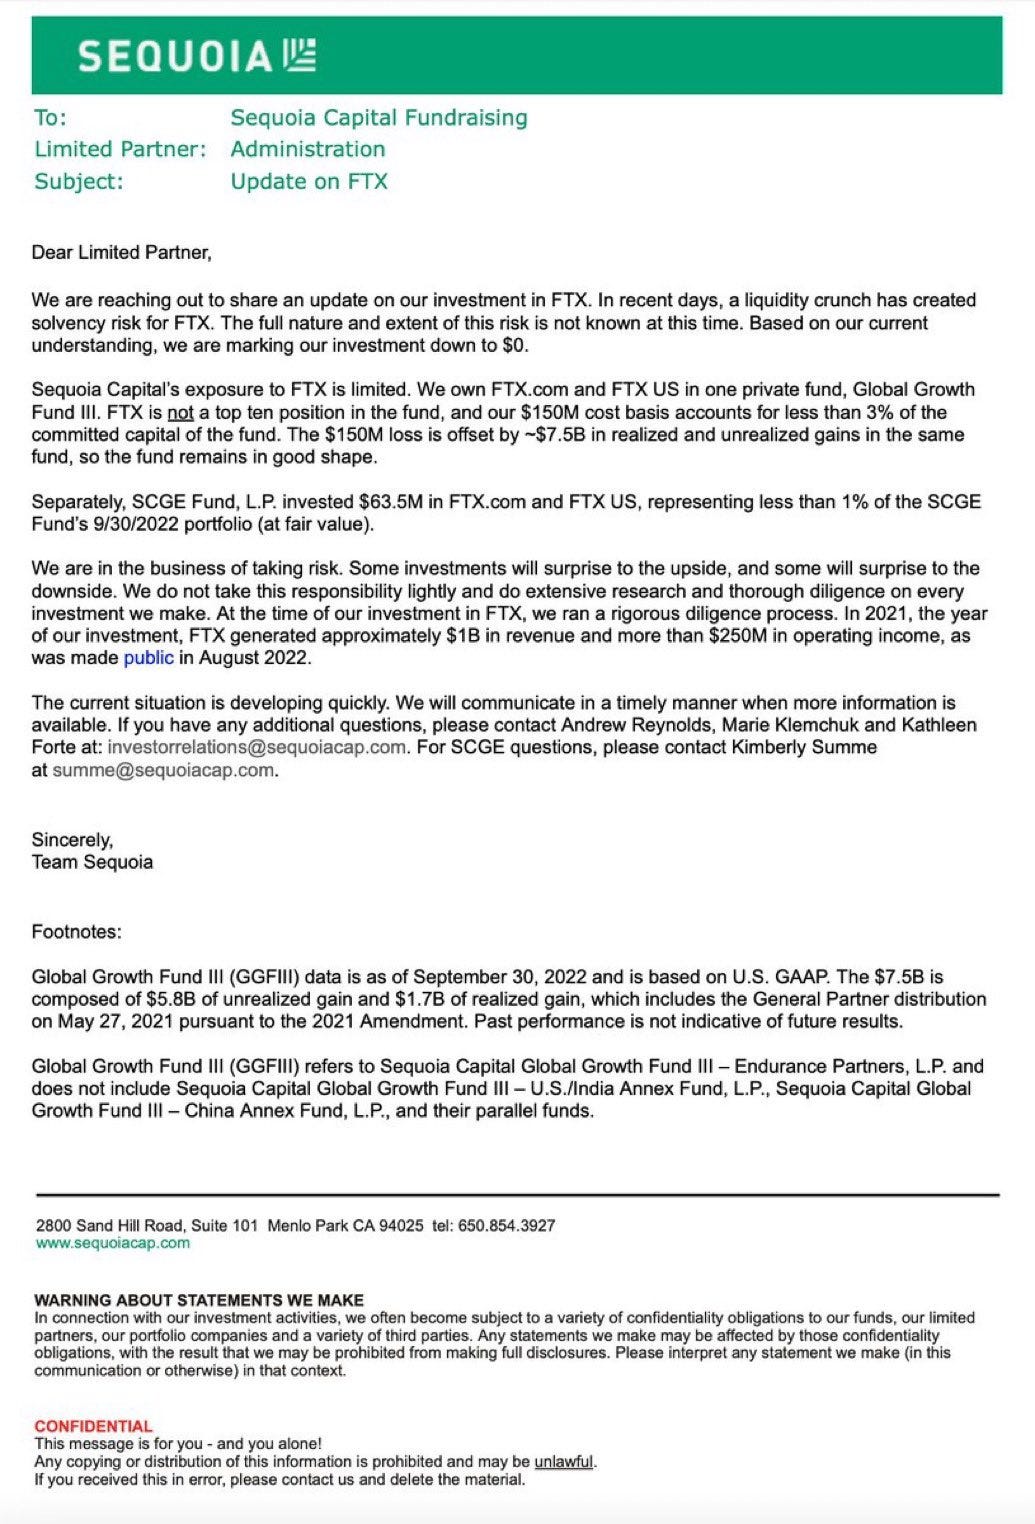
As a recap, the “seemingly untouchable” FTX.com (CRYPTO: FTT) is on a path toward bankruptcy online reports appear to show. In short, the firm has a shortfall of ~$8 billion prompting investors like Sequoia Capital to write down the full value of their investments in FTX.com and FTX.US, the latter of which owns names like Blockfolio and LedgerX, and is allegedly “unaffected by its parent company’s liquidity.”
Graphic: Retrieved from Litquidity’s Exec Sum newsletter.
It’s the case that, unlike what I was explained to by Sam Bankman-Fried (SBF), with FTX.com (not FTX.US which is required to hold customer assets 1:1) there is counterparty risk, of sorts.
As well put by Bloomberg’s Matt Levine, there’s a timing problem that’s “connected to a real economic risk.” The safety provided by “systems that automatically liquidate trades” was overwhelmed by the dangers of volatility and a simultaneous bank run.
The complicated part is as follows: “whereas the basic model of Coinbase Global Inc (NASDAQ: COIN) is ‘they buy Bitcoin (CRYPTO: BTC) for you and put it in an envelope,’ the basic model of FTX has to be ‘they lend your money to buy crypto and then make use of your crypto to get money.’ In financial terms, they … rehypothecate your collateral; you can’t expect them to just keep it in an envelope if they’re lending you the money” for leveraged trading.
Accordingly, “[t]he reason for a run on FTX is if you think that FTX loaned Alameda [Research, a trading firm also founded by SBF], a bunch of customer assets and got back FTT in exchange. If that’s the case, then a crash in the price of FTT will destabilize FTX. If you’re worried about that, you should take your money out of FTX before the crash. If everyone is worried about that, they will all take their money out of FTX. But FTX doesn’t have their money; it has FTT and a loan to Alameda. If they all take their money out, that’s a bank run.”
“[D]ue to recent revelations,” Binance Holdings Ltd’s (CRYPTO: BNB) founder Changpeng Zhao (CZ) was prompted to sell large FTT holdings. “People worried that this would tank the price of FTT and put pressure on FTX, so they started withdrawing money from FTX. FTX didn’t have the money, and SBF started calling around asking for a loan or a bailout.”
The proposed bailout has since been withdrawn and CZ established some major takeaways as a result of the event: “1: Never use a token you created as collateral [and] 2: Don’t borrow if you run a crypto business. Don’t use capital ‘efficiently’. Have a large reserve.”
Now that the deal has fallen through, Coinbase’s CEO Brian Armstrong says it is likely users of FTX will “take losses.”
In summary, Alameda and FTX were far closer than they appeared. Alameda tapped into some large reserves of FTT and used them as collateral when borrowing customer funds from FTX.
Per The Milk Road: If “Alameda’s investments go south, or the FTT collateral starts to dump in value, then Alameda goes down, and it pulls FTX down with it.”
Some Knew Earlier Than Others:
A fall in volumes and market share, “splintered attention”, the departure of executives including but not limited to FTX.US’ Brett Harrison and Alameda’s Sam Trabucco, “market manipulation allegations,” and “bad bull market decisions” such as partaking in NFT community “Doodles’ insane $54 million raise,” were some of the reasons prompting users to turn on FTX early.
Potential Follow-On Implication:
As Kai Volatility’s Cem Karsan puts eloquently, “[T]he collapse[s] of crypto will increasingly feed the [fire] of more traditional populism as its promise as a solution to the populism that fueled its ascent fades, leaving anger in its wake.”
That’s a narrative Karsan has maintained for as long as I can remember. Back in 2021, he and I spoke about the revolutionary technology of blockchain and its “broad association [and] use for cryptocurrency [being] tied up in the liquidity bubble that exists across all assets.”
Read the Daily Brief for November 9 to better understand this “liquidity bubble that exists across all assets.”
On the heels of scrutiny that was likely to come with some collapses, Karsan said there would likely be no “clear window where cryptocurrency is not subject to constraints,” adding that it’s likely “we move towards a digital dollar.”
Graphic: Retrieved from Bloomberg.
Circle (CRYPTO: USDC) co-founder and CEO Jeremy Allaire noted, too:
“Once again, it’s moments like these that require all of us to hold crypto to a higher standard, a standard with greater transparency and accountability, enshrined in practice and in law,” adding that “Circle has no material exposure to FTX and Alameda.”
A ‘Good Practice For Indie Traders’:
Independent volatility trader Darrin Johnson suggests traders “[s]weep excess cash into short-term T-notes or [money-market] accounts.” In case of some catastrophic events, “securities will be reimbursed at a higher notional value than cash.”
FTX’s Roadmap ‘For The Next Week’:
An online whistleblower shared messages allegedly sent by SBF to employees.
In short, SBF’s “number one priority, right now, is to do right by customers.” To do so requires “a raise” which “may end up being a combined FTX Int[ernational] and FTX.US infusion.” Without a cash injection, the company would likely file for bankruptcy.
It’s reported SBF et al transferred ~$4 billion in FTX funds (e.g., customer deposits) to help buoy Alameda Research after severe losses including a $500 million loan agreement with Voyager.
Technical
As of 8:00 AM ET, Thursday’s regular session (9:30 AM – 4:00 PM ET), in the S&P 500, is likely to open in the upper part of a positively skewed overnight inventory, inside of prior-range and -value, suggesting a limited potential for immediate directional opportunity.
In the best case, the S&P 500 trades higher.
Any activity above the $3,752.25 HVNode puts into play the $3,801.00 VPOC. Initiative trade beyond the VPOC could reach as high as the $3,838.25 and $3,871.25 LVNode, or higher.
In the worst case, the S&P 500 trades lower.
Any activity below the $3,752.25 HVNode puts into play the $3,727.00 VPOC. Initiative trade beyond the latter could reach as low as the $3,685.00 VPOC and $3,638.25 LVNode, or lower.
Click here to load today’s key levels into the web-based TradingView charting platform. Note that all levels are derived using the 65-minute timeframe. New links are produced, daily.
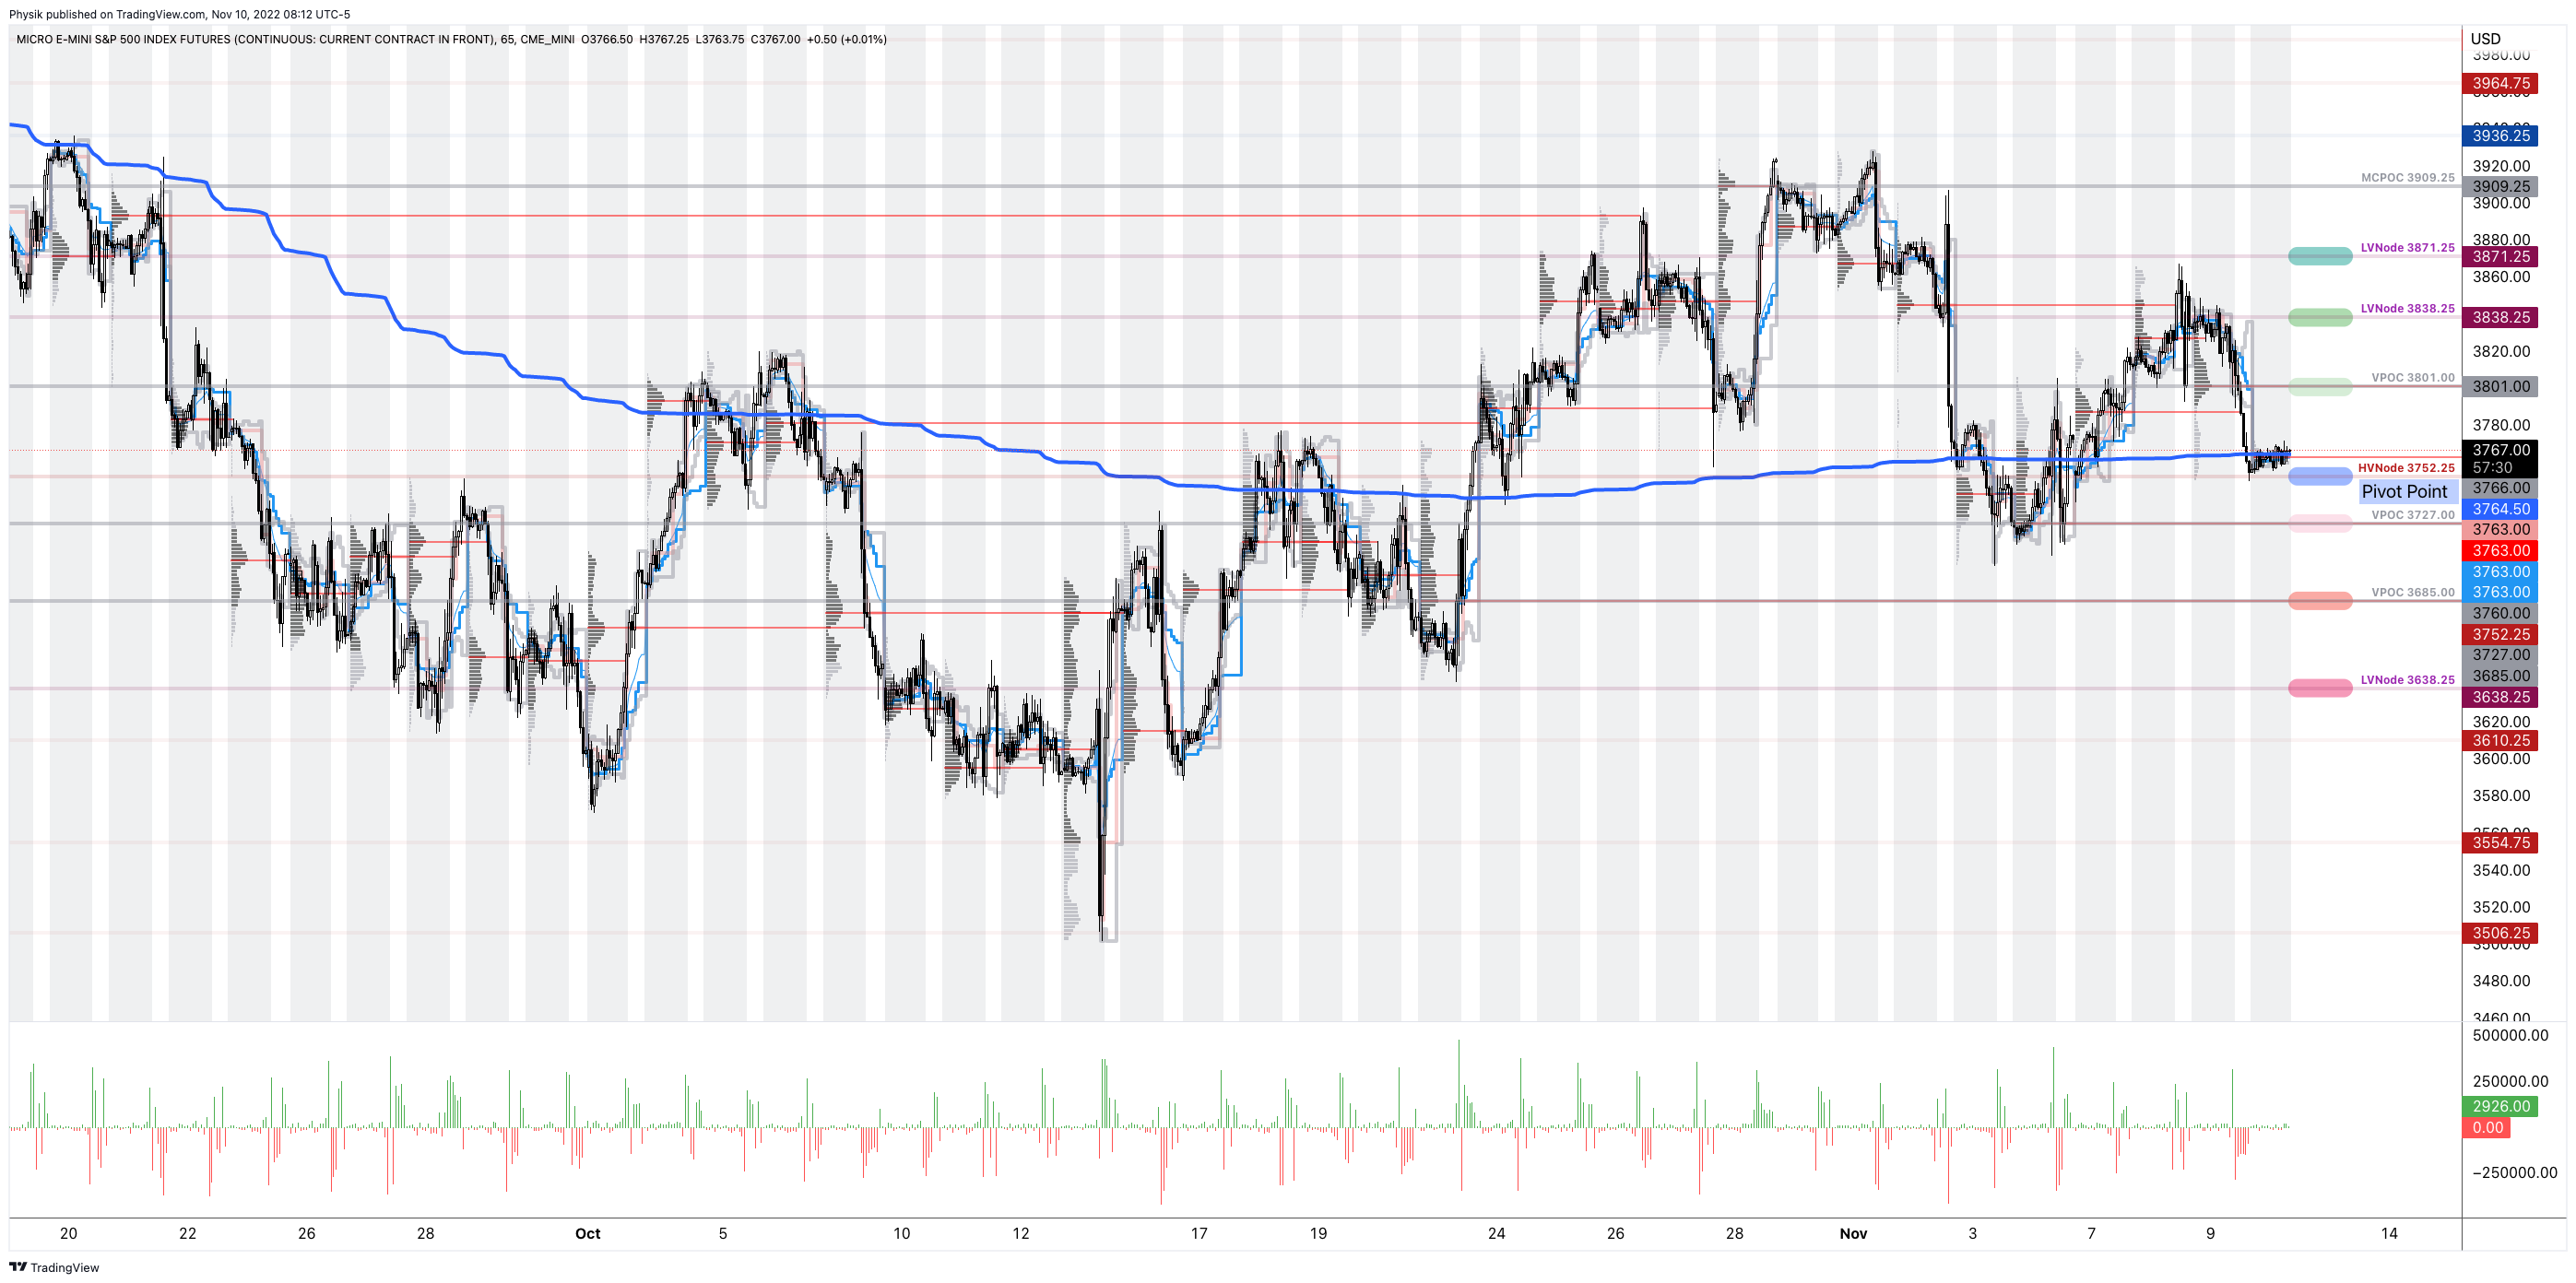
Graphic: 65-minute profile chart of the Micro E-mini S&P 500 Futures.
Considerations: Futures tied to the S&P 500 are trading within close proximity to a blue line in the above graphic. This blue line depicts a volume-weighted average price (VWAP) anchored to price action following the release of consumer price data on September 13, 2022.
The VWAP metric is highly regarded by chief investment officers, among other participants, for the quality of trade. Additionally, liquidity algorithms are benchmarked and programmed to buy and sell around VWAPs.
Should the S&P 500 auction away from this level, and come back to it, a prudent response is to fade. If the price is above the VWAP, and it auctions lower, into the VWAP, traders would buy. On the other hand, if the price is below the VWAP, and it auctions higher, into the VWAP, sell.
At this time, the S&P 500 is near VWAP offering traders lower (directional) opportunities.
Definitions
Volume Areas: A structurally sound market will build on areas of high volume (HVNodes). Should the market trend for long periods of time, it will lack sound structure, identified as low volume areas (LVNodes). LVNodes denote directional conviction and ought to offer support on any test.
If participants were to auction and find acceptance into areas of prior low volume (LVNodes), then future discovery ought to be volatile and quick as participants look to HVNodes for favorable entry or exit.
POCs: POCs are valuable as they denote areas where two-sided trade was most prevalent in a prior day session. Participants will respond to future tests of value as they offer favorable entry and exit.
About
After years of self-education, strategy development, mentorship, and trial-and-error, Renato Leonard Capelj began trading full-time and founded Physik Invest to detail his methods, research, and performance in the markets.
Capelj also develops insights around impactful options market dynamics at SpotGamma and is a Benzinga reporter.
In no way should the materials herein be construed as advice. Derivatives carry a substantial risk of loss. All content is for informational purposes only.