Categories
Commentary

Daily Brief For January 25, 2023

Physik Invest’s Daily Brief is read by thousands of subscribers. You, too, can join this community to learn about the fundamental and technical drivers of markets.

Graphic updated 8:00 AM ET. Sentiment Risk-Off if expected /ES open is below the prior day’s range. /ES levels are derived from the profile graphic at the bottom of this letter. Click here for the latest levels. SqueezeMetrics Dark Pool Index (DIX) and Gamma (GEX) with the latter calculated based on where the prior day’s reading falls with respect to the MAX and MIN of all occurrences available. A higher DIX is bullish. At the same time, the lower the GEX, the more (expected) volatility. Click to learn the implications of volatility, direction, and moneyness. Breadth reflects a reading of the prior day’s NYSE Advance/Decline indicator. The CBOE VIX Volatility Index (INDEX: VVIX) reflects the attractiveness of owning volatility.

Positioning

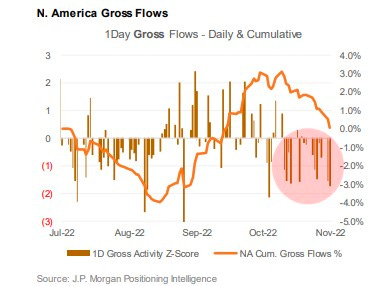
After a rocky end to 2022, the result of rebalances and repositioning, stocks rallied in the face of incredibly bearish sentiment and off-sides positioning. The detailed Daily Brief for January 24 discussed this context.

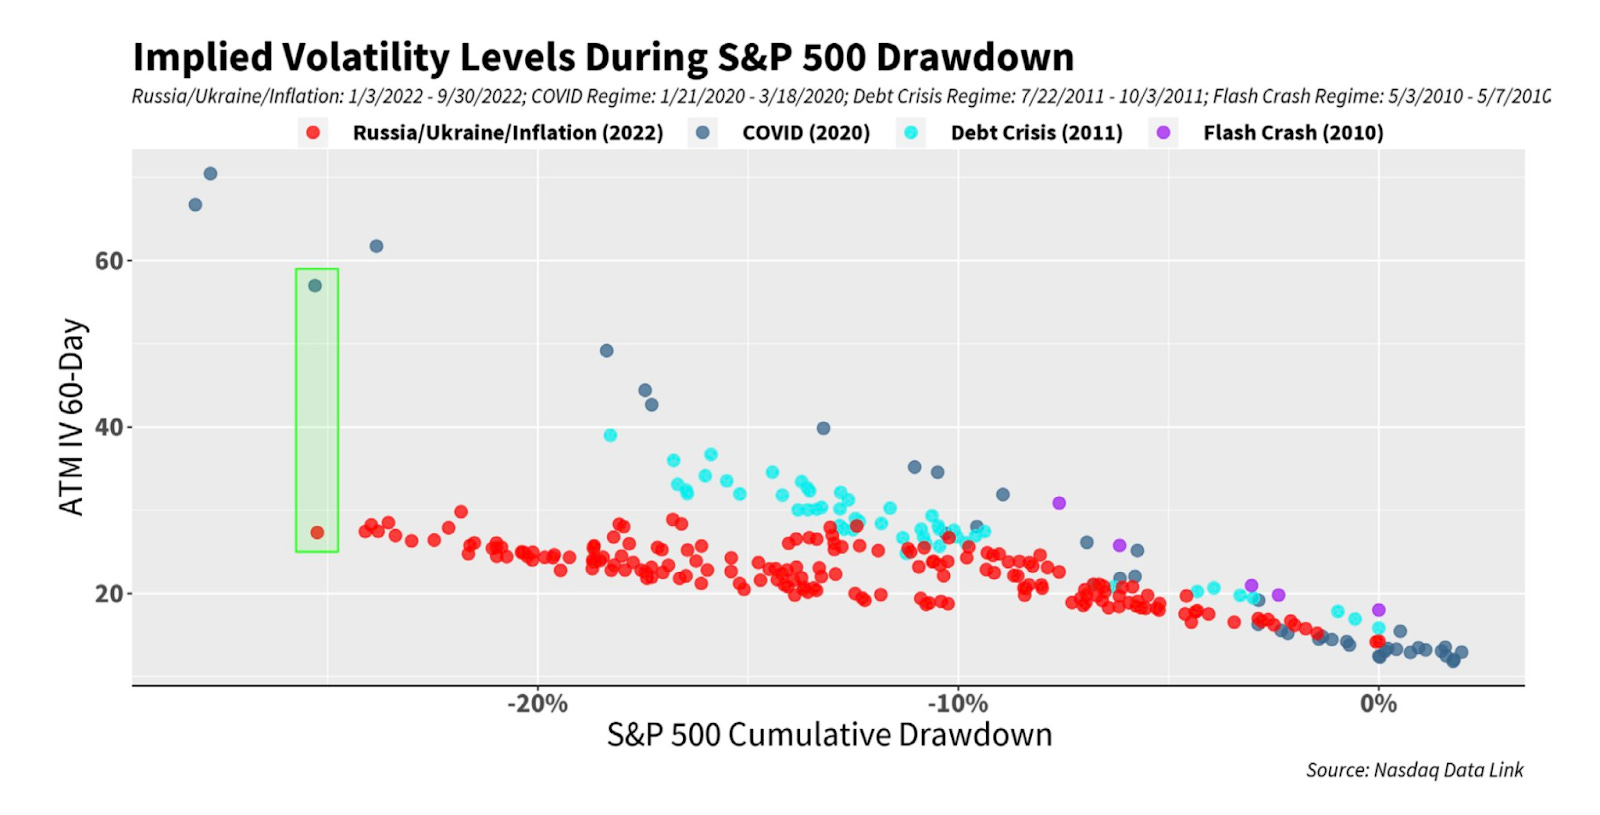
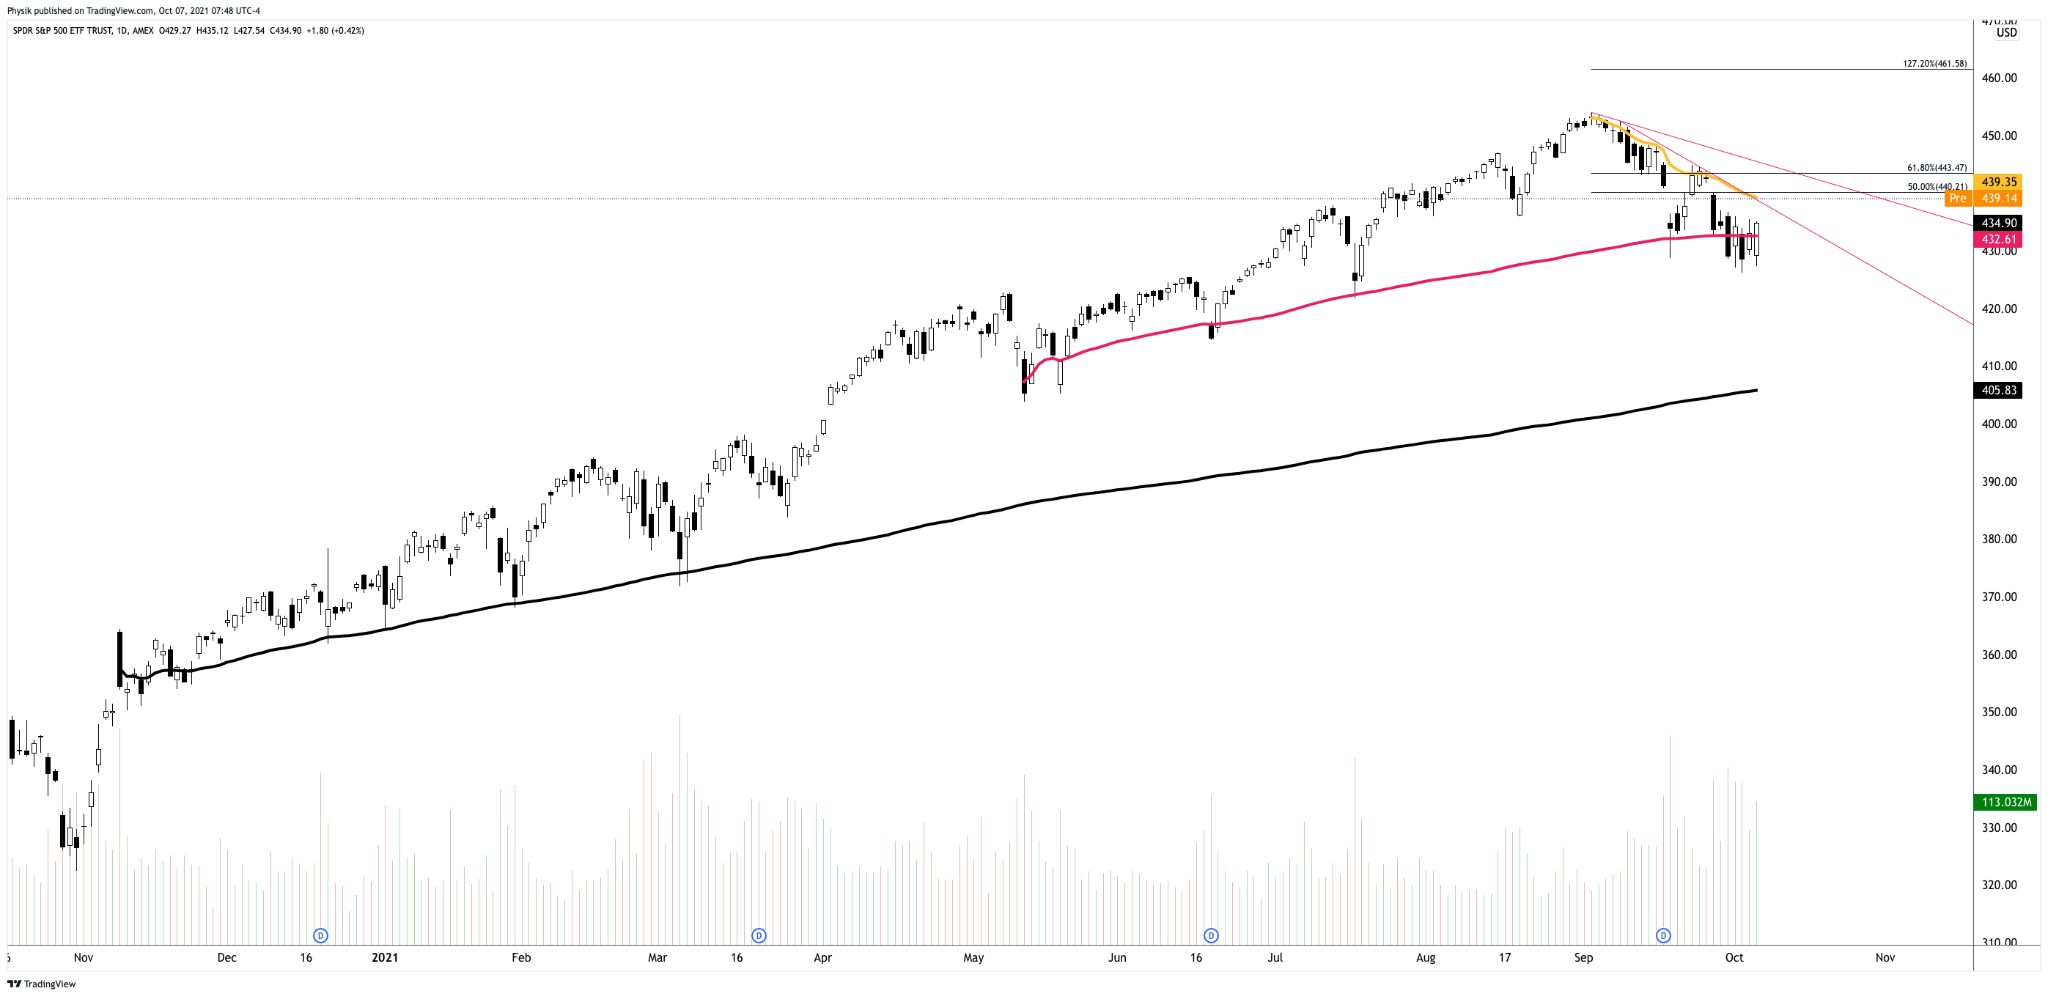
Presently, the S&P 500 (INDEX: SPX) is riding above an important inflection (i.e., the 200-day simple moving average) which is a trigger for many traders to flip to owning stocks. At the same time, implied volatility (IVOL), as measured by measures such as the Cboe Volatility Index (INDEX: VIX), is trending higher, and that’s, in part, a result of options hedging in a lower liquidity environment.

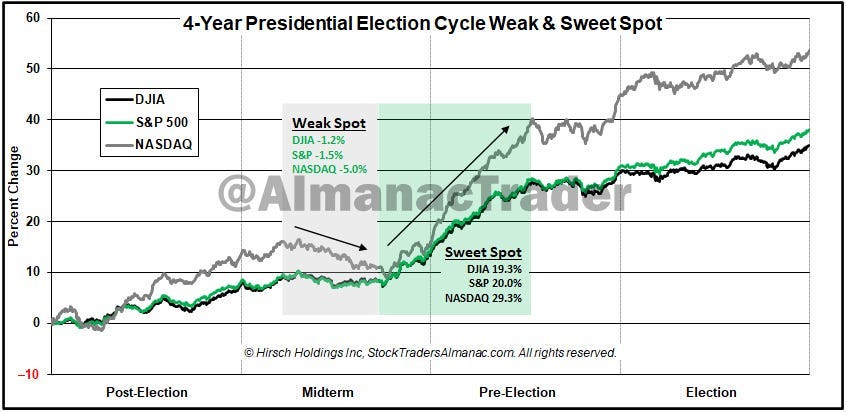
Anyways, little is expected to change until the middle of February, this letter quoted Kai Volatility’s Cem Karsan stating, yesterday. Following mid-February, a window for weakness opens. This could be a problem for some traders who are short volatility.

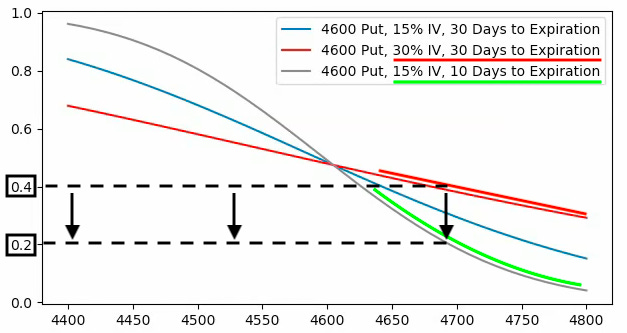
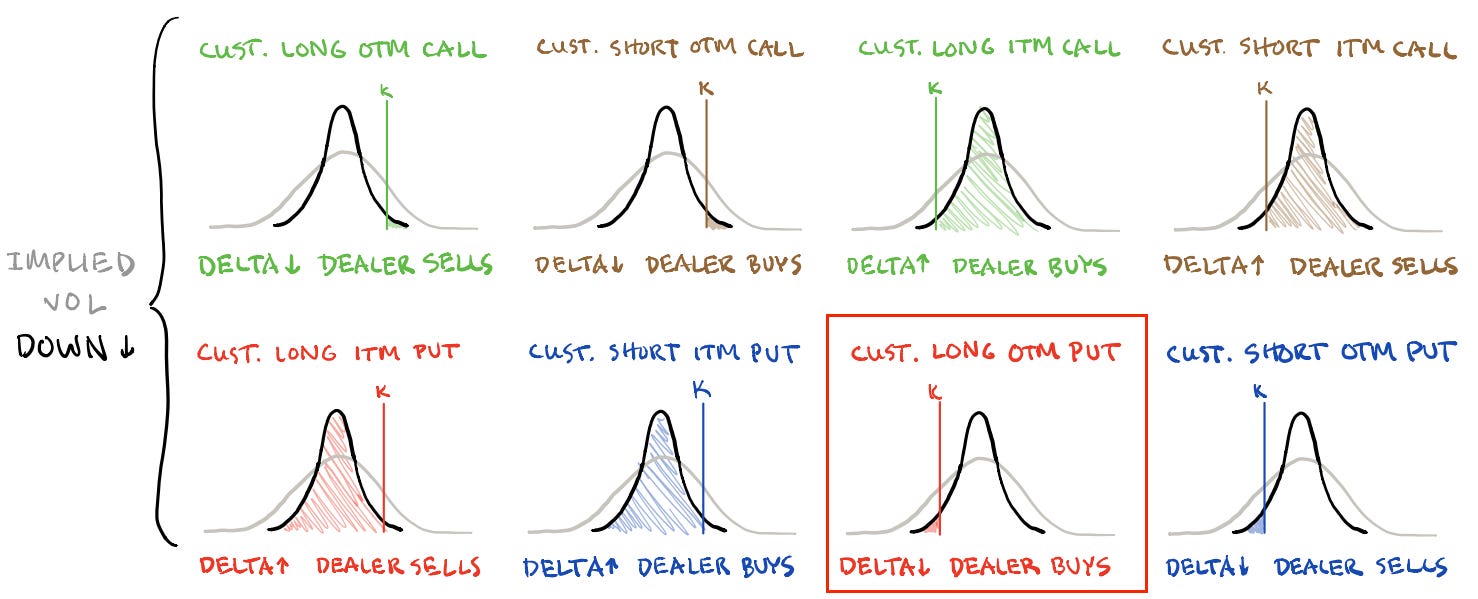
The reason being is as follows. Traders’ disinterest in hedging downside leaves them offside should the market drop quickly. Consequently, the demand for hedges (puts) will coincide with a re-pricing in IVOL dangerous to anyone who is short volatility.

Given the unstable SPX and VIX up environment, attractive trades provide exposure to the upside while limiting the downside. Structures such as call butterflies or ratio spreads, as included in yesterday’s letter, may work well.

In yesterday’s example, owning the 20-point FEB 1×2 Tesla Call Ratio Spread resulted in about 400% profit in the span of 14 days or so (i.e., $0.20 db → $1.00 cr). The loss was limited* to about $20.00 at entry while the exit was marked in excess of $100.00.

*Note that losses can exceed the entry debit should the underlying stock trade very far beyond the ratio spread’s short strikes.

Similar trades can be structured in the indexes such as the Nasdaq 100 (INDEX: NDX) where there is a steeper skew that may enable us to collect more credit in the options we are short, helping us lower the cost of the entire spread we own.

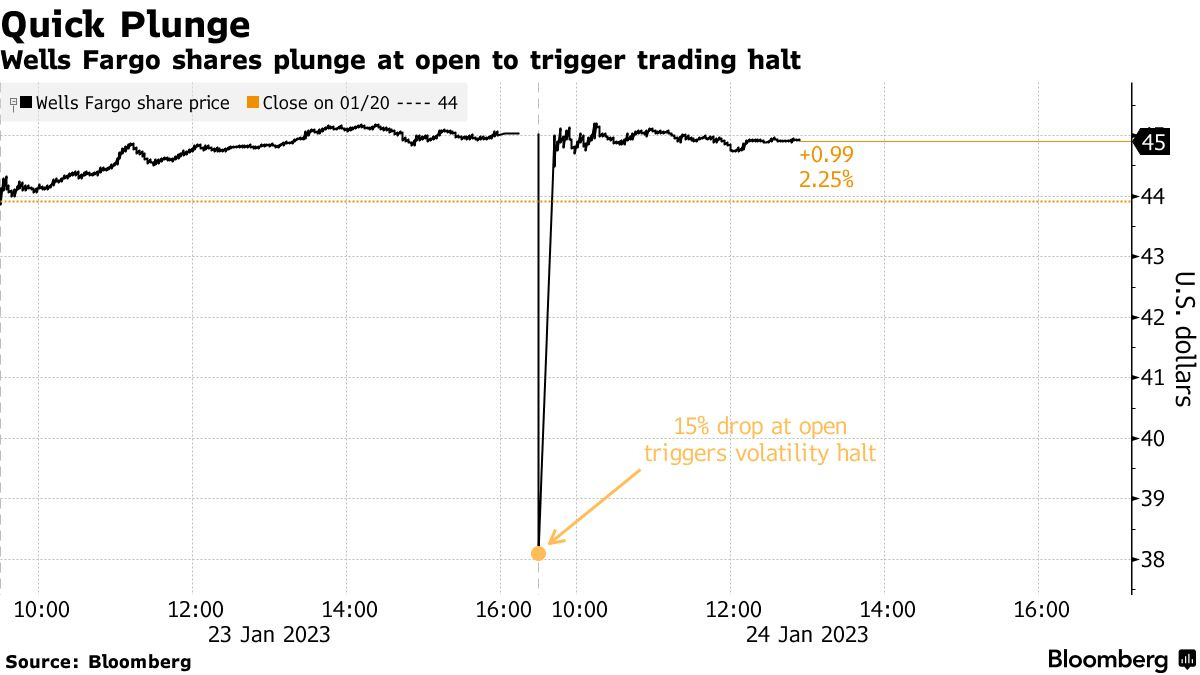
If you’re leaning toward the indexes, then you may avoid some of the volatility we saw yesterday when large swaths of stocks on the Intercontinental Exchange Inc-owned (NYSE: ICE) New York Stock Exchange commenced trading with an open book some reports have suggested.

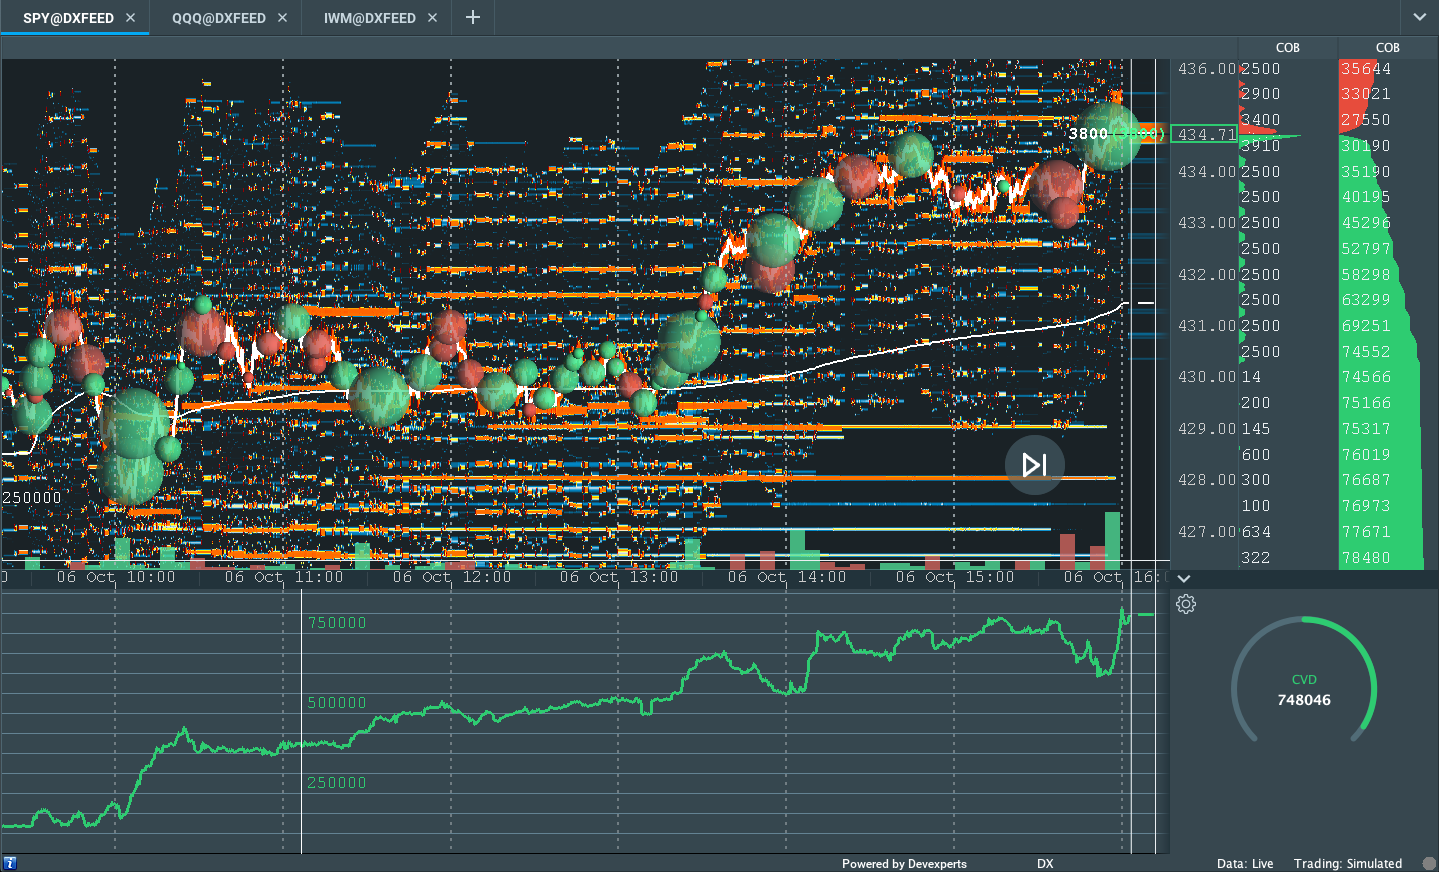
As SpotGamma explained yesterday, “movement-reducing hedging activities” in the indexes “can mask realized volatility (RV) under the hood in single stocks.” Therefore, your index positions may be better isolated from what’s going on under the hood.

Graphic: Retrieved from Bloomberg.

Technical

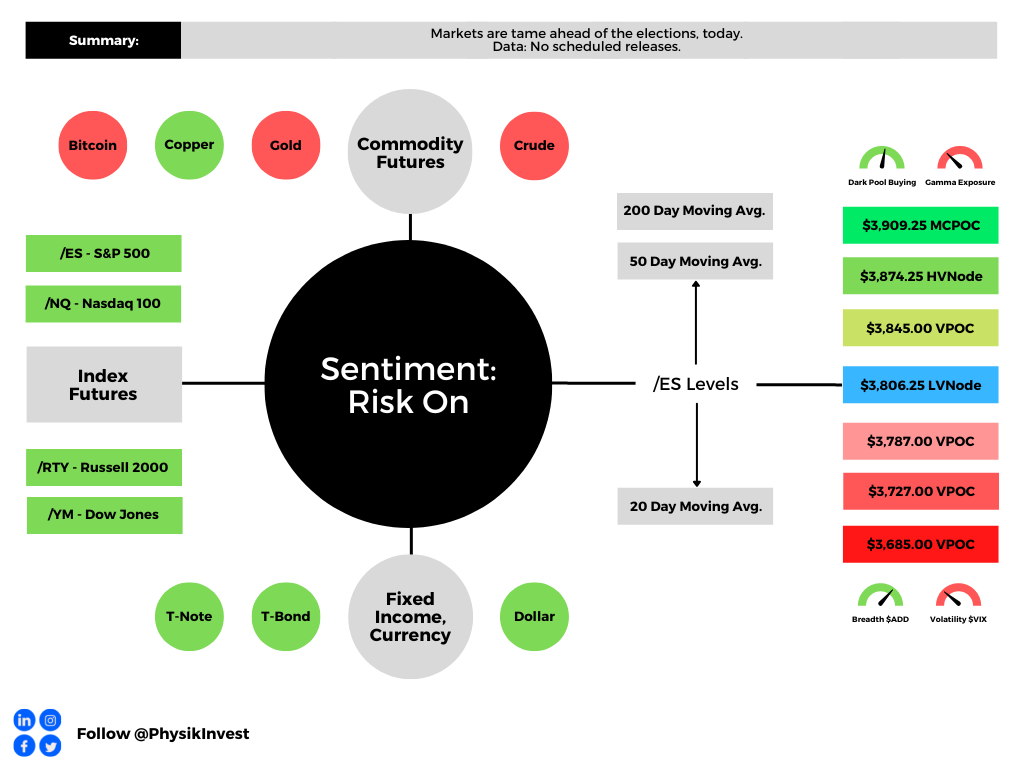
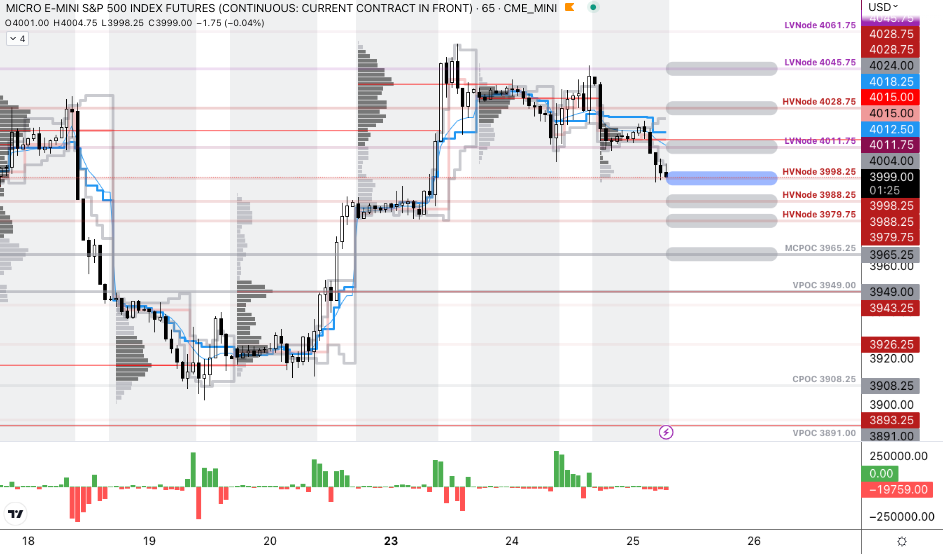
As of 8:00 AM ET, Wednesday’s regular session (9:30 AM – 4:00 PM ET), in the S&P 500, is likely to open in the lower part of a negatively skewed overnight inventory, outside of prior-range and -value, suggesting a potential for immediate directional opportunity.

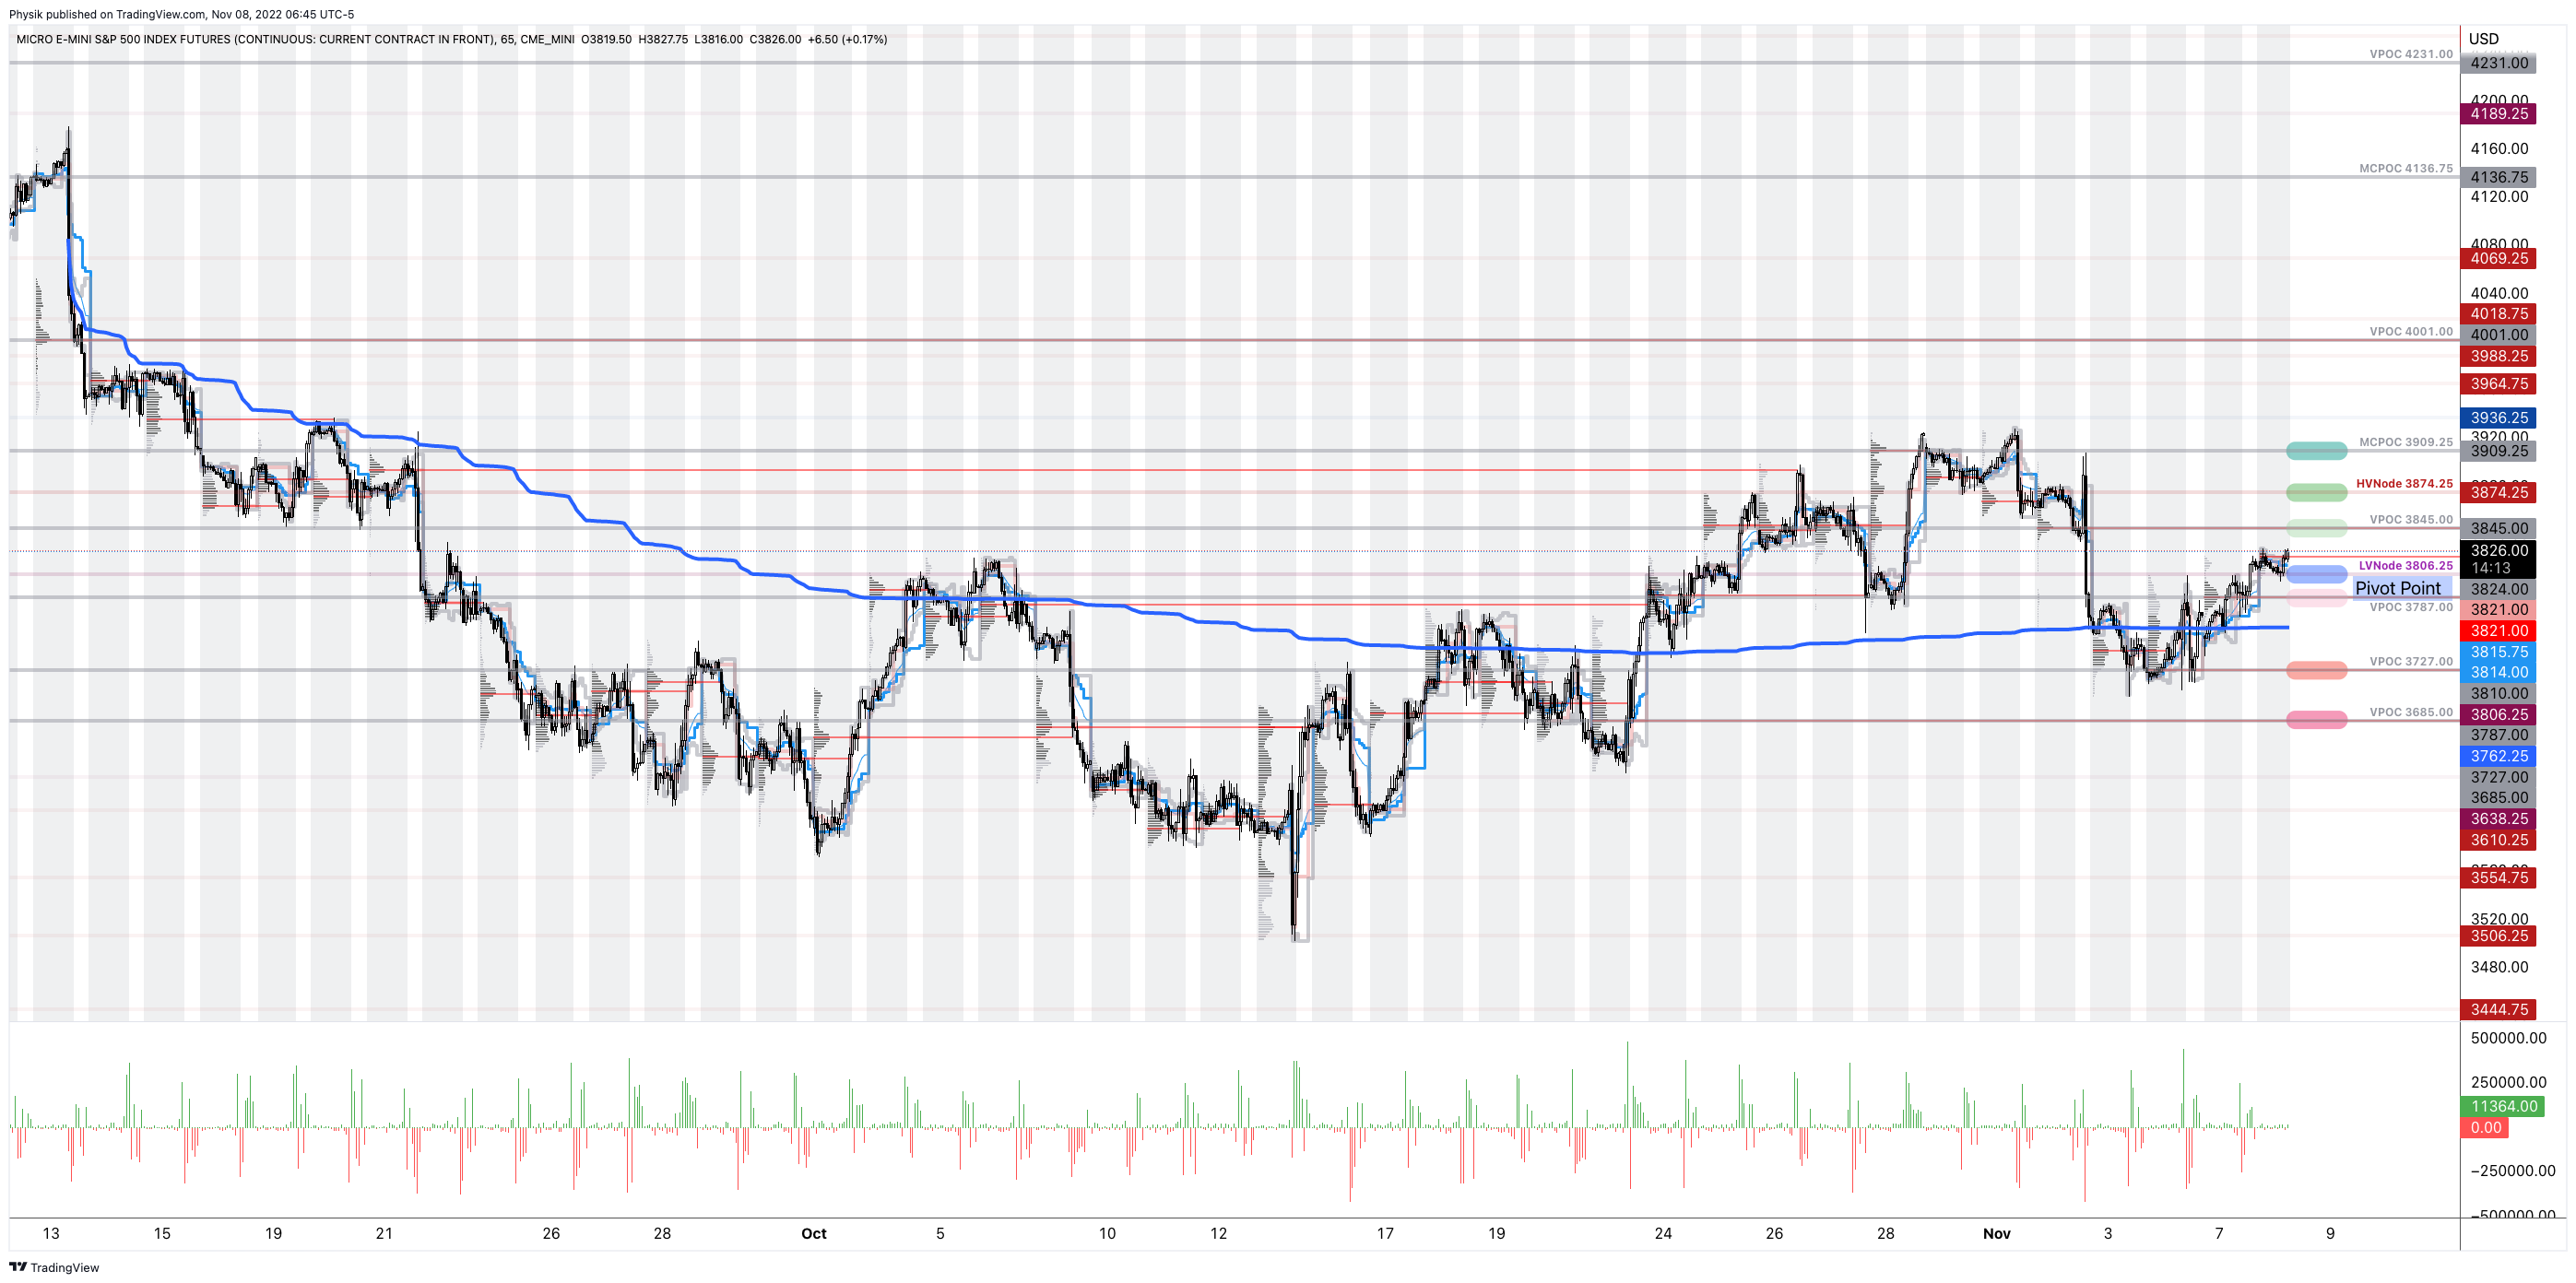
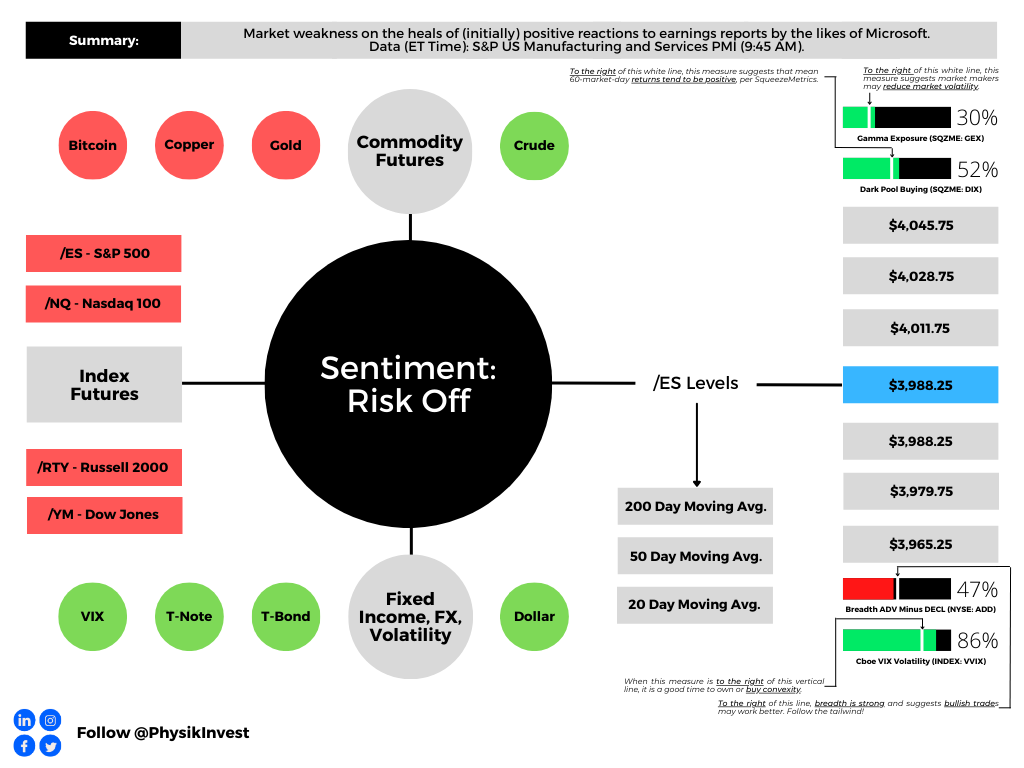
Our S&P 500 pivot for today is $3,998.25. 

Key levels to the upside include $4,011.75, $4,028.75, and $4,045.75.

Key levels to the downside include $3,988.25, $3,979.75, and $3,965.25.

Click here to load updated key levels into the web-based TradingView platform. All levels are derived using the 65-minute timeframe. New links are produced, daily. 

Graphic: 65-minute profile chart of the Micro E-mini S&P 500 Futures.

Definitions

Volume Areas: Markets will build on areas of high-volume (HVNodes). Should the market trend for long periods of time, it will be identified by low-volume areas (LVNodes). LVNodes denote directional conviction and ought to offer support on any test.

If participants auction and find acceptance in an area of a prior LVNode, then future discovery ought to be volatile and quick as participants look to HVNodes for favorable entry or exit.

MCPOCs: Denote areas where two-sided trade was most prevalent over numerous sessions. Participants will respond to future tests of value as they offer favorable entry and exit.


About

In short, Renato Leonard Capelj is an economics graduate working in finance and journalism.

Capelj spends most of his time as the founder of Physik Invest through which he invests and publishes daily analyses to subscribers, some of whom represent well-known institutions.

Separately, Capelj is an equity options analyst at SpotGamma and an accredited journalist interviewing global leaders in business, government, and finance.

Past works include conversations with investor Kevin O’Leary, ARK Invest’s Catherine Wood, FTX’s Sam Bankman-Fried, Lithuania’s Minister of Economy and Innovation Aušrinė Armonaitė, former Cisco chairman and CEO John Chambers, and persons at the Clinton Global Initiative.

Contact

Direct queries to renato@physikinvest.com or Renato Capelj#8625 on Discord.

Calendar

You may view this letter’s content calendar at this link.

Disclaimer

Do not construe this newsletter as advice. All content is for informational purposes.

Categories
Commentary

Daily Brief For November 8, 2022

The daily brief is a free glimpse into the prevailing fundamental and technical drivers of U.S. equity market products. Join the 1,200+ that read this report daily, below!

Graphic updated 9:15 AM ET. Sentiment Risk-On if expected /ES open is above the prior day’s range. /ES levels are derived from the profile graphic at the bottom of the following section. Levels may have changed since initially quoted; click here for the latest levels. SqueezeMetrics Dark Pool Index (DIX) and Gamma (GEX) calculations are based on where the prior day’s reading falls with respect to the MAX and MIN of all occurrences available. A higher DIX is bullish. At the same time, the lower the GEX, the more (expected) volatility. Learn the implications of volatility, direction, and moneyness. Breadth reflects a reading of the prior day’s NYSE Advance/Decline indicator. VIX reflects a current reading of the CBOE Volatility Index (INDEX: VIX) from 0-100.

Administrative

This letter’s author is ramping up coverage and returning to speed after a short hiatus. Today’s focus will be on adding to the “Positioning” section of Monday’s letter.

Positioning

After some late-October weakness that is coinciding with the Federal Reserve’s (Fed) decision to raise rates, stocks are tame. This is heading into midterm elections, today, and inflation updates, Thursday.

Graphic: Retrieved from Bloomberg. Created by JPMorgan Chase & Co (NYSE: JPM).

Republicans are likely to add to their control of the House and Senate.

Having fewer Democrats in Congress would lower “the odds of fiscal measures [that would] embolden a hawkish Federal Reserve.” 

This is a boon for stocks.

Graphic: Retrieved from Bloomberg. “With things looking that bad, current polls show the Democrats appear to be headed for a drubbing, almost certain to lose control of the House and increasingly likely to see the Senate slip away.”

Indeed, Wells Fargo & Co (NYSE: WFC) strategists found a “GOP-controlled Senate historically is associated with superior equity returns.”

Graphic: Retrieved from Wells Fargo & Co (NYSE: WFC).

In spite of recessions, even, the S&P 500, a year after midterms, often netted positive 20% or so returns Citigroup Inc (NYSE: C) strategists add.

Graphic: Retrieved from Callum Thomas’ Weekly S&P 500 ChartStorm. The “seasonal/cycle outlook is for a lower low or retest of the lows over the next three months as we are in the worst two months of the year and are smack dab in the *Weak Spot* of the 4-Year Cycle”

A post-election bump is on top of the general positiveness of equity performance during the earnings season and periods of strong pessimism as we have today.

Graphic: Retrieved from Mr. Blonde’s Stuck in the Middle letter.

Why all the potential positivity over this short period?

The aforementioned events are happening during a period wherein market liquidity eases (i.e., the holiday season).

It’s during this period, from a positioning perspective, the effects of decay (which we discuss more below) accelerate, and a lack of liquidity, according to Kai Volatility’s Cem Karsan, makes markets sensitive to positive-leaning flows.

Pessimism and hedging may indirectly give rise to bullishness. Why is that?

Demand for options exposures, especially across shorter time horizons, evidenced by heightened implied volatility (IVOL) at the front end (see below), has indirectly added to the pressures of de-grossing, as observed.

Graphic: Retrieved from Bloomberg.

Though positioning is generally thin, as we also talked about in yesterday’s newsletter, thus reducing the impact of the hedging of this positioning, demand remains “strong,” per Karsan, and “dealers are short that volatility.”

Derivatives strategists at the likes of the Royal Bank of Canada (NYSE: RY) agree with Karsan’s remarks; Amy Wu Silverman said that the Cboe Volatility Index’s (INDEX: VIX) elevation was the result of demand for hedges after October options expiry.

“Part of today’s move at least is a function of new positions. There is likely demand for future months since we just went through October options expiry,” she said. “Part of it is a function of the ‘floor’ of a new volatility regime.”

So, what’s the point to make?

For IVOL measures to remain wound, something bad needs to happen, in short.

Otherwise, per SpotGamma, a “decline in IVOL … can aid in a push-and-pull that actually serves to … resist far-reaching weakness” and keep selling orderly.

That’s because, from here, the removal of the protection that’s been demanded in the past days and weeks compounds the sped-up effects of Charm.

Graphic: Retrieved from SpotGamma. SPX prices X-axis. Option delta Y-axis. When the factors of implied volatility (Vanna) and time change (Charm), hedging ratios change. The graphic is for illustrational purposes, only.

Charm, which is the change in options Delta (i.e., exposure to direction) with respect to changes in time, “drives a positive window or seasonality”; “the reduction in time” and “lack of liquidity” make markets more sensitive to those positive flows.

Graphic: Retrieved from SqueezeMetrics.

In the long term, however, weakness is here to stay. Poor IVOL performance and little skew also likely set the stage for a post-holiday tail. More on this, later.

Graphic: Retrieved from Corey Hoffstein on Twitter.

Technical

As of 6:45 AM ET, Tuesday’s regular session (9:30 AM – 4:00 PM ET), in the S&P 500, is likely to open in the upper part of a positively skewed overnight inventory, just outside of prior-range and -value, suggesting a limited potential for immediate directional opportunity.

In the best case, the S&P 500 trades higher.

If above the $3,806.25 LVNode, the $3,845.00 VPOC is in play. Initiative trade beyond the latter could reach as high as the $3,874.25 HVNode and $3,909.25 MCPOC, or higher.

In the worst case, the S&P 500 trades lower.

If above the $3,806.25 LVNode, the $3,787.00 VPOC is in play. Initiative trade beyond the latter could reach as low as the $3,727.00 and $3,685.00 VPOC, or lower.

Click here to load today’s key levels into the web-based TradingView charting platform. Note that all levels are derived using the 65-minute timeframe. New links are produced, daily.

Graphic: 65-minute profile chart of the Micro E-mini S&P 500 Futures.

Considerations: Futures tied to the S&P 500 are trading within close proximity to a blue line in the above graphic. This blue line depicts a volume-weighted average price (VWAP) anchored to price action following the release of consumer price data on September 13, 2022.

The VWAP metric is highly regarded by chief investment officers, among other participants, for the quality of trade. Additionally, liquidity algorithms are benchmarked and programmed to buy and sell around VWAPs.

Should the S&P 500 auction away from this level, and come back to it, a prudent response is to fade. If the price is above the VWAP, and it auctions lower, into the VWAP, traders would buy. On the other hand, if the price is below the VWAP, and it auctions higher, into the VWAP, sell.

At this time, the S&P 500 is near VWAP offering traders lower (directional) opportunities.


Definitions

Volume Areas: A structurally sound market will build on areas of high volume (HVNodes). Should the market trend for long periods of time, it will lack sound structure, identified as low volume areas (LVNodes). LVNodes denote directional conviction and ought to offer support on any test. 

If participants were to auction and find acceptance into areas of prior low volume (LVNodes), then future discovery ought to be volatile and quick as participants look to HVNodes for favorable entry or exit.

Gamma: Gamma is the sensitivity of an option to changes in the underlying price. Dealers that take the other side of options trades hedge their exposure to risk by buying and selling the underlying. When dealers are short-gamma, they hedge by buying into strength and selling into weakness. When dealers are long-gamma, they hedge by selling into strength and buying into weakness. The former exacerbates volatility. The latter calms volatility.

Vanna: The rate at which the delta of an option changes with respect to volatility.

Charm: The rate at which the delta of an option changes with respect to time.

POCs: POCs are valuable as they denote areas where two-sided trade was most prevalent in a prior day session. Participants will respond to future tests of value as they offer favorable entry and exit.

MCPOCs: POCs are valuable as they denote areas where two-sided trade was most prevalent over numerous day sessions. Participants will respond to future tests of value as they offer favorable entry and exit.


About

After years of self-education, strategy development, mentorship, and trial-and-error, Renato Leonard Capelj began trading full-time and founded Physik Invest to detail his methods, research, and performance in the markets.

Capelj also develops insights around impactful options market dynamics at SpotGamma and is a Benzinga reporter.

Some of his works include conversations with ARK Invest’s Catherine Wood, investors Kevin O’Leary and John Chambers, FTX’s Sam Bankman-Fried, ex-Bridgewater Associate Andy Constan, Kai Volatility’s Cem Karsan, The Ambrus Group’s Kris Sidial, among many others.

Disclaimer

In no way should the materials herein be construed as advice. Derivatives carry a substantial risk of loss. All content is for informational purposes only.


Categories
Commentary

Daily Brief For October 7, 2021

Market Commentary

Led by the Nasdaq 100, equity index futures were higher. Commodities and bonds were mixed.

  • Relief of worries over debt, energy.
  • Claims and credit data, Fed speak.
  • Positioning suggests risk to upside.

What Happened: U.S. stock index futures continued higher overnight alongside ease in angst over debt and energy worries.

Ahead is data on jobless claims (8:30 AM ET), Fed speak by John Williams (8:40 AM ET), Fed speak by Loretta Mester (11:45 AM ET), as well as consumer credit data (3:00 PM ET).

Graphic updated 6:20 AM ET. Sentiment Risk-On if expected /ES open is above the prior day’s range. /ES levels are derived from the profile graphic at the bottom of the following section. SqueezeMetrics Dark Pool Index (DIX) and Gamma (GEX) calculations are based on where the prior day’s reading falls with respect to the MAX and MIN of all occurrences available. A higher DIX is bullish. At the same time, the lower the GEX, the more (expected) volatility. SHIFT data used for S&P 500 (INDEX: SPX) options activity. Note that options flow is sorted by the call premium spent; if more positive then more was spent on call options. Breadth reflects a reading of the prior day’s NYSE Advance/Decline indicator. VIX reflects a current reading of the CBOE Volatility Index (INDEX: VIX) from 0-100.

What To Expect: As of 6:20 AM ET, Thursday’s regular session (9:30 AM – 4:00 PM EST) in the S&P 500 will likely open outside of prior-range and -value, suggesting a heightened potential for immediate directional opportunity.

Adding, during the prior day’s regular trade, on negative intraday breadth and supportive market liquidity metrics, the best case outcome occurred, evidenced by trade above the level of a key volume-weighted average price (VWAP).

Graphic: SPDR S&P 500 ETF Trust (NYSE: SPY), one of the largest ETFs that track the S&P 500 index, encounters responsive buying at key volume-weighted average price levels. 
Graphic: Supportive delta (i.e., committed buying as measured by volume delta or buying and selling power as calculated by the difference in volume traded at the bid and offer) in SPDR S&P 500 ETF Trust (NYSE: SPY), one of the largest ETFs that track the S&P 500 index, via Bookmap. The readings are supportive of responsive trade or balance (i.e., rotational trade that suggests current prices offer favorable entry and exit).

Thereafter, equity index futures, led by the Nasdaq 100, continued higher overnight, leaving behind a multi-session balance area (between the $4,363.25 and $4,278.00 HVNodes).

This trade is significant because it marks a rejection, or a willingness to not transact at lower prices. We’re carrying forward, though, the presence of poor structures (e.g., Wednesday’s advance away from session value on a taper of volume, and minimal excess lows which suggest a lack of commitment to take prices lower).

Gap + Balance-Break Scenarios: A change in the market (i.e., the transition from two-time frame trade, or balance, to one-time frame trade, or trend) has occurred.

At the same time, gaps ought to fill quickly. Should any gap not fill, that’s a signal of strength; do not fade. 

Therefore, the objective is to monitor for acceptance (i.e., more than 1-hour of trade) outside of the balance area. Rejection (i.e., return inside of balance) portends a move to the opposite end of the balance.

Further, the aforementioned trade is happening in the context of a traditionally volatile October, as well as narratives surrounding adjustments to monetary policy, debt ceiling complications, and energy crises.

These themes support fear and uncertainty; for instance, Nordea believes there are “4 macro reasons why 2022 should be noisier than 2021: liquidity, growth slowdown, cost/margin problems and the risk of the Fed put looking very different if inflation indicators stay elevated.”

However, the Senate is nearing a deal to raise the debt ceiling, relieving the threat of imminent default; this was a likely development given that “lawmakers [knew] that voting against raising the debt ceiling would have enormous economic costs,” Moody’s noted.

Also, on the energy crisis front, Russia offered to export record volumes of fuel to Europe as winter approaches fast.

Given these developments, Tracie McMillion, head of global asset allocation strategy at Wells Fargo & Co’s (NYSE: WFC) Investment Institute said the following on Bloomberg: “We have several things that we are watching right now – certainly the debt ceiling is one of them and that’s been contributing to the recent volatility, … but we look for these 5% corrections to add money to the equity markets.”

Adding, prior to yesterday’s advance, this newsletter noted that indices were best positioned for a vicious rebound as near-term downside discovery metrics likely reached a limit

Graphic: ​​On October 5, 2021, according to SqueezeMetrics, “Net Put Delta (NPD) and the customer Vanna-Gamma Ratio (VGR) [] settled in a *bullish* place. Risk to the upside.”

After consolidating for numerous sessions, participants resolved the developing balance area (between the $4,363.25 and $4,278.00 HVNodes) on new information that warranted a directional move. 

In other words, the overnight session confirmed the bull thesis

We note, amidst a decline in top-of-book depth, as well as back and forth entry (exit) into (from) short-gamma, we limit our expectations based on some of the recent realized volatility.

In a quote highlighted by The Market Ear, Bank of America Corporation (NYSE: BAC) explained: “last Thursday was the 24th time since 1928 that the S&P experienced two or more 3-sigma shocks in 10 trading days, … [and] only in 3 of 23 episodes (and 1 in the last 50yrs) did the S&P surpass the prior month’s peak in the month following the second shock.”

Moreover, for today, participants may make use of the following frameworks.

In the best case, the S&P 500 trades sideways or higher; activity above the $4,377.00 overnight point of control (O/N POC) puts in play the $4,410.25 low volume area (LVNode). Initiative trade beyond the LVNode could reach as high as the $4,437.75 micro-composite point of control (MCPOC) and $4,481.75 high volume area (HVNode), or higher.

In the worst case, the S&P 500 trades lower; activity below the $4,377.00 O/N POC puts in play the $4,363.25 HVNode. Initiative trade beyond the HVNode could reach as low as the $4,332.25 LVNode and $4,278.00 HVNode, or lower.

Graphic: 65-minute profile chart of the Micro E-mini S&P 500 Futures updated 7:10 AM ET.

Definitions

Volume Areas: A structurally sound market will build on areas of high volume (HVNodes). Should the market trend for long periods of time, it will lack sound structure, identified as low volume areas (LVNodes). LVNodes denote directional conviction and ought to offer support on any test. 

If participants were to auction and find acceptance into areas of prior low volume (LVNodes), then future discovery ought to be volatile and quick as participants look to HVNodes for favorable entry or exit.

POCs: POCs are valuable as they denote areas where two-sided trade was most prevalent in a prior day session. Participants will respond to future tests of value as they offer favorable entry and exit.

MCPOCs: POCs are valuable as they denote areas where two-sided trade was most prevalent over numerous day sessions. Participants will respond to future tests of value as they offer favorable entry and exit.

More On Volume-Weighted Average Prices (VWAPs): A metric highly regarded by chief investment officers, among other participants, for quality of trade. Additionally, liquidity algorithms are benchmarked and programmed to buy and sell around VWAPs.

Gamma: Gamma is the sensitivity of an option to changes in the underlying price. Dealers that take the other side of options trades hedge their exposure to risk by buying and selling the underlying. When dealers are short-gamma, they hedge by buying into strength and selling into weakness. When dealers are long-gamma, they hedge by selling into strength and buying into weakness. The former exacerbates volatility. The latter calms volatility.

News And Analysis

NFT game wants you to spend real money buying fake shares.

Senate is poised to pull nation back from default brink, for now.

Global banks retain competitive advantage amid big obstacles.

Russia offers to ease Europe’s gas crisis with strings attached.

Digitalization of markets: how digital bonds can disrupt market.

U.S. utilities and regulators gear up for electric vehicle outlook.

ECB studies a new bond-buying plan for when crisis tool ends.

S&P on navigating a pathway to a low-carbon global economy. 

Rivian’s electric truck gets all attention but fate tied to Amazon.

What People Are Saying

About

After years of self-education, strategy development, and trial-and-error, Renato Leonard Capelj began trading full-time and founded Physik Invest to detail his methods, research, and performance in the markets. 

Additionally, Capelj is a finance and technology reporter. Some of his biggest works include interviews with leaders such as John Chambers, founder and CEO, JC2 Ventures, Kevin O’Leary, businessman and Shark Tank host, Catherine Wood, CEO and CIO, ARK Invest, among others.

Disclaimer

At this time, Physik Invest does not manage outside capital and is not licensed. In no way should the materials herein be construed as advice. Derivatives carry a substantial risk of loss. All content is for informational purposes only.