
Physik Invest’s Daily Brief is read by thousands of subscribers. You, too, can join this community to learn about the fundamental and technical drivers of markets.
Administrative
Monday’s letter had some holes. Let’s try to fill them in, today, and get a fuller picture.
Summary of today’s letter: though the real economy may be strong, sticky inflation likely results in higher rates for longer, as well as quantitative tightening. This is not good for the financial economy. Some suggest the equity market rally persists into mid-February before further weaknesses appear. Read on for more.
Fundamental
Many sentiment and positioning indicators are bearish.
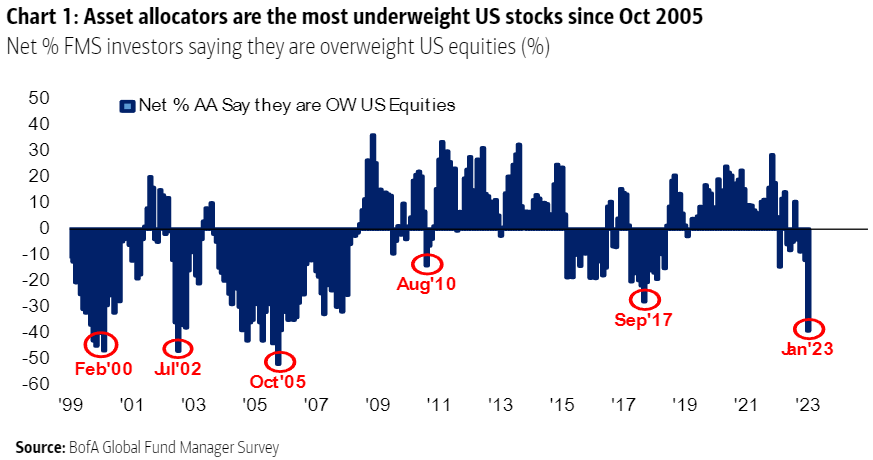
For instance, surveys by Bank of America Corporation (NYSE: BAC) point to allocators being very underweight US stocks. Also, investors are reporting some of their biggest one-month exits from stocks since BAC started surveying.
The consensus is turning more bearish, we see, and some of this letter’s most quoted voices maintain that markets (not necessarily the economy) are in for more weakness.
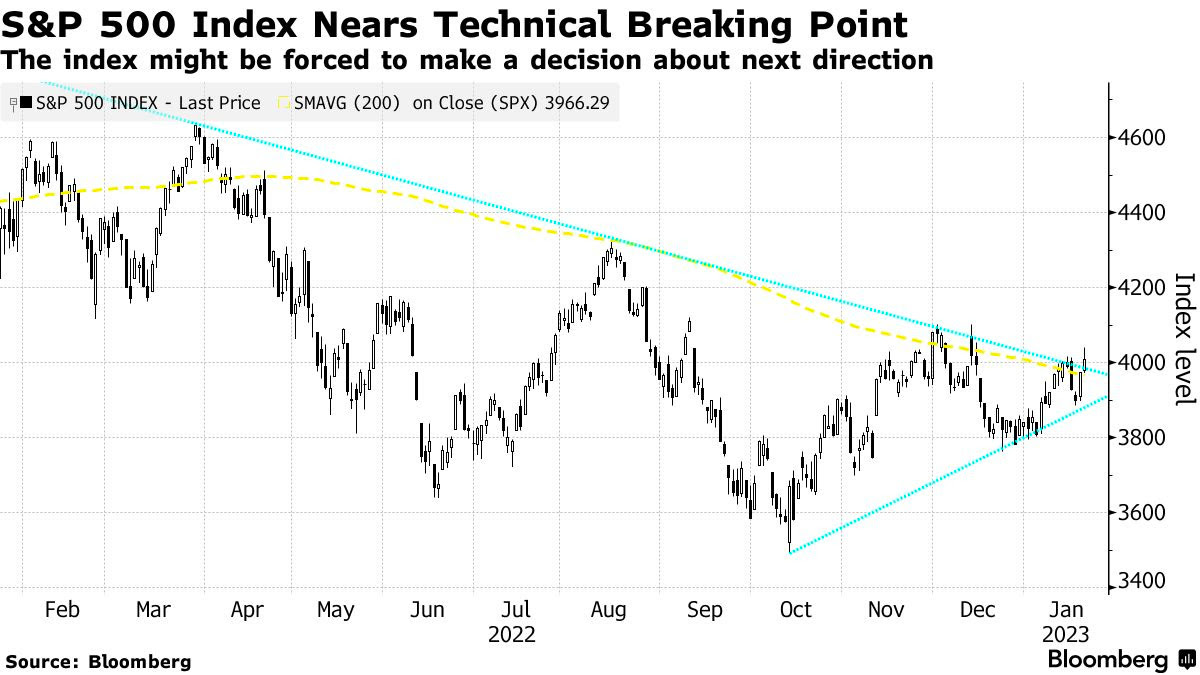
That is in the face of a severely depressed S&P 500 (INDEX: SPX) crossing above key areas denoting technical resistance, a signal for trend-followers to get involved on the long side (i.e., buy stocks) Kai Volatility’s Cem Karsan explained in a video last week.
Equity market strength drivers, Karsan said, include China reopening and increasing stimulus, Europe’s not-so-bad winter, and little worsening of conflicts (e.g., Ukraine and Russia situation).
Adding, as The Macro Compass’ Alfonso Peccatiello said, the bond market thinks the Fed will not hike into a recession. Inflation likely “slows down to 2.5% quickly, [with] the Fed cutting rates to neutral (and never below). [That’s] not recessionary pricing. It’s immaculate disinflation pricing.”
The base case is a landing that’s soft.
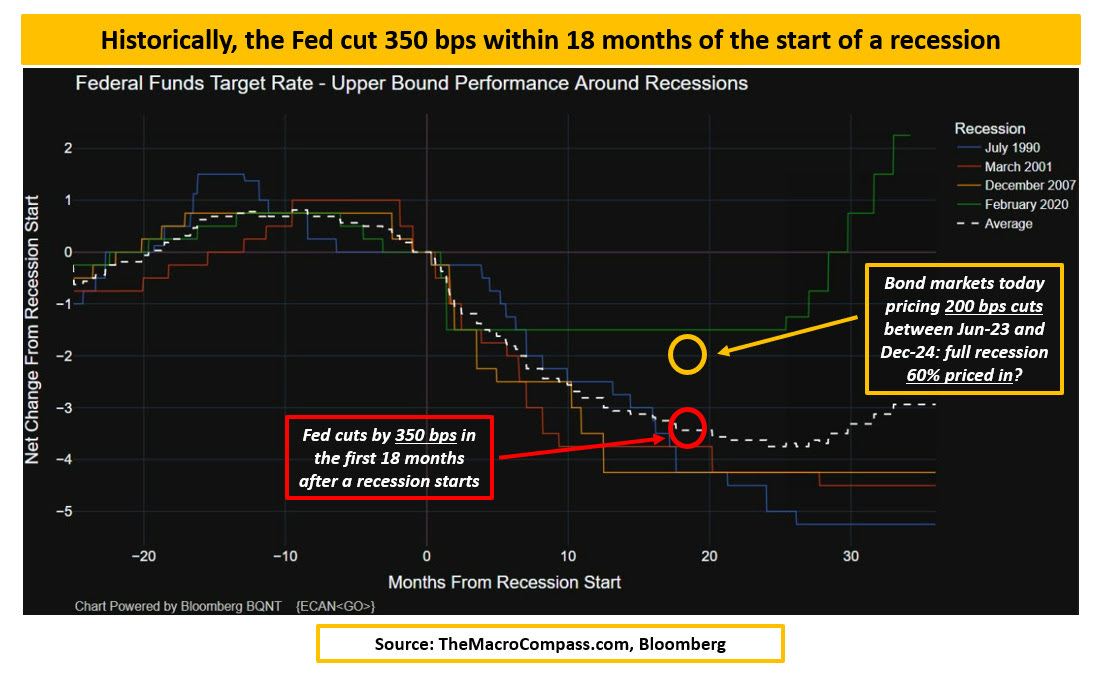
To elaborate, the data shows the Fed cut by about 350 basis points or so within 18 months of the start of a recession, Peccatiello said. Now, the markets are pricing a mid-2023 pivot with about 200 basis points of cuts between 2023 and 2024.
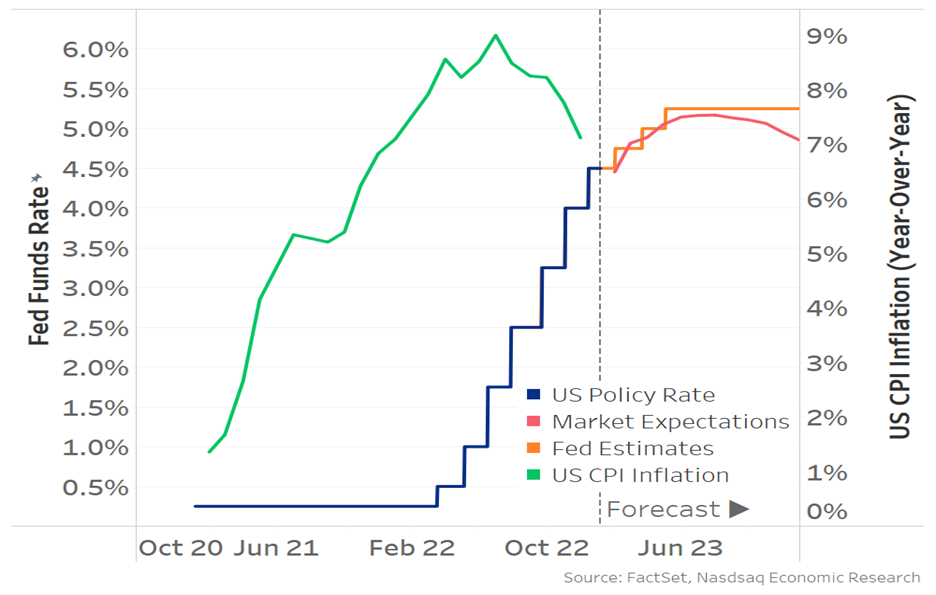
“That must mean the bond market’s base case (60%) is a recession,” Peccatiello said, noting that the Fed Funds is not pricing “below reasonable estimates of neutral rate (2.25-2.75% in nominal terms)” in the next 2-5 years. That means this would be the first time ever the US is in a recession and the Fed doesn’t cut rates below neutral.”
And, though downside earnings revisions are happening, the “2023 EPS consensus at $225 implies a +4% earnings growth this year [while] in [past] recessionary episodes the average EPS decline is instead -30%.”
“[C]yclical sectors and countries are outperforming defensive,” and there is little fear and desire to protect against far-reaching weakness. “Protection in the S&P 500 is at the cheapest levels in 2 years” as evidenced by “the implied volatility in 20% out-of-the-money SPX puts … trading in the lowest” percentiles.
But, as Karsan implied in his recent appearance, there’s a disconnect. The economy is not the stock market, and the liquidity context is poor, which many may not recognize.
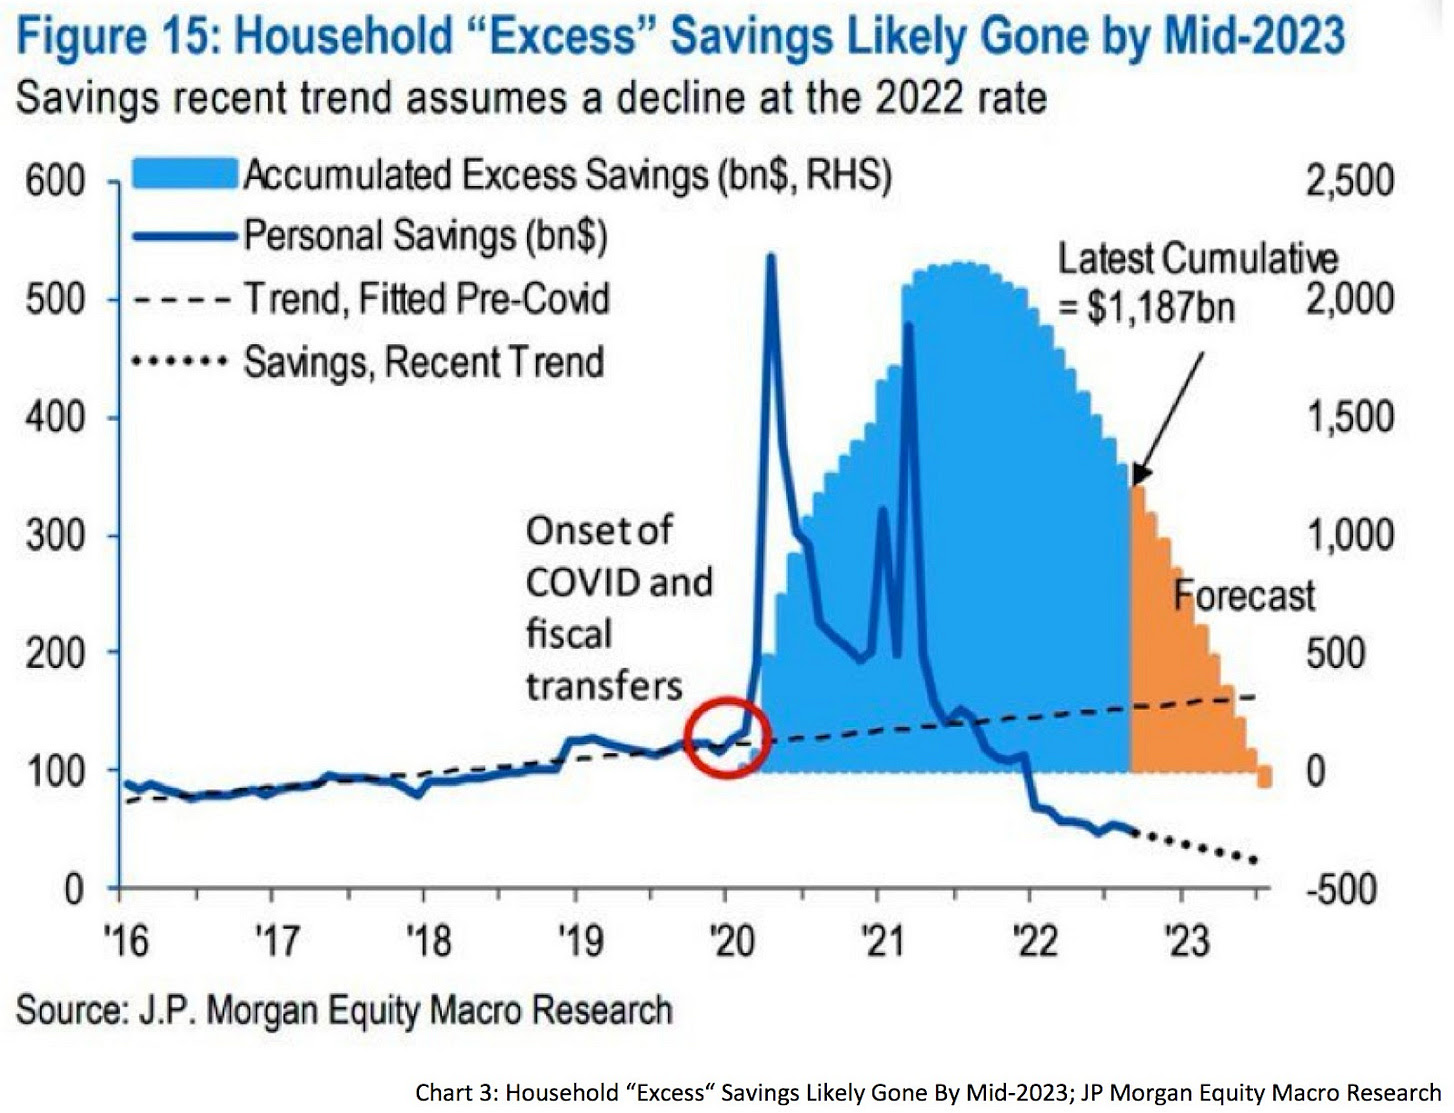
The economy performing well due to China reopening and strong demand among businesses surveyed, consumers’ savings excesses, persistent credit boom, and a strong labor market suggest inflation lasts longer.
Consequently, interest rates remain higher for longer and quantitative tightening is likely to persist. This is not so good for the financial economy.
“[B]lindly trusting the bond market could end badly,” Fabian Wintersberger added, noting that “recent bear market rallies in stocks and bonds will reverse” eventually.
Karsan appears to agree: though green shoots are likely to push better than expected economic performance, the Fed “is in a box” and this rally likely ends in early spring.
For now, the break of the 200-day moving average is a significant impetus since it’s a level many watch (i.e., technicals matter if enough people look at them). The chase is manifesting an SPX up, Cboe Volatility Index (INDEX: VIX) up dynamic (i.e., those who fear they may miss a rally bid volatility while the underlying market trades higher).
The Daily Brief for January 13 said “the more depressed technology names to the upside for debits [looked] attractive.”
Accordingly, Tesla Call Ratio Spreads have performed really well.
The 1/2 BACKRATIO TSLA 100 17 FEB 23 160/180 CALL is pricing in excess of a $1.00 credit to close, up about 400% in the span of 14 days or so.
A push likely lasts until mid-February, after which a window for weakness may open, particularly with the liquidity context (see the below video) no longer as supportive. However, if the market consolidates for a period after, this would be bullish.
To end, the median projection puts the S&P 500 at a level above $4,000.00 by year-end with the worst estimate putting the index at $3,000.00.
Joseph Wang explained, also, that there is an “increasing probability of a second bout of inflation, an issue in the 1970s that the Fed is keen to avoid … [by] retighten[ing] financial conditions … through its balance sheet” with an extended quantitative tightening or QT maintained “even if policy rates are cut.”
Given that QT is the flow of capital out of capital markets, this context presents more pressure on the financial economy (not necessarily the real economy).
Technical
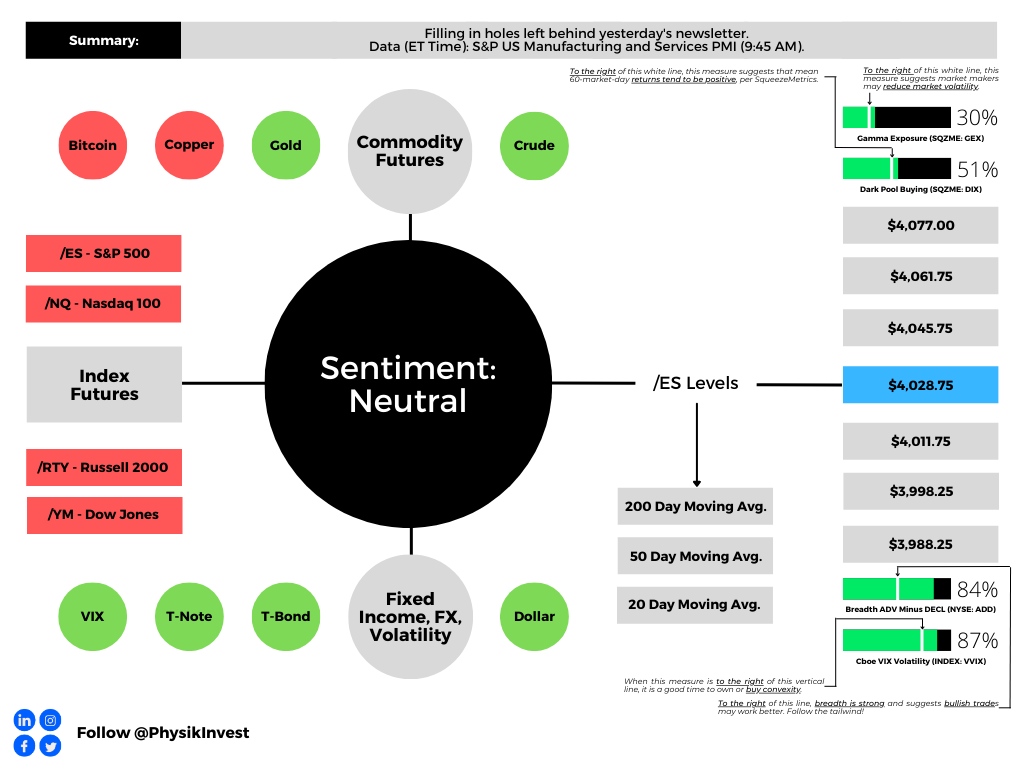
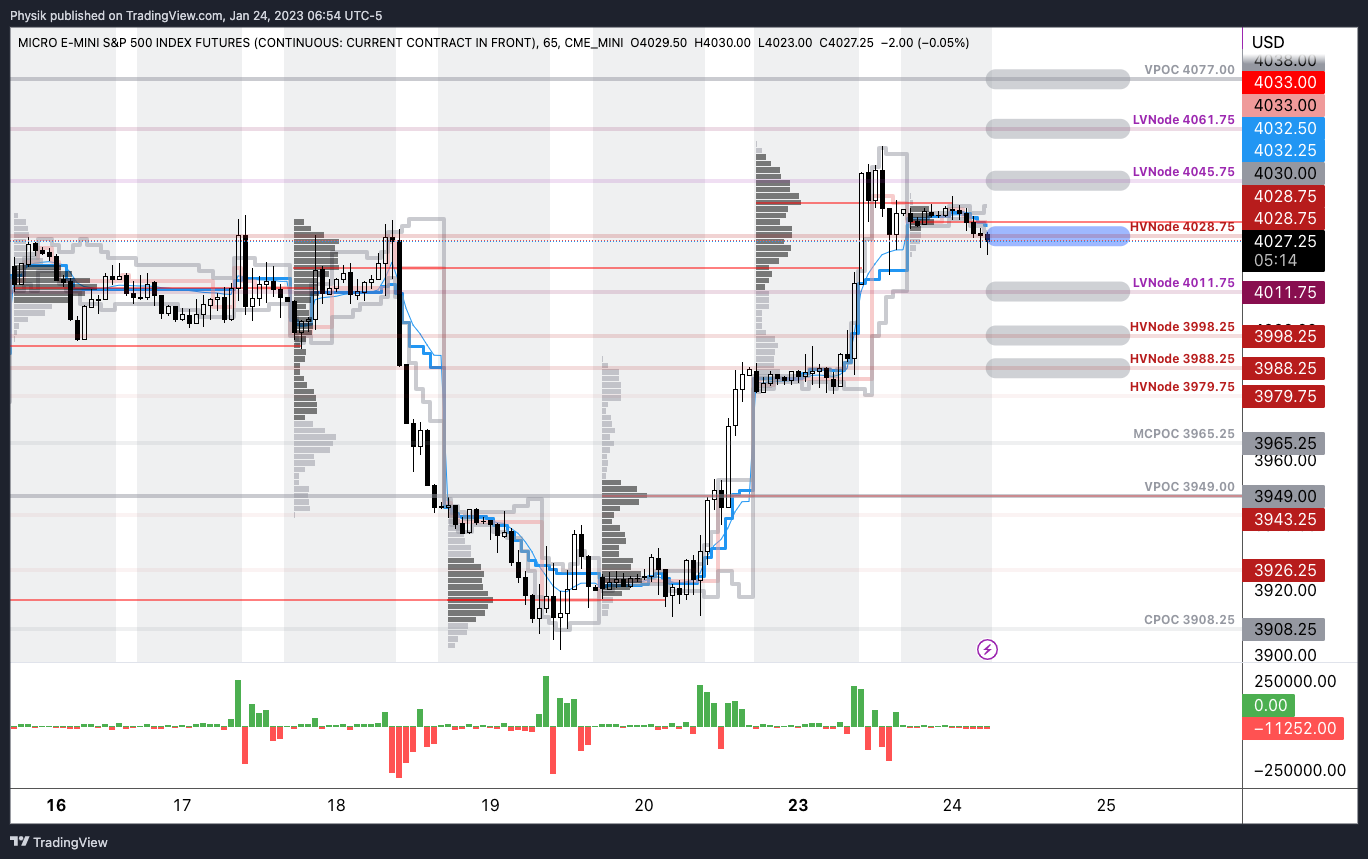
As of 6:55 AM ET, Tuesday’s regular session (9:30 AM – 4:00 PM ET), in the S&P 500, is likely to open in the bottom part of a negatively skewed overnight inventory, inside of prior-range and -value, suggesting a limited potential for immediate directional opportunity.
Our S&P 500 pivot for today is $4,028.75.
Key levels to the upside include $4,045.75, $4,061.75, and $4,077.00.
Key levels to the downside include $4,011.75, $3,998.25, and $3,988.25.
Click here to load updated key levels into the web-based TradingView platform. All levels are derived using the 65-minute timeframe. New links are produced, daily.
Definitions
Volume Areas: Markets will build on areas of high-volume (HVNodes). Should the market trend for long periods of time, it will be identified by low-volume areas (LVNodes). LVNodes denote directional conviction and ought to offer support on any test.
If participants auction and find acceptance in an area of a prior LVNode, then future discovery ought to be volatile and quick as participants look to HVNodes for favorable entry or exit.
Vanna: The rate at which the delta of an option changes with respect to implied volatility.
Charm: The rate at which the delta of an option changes with respect to time.
POCs: Denote areas where two-sided trade was most prevalent in a prior day session. Participants will respond to future tests of value as they offer favorable entry and exit.
Options: Options offer an efficient way to gain directional exposure.
If an option buyer was short (long) stock, he or she could buy a call (put) to hedge upside (downside) exposure. Additionally, one can spread, or buy (+) and sell (-) options together, strategically.
Commonly discussed spreads include credit, debit, ratio, back, and calendar.
- Credit: Sell -1 option closer to the money. Buy +1 option farther out of the money.
- Debit: Buy +1 option closer to the money. Sell -1 option farther out of the money.
- Ratio: Buy +1 option closer to the money. Sell -2 options farther out of the money.
- Back: Sell -1 option closer to the money. Buy +2 options farther out of the money.
- Calendar: Sell -1 option. Buy +1 option farther out in time, at the same strike.
In the most basic way, if bullish (bearish), sell at-the-money put (call) credit spread and/or buy a call (put) debit/ratio spread structured around target price. Alternatively, if the expected directional move is great (small), opt for a back spread (calendar spread). Also, if credit spread, seek to capture 50-75% of the premium collected. If debit spread, seek to capture 2-300% of the premium paid.
Be cognizant of risk exposure.
- Negative (positive) Delta = synthetic short (long).
- Negative (positive) Gamma = movement hurts (helps)
- Negative (positive) Theta = time decay hurts (helps).
- Negative (positive) Vega = volatility hurts (helps).
About
In short, Renato Leonard Capelj is an economics graduate working in finance and journalism.
Capelj spends most of his time as the founder of Physik Invest through which he invests and publishes daily analyses to subscribers, some of whom represent well-known institutions.
Separately, Capelj is an equity options analyst at SpotGamma and an accredited journalist interviewing global leaders in business, government, and finance.
Past works include conversations with investor Kevin O’Leary, ARK Invest’s Catherine Wood, FTX’s Sam Bankman-Fried, Lithuania’s Minister of Economy and Innovation Aušrinė Armonaitė, former Cisco chairman and CEO John Chambers, and persons at the Clinton Global Initiative.
Contact
Direct queries to renato@physikinvest.com or Renato Capelj#8625 on Discord.
Calendar
You may view this letter’s content calendar at this link.
Disclaimer
Do not construe this newsletter as advice. All content is for informational purposes.


One reply on “Daily Brief For January 24, 2023”
[…] rallied in the face of incredibly bearish sentiment and off-sides positioning. The detailed Daily Brief for January 24 discussed this […]