Big news includes Netflix Inc (NASDAQ: NFLX) beating earnings estimates but having a weaker-than-expected forecast, Tesla Inc (NASDAQ: TSLA) cutting prices the sixth time this year, Meta Platforms Inc (NASDAQ: META) and Walt Disney Co (NYSE: DIS) commencing layoffs, and mortgage rates edging higher to ~6.4%.
Graphic: Retrieved from Bloomberg. “US mortgage rates increased last week by the most in two months to 6.43%, denting already sluggish demand.”
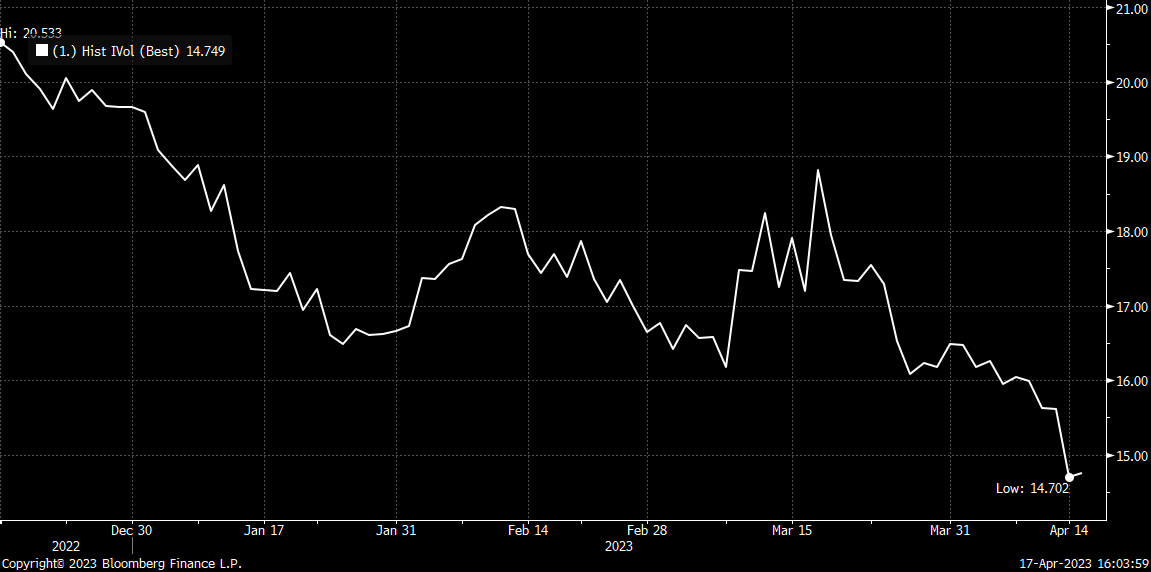
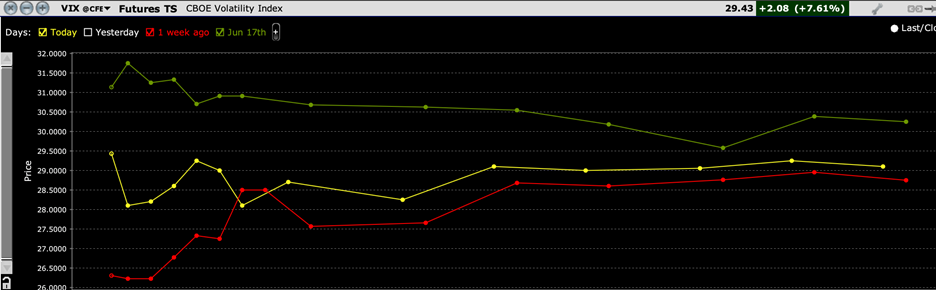
Equity markets are down, and equity implied volatility (IVOL) measures, including the Cboe Volatility Index or VIX, are climbing. Notwithstanding, the trend lower in IVOL is intact, and that’s good for traders biased short volatility.
Graphic: Retrieved from Bloomberg via Danny Kirsch of Piper Sandler Companies (NYSE: PIPR). Call option volatility for the $4,150.00 strike. May monthly expiration.
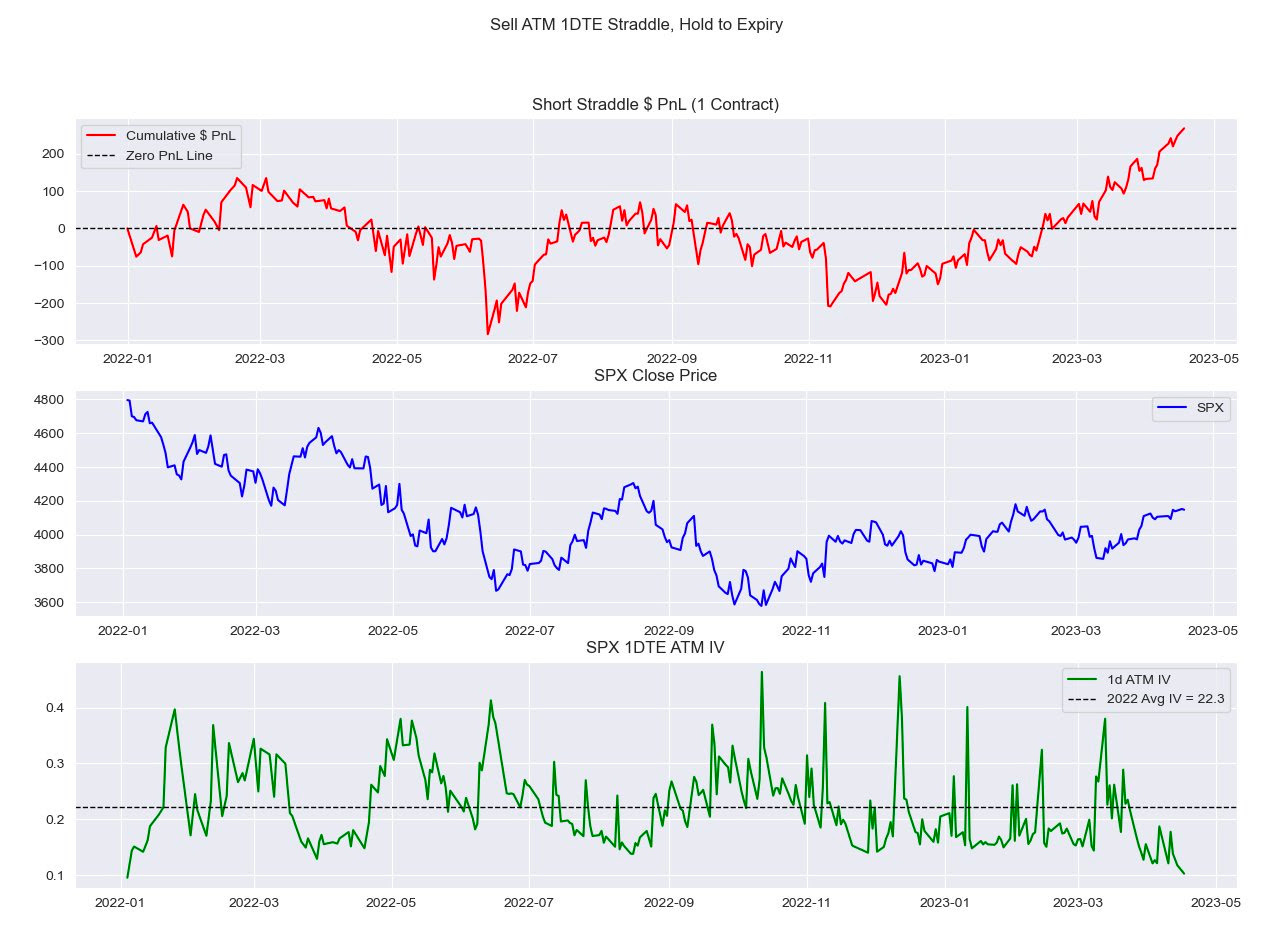
“With all the focus [on S&P 500 (INDEX: SPX)] 0 DTE lately, I look at how expensive these have been since 2022,” IPS Strategic Capital’s Pat Hennessy says, referencing a backtest he conducted selling a 1 DTE straddle and holding till maturity.
“Performance since the November CPI has been stellar, with a 63% win rate and an average gain of $20.00.”
Graphic: Retrieved from IPS Strategic Capital’s Pat Hennessy.
Volatility trader Darrin John agrees, noting volatility remains expensive, a detriment to those who may be biased long volatility.
“The VRP is so wide across all of the tenors I track,” John elaborates. “It’s going to be hard for gamma buyers to cover daily theta bills.”
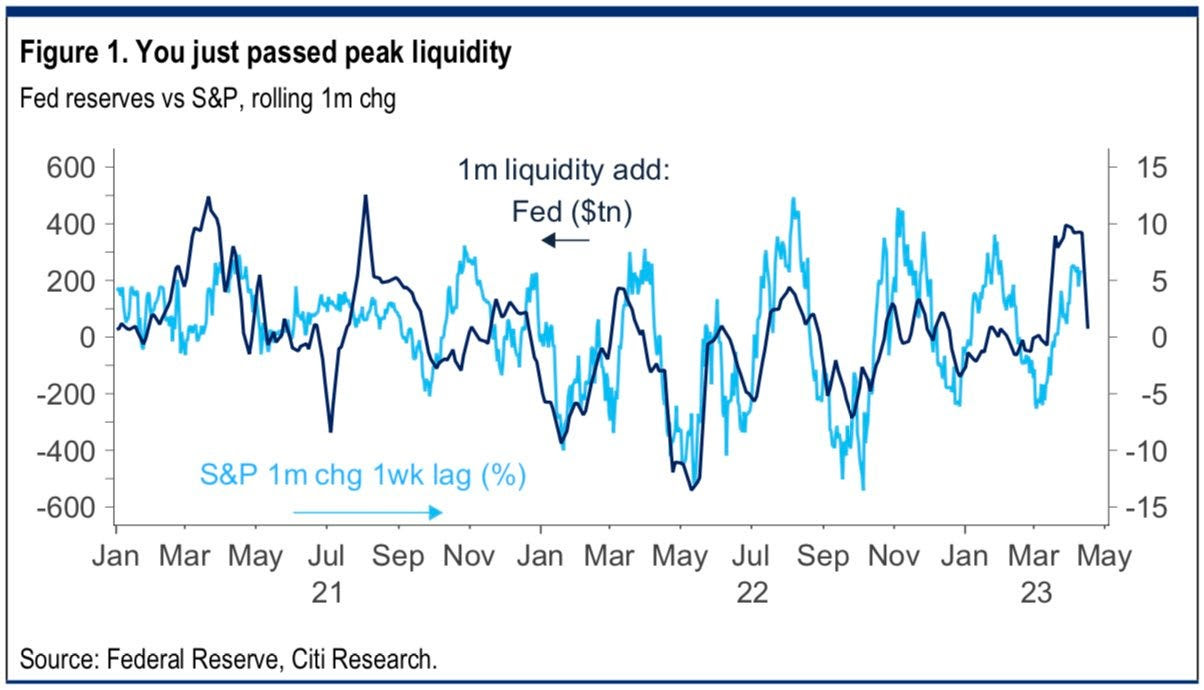
Clouds are appearing on the horizon, however, and the trend higher (lower) in stocks (volatility) may not last. Bloomberg forecasts the largest fall in SPX earnings since the start of 2020. Notwithstanding, strength can continue for longer …
Graphic: Retrieved from Citigroup Inc Research (NYSE: C) via @tr8derz. “YTD rally stems from $1tn in CB liquidity. High-frequency indicators suggest this is already stalling, and coming weeks seem increasingly likely to bring a sharp reversal. Higher TGA and RRP, ECB QT and reduced China easing could easily see a net drain of some $6-800bn.”
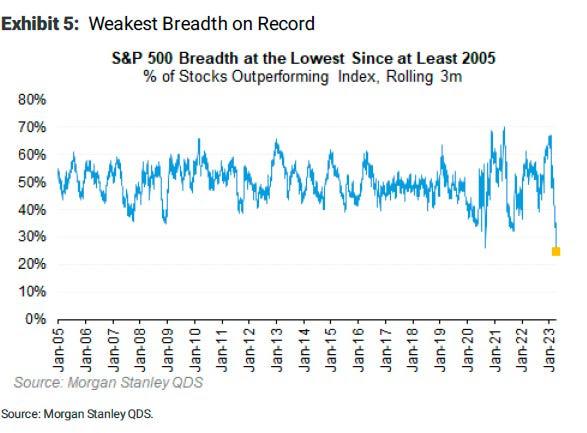
… even with the SPX breadth reading poor. The SPX has rallied with multiples rising; strength came with positive earnings surprises, bond demand, and other things.
Graphic: Retrieved from Morgan Stanley (NYSE: MS) via Bloomberg.
Hence, at the risk of sounding like a broken record, the low-cost call structures we’ve talked about in the past remain attractive.
If markets move higher, you can monetize and roll profits into put spreads (i.e., buy put and sell another at a lower strike). This may work well if JPMorgan Chase & Co’s (NYSE: JPM) call that “even a mild recession would warrant retesting the previous lows” is realized.
Such structures work well as “a big pop in the market can result in a decent drop in the VIX…and vice versa, a market sell-off will result in a greater increase in the VIX now than it did in 2022,” says Alpha Exchange.
Alternatively, lean neutral and buy into cash or bonds yielding 4-5%. Some long box spreads yield 5.4% as of yesterday’s close.
In other news, Physik Invest’s first in-depth note is nearing completion and will be available for public viewing in short order. Take care and watch your risk!
About
Welcome to the Daily Brief by Physik Invest, a soon-to-launch research, consulting, trading, and asset management solutions provider. Learn about our origin story here, and consider subscribing for daily updates on the critical contexts that could lend to future market movement.
Separately, please don’t use this free letter as advice; all content is for informational purposes, and derivatives carry a substantial risk of loss. At this time, Capelj and Physik Invest, non-professional advisors, will never solicit others for capital or collect fees and disbursements. Separately, you may view this letter’s content calendar at this link.
The daily brief is a free glimpse into the prevailing fundamental and technical drivers of U.S. equity market products. Join the 1,200+ that read this report daily, below!
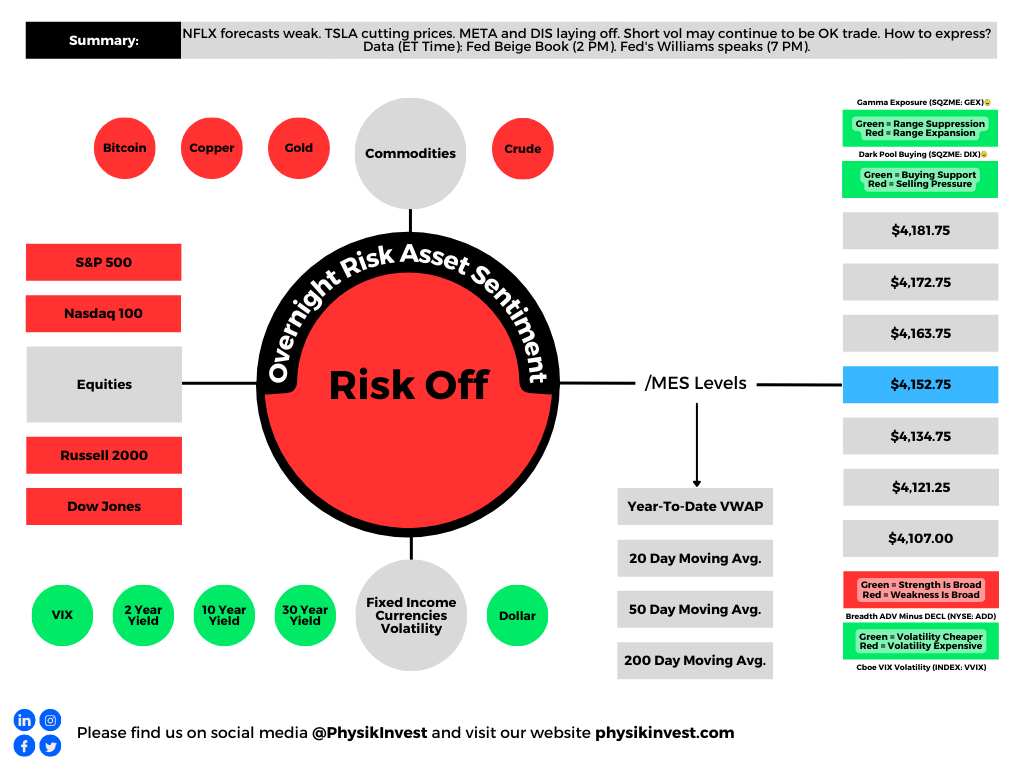
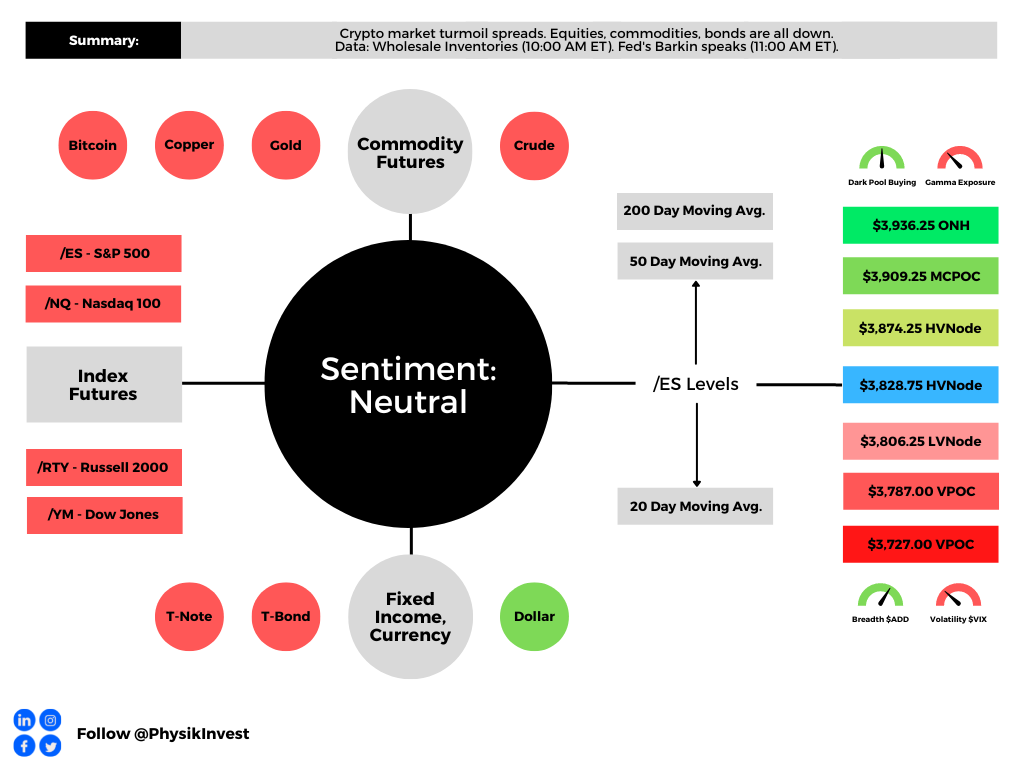
Graphic updated 8:45 AM ET. Sentiment Neutral if expected /ES open is inside of the prior day’s range. /ES levels are derived from the profile graphic at the bottom of the following section. Levels may have changed since initially quoted; click here for the latest levels. SqueezeMetrics Dark Pool Index (DIX) and Gamma (GEX) calculations are based on where the prior day’s reading falls with respect to the MAX and MIN of all occurrences available. A higher DIX is bullish. At the same time, the lower the GEX, the more (expected) volatility. Learn the implications of volatility, direction, and moneyness. Breadth reflects a reading of the prior day’s NYSE Advance/Decline indicator. VIX reflects a current reading of the CBOE Volatility Index (INDEX: VIX) from 0-100.
Fundamental
A crypto-market leader and a lender of last resort – FTX – co-founded by Sam Bankman-Fried (SBF) was little questioned by many. It appears, however, that the company had growing pain points.
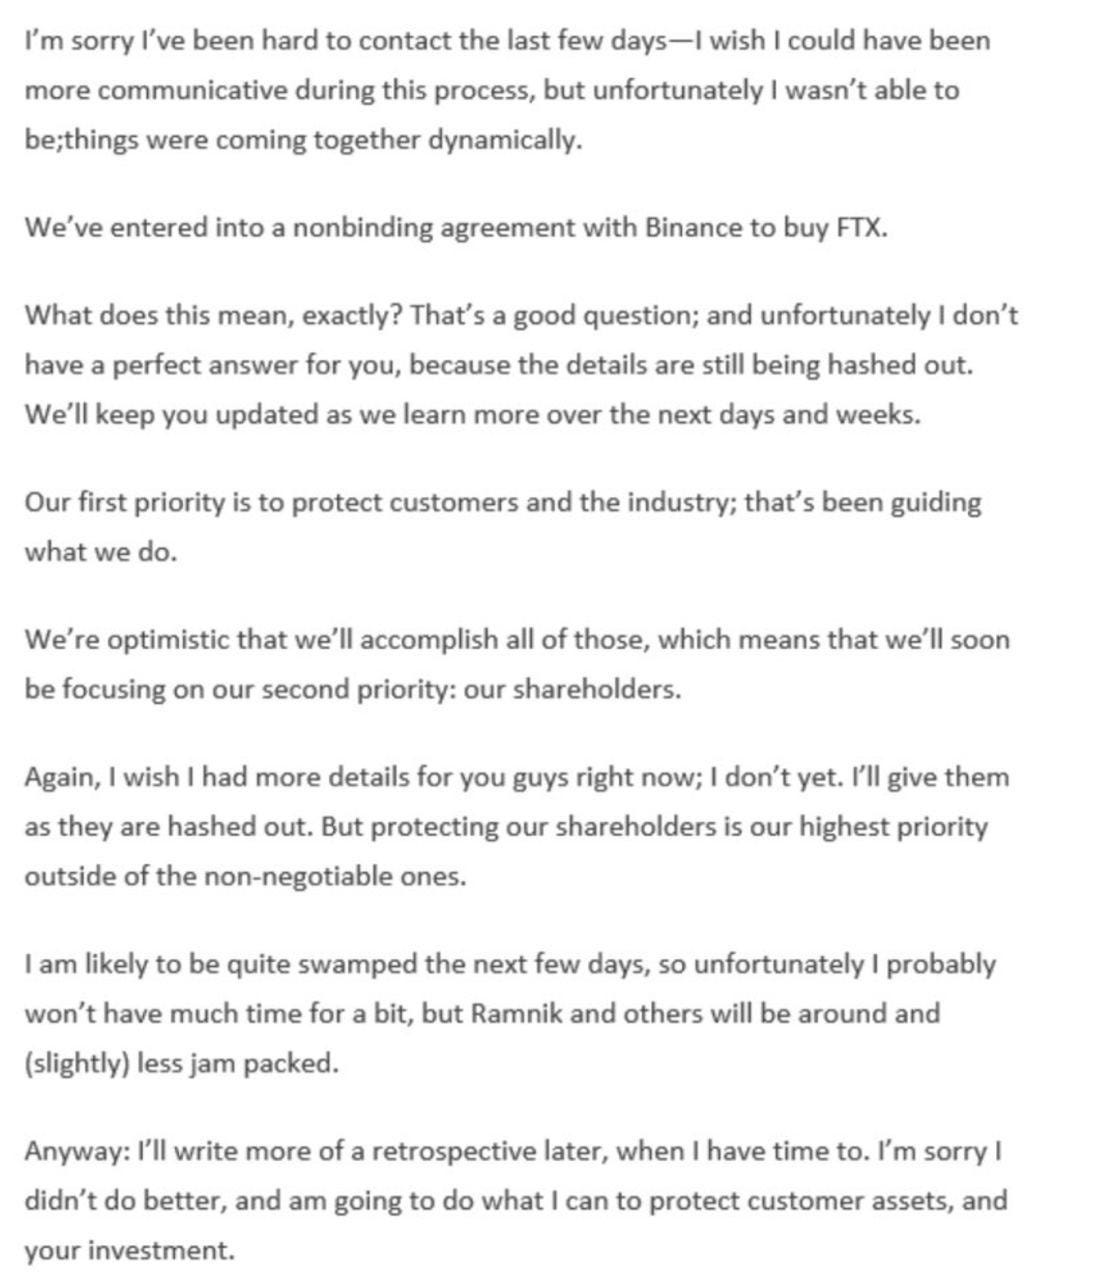
Events are developing quickly, too add. Here is a note that SBF issued to investors after entering into a nonbinding agreement with Binance.
Graphic: Retrieved from @gurgavin on Twitter. Read the story on The Block.
In short, there’s little substance.
Let’s go through the motions and start unpacking this debacle. Should we have loose ends, we’ll address those in the coming days.
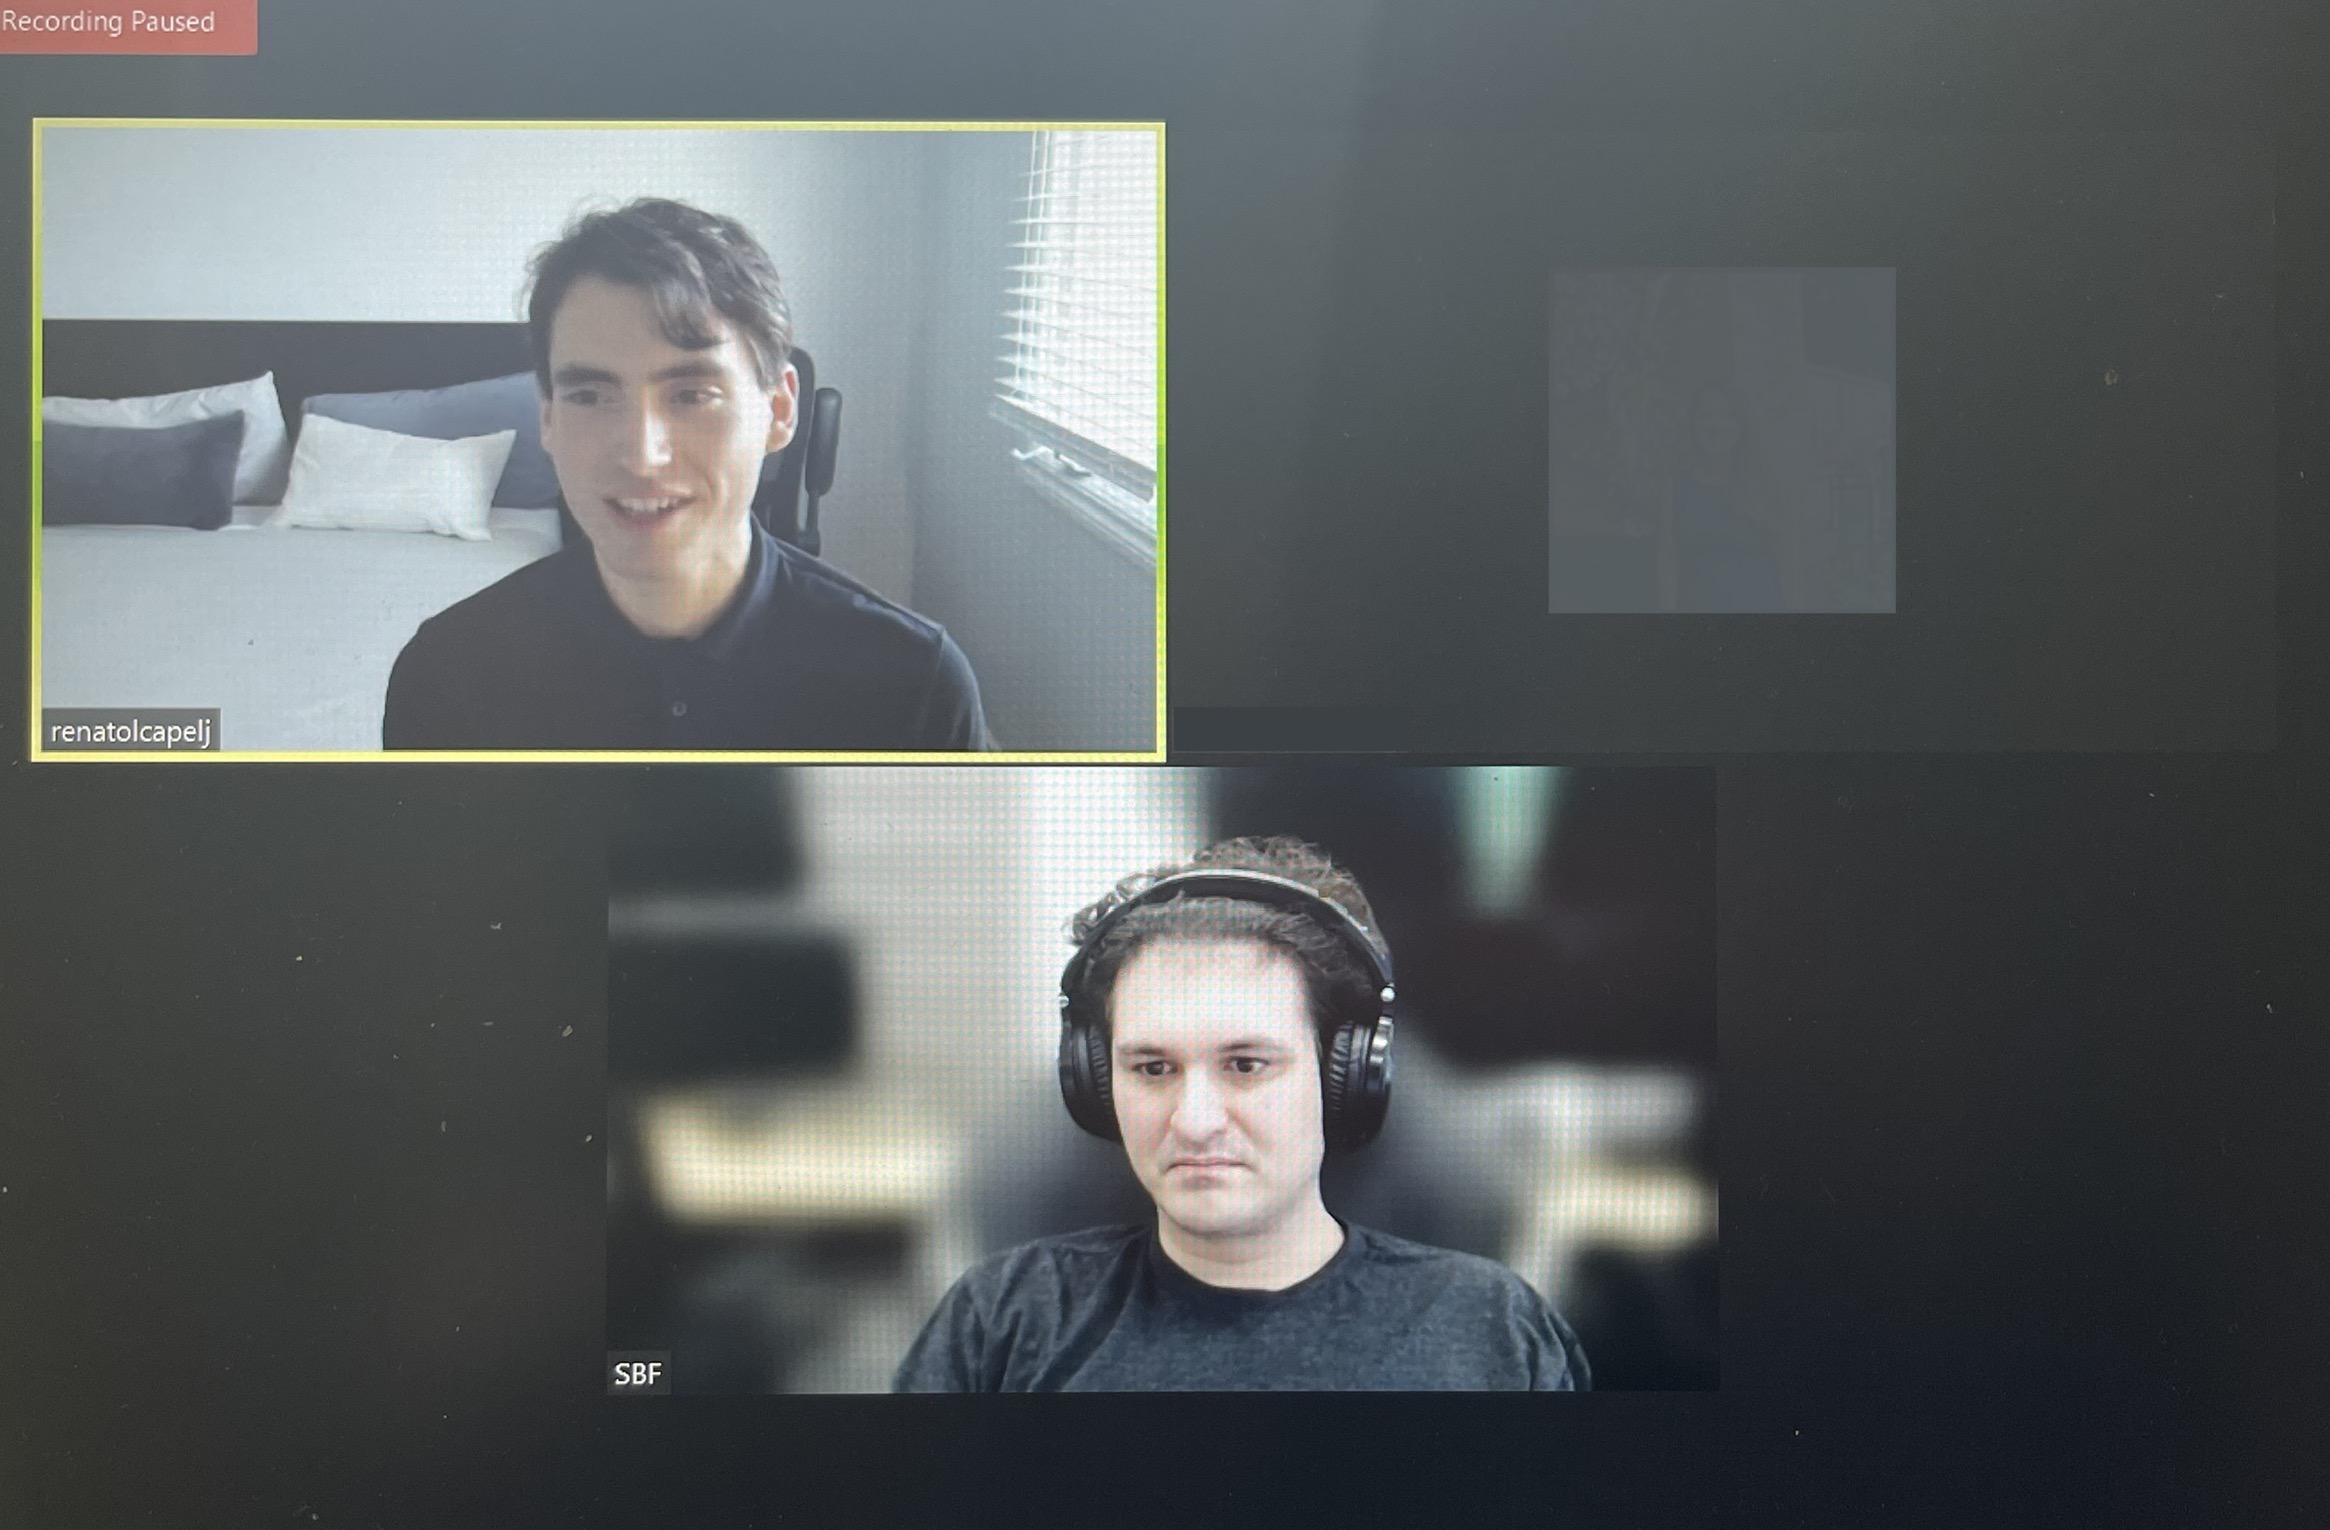
In late December of 2021, I spoke with SBF regarding his background and aims with FTX. The resulting work was published on Benzinga.com, where I continue to work part-time as a writer and project lead.
Graphic: Retrieved from Renato Leonard Capelj. On the top is Renato Leonard Capelj. On the bottom is SBF.
In short, SBF is an MIT alumnus who started in finance at Jane Street, a trading firm and liquidity provider. Eventually, he saw an opportunity elsewhere; there were spot price inconsistencies across cryptocurrency exchanges.
SBF then founded the firm Alameda Research in 2017. A focus, there, was to extract premiums to spot via arbitrage. SBF et al would purchase Bitcoin (CRYPTO: BTC) domestically, send it to foreign exchanges to sell at higher prices, and, then, convert and wire the funds back.
“You do have to put together this incredibly sophisticated global corporate framework in order to be able to actually do this trade,” SBF said in one conversation. “That’s the real task, the real hard part.”
In light of some frustration with existing exchange offers, SBF founded FTX.com and FTX.US parent FTX Trading Ltd. As late as September 2022, FTX was seeking $1 billion at a value of $32 billion. The firm was looking to become a one-stop-shop for retail and institutional market participants such as FTX brand ambassador and spokesperson Kevin O’Leary who I talked to just prior to my interview with SBF.
“If you’re being compliant internally and also with regulators in each jurisdiction you operate in, you don’t have the option to be off-sides,” O’Leary explained to me on FTX building one of the larger infrastructures institutions’ compliance departments could easily “work with and external auditors can audit.”
Eventually, the exchange grew to become a major player.
FTX was a top-five exchange, adding market share through acquisitions of players like Blockfolio and LedgerX, as well as building a reputation of transparency, or so it appeared, through its work with regulators.
Adding, SBF said to me he wanted FTX to cater to other asset classes and “become a global liquidity venue across the board.” In mid-to-late this year, FTX added stock trading via no-fee brokerage accounts, a follow-through on his vision.
The expansion narrative cooled, however. There was the collapse of the TerraUSD stablecoin, Celsius Network, Three Arrows Capital, and Voyager Digital, which FTX’s subsidiary in the US, FTX.US, won assets to in an auction this year.
At the surface, it appeared FTX was “seemingly untouchable,” as Immutable Holdings’ Jordan Fried explained online. Check out my last chat with Jordan Fried, here.
However, “cracks started to appear [and] people in crypto were taking notice”; the CEOs of both Alameda Research and FTX.US stepped down. Fried added that the situation worsened when Alameda Research’s balance sheet was leaked.
The firm had $14.6 billion in assets (nearly $4 billion in FTT, which is FTX’s utility token, and about $2 billion in FTT token collateral) against $8 billion in liabilities.
“Binance owns a bunch of FTT themselves and, two days ago, Changpeng Zhao (CZ) [who is the] founder of Binance, [said] that SBF … could be lobbying to get regulators to help out FTX more than Binance.” In response, CZ was to “dump all $2 billion of FTT” Binance was holding.
This coincided with a large selling pressure on the FTX utility token. With Alameda Research having ~50% of their assets in FTT, Fried says, “they were dead in the water”. A run appeared likely and, with FTX and Alameda Research’s dealings so intertwined, “the failure of one meant the failure of another.”
On the heels of billions in withdrawals, users weren’t “getting their cash” and, ultimately, in SBF seeking to protect users’ assets, FTX entered into a strategic transaction with Binance.
1) Hey all: I have a few announcements to make.
Things have come full circle, and https://t.co/DWPOotRHcX’s first, and last, investors are the same: we have come to an agreement on a strategic transaction with Binance for https://t.co/DWPOotRHcX (pending DD etc.).
The follow-on impacts of this week’s events, during which SBF saw a ~90% wipeout of his wealth, can be speculated on. Apparent losers include SoftBank Group Corporation’s (OTC: SFTBY) Vision Fund, the Ontario Teachers’ Pension Plan, and Tiger Global Management.
Some, including Arthur Breitman of Tezos (CRYPTO: XTZ), mulled the impact of FTX’s potential divestment from Solana (CRYPTO: SOL) which “took a drubbing Tuesday,” along with just about every other crypto token including Bitcoin.
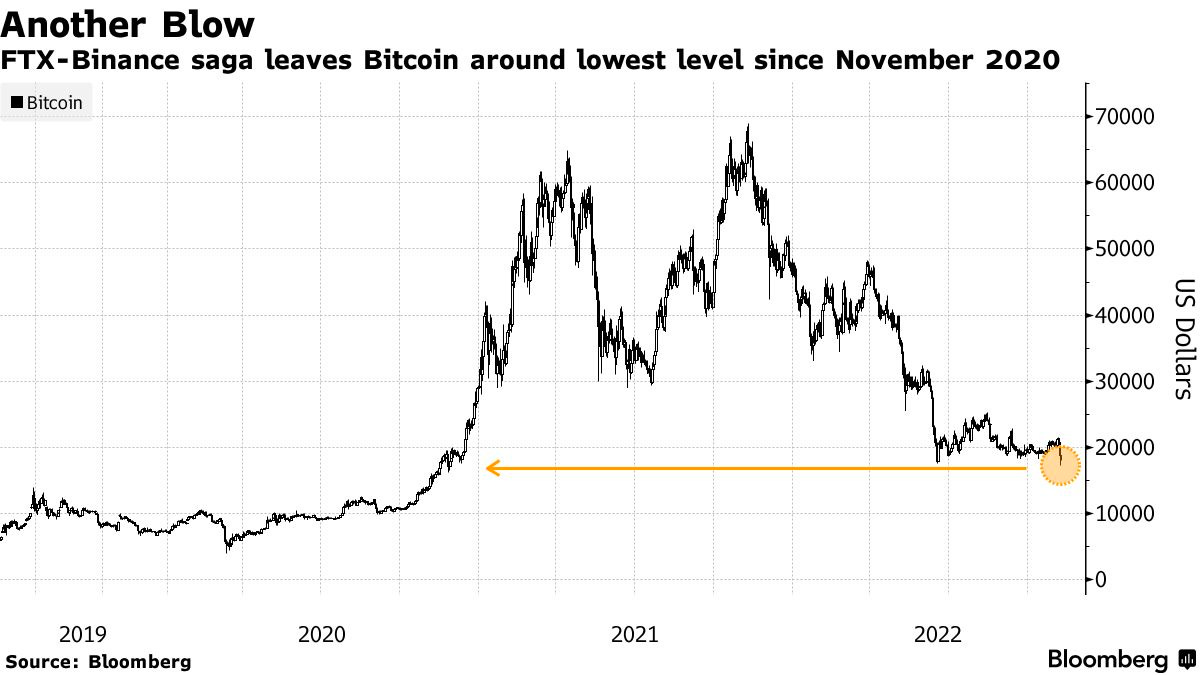
Noteworthy are the impacts of this crypto-market turmoil in equities. As I stated in a note to SpotGamma subscribers yesterday, following “news of a liquidity crunch at FTX, when the selling accelerated in FTT [] and Bitcoin, so did the selling in the S&P 500.”
“The bottom, in all three products, happened at 2:30 PM ET.”
Graphic: Retrieved by Physik Invest from TradingView.
I add that these products – S&P 500 (INDEX: SPX) and Bitcoin – have traded in sync and held positive correlations.
In short, both are recipients of the same risk-on and -off flows. Easy monetary policies cut financial asset volatility and pushed market participants into riskier investments. In short, it was easier to borrow and make longer-duration bets on ideas (e.g., crypto and Ponzi-like DeFi, growth, risky private equity investments) with a lot of promise in the future.
Financial asset investments were more attractive. That’s, in part, why we saw asset inflation early on in 2020 when policymakers embarked on historic interventions.
Monetary authorities cut interest rates and bought bonds, all the while money was sent to people. Risk assets were the first to respond. Then, as the economy reopened, demand picked up, supply chains tightened, and prices in the real economy inflated.
As we added on Monday, de-globalization and persistent supply chokepoints (e.g., Ukraine and Russia) have done little to help. Inflation remains a problem and investors are seeking safety amid Fed intervention.
Financial assets are in less demand while real assets are in more demand. A disruption (or reversal) in these policies puts at risk the prevailing carry regime. A stock and crypto market drop is, in part, the result of an unwind in carry.
The drop is a deflationary shock, precisely what policymakers are seeking, per Credit Suisse Group AG’s (NYSE: CS) Zoltan Pozsar who says inflation is a structural issue, and “we [have] to generate a round of negative wealth effects to lower demand such that it becomes more in line with the new realities of supply.”
As we established on Monday, that invokes “collateral damage to the US economy,” S&P Global Inc (NYSE: SPGI) economists have put forth “as households and businesses pull back spending and investment.”
For example, just announced today, Meta Platforms Inc (NASDAQ: META), which became wrapped up in the speculativeness of the early 2020s reaching beyond the crypto markets, hence the name change from Facebook Inc, is seeking to cut 11,000 jobs.
Per Bloomberg, “the macroeconomic downturn, increased competition, and ads signal loss have caused [] revenue to be much lower than expected.”
Ultimately, a deflationary pulse manifesting disinflation in consumer prices may prompt the policymakers to reverse on rates and efforts like quantitative tightening (QT), the (out)flow of capital from capital markets.
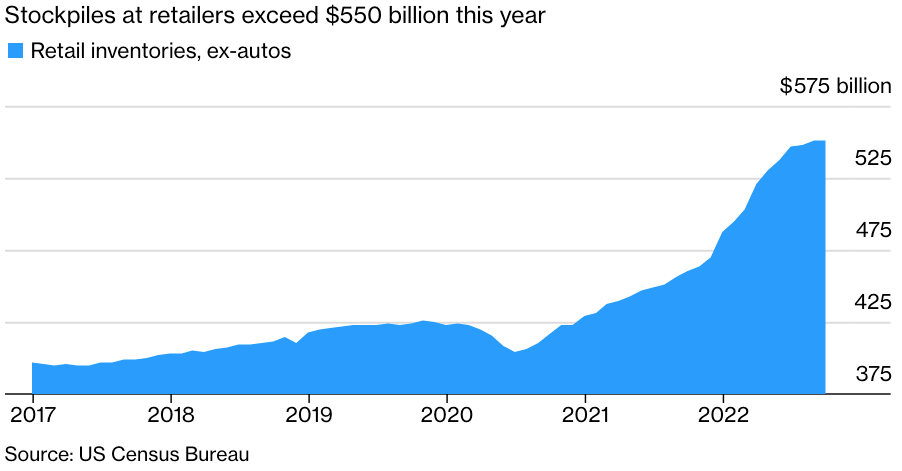
We’re seeing demand erode and many businesses starting to suffer the effects of a switch to “just-in-case” from “just-in-time,” according to S&P Global Inc. Inventories (which are to be sold at a loss) are piling up and workers are needed less.
That’s a recession.
Graphic: Retrieved from Bloomberg. “The overhang is leading to canceled orders, a sharp slowdown in global trade growth and stagnating factory activity. On one hand, it’s good that logistics networks are seeing relief from the logjams that plagued the start of 2022 — ocean-shipping rates have tumbled close to pre-pandemic levels and delivery times are shortening.”
This said, the “risk of recession, whether it is real or merely implied by an inversion of the yield curve, won’t deter the Fed from hiking rates higher faster or from injecting more volatility to build up negative wealth effects.”
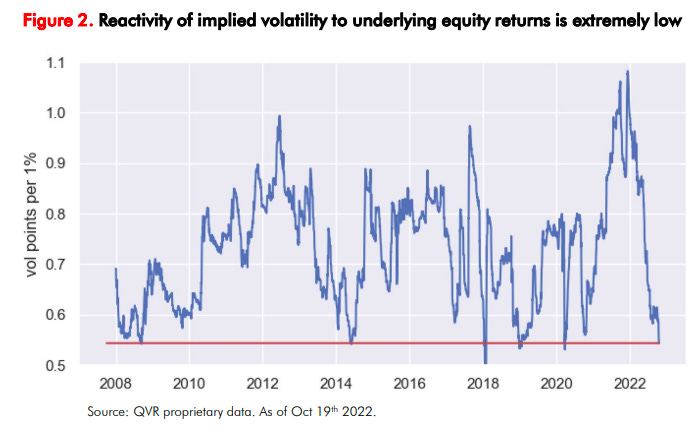
“Rallies could beget more forceful pushback from the Fed,” which is a concern given the poor performance in implied volatility (IVOL) that’s resulted in participants’ disinterest in maintaining their hedges this year; equities’ left tail is growing.
Graphic: Retrieved from Bloomberg. Initially created by QVR Advisors. “When shares drop, demand for fresh protection remains subdued given the unusually thin positioning among big money. At the same time, put owners quickly book profits, often leading to a drop in implied vol.
In summary, there’s no longer “a disinterest and unimportance to cash flows.” The commitment to reducing liquidity and credit has consequences on the real economy and asset prices which rose and kept the deflationary pressure of policies at bay.
It is elevated volatility and persistent declines that are to prompt investors to lower their selling prices in risk(ier) assets (e.g., options bets, metals, cryptocurrency and stablecoins, equities, bonds), and compete for cash.
Positioning
Based on traders’ current positioning, the market, absent exogenous shocks, is more so prone to sharp upside reversals and a slow(er) grind lower.
As the former Bridgewater Associate Andy Constan explained to me once, therefore, you “want Deltas and leverage” via options trades that are defined risk and two-to-four months out in maturity.
We shall go more into this, later.
Technical
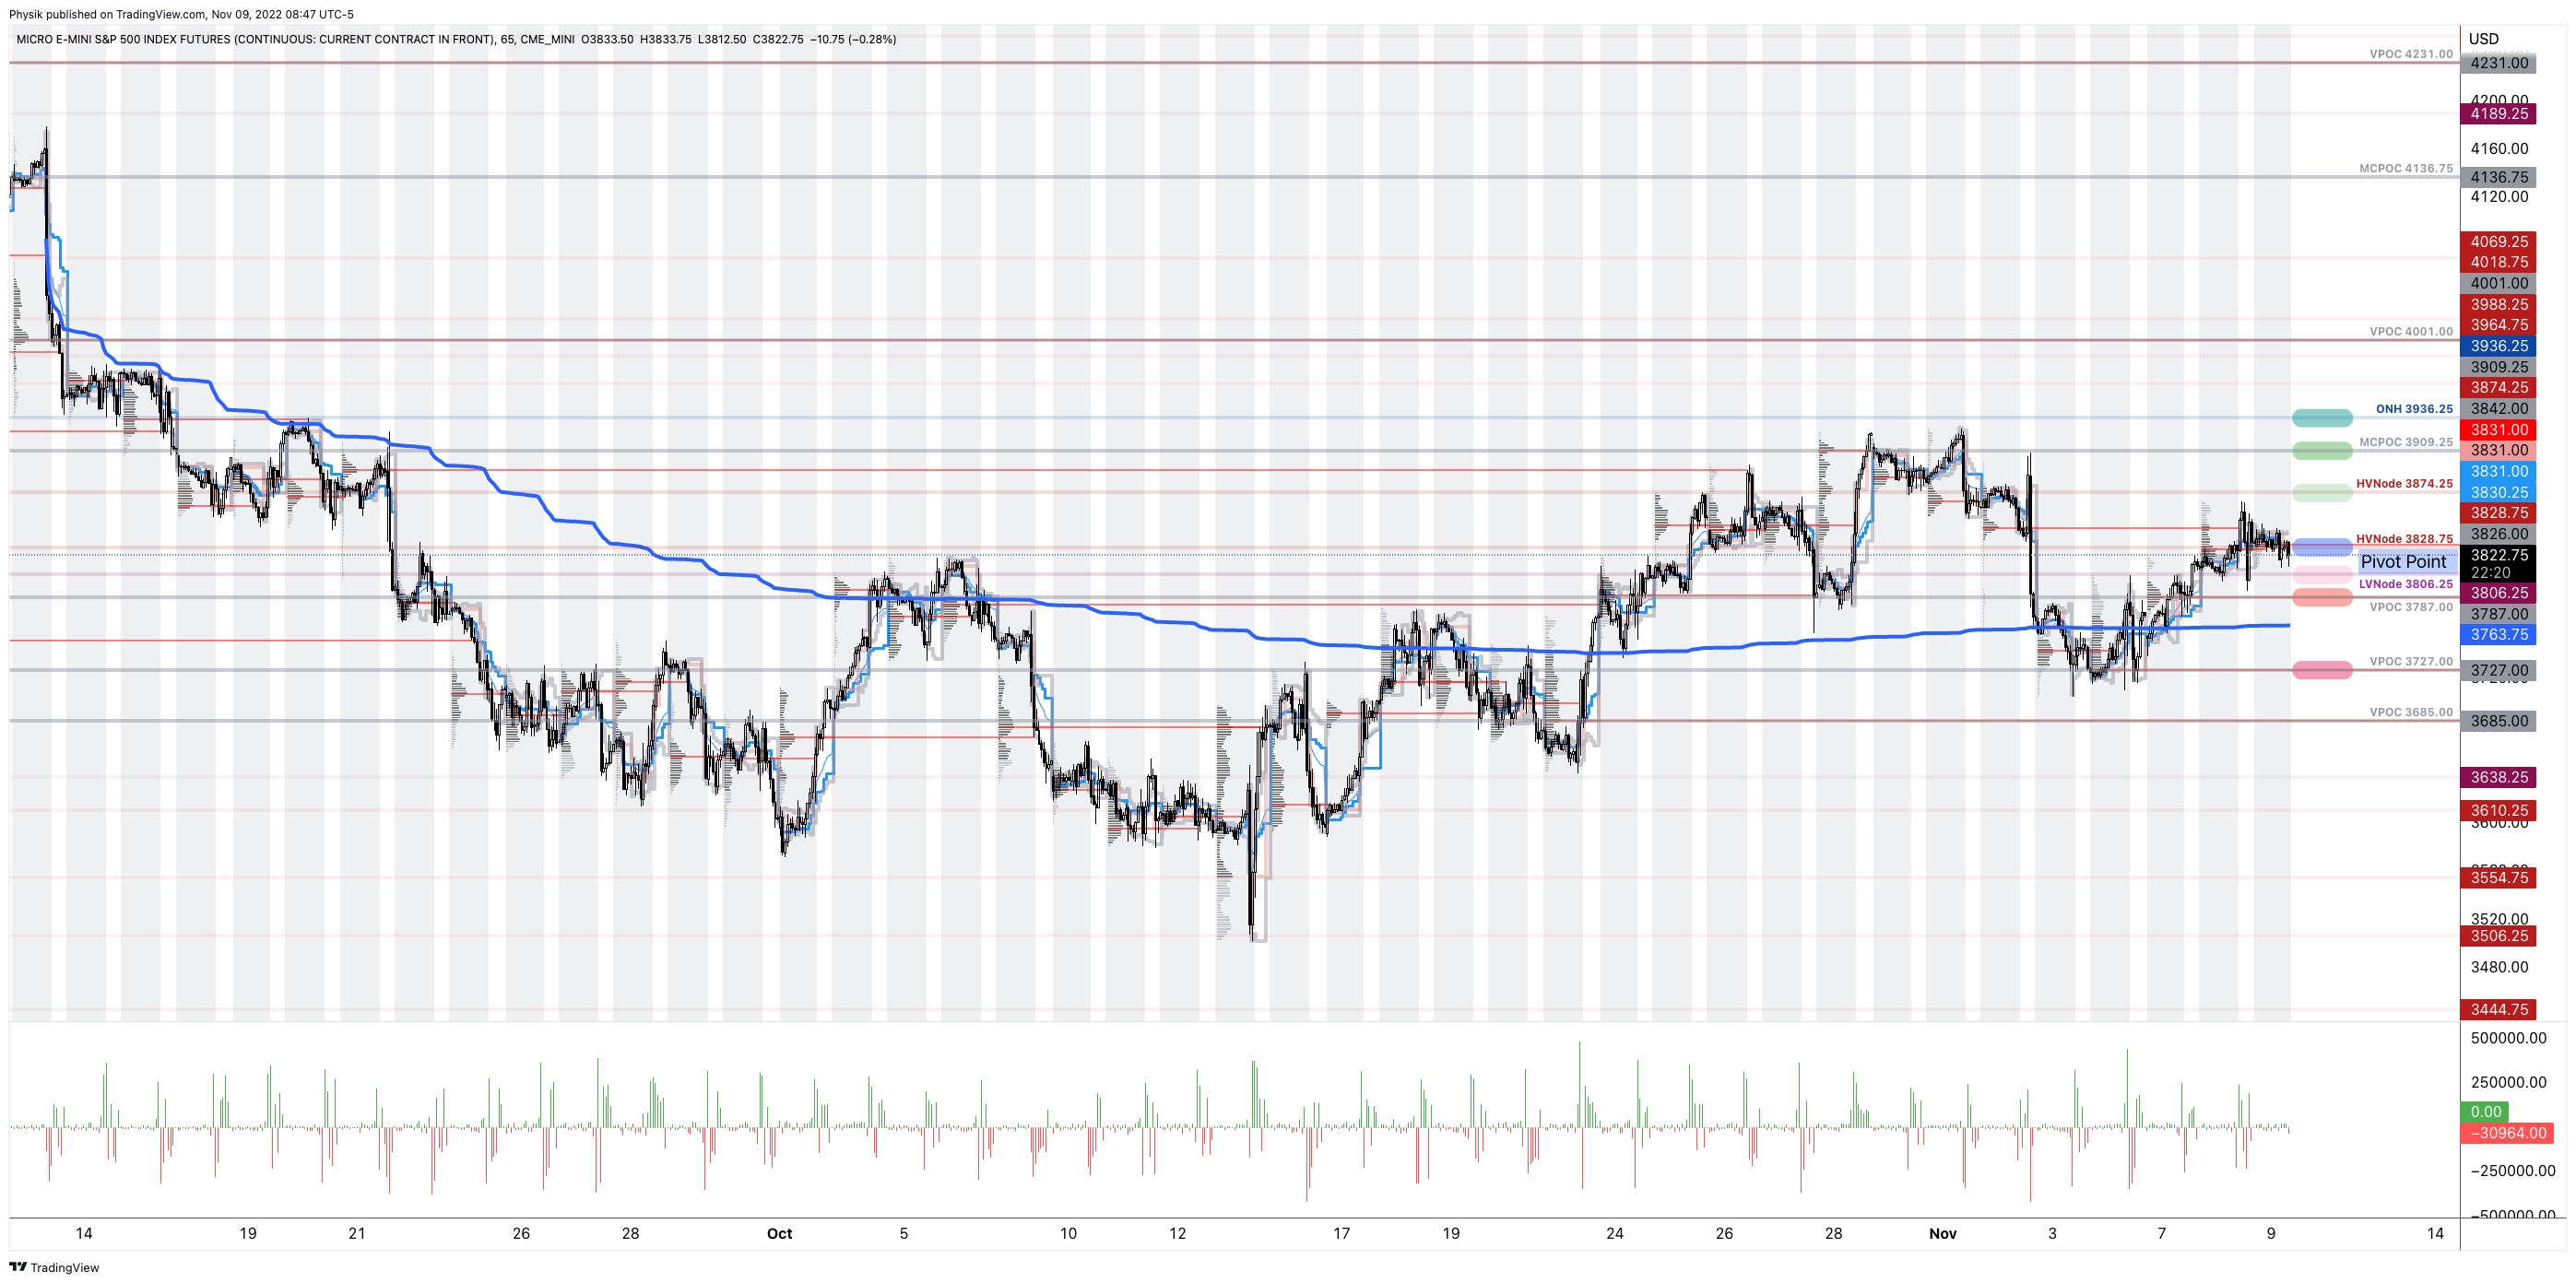
As of 8:45 AM ET, Wednesday’s regular session (9:30 AM – 4:00 PM ET), in the S&P 500, is likely to open in the lower part of a negatively skewed overnight inventory, inside of prior-range and -value, suggesting a limited potential for immediate directional opportunity.
In the best case, the S&P 500 trades higher.
If above the $3,828.75 HVNode, the $3,874.25 HVNode is in play. Initiative trade beyond the latter could reach as high as the $3,909.25 MCPOC and $3,936.25 ONH, or higher.
In the worst case, the S&P 500 trades lower.
If above the $3,828.75 HVNode, the $3,806.25 LVNode is in play. Initiative trade beyond the latter could reach as low as the $3,787.00 VPOC and $3,727.00 VPOC, or lower.
Click here to load today’s key levels into the web-based TradingView charting platform. Note that all levels are derived using the 65-minute timeframe. New links are produced, daily.
Graphic: 65-minute profile chart of the Micro E-mini S&P 500 Futures.
Definitions
Volume Areas: A structurally sound market will build on areas of high volume (HVNodes). Should the market trend for long periods of time, it will lack sound structure, identified as low volume areas (LVNodes). LVNodes denote directional conviction and ought to offer support on any test.
If participants were to auction and find acceptance into areas of prior low volume (LVNodes), then future discovery ought to be volatile and quick as participants look to HVNodes for favorable entry or exit.
POCs: POCs are valuable as they denote areas where two-sided trade was most prevalent in a prior day session. Participants will respond to future tests of value as they offer favorable entry and exit.
MCPOCs: POCs are valuable as they denote areas where two-sided trade was most prevalent over numerous day sessions. Participants will respond to future tests of value as they offer favorable entry and exit.
About
After years of self-education, strategy development, mentorship, and trial-and-error, Renato Leonard Capelj began trading full-time and founded Physik Invest to detail his methods, research, and performance in the markets.
Capelj also develops insights around impactful options market dynamics at SpotGamma and is a Benzinga reporter.
In no way should the materials herein be construed as advice. Derivatives carry a substantial risk of loss. All content is for informational purposes only.
The daily brief is a free glimpse into the prevailing fundamental and technical drivers of U.S. equity market products. Join the 980+ that read this report daily, below!
Graphic updated 9:50 AM ET. Sentiment Neutral if expected /ES open is inside of the prior day’s range. /ES levels are derived from the profile graphic at the bottom of the following section. Levels may have changed since initially quoted; click here for the latest levels. SqueezeMetrics Dark Pool Index (DIX) and Gamma (GEX) calculations are based on where the prior day’s reading falls with respect to the MAX and MIN of all occurrences available. A higher DIX is bullish. At the same time, the lower the GEX, the more (expected) volatility. Learn the implications of volatility, direction, and moneyness. Breadth reflects a reading of the prior day’s NYSE Advance/Decline indicator. VIX reflects a current reading of the CBOE Volatility Index (INDEX: VIX) from 0-100.
Administrative
Apologies for the delay. Hectic end-of-week! A little heavy on the fundamental side of things and light on the positioning. More to unpack next week. Have a great weekend!
Fundamental
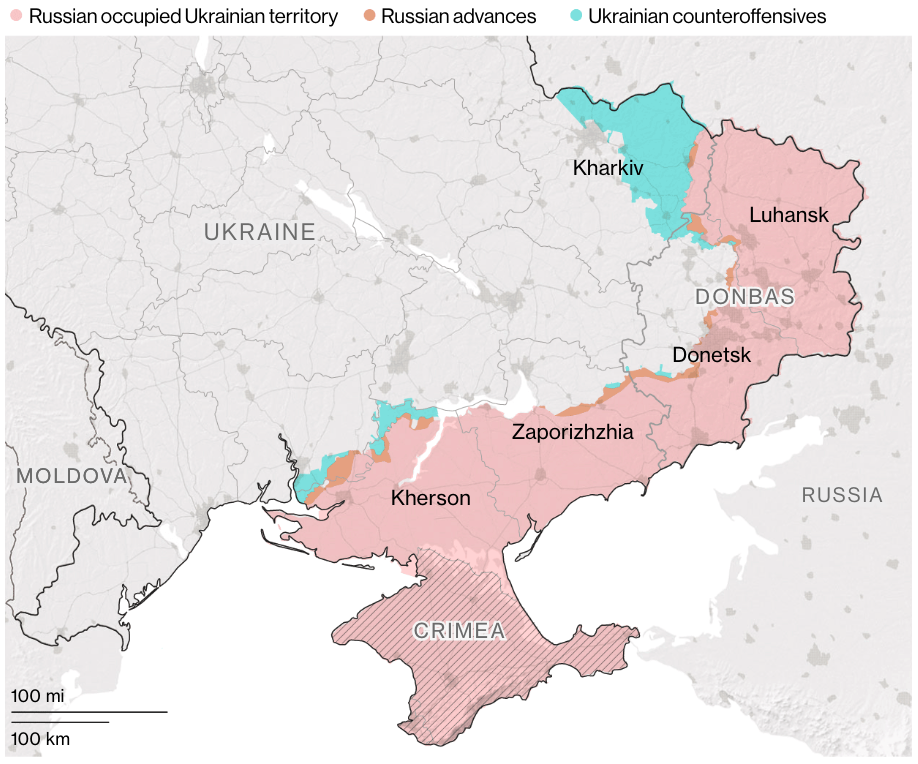
As an update to our September 29, 2022 letter, Russia responded to the Nord Stream attack suggesting the incident spoke of state-sponsored “terrorism”, all the while “an EU official said the incident had fundamentally changed the nature of the conflict in Ukraine,” per Refinitiv.
Graphic: Retrieved from Bloomberg. Updated September 28, 2022.
In short, Russia’s throwing blame on the US, among others, suggesting it was likely to benefit through a boost in liquefied natural gas (LNG) sales. Russia previously said the leaks were in areas “fully under the control” of US intelligence agencies.
It’s the case that in February 2022, Joe Biden commented that if Russia invaded Ukraine, there would “no longer be a Nord Stream 2,” also.
In response, Nord Stream 1 leaks will be stopped on Monday with no forecasts yet on the future of the pipeline’s operation.
To note, the pipelines were not “supplying gas to Europe when the leaks were first detected, … [but] both had gas in them.” Regardless, the EU will be assessing the application of sanctions.
Moving on, as a recap, this week there was tons of volatility in overseas fixed income and FX markets. In short, the announcement of new fiscal policies coincided with market volatility that prompted reflexive feedback responses, which we dissected in our September 29, 2022 letter.
A cascade of margin calls, during the route to 7-8% yields, would have put in jeopardy 90% of UK pension funds.
To explain, per Reuters, there are schemes “that pay pensioners a fixed annual amount, often a portion of the final salary they earned as employees.” The schemes invest about 50% of assets in bonds, in order to have cash on hand and pay pension liabilities.
To reduce the effects of market volatility, positions are hedged through derivatives “managed by so-called liability-driven investment (LDI) funds,” Reuters well explained. “For example, pension schemes might pay the floating rate leg of an interest rate swap and receive fixed rates.”
Due to the leverage, market moves have an amplified effect on the funds. Therefore, if bonds fall too much, too fast, more cash must be sent to these LDIs.
“[P]ositions become loss-making – they are paying out more money in the transaction than they are receiving.”
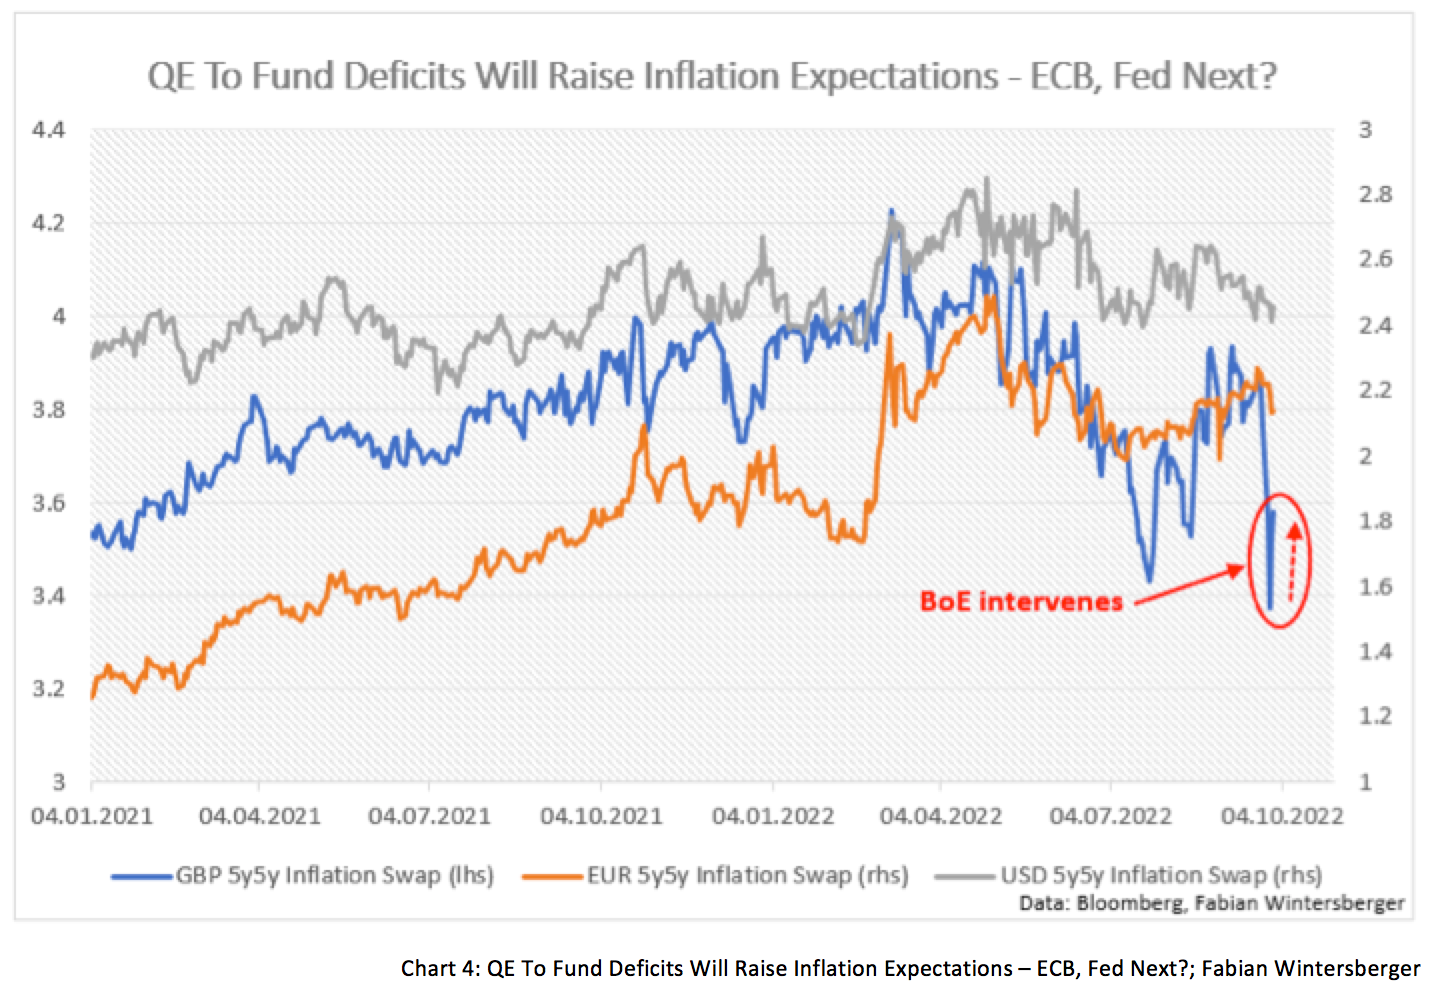
In some cases, schemes were to have “cash reserves to cope with a 200 bps rise in swap rates over a year. However, 30-year gilt interest rate swaps … rose 360 bps this year and 120 bps in the last few days before the BoE stepped in” and bought bonds, boosting inflation expectations, the thing that monetary tightening was, in part, intended to reduce.
Accordingly, pensions sold gilts to “ready cash to meet those collateral calls, or they were kicked out of their derivatives positions because they could not pay up in time and had to sell gilts to avoid having a naked exposure to further sharp moves.”
The BoE’s actions calm the market allowing for the more orderly processing of transactions.
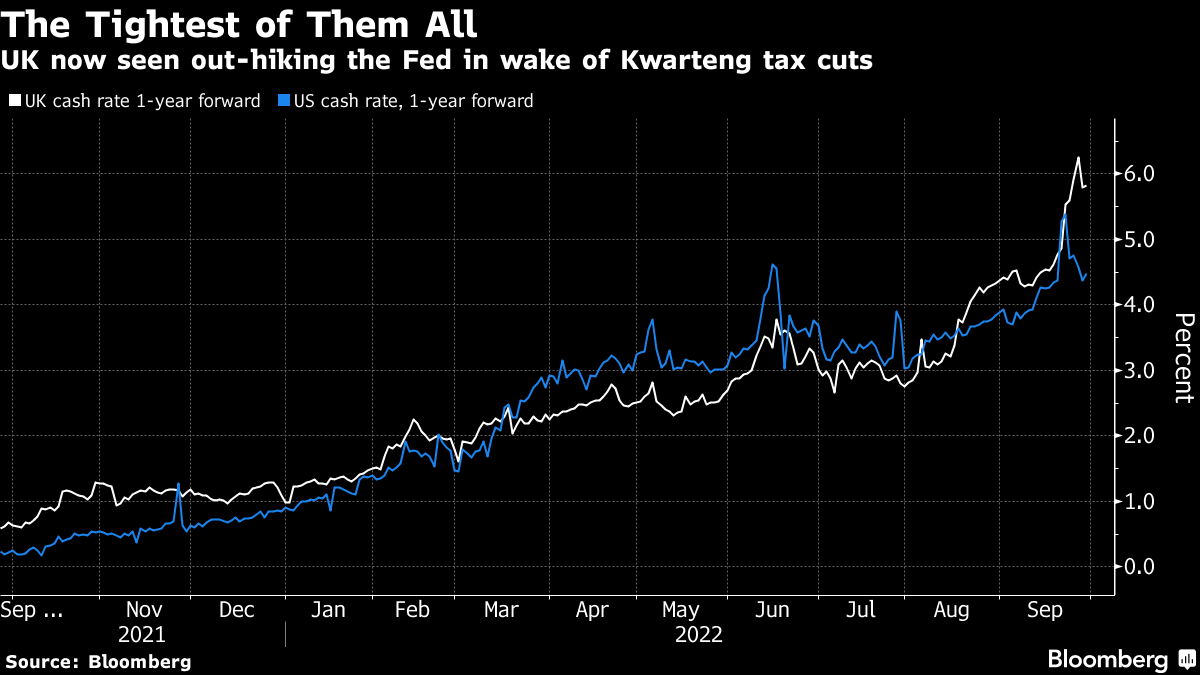
Still, the UK is seen “out-hiking the Fed in the wake of Kwarteng tax cuts,” while “schemes are running out of cash.”
The risks don’t just stop there, though, we added.
For one, there’s damage to be had if FX hedges go awry, which we said would likely prompt a call for collateral, too; investors will “buy overseas assets and hedge away the currency risk,” Jim Leaviss explained. “[I]f you had bought a dollar bond and hedged it, the dollars that you have effectively sold ‘short’ against sterling as the hedge have rallied, and the counterparty to the FX hedge will call for a collateral payment.”
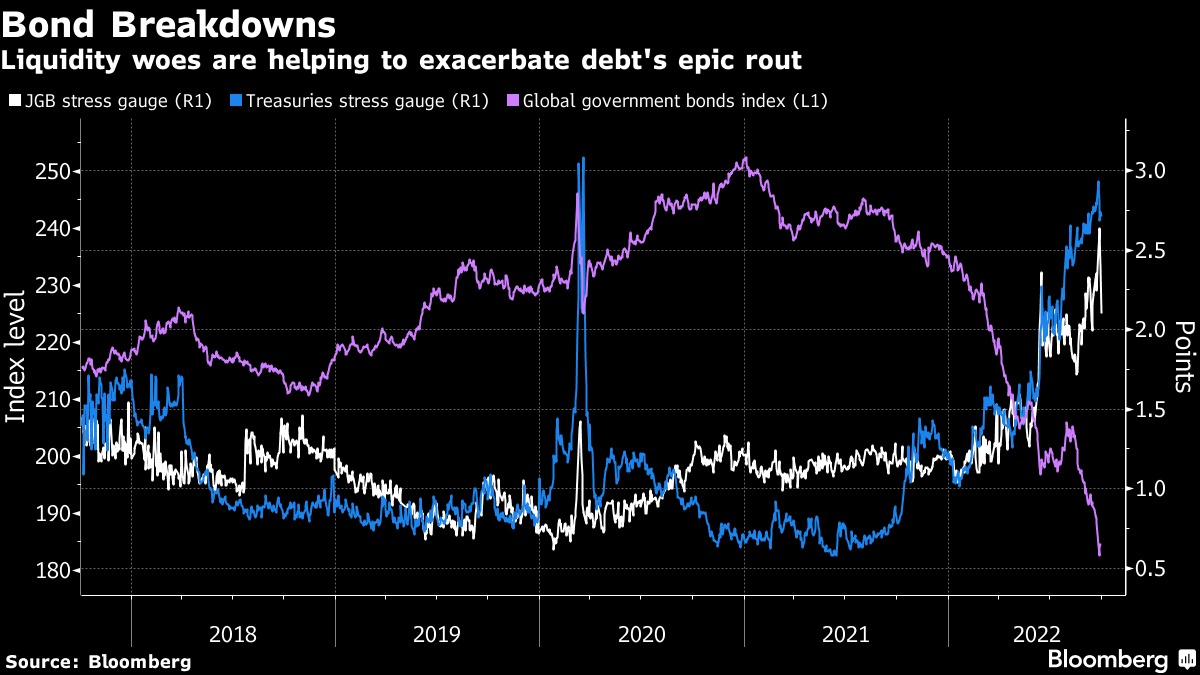
The actions of the recent days likely put investors in a position of less liquid assets to meet the (potential) collateral calls, and this is part of the aforementioned technical factors that are likely to have a bearing on the direction of bonds and yields “over coming months.”
Additionally, some participants speculate the US may run into similar issues as the UK. A single (unconfirmed) participant explained pensions may be “selling equities and other asset classes to meet their swap obligations.”
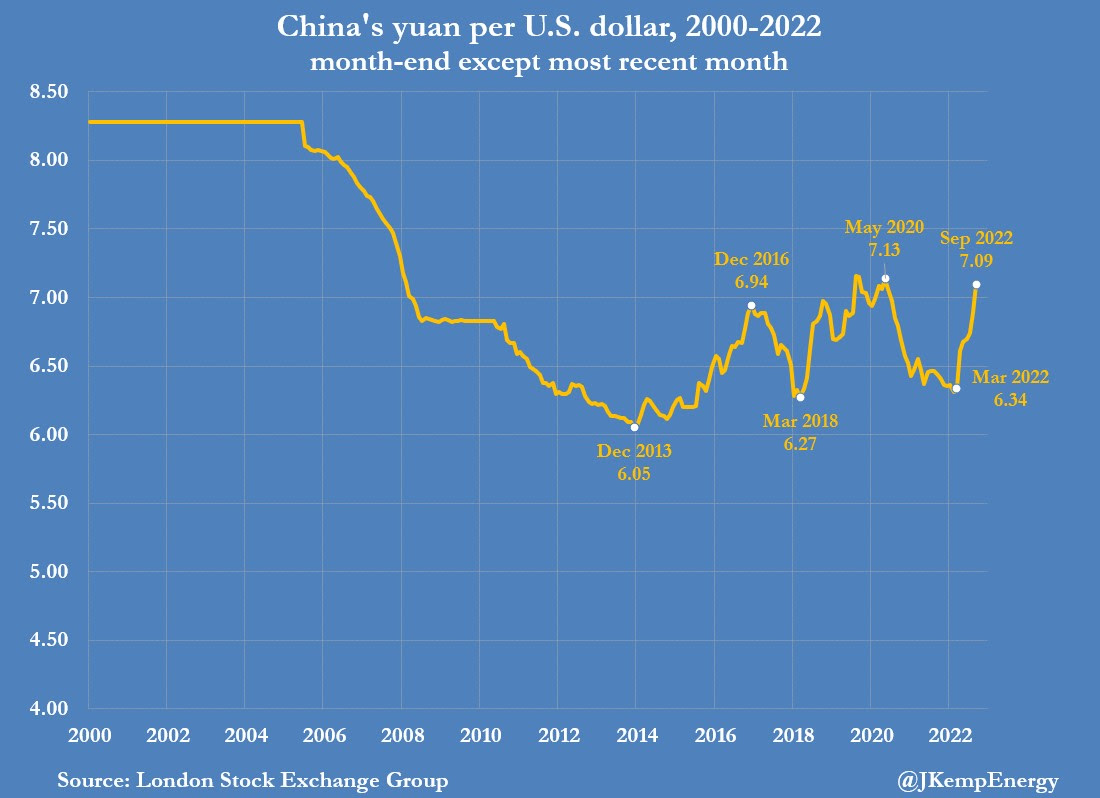
Separately, another topic of discussion was the People’s Bank of China (PBOC) telling state-run banks to prepare for the shedding of dollar holdings to buy and assist in propping up the yuan.
Graphic: Retrieved from Reuters’ John Kemp.
This is all the while the Federal Reserve (Fed), to address problems of its own (e.g., real estate affordability) is implementing aggressive monetary tightening (prompting a rise in the dollar and triggering a “reverse currency war”).
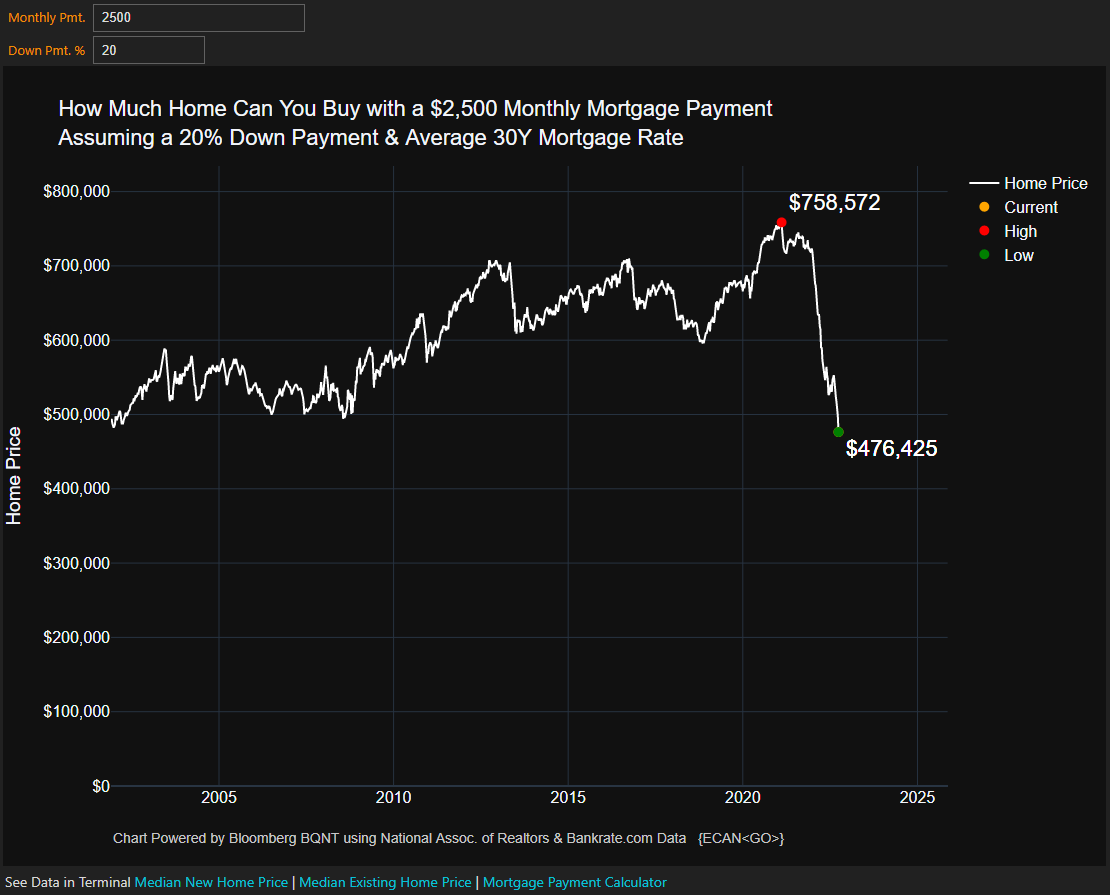
Graphic: Retrieved from Bloomberg. “So if you want to spend $2,500 a month, you can now buy a house that costs $476,425. For that same monthly payment, you could have purchased a $758,572 house in early 2021.”
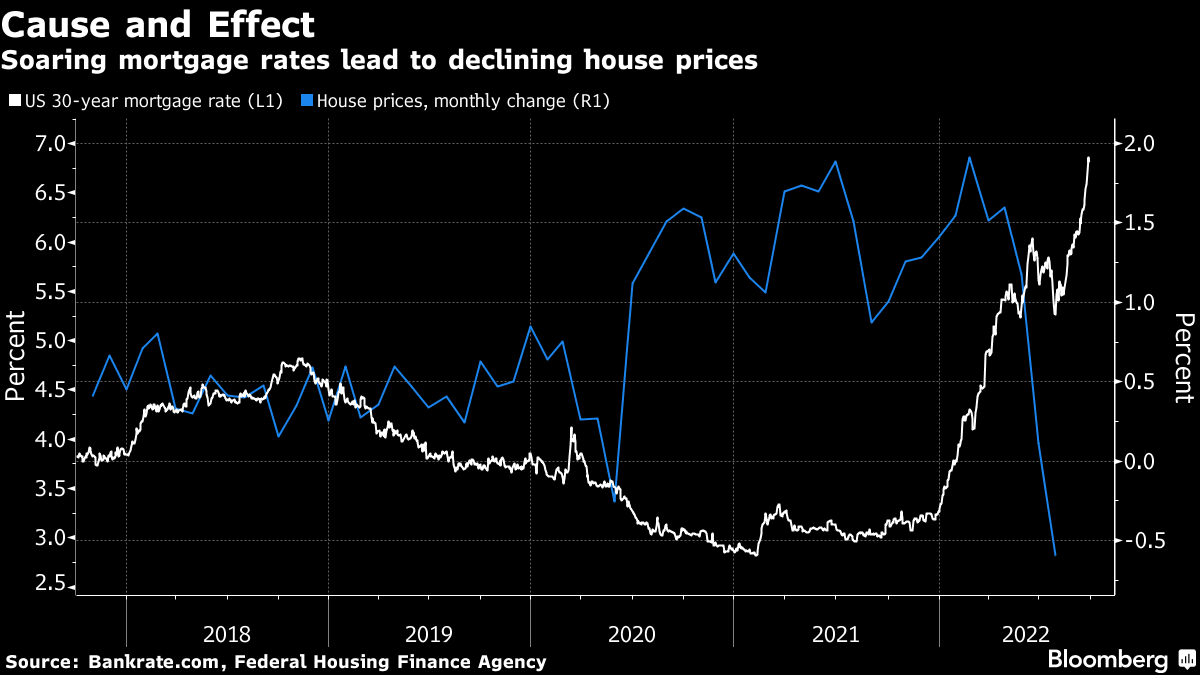
As an aside, US mortgage rates hit a 15-year high and home prices are falling.
Graphic: Retrieved via Bloomberg. To note, housing wealth regressions indicate “that every dollar of changes in housing wealth leads to a 38-cent change in consumption.”
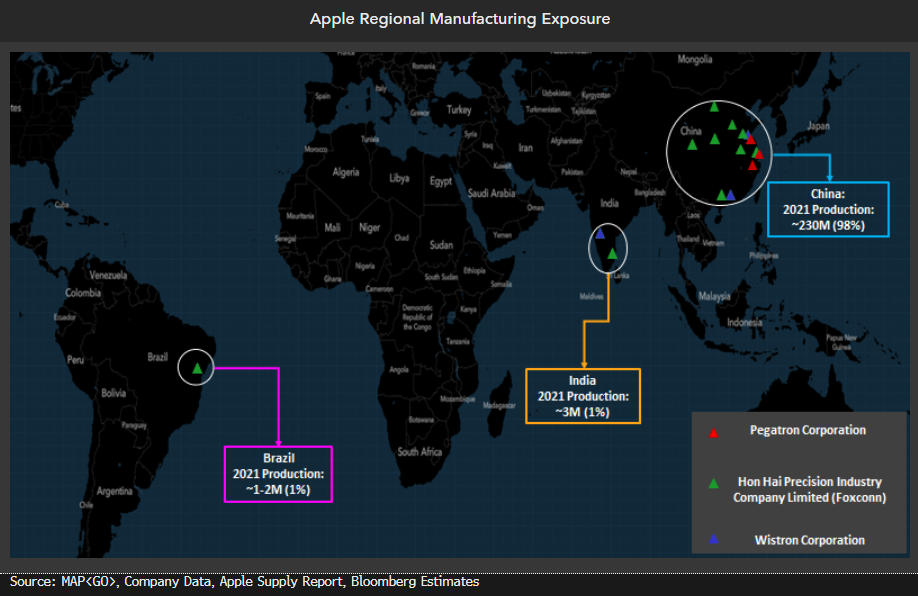
China is looking to do less of the same and “spark growth in an economy that’s been dragged down by COVID-19 lockdowns, a real estate crash, and supply chain snags,” which have hurt some US firms including Apple Inc (NASDAQ: AAPL).
Graphic: Retrieved from Bloomberg. Apple’s manufacturing exposure to China.
That’s the mismatch (i.e., China easy, US uneasy) that’s going on and, per some, the Fed may be acting on a set of lagging indicators; monetary policy action may do more harm than good.
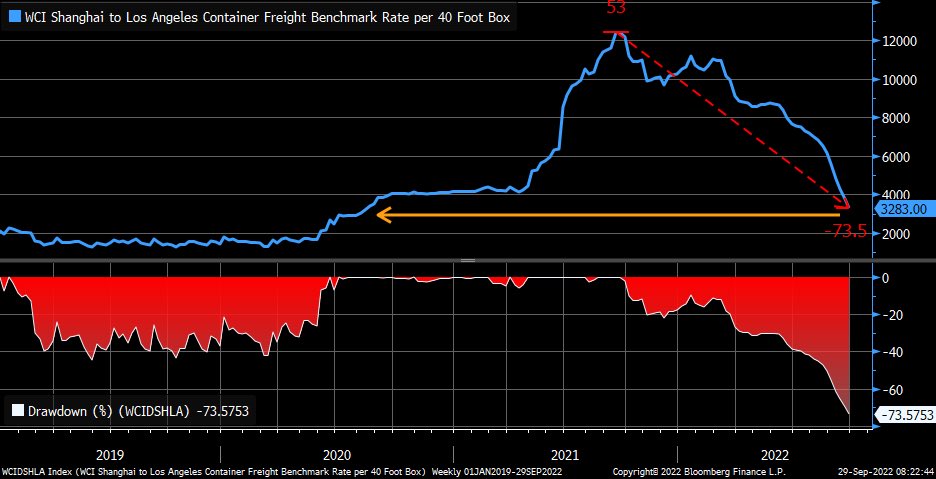
Graphic: Retrieved from Bloomberg. Via Liz Ann Sonders. “Unbelievable decline in shipping rates … cost to send a 40-ft container from Shanghai to Los Angeles has fallen by 74% from peak and is back to August 2020 levels.”
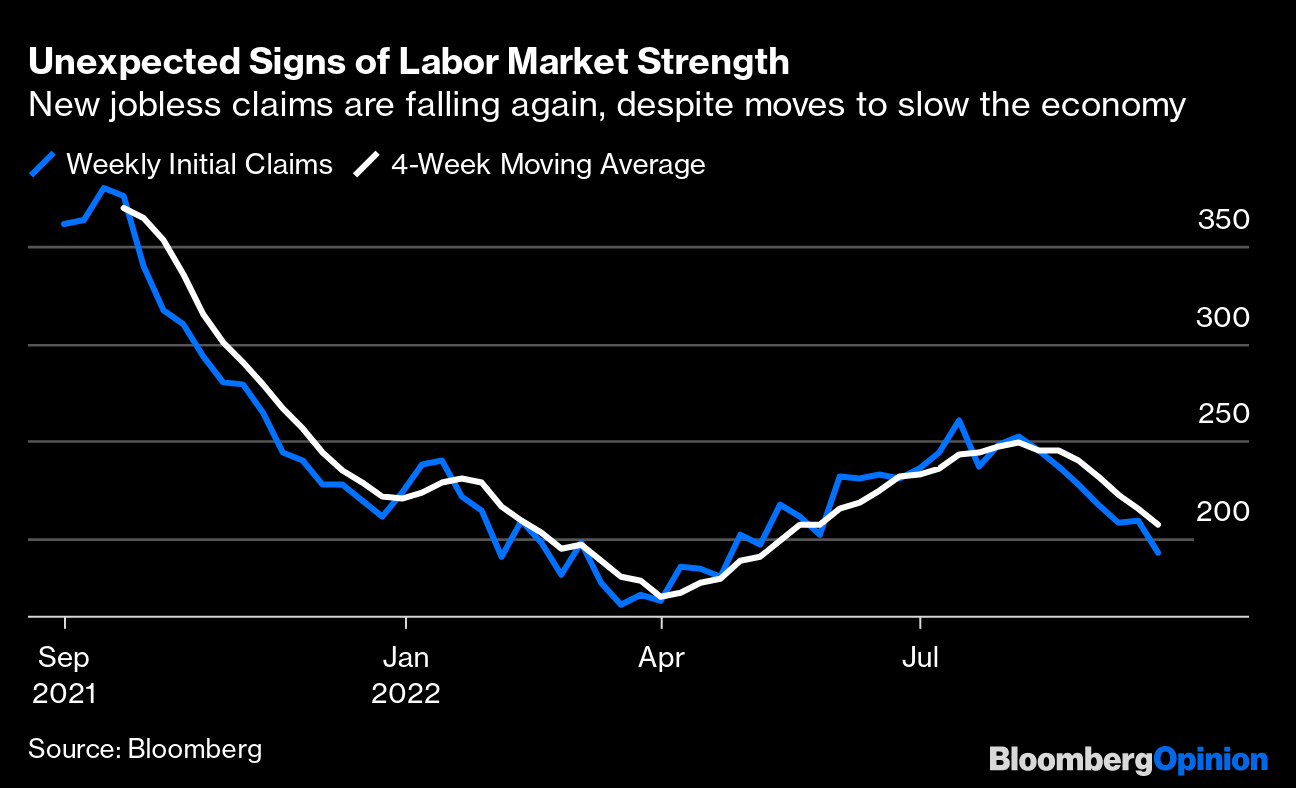
But, for now, a robust labor market and continued spending by American consumers have some feeling there’s far more room to go before US monetary policy does more harm than good.
Graphic: Retrieved from Bloomberg. An end of an era is approaching, however, as companies that grew largely over the past years, including Meta Platforms Inc (NASDAQ: META), seek to reduce headcount and reorganize.
Positioning
All that was said yesterday, and earlier this week, remains valid. In short, the decline prompted traders to demand downside protection, and this wound measures of implied volatility (IVOL).
Graphic: Retrieved from Interactive Brokers Group Inc (NASDAQ: IBKR). Read, here, to understand backwardation and contango in futures markets.
For IVOL measures to remain wound, something bad needs to happen, in short. Otherwise, as seen yesterday, slightly, the S&P 500 drifted lower while certain IVOL measures, such as the Cboe Volatility Index (INDEX: VIX) printed a lower high than that observed on Wednesday.
Per SpotGamma, “If the decline in IVOL is very pronounced, relative to the decline in the S&P, that too can aid in a push-and-pull that actually serves to … resist far-reaching weakness.”
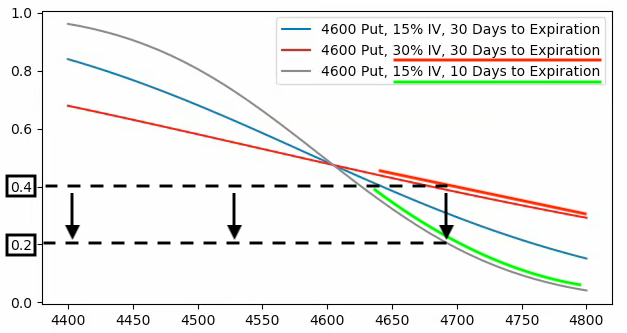
Graphic: Retrieved from SpotGamma. SPX prices X-axis. Option delta Y-axis. When the factors of implied volatility (Vanna) and time change (Charm), hedging ratios change. The graphic is for illustrational purposes, only.
From hereon, the decay and/or removal of the protection that’s been demanded in the past days and weeks may place a like on IVOL and boost markets over a very short term. In the long term, however, weakness is here to stay, says Kai Volatility’s Cem Karsan.
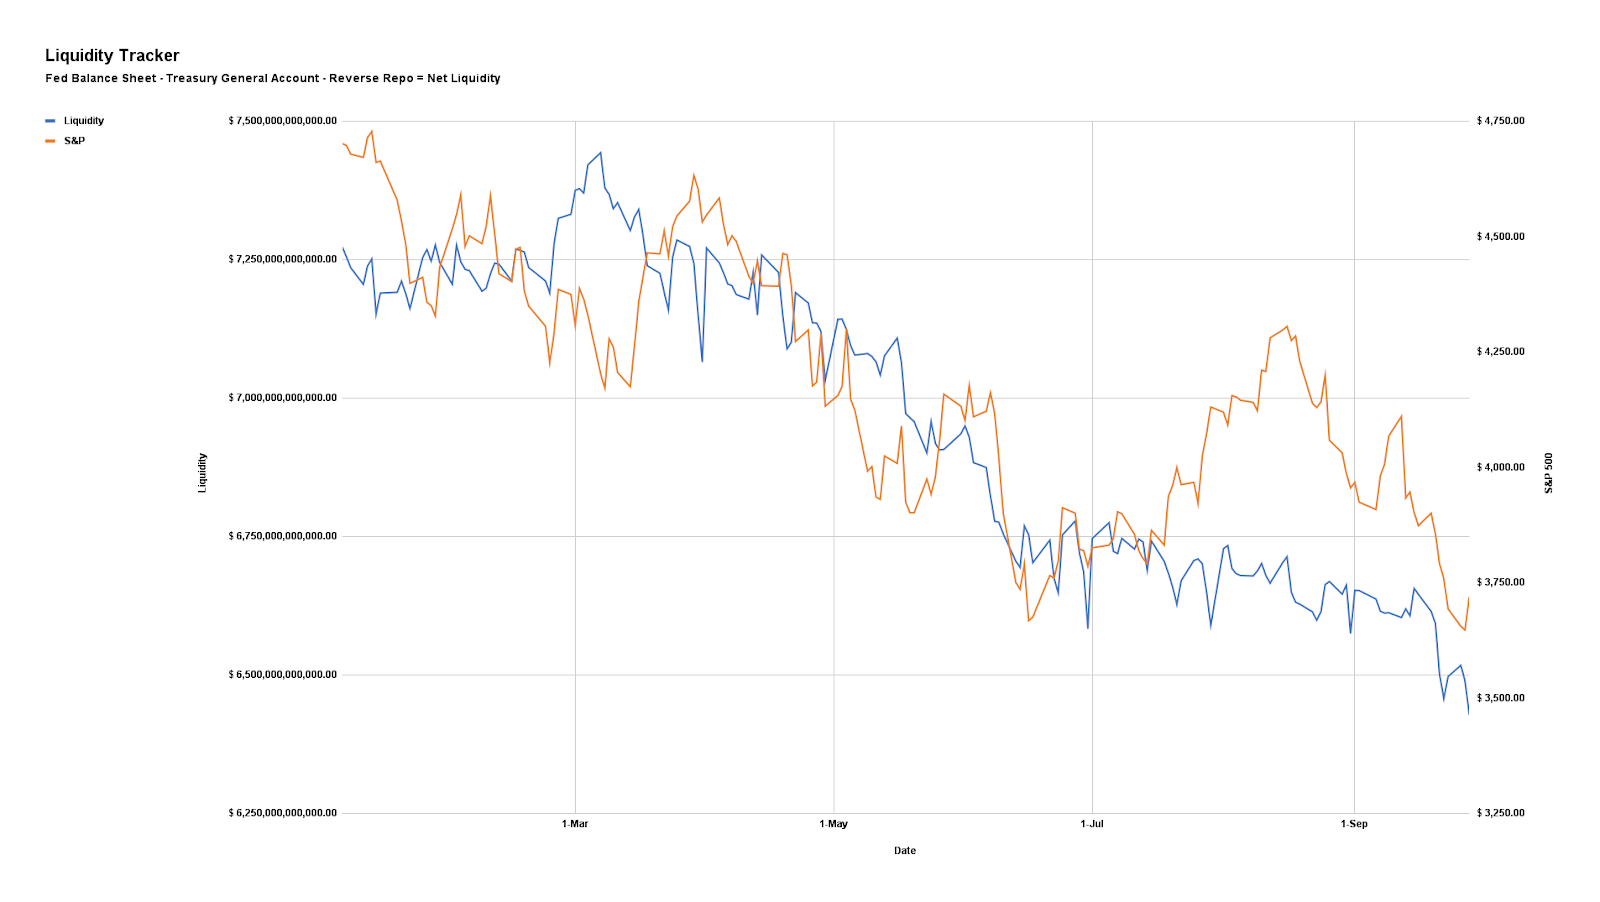
That’s amid impacts of quantitative tightening (QT) which is manifesting itself as “$4.5 billion less in demand for assets per day,” as well as the blackout period for buybacks (which were consistently “supporting the market”) and options repositioning bolstering the weakness.
Graphic: Via Physik Invest. Data compiled by @jkonopas623. Fed Balance Sheet data, here. Treasury General Account Data, here. Reverse Repo data, here. NL = BS – TGA – RRP.
A lot more on this positioning, and the rollover of some large fund exposures, which have grasped the attention of many online, in some coming letters.
Technical
As of 9:50 AM ET, Friday’s regular session (9:30 AM – 4:00 PM ET), in the S&P 500, is likely to open in the middle part of a balanced overnight inventory, inside of prior-range and -value, suggesting a limited potential for immediate directional opportunity.
In the best case, the S&P 500 trades higher.
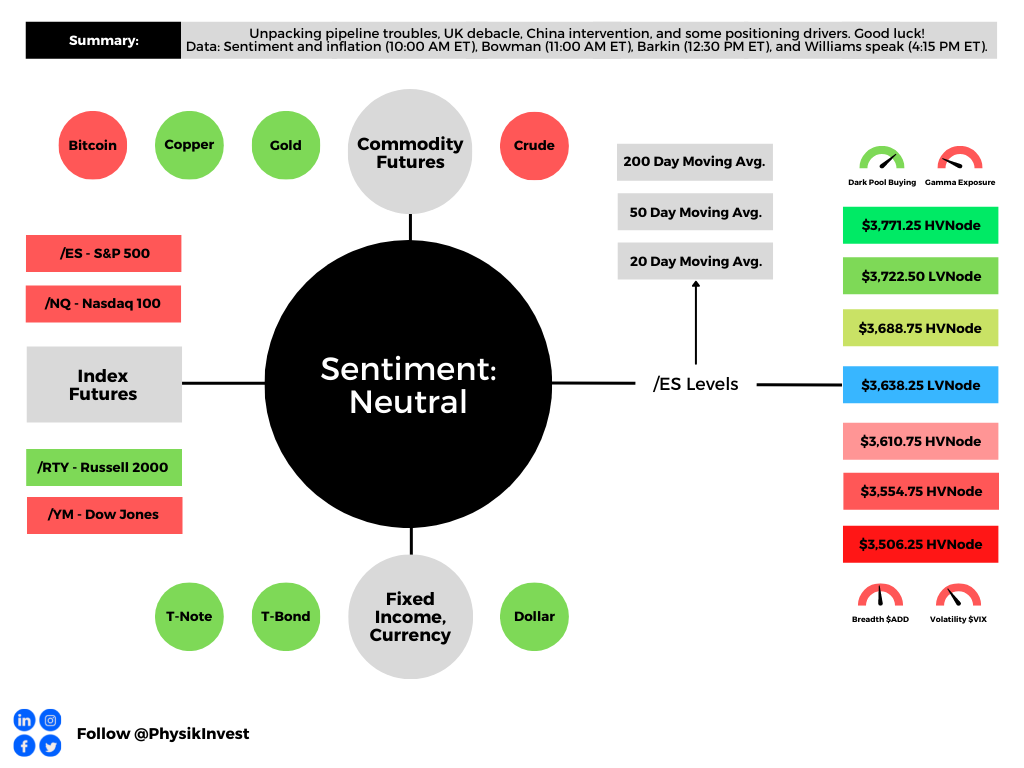
Any activity above the $3,638.25 LVNode puts into play the $3,688.75 HVNode. Initiative trade beyond the HVNode could reach as high as the $3,722.50 LVNode and $3,771.25 HVNode, or higher.
In the worst case, the S&P 500 trades lower.
Any activity below the $3,638.25 LVNode puts into play the $3,610.75 HVNode. Initiative trade beyond the latter could reach as low as the $3,554.75 and $3,506.25 HVNode, or lower.
Click here to load today’s key levels into the web-based TradingView charting platform. Note that all levels are derived using the 65-minute timeframe. New links are produced, daily.
Graphic: 65-minute profile chart of the Micro E-mini S&P 500 Futures.
Definitions
Volume Areas: A structurally sound market will build on areas of high volume (HVNodes). Should the market trend for long periods of time, it will lack sound structure, identified as low volume areas (LVNodes). LVNodes denote directional conviction and ought to offer support on any test.
If participants were to auction and find acceptance into areas of prior low volume (LVNodes), then future discovery ought to be volatile and quick as participants look to HVNodes for favorable entry or exit.
About
After years of self-education, strategy development, mentorship, and trial-and-error, Renato Leonard Capelj began trading full-time and founded Physik Invest to detail his methods, research, and performance in the markets.
Capelj also develops insights around impactful options market dynamics at SpotGamma and is a Benzinga reporter.
In no way should the materials herein be construed as advice. Derivatives carry a substantial risk of loss. All content is for informational purposes only.
The daily brief is a free glimpse into the prevailing fundamental and technical drivers of U.S. equity market products. Join the 700+ that read this report daily, below!
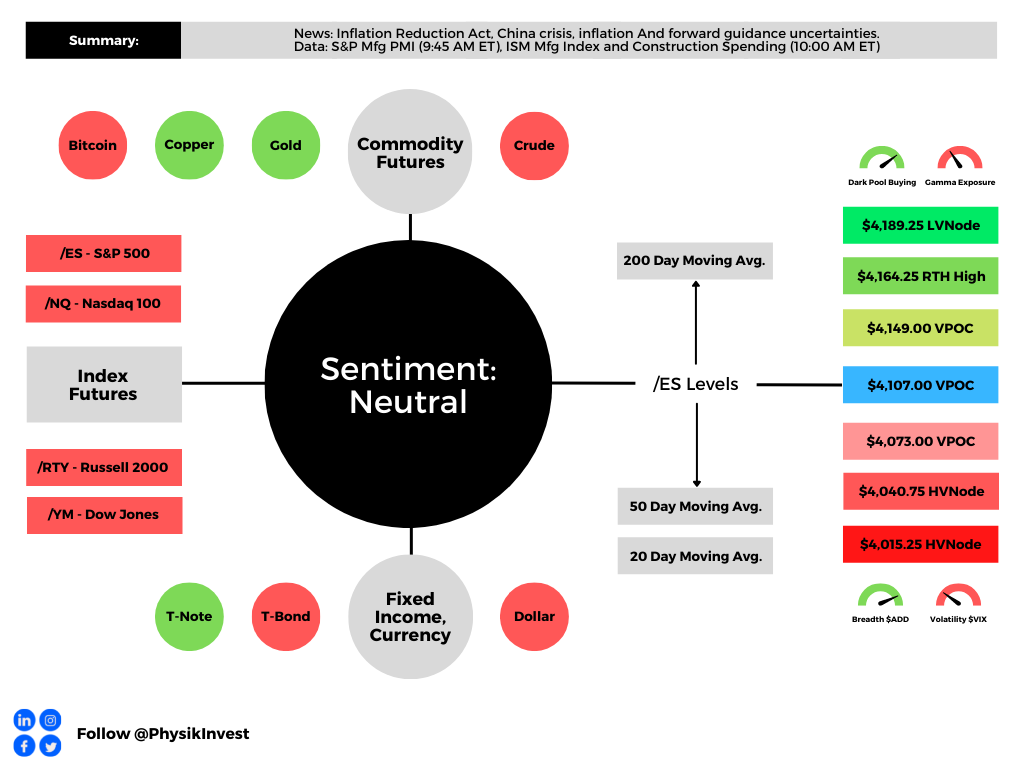
Graphic updated 6:30 AM ET. Sentiment Neutral if expected /ES open is inside of the prior day’s range. /ES levels are derived from the profile graphic at the bottom of the following section. Levels may have changed since initially quoted; click here for the latest levels. SqueezeMetrics Dark Pool Index (DIX) and Gamma (GEX) calculations are based on where the prior day’s reading falls with respect to the MAX and MIN of all occurrences available. A higher DIX is bullish. At the same time, the lower the GEX, the more (expected) volatility. Learn the implications of volatility, direction, and moneyness. Breadth reflects a reading of the prior day’s NYSE Advance/Decline indicator. VIX reflects a current reading of the CBOE Volatility Index (INDEX: VIX) from 0-100.
Fundamental
Today, we add to our narrative updates with respect to the Inflation Reduction Act, China crises, implications of earnings growth that’s down below the surface, the Federal Reserve’s pivot from forward guidance, how uncertainties boost risk premia, and geopolitics. Then, in the coming days, we’ll hone in on measuring the impact.
Let’s get into it.
Inflation Reduction Act Disinflationary
The bill, which reforms the tax code, cuts health-care costs, and helps with climate change, per Noah Smith’s letter, is disinflationary.
The reason being?
It works to shrink the deficit by $288 billion, over a decade. Additionally, though government investments are “inflationary in the short-term, and deflationary in the medium term,” embedded tax hikes “should more than cancel out the short-term inflationary piece.”
China Crisis Contained
Next, is the crisis in China.
After Evergrande fears “peaked in September, … people stopped paying their mortgages,” in protest, per Marc Rubinstein’s Net Interest letter.
Why is this problematic?
Typically, purchasers place “down payments into developer’s escrow accounts some 18-24 months before taking delivery of their home which are then topped up via mortgage loans.”
Though these funds would “cover the remaining cost of construction,” developers mismanaged and, “when the market turned – and traditional credit channels turned off their supply of new credit – many developers ran out of funds to complete projects.”
Despite “unfinished residential projects across China representing only 1.7% of total outstanding mortgage loans, … [they’re] a lot riskier,” now. Homes are a big chunk of household wealth and damage to this area of the market has major implications.
For context, home prices are to China what stock markets are to the Federal Reserve and peripheral bond spreads are to the European Central Bank.
Notwithstanding, despite “excessive leverage, regulatory arbitrage, and irresponsible risk-taking, … [China] banks are able to pursue a borrower’s other assets if they default on their mortgage, … [so] strategic defaults are less likely.”
Here Comes The Earnings De-rate?
As well explained in last Friday’s morning letter, essentially, the 2022 decline was mainly about higher inflation and interest rates.
“The second half will be about earnings,” Blockworks puts well. Here’s why.
Despite, “S&P 500 earnings [] on track to rise by a robust 9.4% in aggregate,” per statements by Deutsche Bank AG’s (NYSE: DB) Binky Chadha, growth “is down sharply below the surface.”
If the massive increase in energy earnings, the return to profitability for pandemic-impacted businesses, and the drag on banks from loan loss provisioning are excluded, the “earnings adjusted for seasonality are on track to fall sharply by -4.5% quarter-on-quarter, one of the steepest declines.”
This is among the factors prompting the likes of Meta Platforms Inc (NASDAQ: META) and Amazon Inc (NASDAQ: AMZN) to trim resources like labor.
Uncertainties Boost Risk Premia
Alfonso Peccatiello, in his letter The Macro Compass, explains that the Federal Reserve ditching forward guidance gave “markets the green light to freely design their probability distributions across all asset classes, without any anchor.”
This explains the big rally in risk assets like equities.
Notwithstanding, the Fed no longer being on autopilot promotes uncertainty and higher volatility in bonds, which is an “enemy for risk assets,” over longer time horizons.
“While ditching forward guidance might be the right monetary policy strategy, … when there is no anchor for bond markets, implied volatility will have a hard time coming down. And a higher volatility in one of the biggest, most liquid markets in the world generally requires higher (not lower) risk premia everywhere else.”
This does more to support our recent positioning analyses and the case for an “untethering” in equity implied volatility, “one of the most supportive things into the decline,” per statements by Kai Volatility’s Cem Karsan.
Tensions Flare, Elsewhere
While, on one hand, the pressures from the Russia and Ukraine conflict are beginning to ebb as the first ship carrying Ukrainian grains left for Lebanon, tensions elsewhere are flaring.
To be specific, news regarding the unrest in the Balkans, between Kosovo and Serbia, hit the wire, yesterday. Per Washington Post coverage, “Ethnic Serbs in northern municipalities of Kosovo bordering Serbia blocked roads and skirmished with police on the eve of the implementation of a law requiring them to replace their license plates with Kosovo plates.”
Per Newsweek coverage, in response, a NATO mission called KFOR would “take whatever measures are necessary to keep a safe and secure environment in Kosovo at all times, in line with its U.N. mandate.”
Adding, “Observers fear Moscow might see an opportunity in the current tensions between the two countries to push the U.S. and the NATO mission out of Kosovo.”
This is as a Chinese invasion of Taiwan may come sooner than expected, Axios reports.
Technical
As of 6:30 AM ET, Monday’s regular session (9:30 AM – 4:00 PM ET), in the S&P 500, is likely to open in the middle part of a negatively skewed overnight inventory, inside of prior-range and -value, suggesting a limited potential for immediate directional opportunity.
In the best case, the S&P 500 trades higher.
Any activity above the $4,107.00 VPOC puts into play the $4,149.00 VPOC. Initiative trade beyond the VPOCs could reach as high as the $4,164.25 RTH High and $4,189.25 LVNode, or higher.
In the worst case, the S&P 500 trades lower.
Any activity below the $4,107.00 VPOC puts into play the $4,073.00 VPOC. Initiative trade beyond the $4,073.00 VPOC could reach as low as the $4,040.75 and $4,015.25 HVNodes, or lower.
Click here to load today’s key levels into the web-based TradingView charting platform. Note that all levels are derived using the 65-minute timeframe. New links are produced, daily.
Graphic: 65-minute profile chart of the Micro E-mini S&P 500 Futures.
Definitions
Volume Areas: A structurally sound market will build on areas of high volume (HVNodes). Should the market trend for long periods of time, it will lack sound structure, identified as low volume areas (LVNodes). LVNodes denote directional conviction and ought to offer support on any test.
If participants were to auction and find acceptance into areas of prior low volume (LVNodes), then future discovery ought to be volatile and quick as participants look to HVNodes for favorable entry or exit.
POCs: POCs are valuable as they denote areas where two-sided trade was most prevalent in a prior day session. Participants will respond to future tests of value as they offer favorable entry and exit.
MCPOCs: POCs are valuable as they denote areas where two-sided trade was most prevalent over numerous day sessions. Participants will respond to future tests of value as they offer favorable entry and exit.
Volume-Weighted Average Prices (VWAPs): A metric highly regarded by chief investment officers, among other participants, for quality of trade. Additionally, liquidity algorithms are benchmarked and programmed to buy and sell around VWAPs.
About
After years of self-education, strategy development, mentorship, and trial-and-error, Renato Leonard Capelj began trading full-time and founded Physik Invest to detail his methods, research, and performance in the markets.
Capelj also develops insights around impactful options market dynamics at SpotGamma and is a Benzinga reporter.
In no way should the materials herein be construed as advice. Derivatives carry a substantial risk of loss. All content is for informational purposes only.