Big news includes Netflix Inc (NASDAQ: NFLX) beating earnings estimates but having a weaker-than-expected forecast, Tesla Inc (NASDAQ: TSLA) cutting prices the sixth time this year, Meta Platforms Inc (NASDAQ: META) and Walt Disney Co (NYSE: DIS) commencing layoffs, and mortgage rates edging higher to ~6.4%.
Graphic: Retrieved from Bloomberg. “US mortgage rates increased last week by the most in two months to 6.43%, denting already sluggish demand.”
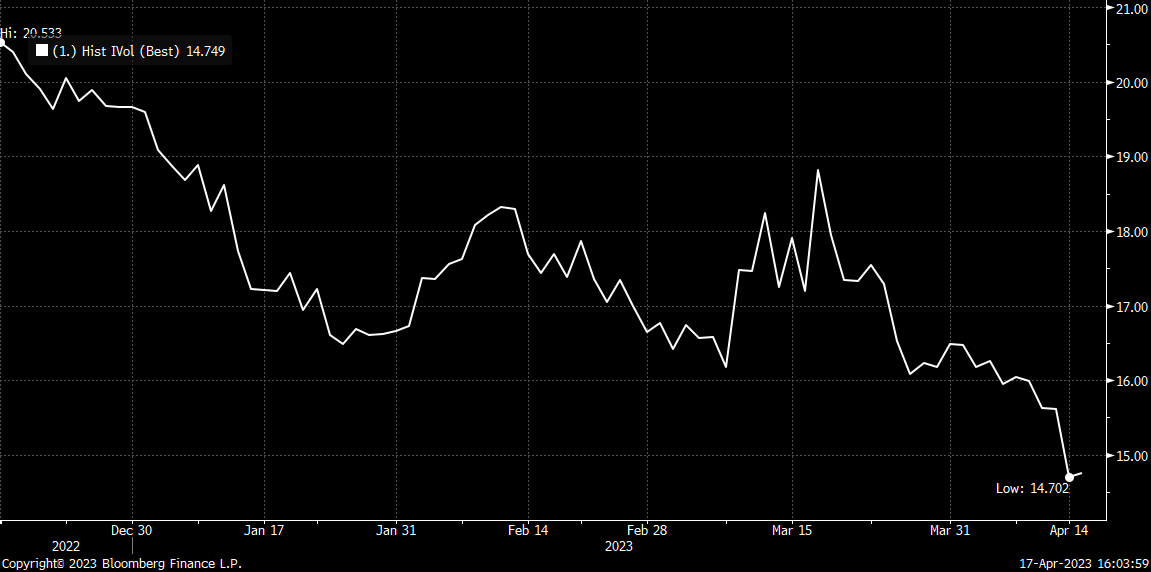
Equity markets are down, and equity implied volatility (IVOL) measures, including the Cboe Volatility Index or VIX, are climbing. Notwithstanding, the trend lower in IVOL is intact, and that’s good for traders biased short volatility.
Graphic: Retrieved from Bloomberg via Danny Kirsch of Piper Sandler Companies (NYSE: PIPR). Call option volatility for the $4,150.00 strike. May monthly expiration.
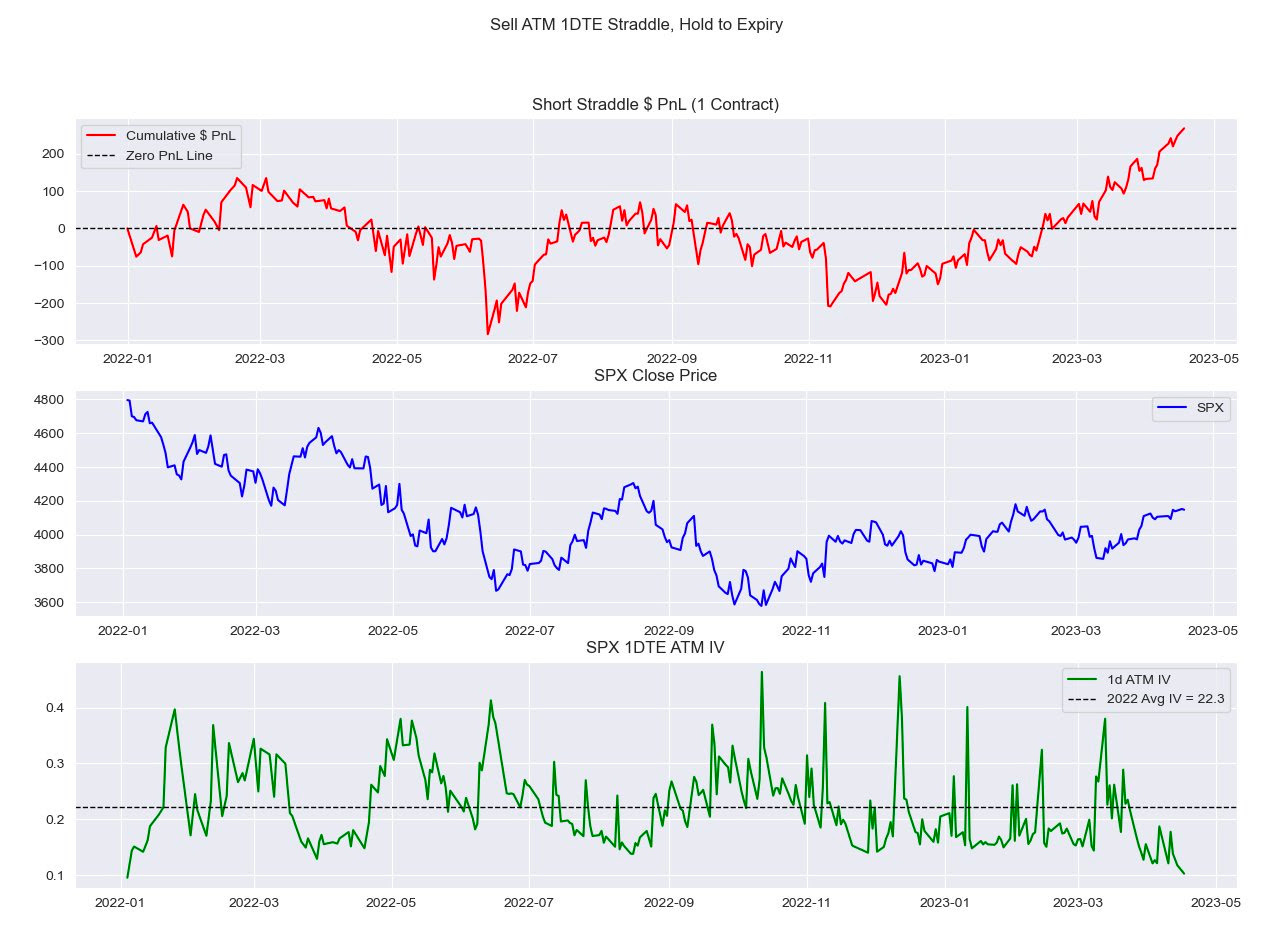
“With all the focus [on S&P 500 (INDEX: SPX)] 0 DTE lately, I look at how expensive these have been since 2022,” IPS Strategic Capital’s Pat Hennessy says, referencing a backtest he conducted selling a 1 DTE straddle and holding till maturity.
“Performance since the November CPI has been stellar, with a 63% win rate and an average gain of $20.00.”
Graphic: Retrieved from IPS Strategic Capital’s Pat Hennessy.
Volatility trader Darrin John agrees, noting volatility remains expensive, a detriment to those who may be biased long volatility.
“The VRP is so wide across all of the tenors I track,” John elaborates. “It’s going to be hard for gamma buyers to cover daily theta bills.”
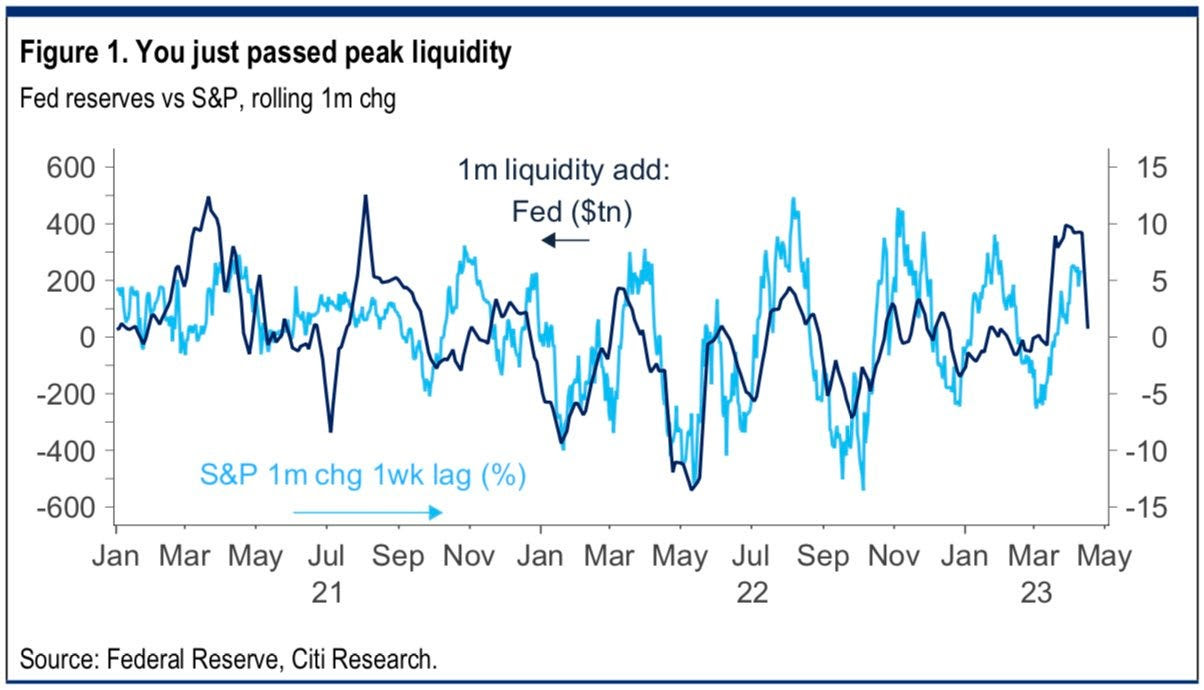
Clouds are appearing on the horizon, however, and the trend higher (lower) in stocks (volatility) may not last. Bloomberg forecasts the largest fall in SPX earnings since the start of 2020. Notwithstanding, strength can continue for longer …
Graphic: Retrieved from Citigroup Inc Research (NYSE: C) via @tr8derz. “YTD rally stems from $1tn in CB liquidity. High-frequency indicators suggest this is already stalling, and coming weeks seem increasingly likely to bring a sharp reversal. Higher TGA and RRP, ECB QT and reduced China easing could easily see a net drain of some $6-800bn.”
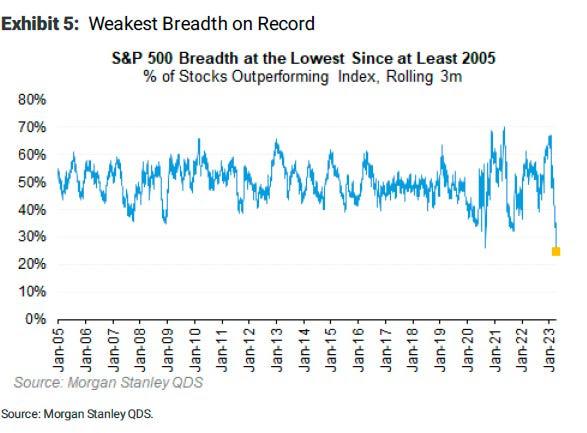
… even with the SPX breadth reading poor. The SPX has rallied with multiples rising; strength came with positive earnings surprises, bond demand, and other things.
Graphic: Retrieved from Morgan Stanley (NYSE: MS) via Bloomberg.
Hence, at the risk of sounding like a broken record, the low-cost call structures we’ve talked about in the past remain attractive.
If markets move higher, you can monetize and roll profits into put spreads (i.e., buy put and sell another at a lower strike). This may work well if JPMorgan Chase & Co’s (NYSE: JPM) call that “even a mild recession would warrant retesting the previous lows” is realized.
Such structures work well as “a big pop in the market can result in a decent drop in the VIX…and vice versa, a market sell-off will result in a greater increase in the VIX now than it did in 2022,” says Alpha Exchange.
Alternatively, lean neutral and buy into cash or bonds yielding 4-5%. Some long box spreads yield 5.4% as of yesterday’s close.
In other news, Physik Invest’s first in-depth note is nearing completion and will be available for public viewing in short order. Take care and watch your risk!
About
Welcome to the Daily Brief by Physik Invest, a soon-to-launch research, consulting, trading, and asset management solutions provider. Learn about our origin story here, and consider subscribing for daily updates on the critical contexts that could lend to future market movement.
Separately, please don’t use this free letter as advice; all content is for informational purposes, and derivatives carry a substantial risk of loss. At this time, Capelj and Physik Invest, non-professional advisors, will never solicit others for capital or collect fees and disbursements. Separately, you may view this letter’s content calendar at this link.
Physik Invest’s Daily Brief is read free by thousands of subscribers. Join this community to learn about the fundamental and technical drivers of markets.
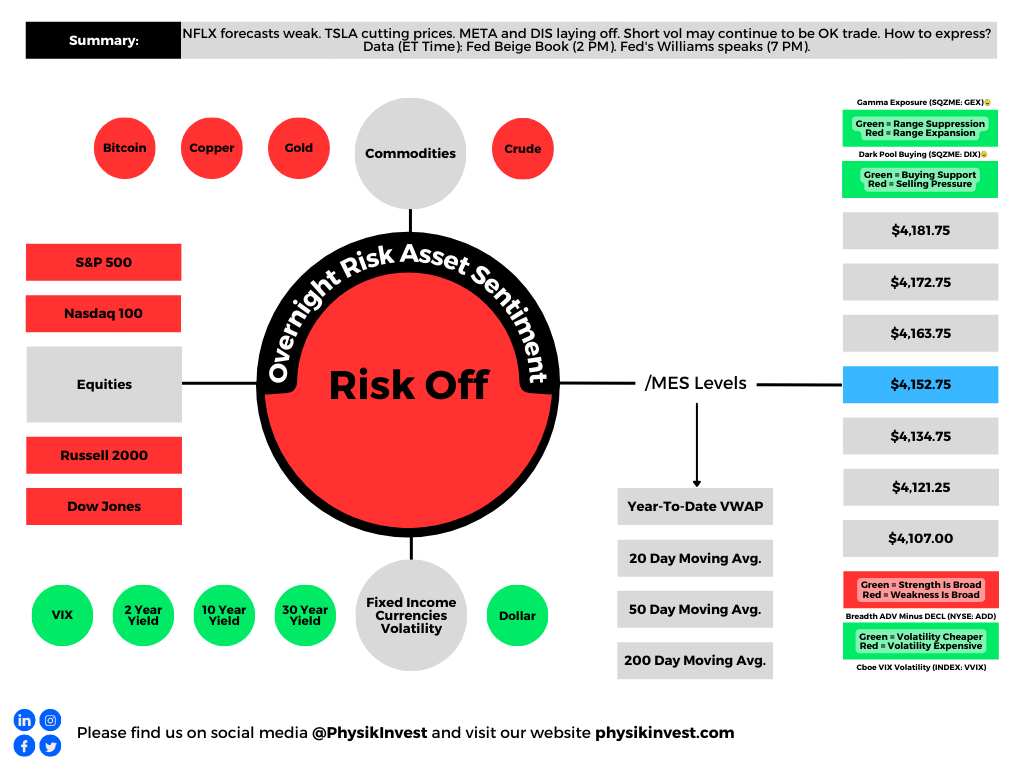
Graphic updated TIME AM ET. Sentiment Neutral if expected /MES open is inside of the prior day’s range. Sentiment Risk-On if expected /MES open is above the prior day’s range. Sentiment Risk-Off if expected /MES open is below the prior day’s range. /MES levels are derived from the profile graphic at the bottom of this letter. Click here for the latest levels. SqueezeMetrics Dark Pool Index (DIX) and Gamma (GEX) with the latter calculated based on where the prior day’s reading falls with respect to the MAX and MIN of all occurrences available. A higher DIX is bullish. The lower the GEX, the more (expected) volatility. Click to learn the implications of volatility, direction, and moneyness. Breadth reflects a reading of the prior day’s NYSE Advance/Decline indicator. The CBOE VIX Volatility Index (INDEX: VVIX) reflects the attractiveness of owning volatility. UMBS prices via MND. Click here for the economic calendar.
Administrative
A shorter letter today, so there may be some holes we patch later. Take care!
Fundamental
The Federal Reserve (Fed) bumped its target rate up 25 basis points to 4.75-5.00% and opened the door to more hikes, barring market-induced financial tightening, as this letter put forward yesterday morning.
“The events in the banking system over the past two weeks are likely to result in tighter credit conditions for households and businesses, which would, in turn, affect economic outcomes,” Fed chair Jerome Powell commented, adding that credit tightening significantly means monetary policy “may have less work to do.”
Further, before the recent collapses of a few financial institutions, including SVB Financial Group, the market was pricing a 50 basis point hike.
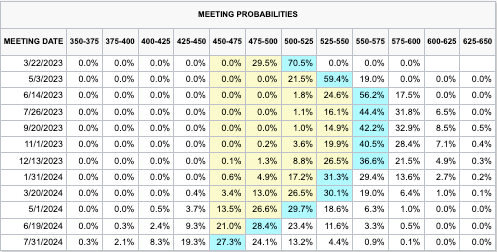
The below CME Group Inc’s (NASDAQ: CME) FedWatch Tool shows the market’s expectations on March 8. Note the 5.50-5.75% terminal (peak) rate.
Graphic: Retrieved from CME Group Inc’s (NASDAQ: CME) FedWatch Tool via The Daily Brief for March 8, 2023.
“Absent SVB, the Fed would have likely raised 50 basis points,” TS Lombard’s Steve Blitz said. “SVB did happen, however, and so this FOMC, ever anxious about facing a recession (rising unemployment), is more than happy to let ‘tighter credit conditions for households and businesses … weigh on economic activity, hiring, and inflation.’ As for financial instability, they believe they have the tools to keep a few poorly managed banks from imploding the whole sector.”
Global layoff tally has moved up to nearly 500k since beginning of October per @Bloomberg … Tech & Consumer Discretionary sectors have led; and for nearly 800 companies that have cut jobs, median layoff has left company workforce 10% smaller pic.twitter.com/d6vlsPgQwj
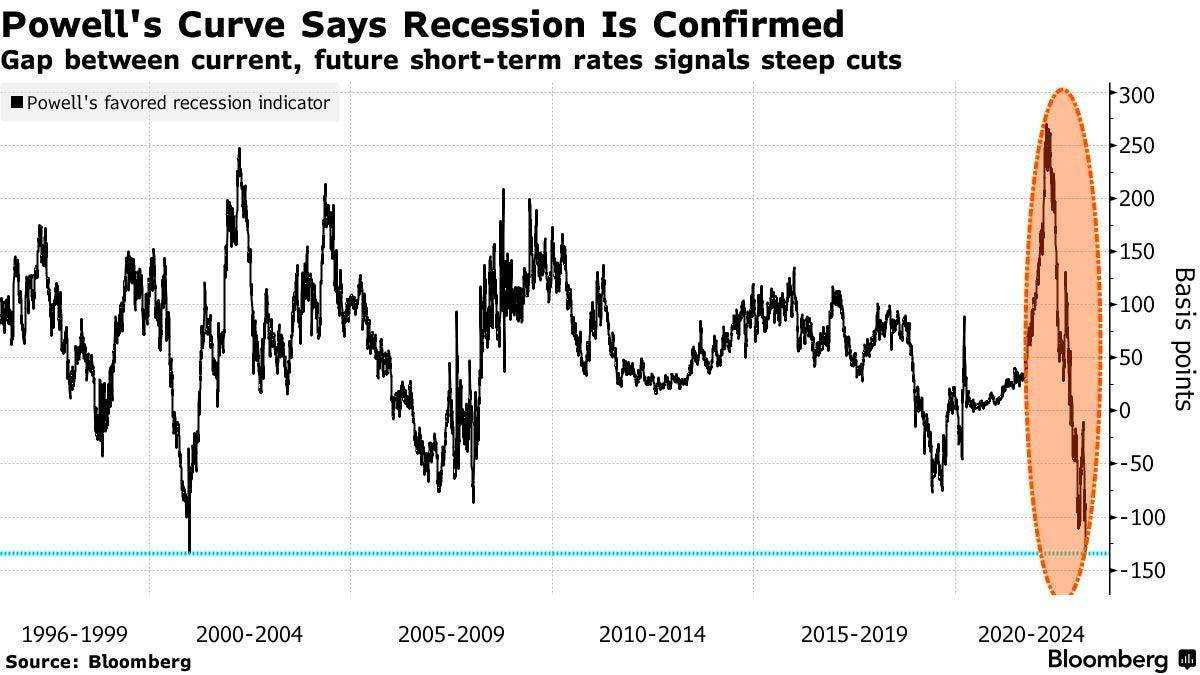
This is far higher than what the markets are pricing. Powell’s go-to measure for spotting economic troubles suggests steep cuts are also coming sooner than later.
Graphic: Retrieved from Bloomberg. “Frankly, there’s good research by staff in the Federal Reserve system that really says to look at the short — the first 18 months — of the yield curve. That’s really what has 100% of the explanatory power of the yield curve. It makes sense. Because if it’s inverted, that means the Fed’s going to cut, which means the economy is weak.” — Fed Chair Powell on March 21, 2022.
Anyways, given that what was expected happened, markets responded positively. If interested in why that is the case following important events as of late, see the Daily Brief for 2/1 and 2/2.
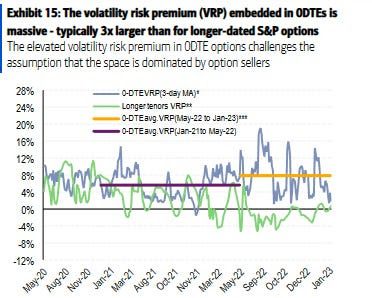
Graphic: Retrieved from Bank of America Corporation (NYSE: BAC) via Bloomberg. “Viewed through the lens of implied volatility — or expectations of how much an underlying asset will swing in the future — zero-day options aren’t particularly cheap in reality. The gap over the S&P 500’s realized volatility, something in derivatives parlance known as volatility risk premium, is typically three times higher than longer-dated contracts, according to BofA.” The compression of “will naturally lead to a buyback” that supports the market, Kai Volatility’s Cem Karsan says.
It was Treasury secretary Janet Yellen who took the market lower. Yellen said she has “not considered or discussed anything having to do with blanket insurance of guarantees of deposits,” and markets did not like that.
The likes of Pershing Square’s Bill Ackman responded he “would be surprised if deposit outflows don’t accelerate.” Adding, Federated Hermes’ Steve Chiavarone thought it was “astounding” Yellen and Powell would give contradictory messages.
“Powell essentially said that all deposits are safe; Yellen said, ‘Hold my beer.’ You would have thought that they would have coordinated,” responded Federated Hermes’ Steve Chiavarone.
To keep it brief, we’ll end with references to letters for 3/20 and 3/21, noting that the conditions for weak equity markets are present. The S&P 500 forward earnings are declining, the yield curve is inverted, unemployment is below average, manufacturing PMIs are below 50, and 40% of banks are tightening lending, Morgan Stanley (NYSE: MS) strategists explain.
Technical
As of 8:55 AM ET, Thursday’s regular session (9:30 AM – 4:00 PM ET) in the S&P 500 will likely open in the middle part of a positively skewed overnight inventory inside the prior day’s range, suggesting a limited potential for immediate directional opportunity.
The S&P 500 pivot for today is $3,994.25.
Key levels to the upside include $4,004.25, $4,017.00, and $4,026.75.
Key levels to the downside include $3,977.00, $3,959.25, and $3,946.75.
Disclaimer: Click here to load the updated key levels via the web-based TradingView platform. New links are produced daily. Quoted levels likely hold, barring an exogenous development.
Graphic: 65-minute profile chart of the Micro E-mini S&P 500 Futures.
Definitions
Volume Areas: Markets will build on areas of high-volume (HVNodes). Should the market trend for some time, this will be identified by a low-volume area (LVNodes). The LVNodes denote directional conviction and ought to offer support on any test.
If participants auction and find acceptance in an area of a prior LVNode, then future discovery ought to be volatile and quick as participants look to the nearest HVNodes for more favorable entry or exit.
POCs: Areas where two-sided trade was most prevalent in a prior day session. Participants will respond to future value tests as they offer favorable entry and exit.
About
The author, Renato Leonard Capelj, spends the bulk of his time at Physik Invest, an entity through which he invests and publishes free daily analyses to thousands of subscribers. The analyses offer him and his subscribers a way to stay on the right side of the market.
You may view this letter’s content calendar at this link.
Disclaimer
Do not construe this newsletter as advice. All content is for informational purposes. Capelj and Physik Invest manage their own capital and will not solicit others for it.
Editor’s Note: The Daily Brief is a free glimpse into the prevailing fundamental and technical drivers of U.S. equity market products. Join the 200+ that read this report daily, below!
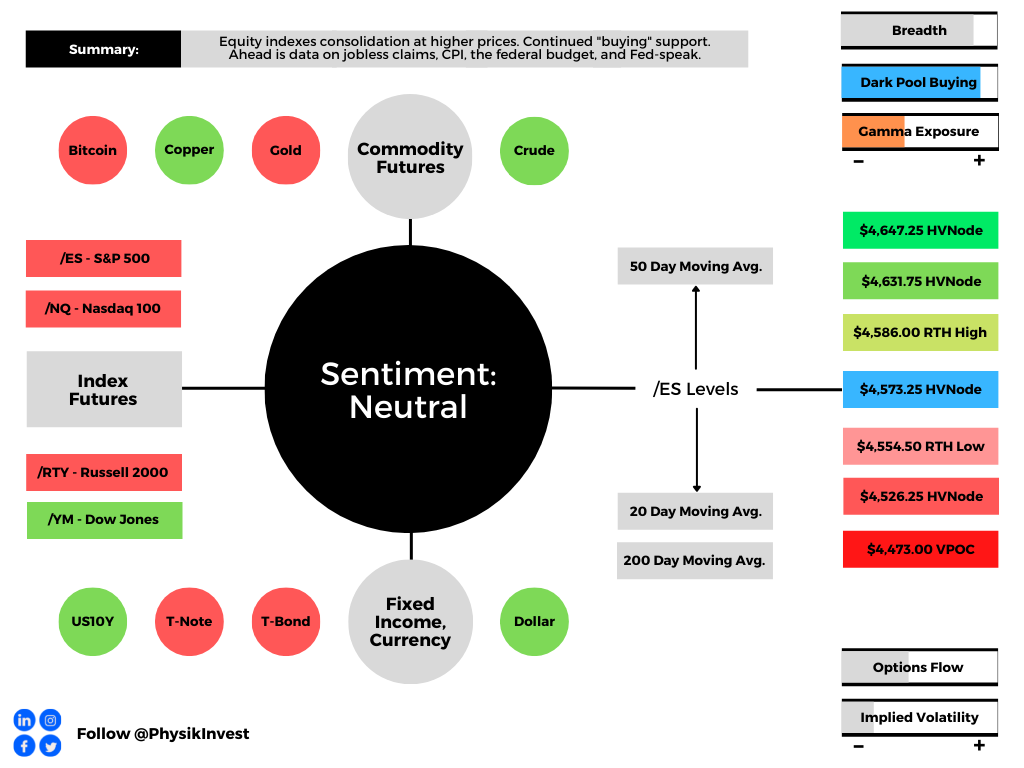
Overnight, equity index futures auctioned off recovery highs, with bonds. Most commodity products held a bid, as did measures of equity index implied volatility (IV).
Ahead is data on Jobless Claims, the Consumer Price Index (8:30 AM ET), the Federal Budget (2:00 PM ET), and Fed-speak (7:00 PM ET).
Graphic updated 6:50 AM ET. Sentiment Neutral if expected /ES open is inside of the prior day’s range. /ES levels are derived from the profile graphic at the bottom of the following section. Levels may have changed since initially quoted; click here for the latest levels. SqueezeMetrics Dark Pool Index (DIX) and Gamma (GEX) calculations are based on where the prior day’s reading falls with respect to the MAX and MIN of all occurrences available. A higher DIX is bullish. At the same time, the lower the GEX, the more (expected) volatility. Learn the implications of volatility, direction, and moneyness. SHIFT data used for S&P 500 (INDEX: SPX) options activity. Note that options flow is sorted by the call premium spent; if more positive, then more was spent on call options. Breadth reflects a reading of the prior day’s NYSE Advance/Decline indicator. VIX reflects a current reading of the CBOE Volatility Index (INDEX: VIX) from 0-100.
What To Expect
Fundamental: Participants have readied themselves for data on inflation.
According to Nordea Bank’s (OTC: NRDBY) research, though January inflation will be higher, ultimately leading to volatility in bonds and equities, there will be a moderation in momentum.
The headline figure may print at 7.4% y/y (consensus: 7.2%) while core inflation may print 5.9% y/y (consensus: 5.9%). This is after CPI basket weights were updated and show an increased weight towards the prices that are rising the most (used cars and shelter costs).
“An above-consensus print could imply frontloading of hikes and increased speculation in a 50bp March-hike,” Nordea’s Philip Maldia Madsen and Helene Østergaard explain.
“Frontloading rate hikes support the USD, but substantial gains may require higher terminal rates pricing (more hikes priced, not just faster).”
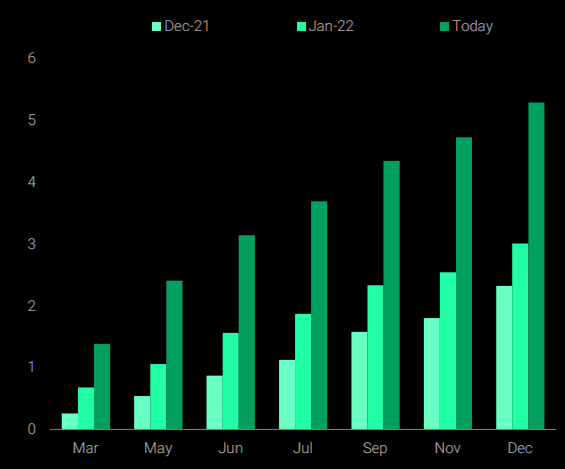
Graphic: Via TS Lombard. Taken from The Market Ear. Market prices in more than five rate hikes in 2022.
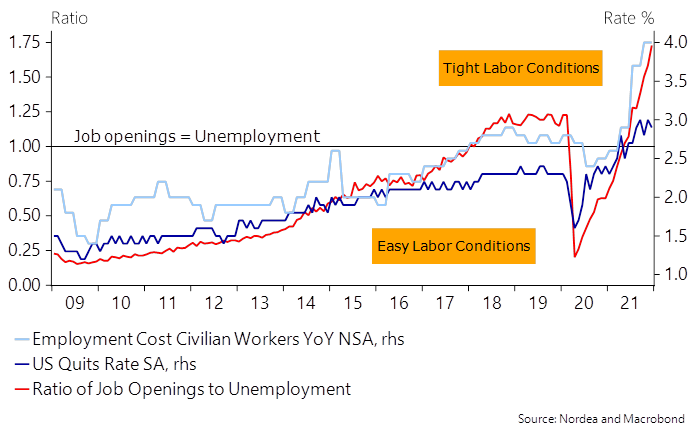
This is as U.S. labor conditions have tightened markedly, fueling a “sell-off in the short-end of the USD curve as inflation risks remain historically high.”
Graphic: Via Nordea, “the million-dollar question for 2022 remains whether wage growth will persist as base effects start to kick in.”
Taken together, data points to the Federal Reserve staying hawkish and a continued risk in shorter-duration bonds.
Andreas Steno Larsen of Heimstaden, who this newsletter quoted, yesterday, has explained that despite inflation printing higher in Q1, the trends will shift in Q2-Q4, given new CPI weights.
“The changes made by the BLS hence provide a net/net negative impact on inflation down the line (likely during H2-2022 already), but not before another positive tilt to inflation is seen in the very short-term.”
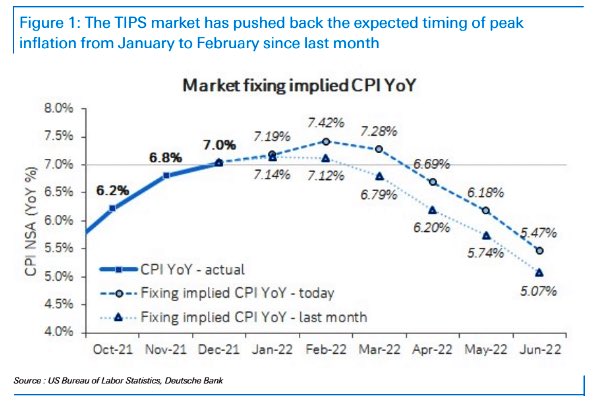
Graphic: Via Deutsche Bank (NYSE: DB), inflation proving stickier.
What is the outlook for bonds and tech? Steno Larsen suggests it is benign.
“I don’t really fear the planned QT from the Fed in that regards either,” he elaborates.
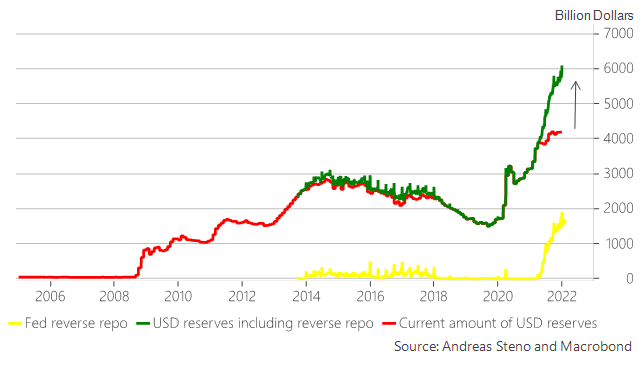
“We will not see a strong negative USD liquidity effect from QT initially as the gap between the total amount of printed USD reserves and the current amount of USD reserves available to the banking system will act as a buffer once the Fed starts bringing down the balance sheet size (QT).”
Graphic: Via Steno Larsen, “USD reserves currently parked at the reverse repo will flow into T-bills once QT commences effectively leaving USD liquidity unchanged as frozen reverse repo liquidity will be unleashed into the system, … [mitigating] the adverse effects of the Fed trying to bring down the balance sheet size again, and this is in sharp contrast to the QT process of 2017-2018.”
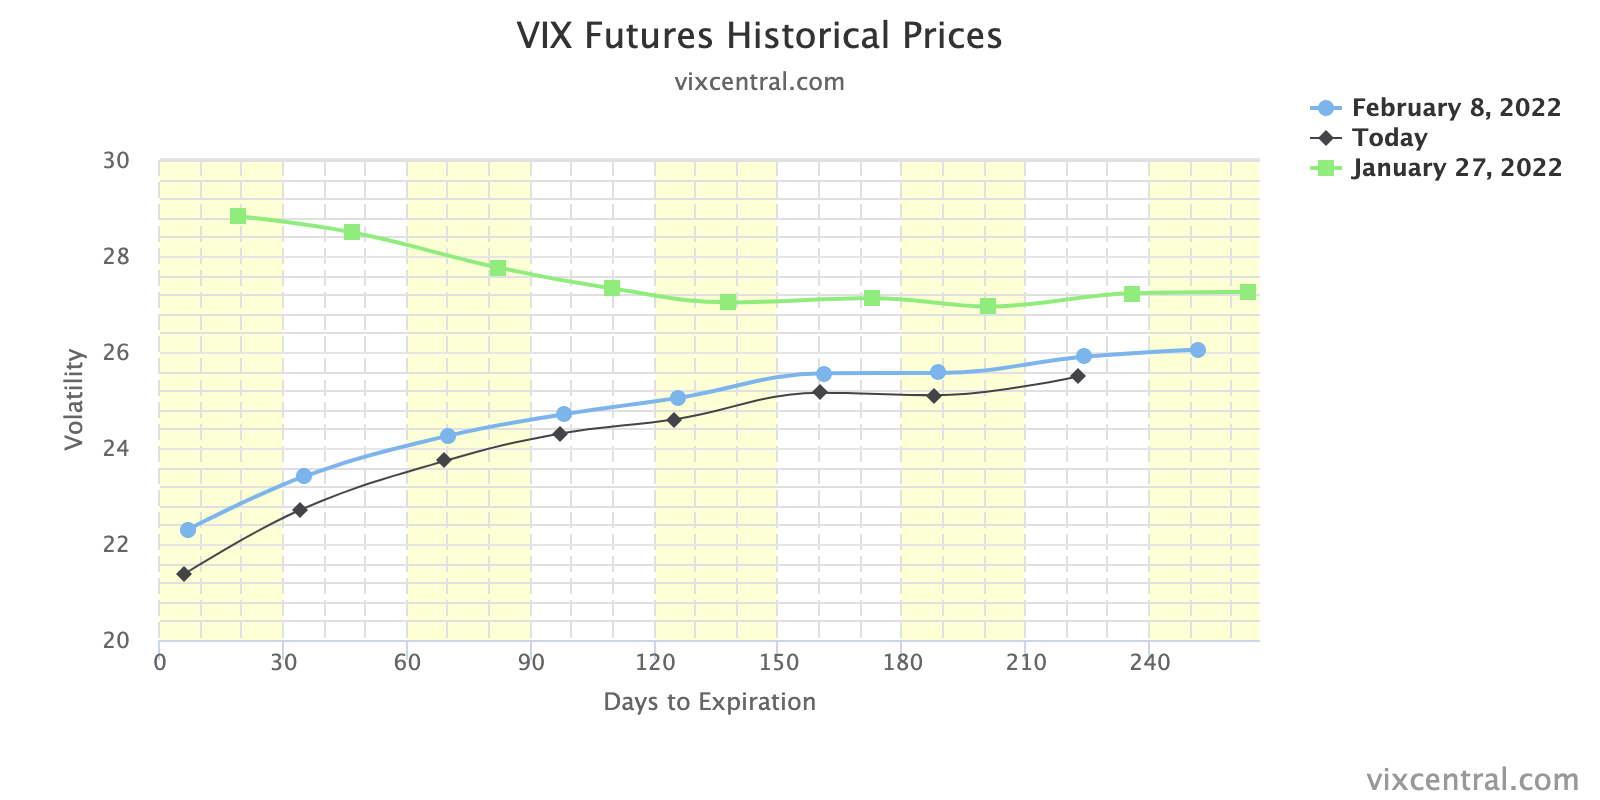
Positioning: The effects of continued volatility compression contended with demand for protection, yesterday.
Graphic: VIX term structure continues to compress. This solicits flows that may bolster a price rise.
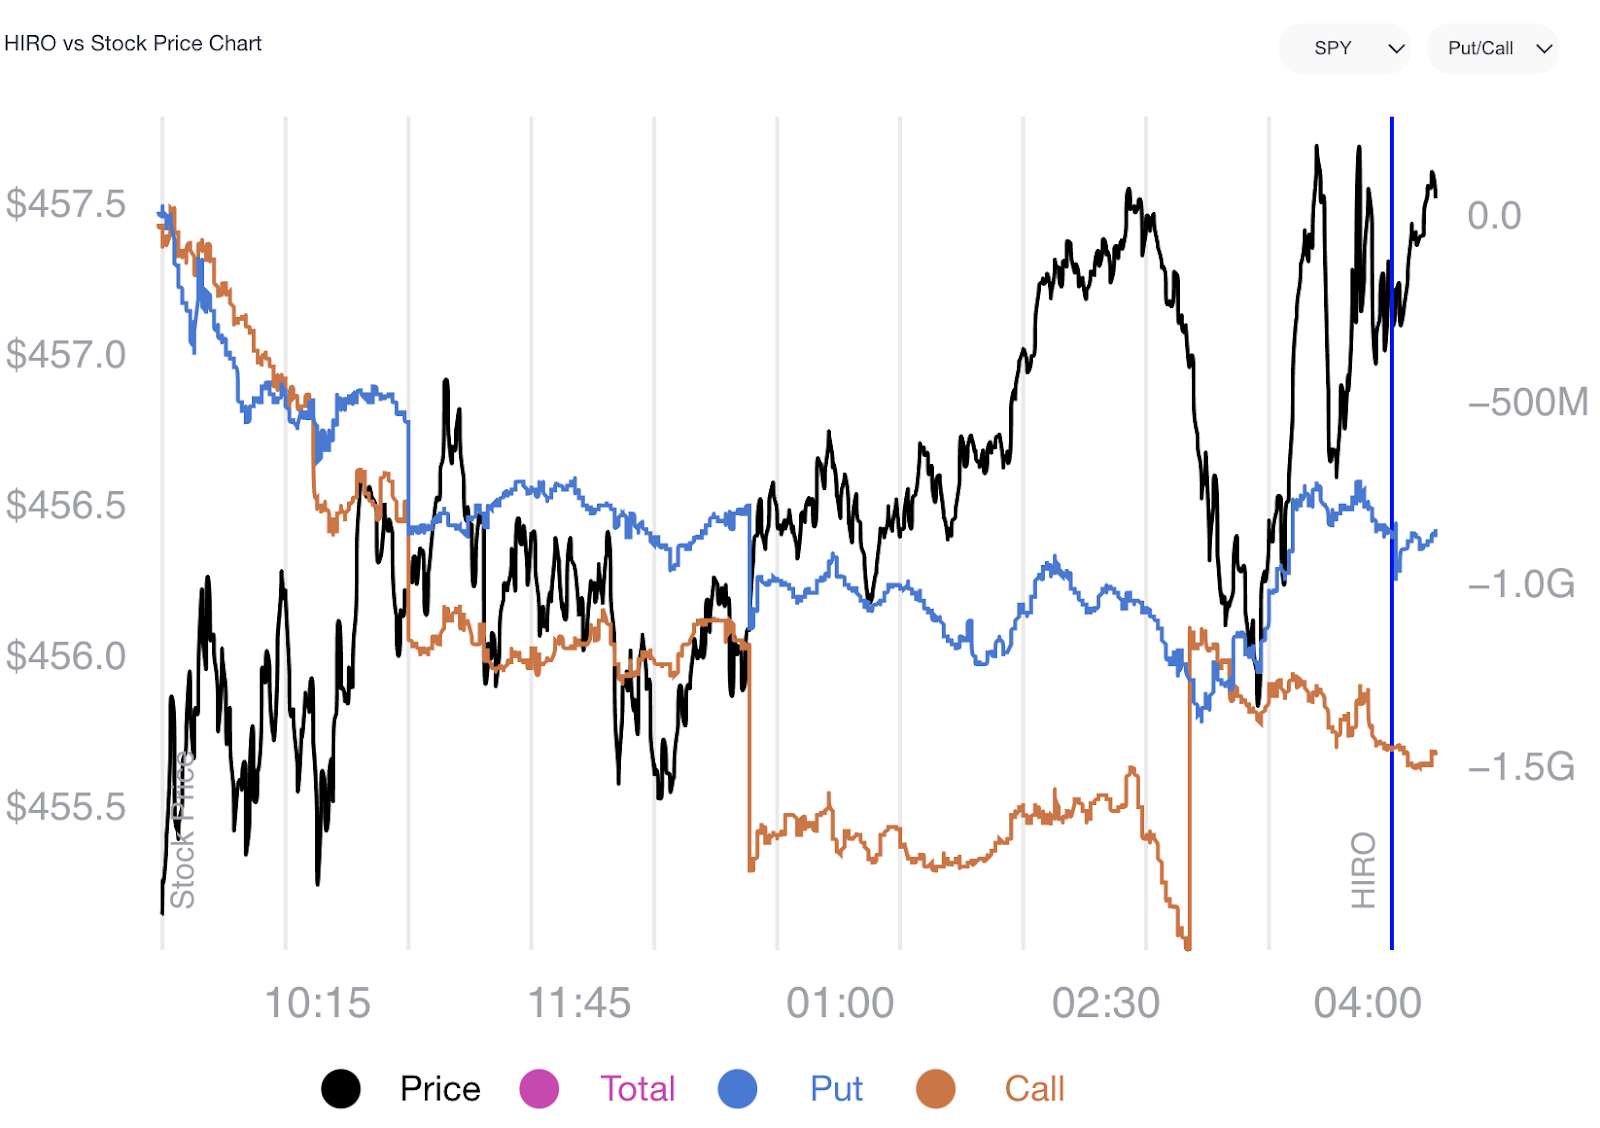
In the face of a sort-of upward drift, participants legged into negative delta (-delta) trades that offered them positive exposure to the downside.
Below is a chart of SpotGamma’s (beta) Hedging Impact of Real-Time Options indicator. Notice the trend in the blue (put) and orange (call) lines. This trend denotes demand for -delta (call selling and put buying) which translates to pressure from dealers who are selling underlying (adding -delta) against their positive delta (+delta) options exposure.
Graphic: SpotGamma’s HIRO indicator for the SPDR S&P 500 ETF Trust (NYSE: SPY).
As stated, the pressure from this divergence was offset by continued compression in volatility; as time and volatility trend to zero, the supportive hedging flows with respect to time (charm) and volatility (vanna), along with “passive buying support,” took from the negative implications of customer demand for protection.
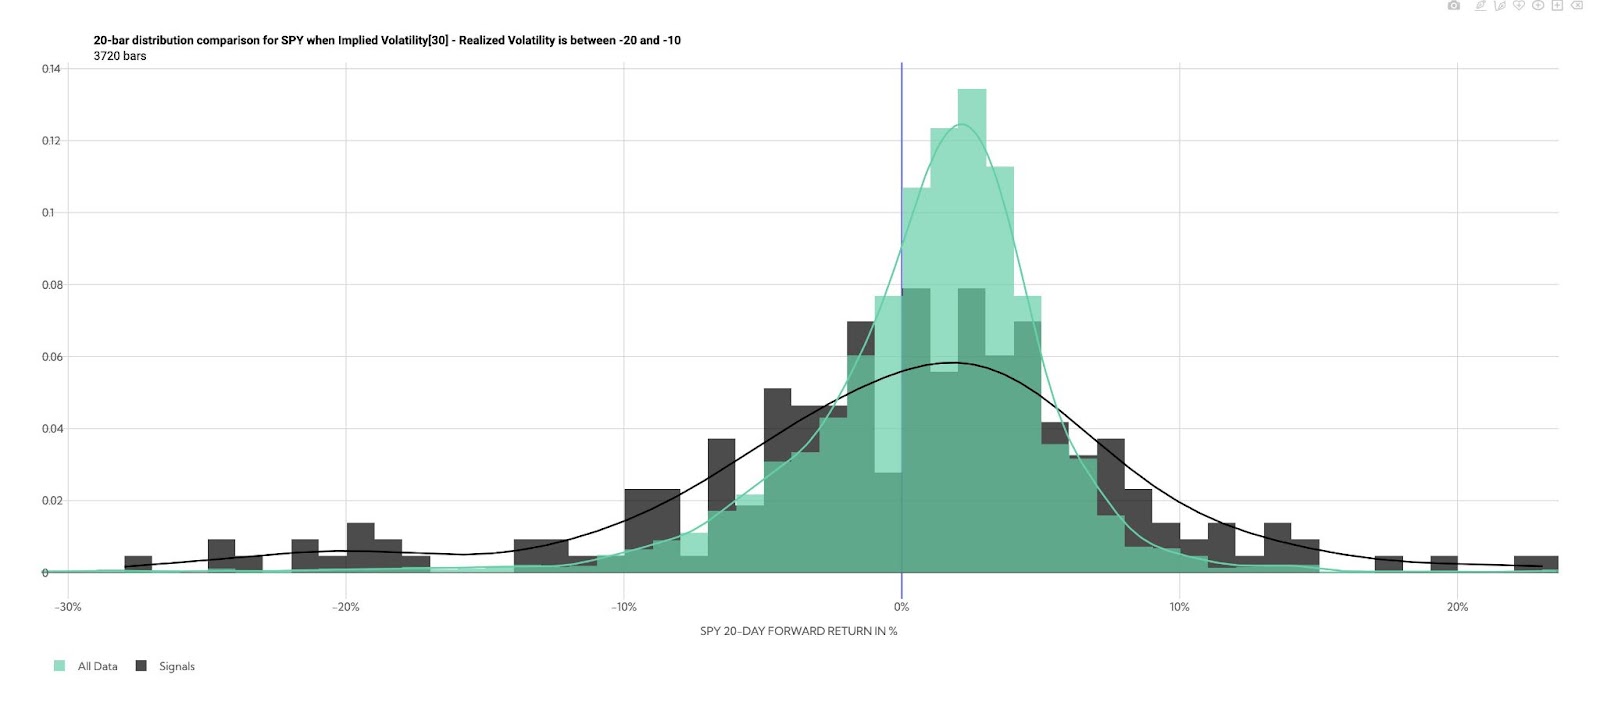
Overall, similar to yesterday, buying proxies still point to modest bullishness.
Graphic: Via @HalfersPower, the forward return distribution for SPY when implied volatility less realized volatility is between -20 and -10. “VRP (30 Day ATM Implied Volatility – 21 Day Realized Volatility (Y-Z) is the most deeply negative since the 2020 crash at -12 pts (hitting as low as -14 on Wednesday).”
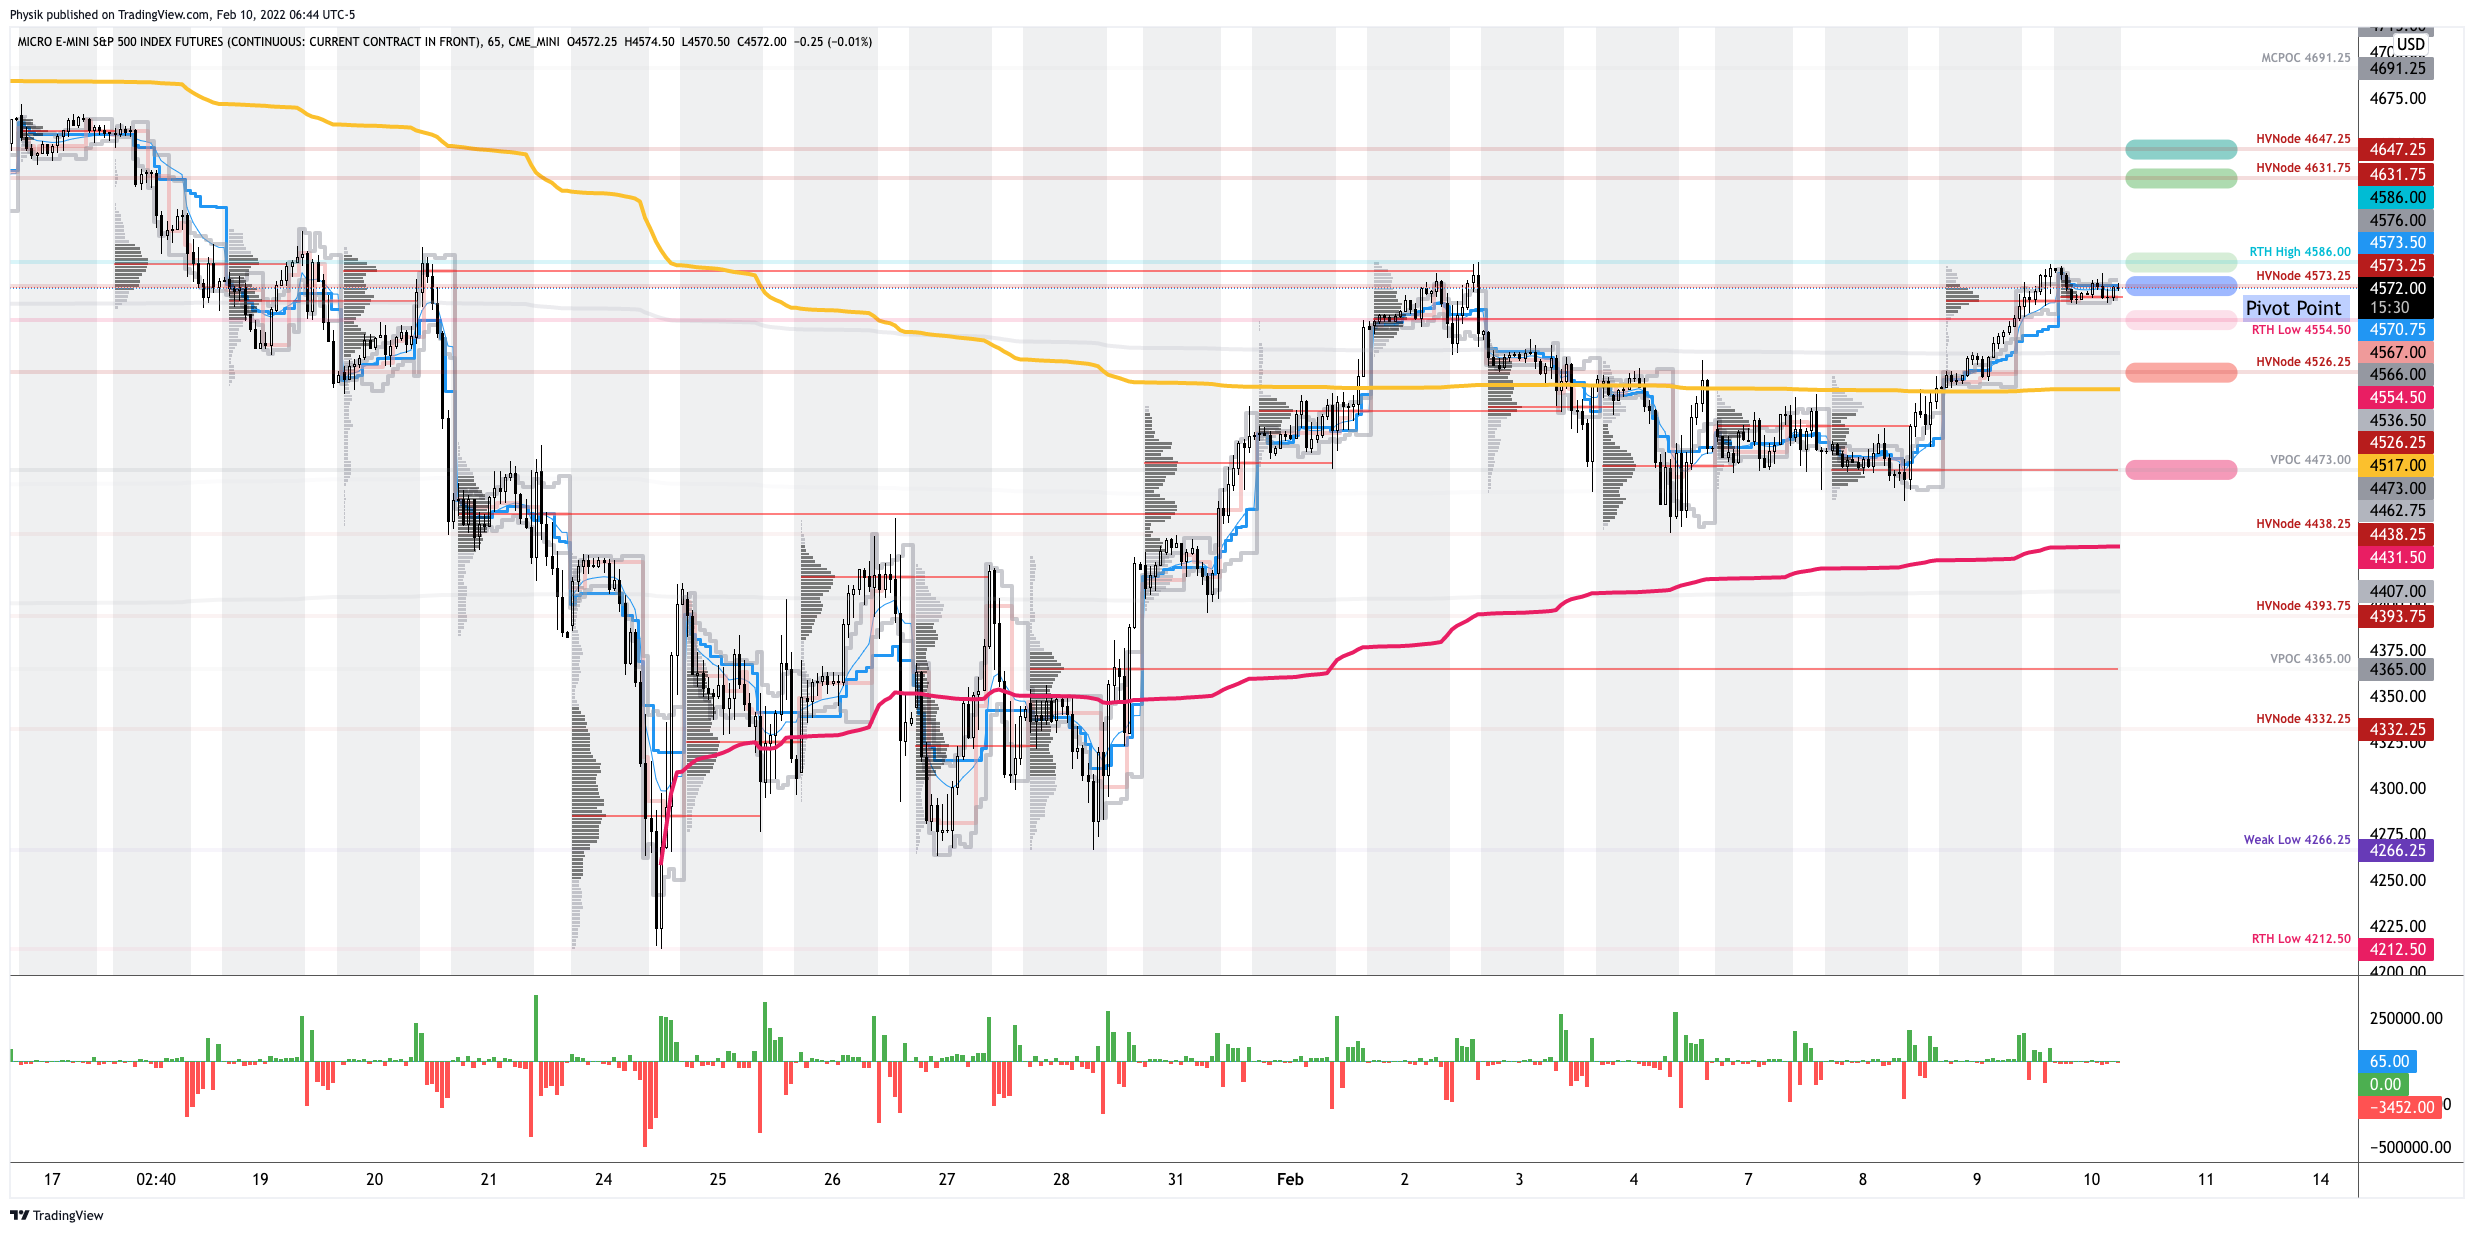
Technical: As of 6:30 AM ET, Monday’s regular session (9:30 AM – 4:00 PM ET), in the S&P 500, will likely open in the middle part of a negatively skewed overnight inventory, inside of prior-range and -value, suggesting a limited potential for immediate directional opportunity.
In the best case, the S&P 500 trades higher; activity above the $4,573.25 high volume area (HVNode) puts in play the $4,586.00 regular trade high (RTH High). Initiative trade beyond the RTH High could reach as high as the $4,631.75 and $4,647.25 HVNodes, or higher.
In the worst case, the S&P 500 trades lower; activity below the $4,573.25 HVNode puts in play the $4,554.50 RTH Low. Initiative trade beyond the RTH Low could reach as low as the $4,526.25 HVNode and $4,473.00 VPOC, or lower.
Click here to load today’s key levels into the web-based TradingView charting platform. Note that all levels are derived using the 65-minute timeframe. New links are produced, daily.
Graphic: 65-minute profile chart of the Micro E-mini S&P 500 Futures.
What People Are Saying
20% probability the Fed is gonna hike >7 times in 2022 (!), & then bring Fed Funds to 2% soon after that.
Yet 30y yields can’t breach 2.25%.
Let’s see if https://t.co/HtlHaKOguK is delivering on its teaching mission: what’s the bond market telling you?
Volume Areas: A structurally sound market will build on areas of high volume (HVNodes). Should the market trend for long periods of time, it will lack sound structure, identified as low volume areas (LVNodes). LVNodes denote directional conviction and ought to offer support on any test.
If participants were to auction and find acceptance into areas of prior low volume (LVNodes), then future discovery ought to be volatile and quick as participants look to HVNodes for favorable entry or exit.
POCs: POCs are valuable as they denote areas where two-sided trade was most prevalent in a prior day session. Participants will respond to future tests of value as they offer favorable entry and exit.
About
After years of self-education, strategy development, mentorship, and trial-and-error, Renato Leonard Capelj began trading full-time and founded Physik Invest to detail his methods, research, and performance in the markets.
Capelj is also a Benzinga finance and technology reporter interviewing the likes of Shark Tank’s Kevin O’Leary, JC2 Ventures’ John Chambers, FTX’s Sam Bankman-Fried, and ARK Invest’s Catherine Wood, as well as a SpotGamma contributor developing insights around impactful options market dynamics.
Disclaimer
Physik Invest does not carry the right to provide advice.
In no way should the materials herein be construed as advice. Derivatives carry a substantial risk of loss. All content is for informational purposes only.