Categories
Commentary

Daily Brief For May 3, 2022

The Daily Brief is a free glimpse into the prevailing fundamental and technical drivers of U.S. equity market products. Join the 200+ that read this report daily, below!

What Happened

Overnight, equity index futures were sideways, inside of the prior range, after exploring much lower, Monday. Measures of implied volatility, bonds, and most commodities were bid.

This is alongside news that Russia is dodging default, the necessity for the Fed to drop inflation down to 4% by year-end per Citadel’s Ken Griffin, the U.S. Treasury’s intent to scale back sales of longer-term debt, falling earnings estimates, Taiwan preparing to fend-off a potential invasion as Beijing ordered officials to find ways to fight against western sanctions, similar to those used against Russia, among other things including Fitch trimming China’s 2022 growth forecast.

Also, near risk-free, inflation-protected I bonds will pay 9.62% through October, the Treasury said, and here’s more on the Citigroup Inc (NYSE: C) trader that’s behind a European crash.

Ahead is data on job openings and quits, as well as factory and core capital goods orders (10:00 AM ET).

Read on for coverage on the fundamental and technical position of the market, as well as ways to position for future trade.
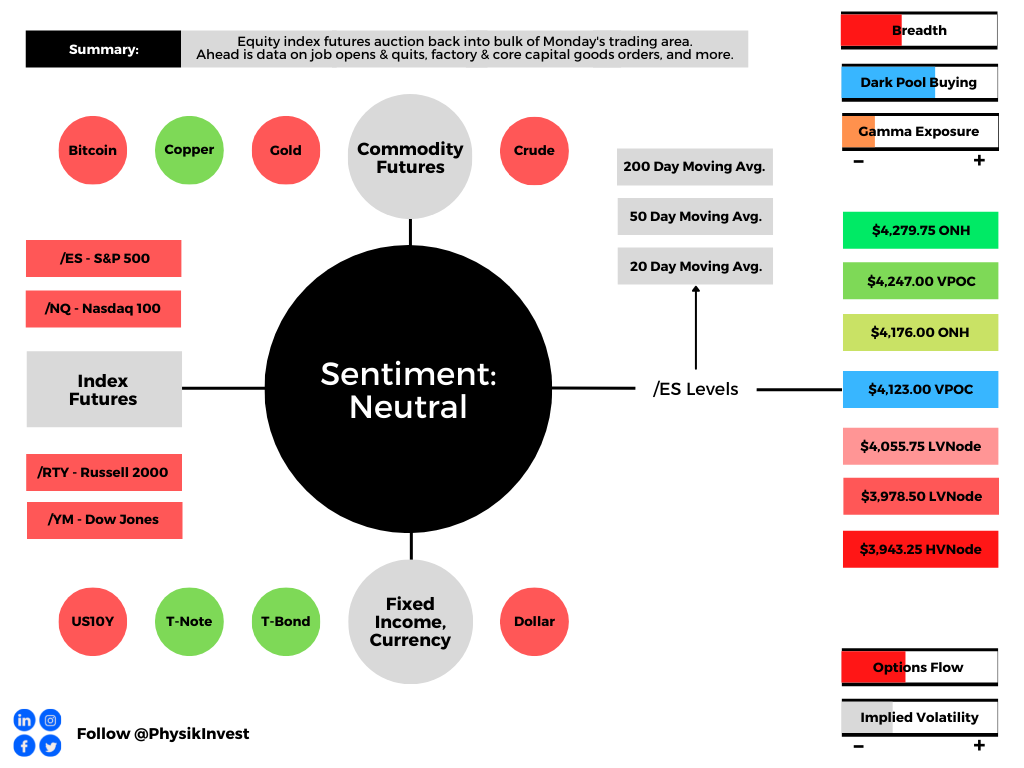
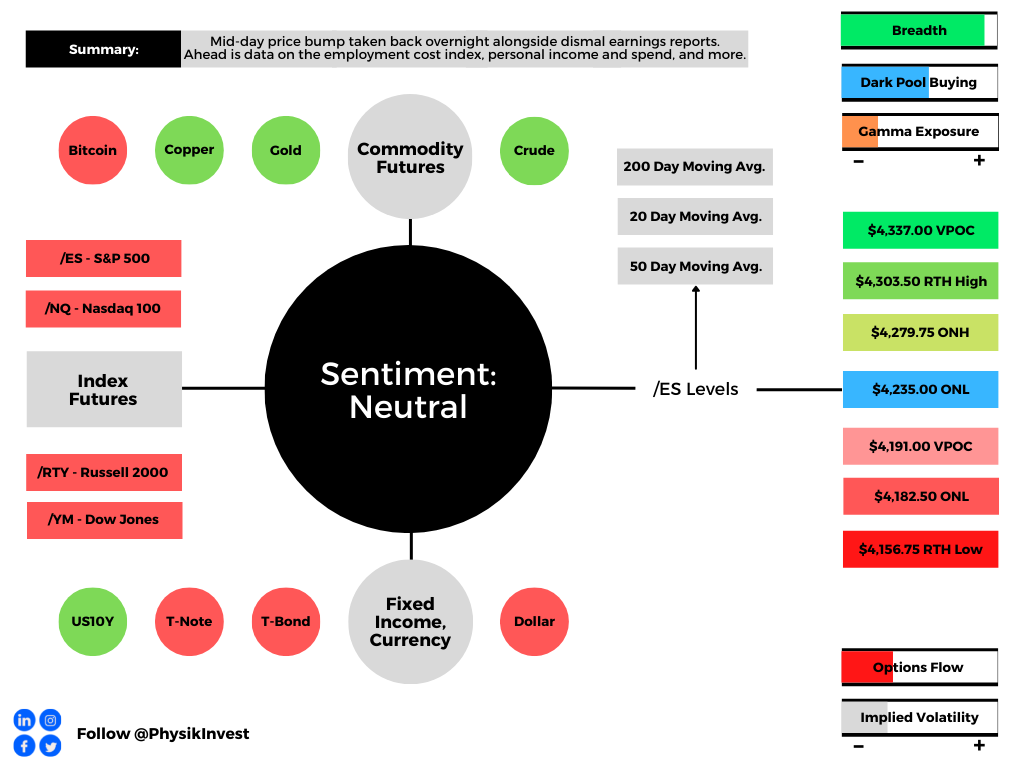
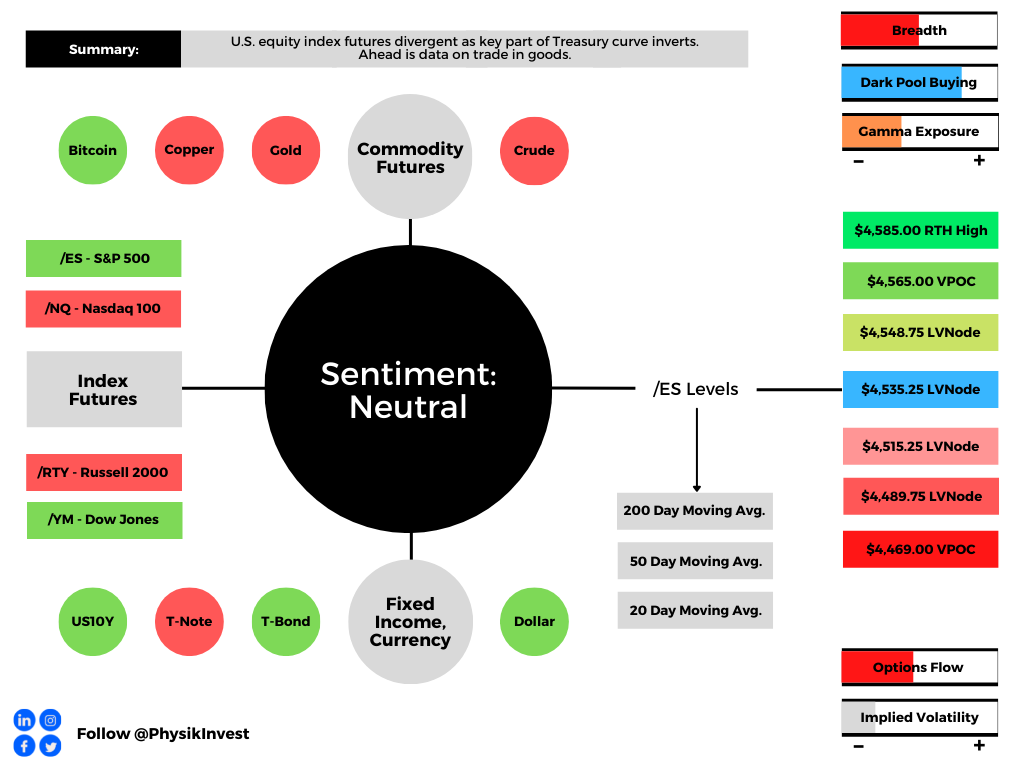
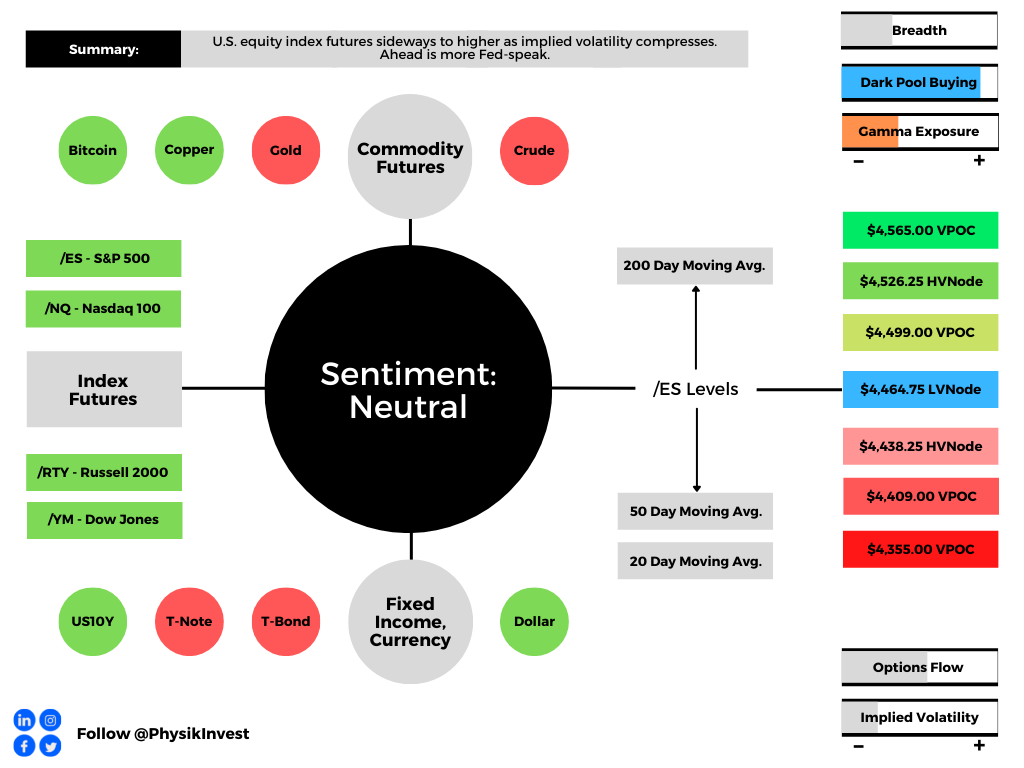
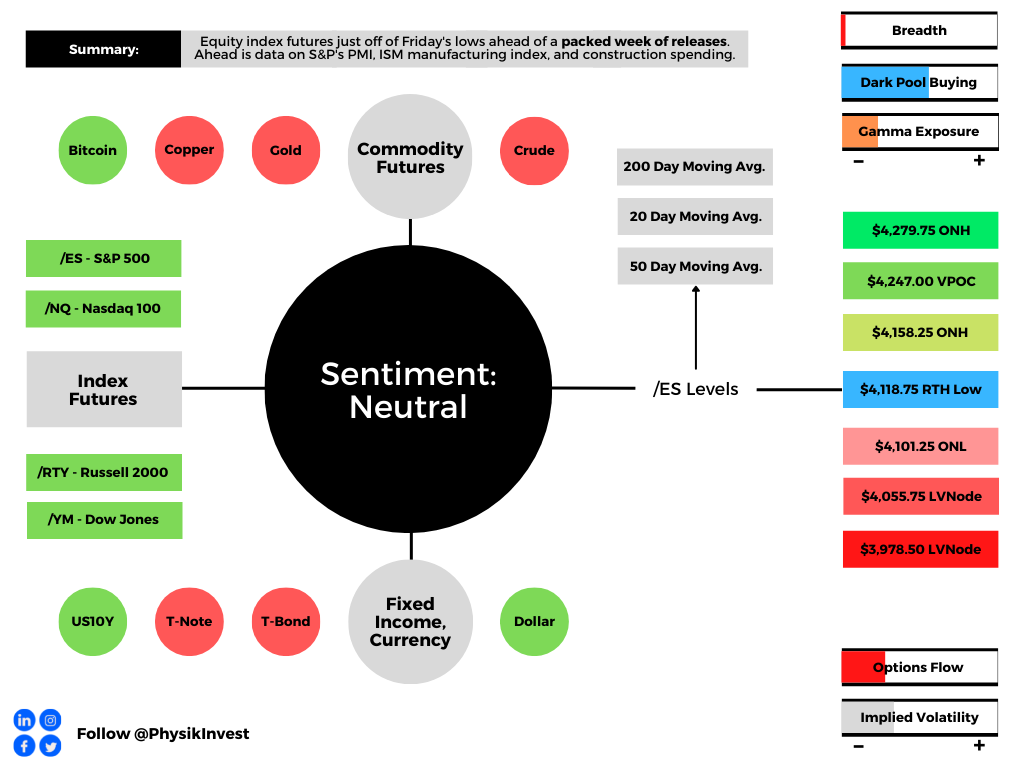
Graphic updated 6:45 AM ET. Sentiment Neutral if expected /ES open is inside of the prior day’s range. /ES levels are derived from the profile graphic at the bottom of the following section. Levels may have changed since initially quoted; click here for the latest levels. SqueezeMetrics Dark Pool Index (DIX) and Gamma (GEX) calculations are based on where the prior day’s reading falls with respect to the MAX and MIN of all occurrences available. A higher DIX is bullish. At the same time, the lower the GEX, the more (expected) volatility. Learn the implications of volatility, direction, and moneyness. SHIFT data used for S&P 500 (INDEX: SPX) options activity. Note that options flow is sorted by the call premium spent; if more positive, then more was spent on call options. Breadth reflects a reading of the prior day’s NYSE Advance/Decline indicator. VIX reflects a current reading of the CBOE Volatility Index (INDEX: VIX) from 0-100.

What To Expect

Fundamental: The Federal Reserve (Fed) is expected to raise its target overnight rate by about 50 basis points and provide updates on quantitative tightening (QT).
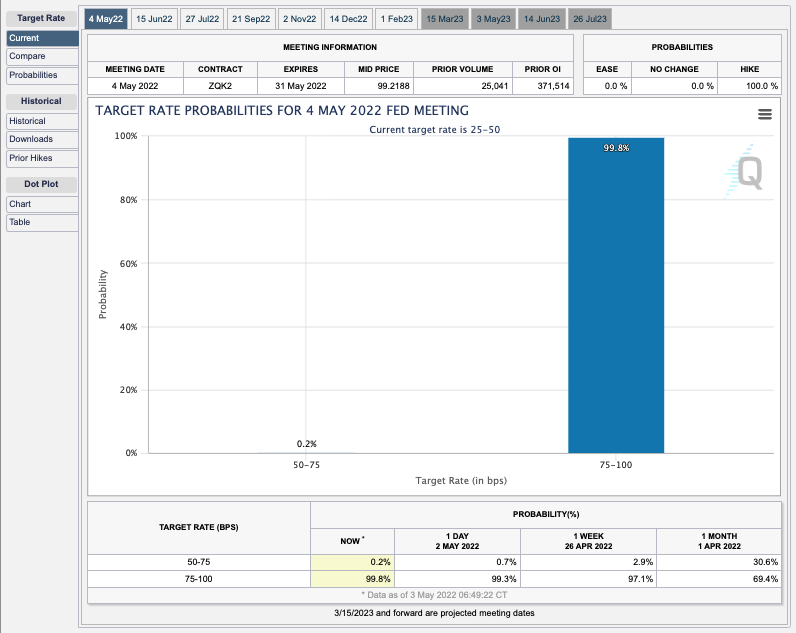
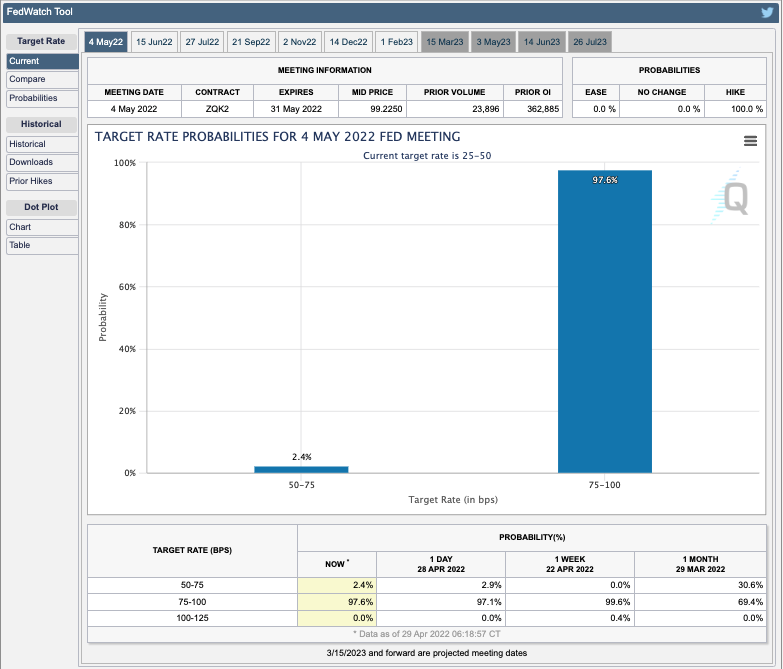
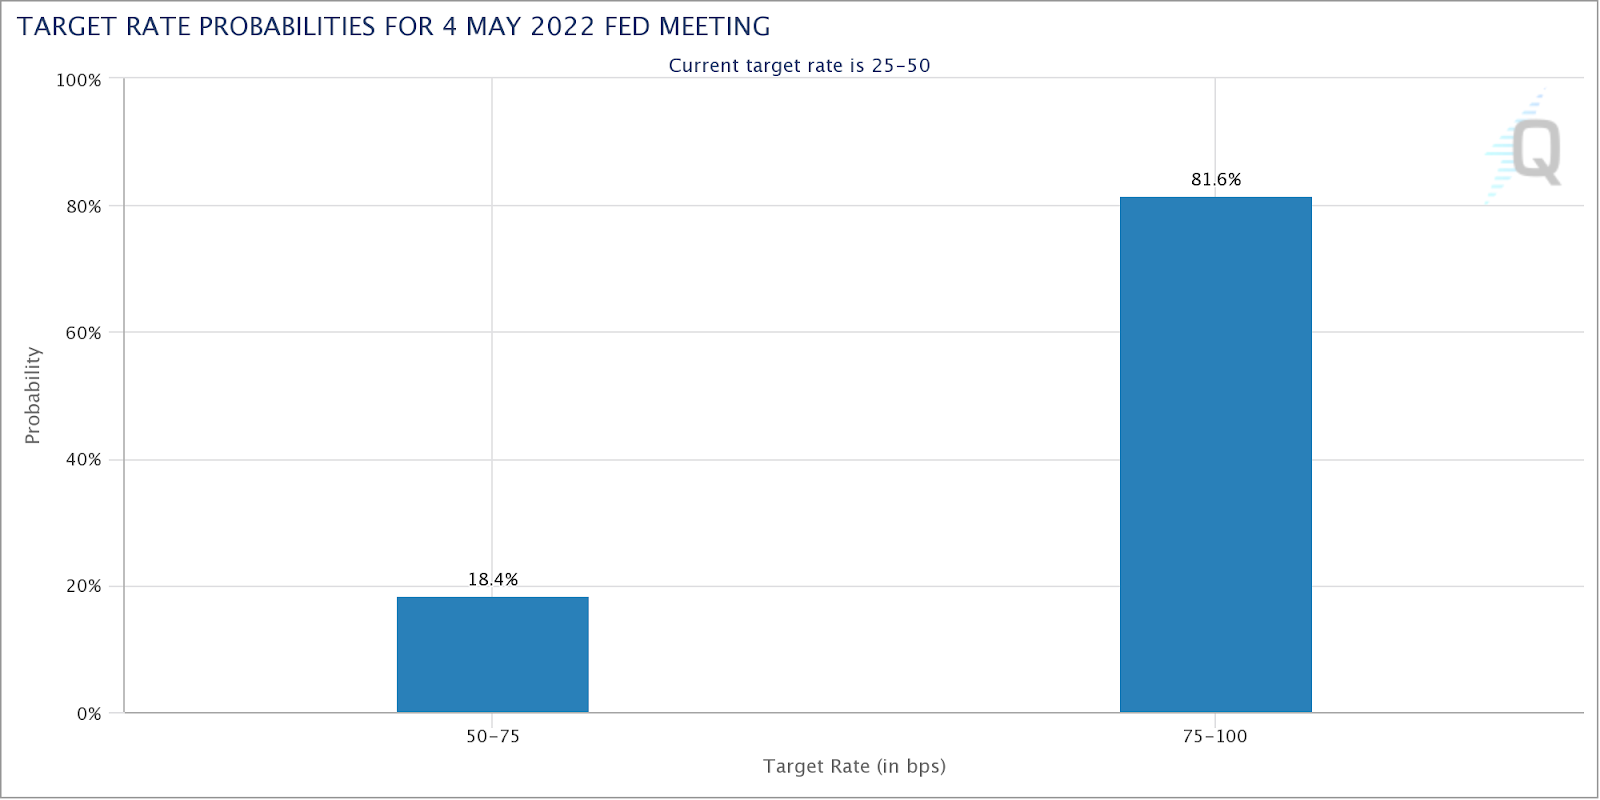
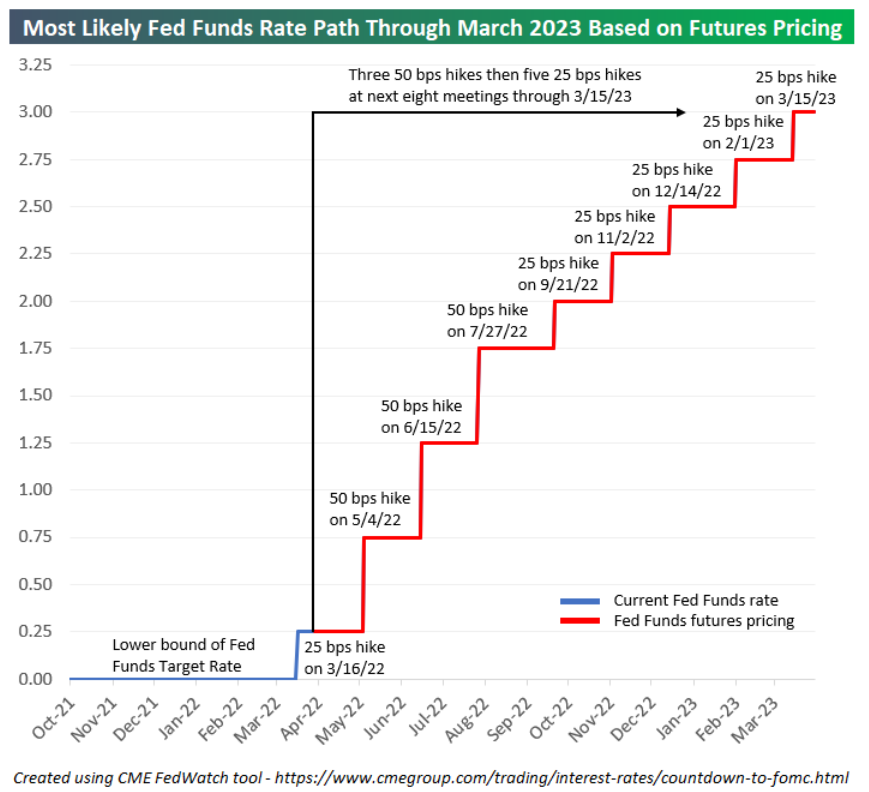
Graphic: Via CME Group Inc’s (NASDAQ: CME) FedWatch Tool. Market participants expect a near-100% chance the fed moves its target rate to 75 or 100 basis points.

The expectations of the aforementioned have played into a tightening of financial conditions which, as Columbia Threadneedle’s Gene Tannuzzo explains, “reduces demand and ultimately slows inflation.”

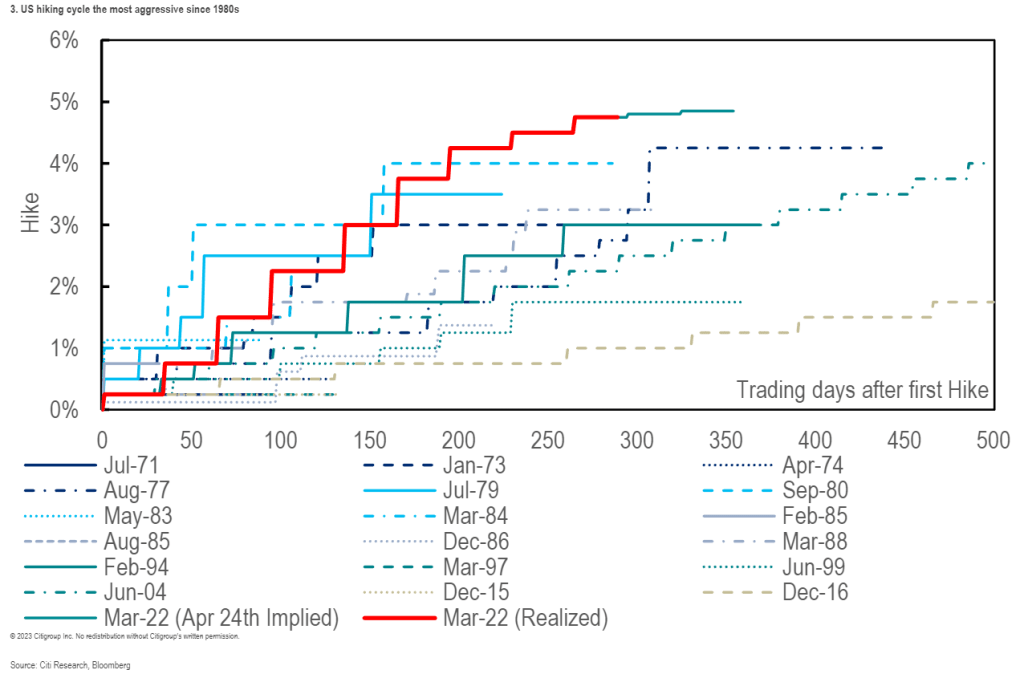
Graphic: Via Bloomberg. “Tighter financial conditions are the mechanism that reduces demand and ultimately slows inflation,” said Tannuzzo, the firm’s global head of fixed income. “If financial conditions don’t tighten and inflation remains high, in their eyes, they need to hike more.”

The key is the update on QT. As Bloomberg’s John Authers puts it well, “what the Fed does with its balance sheet at the margin [] matters for asset prices, and there is little or no lag.”
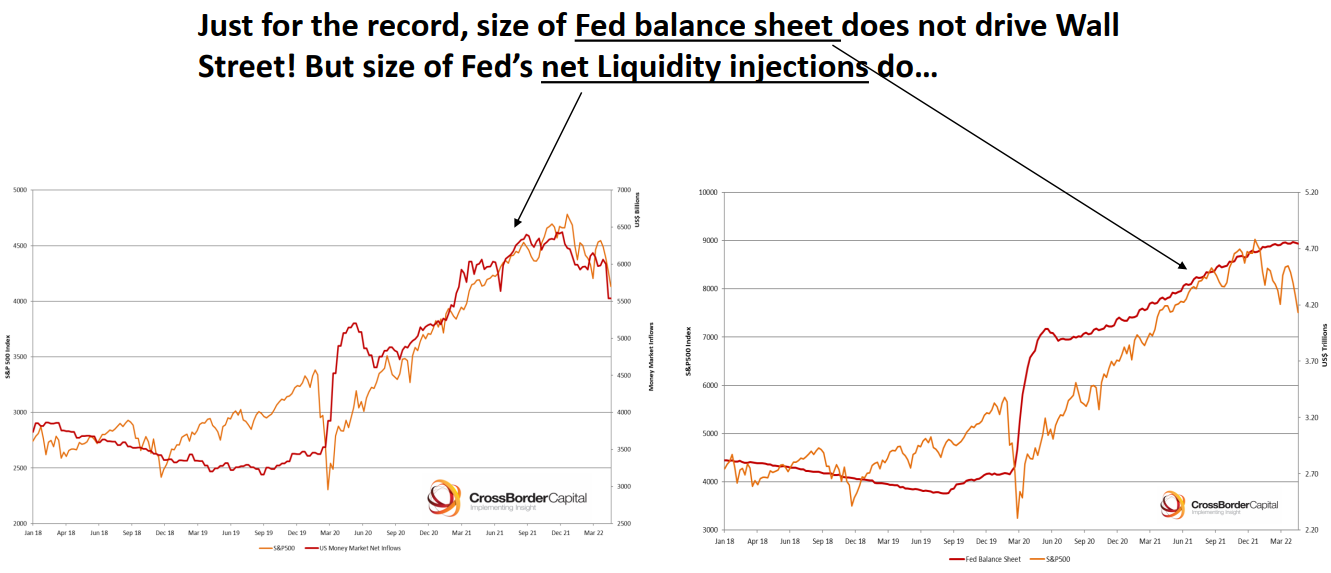
Graphic: Via Crossborder Capital Ltd. Taken from Bloomberg.

The Fed’s liquidity reductions, thus far, have played into the market’s troubles since the start of the year. This is as QT has an impact on the “ability to roll over or refinance investments.”

Graphic: Taken from The Market Ear. “46% of non-earnings driven market cap changes were explained by Fed balance sheet expansion since GFC.”

Perspective: JPMorgan Chase & Co (NYSE: JPM) strategists note that investors’ fears are unwarranted. The U.S.’s economic expansion has not been derailed. 

“Worries about China’s growth outlook, a negative take on the Q1 earnings reporting season, concerns about higher bond yields and further tightening of financial conditions from a strong dollar, all appear to have soured equity and credit investors’ sentiment,” the strategists said. 

“We find these fears overblown.”

Positioning: Comments from yesterday’s morning letter remain valid, today.

Participants’ bets on the direction are concentrated in negative delta (long puts, short calls). The exposure is short-dated and extremely sensitive to changes in implied volatility and direction.
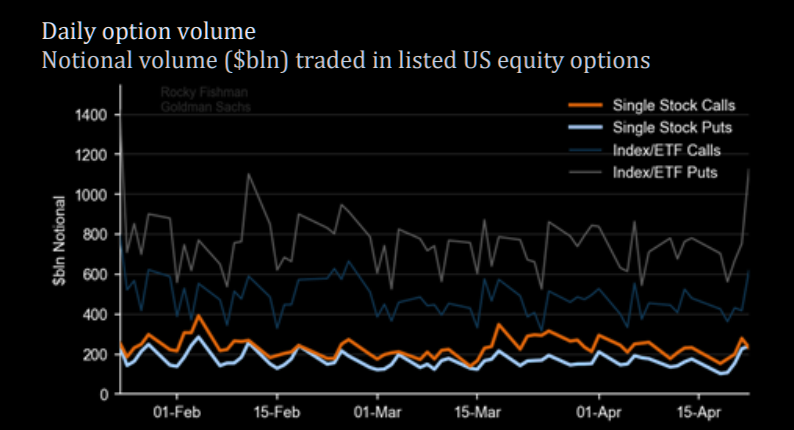
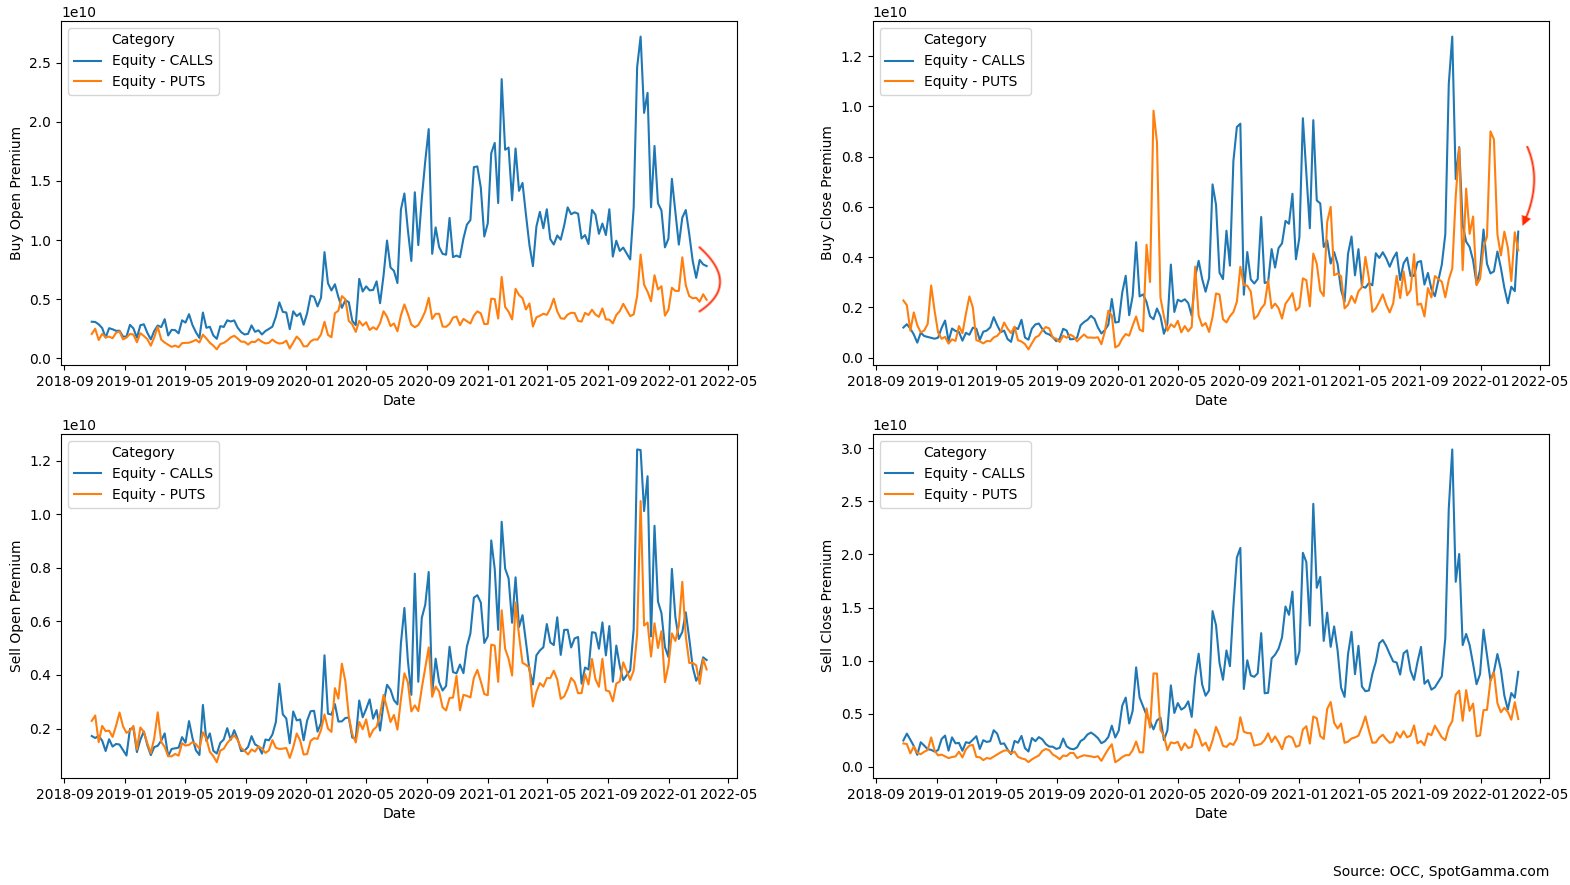
Graphic: Via Goldman Sachs Group Inc (NYSE: GS). Taken from The Market Ear. “Retail Investors buyers of 0-1 DTE (days-to-expiry) puts are largest on record.”

Those options carry a lot of gamma and are exposed to the potential for asymmetric or convex payouts. This is not good for those who are on the other side.

In hedging a short put, for instance, a positive delta and negative gamma trade, counterparties sell underlying if there is weakness or jumps in implied volatility. If the underlying trades higher, or dips in volatility, the counterparty will buy the underlying, all else equal.

Taken together, in such an environment, the counterparty leans toward taking liquidity and this exacerbates underlying movement if there’s a thinning liquidity environment, SpotGamma says.
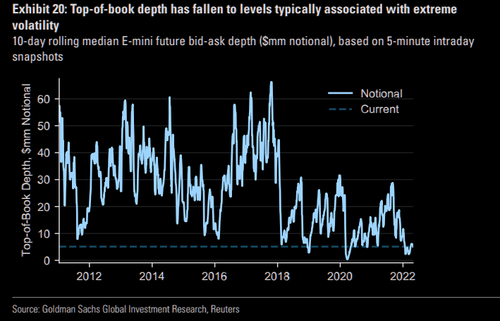
Graphic: Via Goldman Sachs Group Inc (NYSE: GS). Taken from SpotGamma.

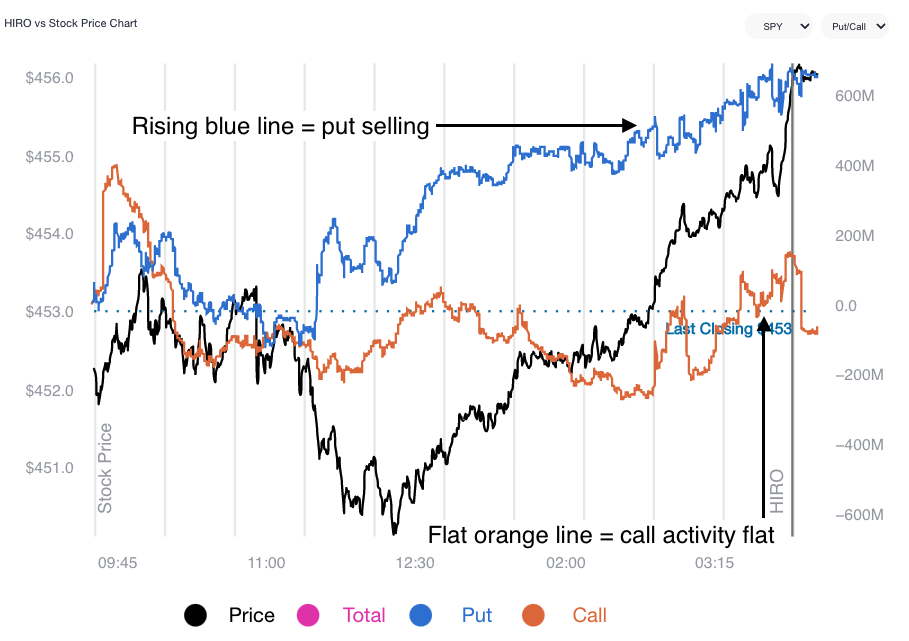
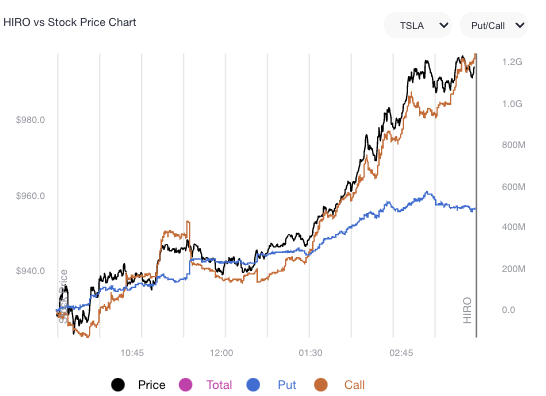
In other words, hedging matters more in such an environment. This was clear during Monday’s trade when a bout of put selling and light call buying appeared in both the SPDR S&P 500 ETF Trust (NYSE: SPY) and Invesco QQQ Trust Series 1 (NASDAQ: QQQ).

This, ultimately, too, fed into the compression of volatility at the short-end of the term structure, yesterday. To re-hedge, counterparts likely bought into the market’s weakness and bolstered the near-vertical reversal, and close higher.
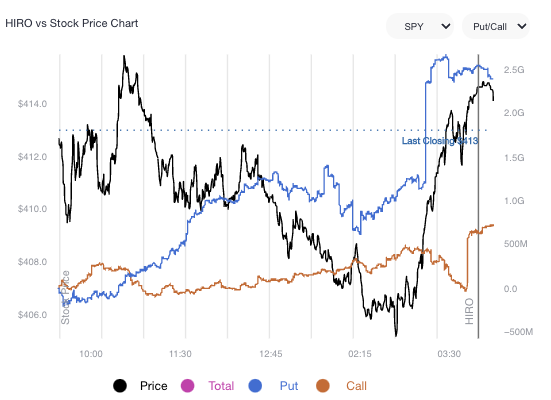
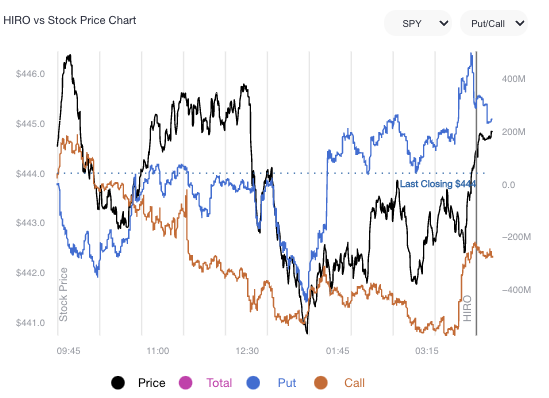
Graphic: SpotGamma’s Hedging Impact of Real-Time Options (HIRO) indicator for SPY. A rising blue and orange denote put selling and call buying, respectively.

The odds of follow-through, to the upside, come back to the fundamental situation and Fed announcements this week. Should fears with respect to monetary policy be assuaged, then volatility can compress and that, alone, will spur a buy-back of those underlying short hedges.

If participants start to concentrate their bets at higher prices, further out in time, that confirms the odds of sustained follow-through. If not, it’s likely that prices, after a short-term relief, will succumb to fundamental weaknesses.

Technical: As of 6:45 AM ET, Tuesday’s regular session (9:30 AM – 4:00 PM ET), in the S&P 500, will likely open in the middle part of a balanced overnight inventory, inside of prior-range and -value, suggesting a limited potential for immediate directional opportunity.

In the best case, the S&P 500 trades higher; activity above the $4,123.00 untested point of control (VPOC) puts in play the $4,176.00 overnight high (ONH). Initiative trade beyond the ONH could reach as high as the $4,247.00 VPOC and $4,279.75 ONH, or higher.

In the worst case, the S&P 500 trades lower; activity below the $4,123.00 VPOC puts in play the $4,055.75 low volume area (LVNode). Initiative trade beyond the LVNode could reach as low as the $3,978.50 LVNode and $3,943.25 high volume area (HVNode), or lower.

Click here to load today’s key levels into the web-based TradingView charting platform. Note that all levels are derived using the 65-minute timeframe. New links are produced, daily.
Graphic: 65-minute profile chart of the Micro E-mini S&P 500 Futures.

Considerations: Most interesting was Monday’s response at a key technical level ($4,055.75) outlined in the morning letter.

Specifically, the E-mini S&P 500 probed $4,056.00 before staging a sharp reversal and closing higher. This is noteworthy as it tells us a lot about who has (or is gaining) the upper hand.

Push-and-pull, as well as responsiveness near key-technical areas (discernable visually on a chart), suggests technically-driven traders with shorter time horizons are (becoming) active.

Such traders often lack the wherewithal to defend retests and, additionally, this type of trade may suggest other time frame participants are waiting for more information to initiate trades.

Adding, the Federal Reserve’s meeting this week concludes with statements to be shared on Wednesday. For weeks heading into this event, (larger) participants (that move by committee) have de-grossed and hedged. For that reason, the reliability of our technical levels took a hit.
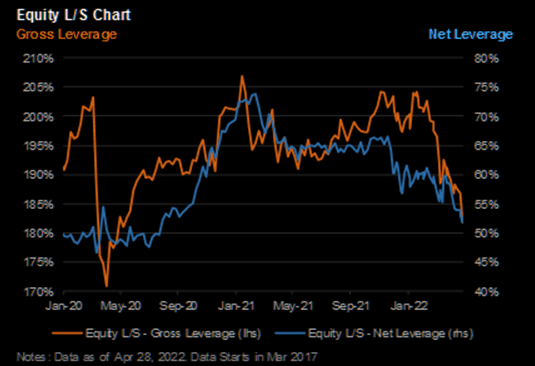
Graphic: Via JPMorgan Chase & Co (NYSE: JPM). Taken from The Market Ear. Per Bloomberg, “Hedge funds tracked by Morgan Stanley have also cut their net leverage — a measure of risk appetite that takes into account long versus short positions — to a two-year low.”

In the very near term, until more fundamental information is revealed, these technical-driven traders may play a larger role in the volatility. These traders, given capital constraints and tolerances, often trigger sharp moves in their entry and exit on news. Caution on whipsaw.

How I’m Playing: Presently, the market is stretched to the downside and participants are leaning, heavily, one way.
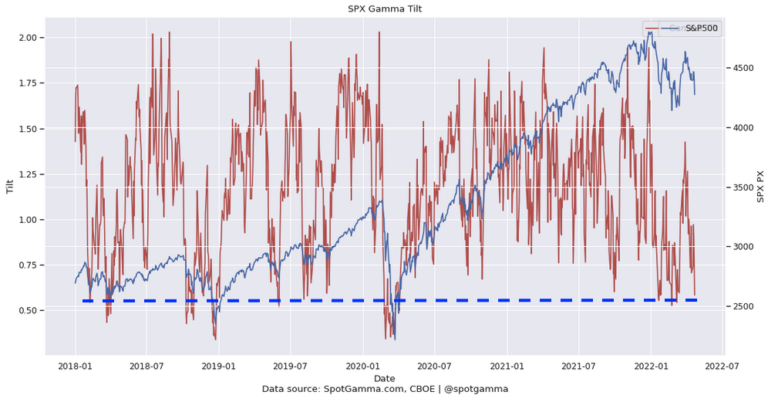
Graphic: Via SpotGamma, “Put vs Call gamma suggests stretched positioning.”

Pursuant to that remark, as SpotGamma says, “traders are underpricing right-tail risk,” and that opens the window for unique ways to play a returns distribution that is skewed positive (albeit with large negative outliers).

Consider zero- or low-cost bets that deliver asymmetric payouts in case of reversals.

This letter’s writer presently is structured positive delta and gamma in the Nasdaq 100 (INDEX: NDX) via ratios spread (1×2) and butterfly (1x2x1) structures. 

The concern with these strategies is the width and time to expiry. Should either of those be wrong, then spreads initially positive gamma turn negative, meaning losses are amplified.

For instance, in the Nasdaq 100, to put in short, 500-1000 points wide ratio spreads (buy the closer leg, sell two of the farther legs) expiring in ten to fifteen days work well. 

For those spreads that are not zero cost, debits can be offset with credit sales (on the put side) in products that have shown relative strength like the S&P 500 (INDEX: SPX). This, inherently, carries more risk. Read more about these strategies, here.

Please note that the above is NOT a trade recommendation or advice.
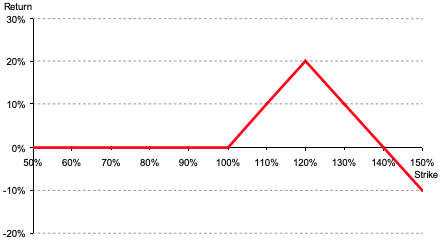
Graphic: Via Banco Santander SA (NYSE: SAN) research, the return profile, at expiry, of a classic 1×2 (long 1, short 2 further away) ratio spread.

Definitions

Overnight Rally Highs (Lows): Typically, there is a low historical probability associated with overnight rally-highs (lows) ending the upside (downside) discovery process.

Volume Areas: A structurally sound market will build on areas of high volume (HVNodes). Should the market trend for long periods of time, it will lack sound structure, identified as low volume areas (LVNodes). LVNodes denote directional conviction and ought to offer support on any test. 

If participants were to auction and find acceptance into areas of prior low volume (LVNodes), then future discovery ought to be volatile and quick as participants look to HVNodes for favorable entry or exit.

POCs: POCs are valuable as they denote areas where two-sided trade was most prevalent in a prior day session. Participants will respond to future tests of value as they offer favorable entry and exit.

Volume-Weighted Average Prices (VWAPs): A metric highly regarded by chief investment officers, among other participants, for quality of trade. Additionally, liquidity algorithms are benchmarked and programmed to buy and sell around VWAPs.

About

After years of self-education, strategy development, mentorship, and trial-and-error, Renato Leonard Capelj began trading full-time and founded Physik Invest to detail his methods, research, and performance in the markets.

Capelj also develops insights around impactful options market dynamics at SpotGamma and is a Benzinga reporter.

Some of his works include conversations with ARK Invest’s Catherine Wood, investors Kevin O’Leary and John Chambers, FTX’s Sam Bankman-Fried, Kai Volatility’s Cem Karsan, The Ambrus Group’s Kris Sidial, among many others.

Disclaimer

In no way should the materials herein be construed as advice. Derivatives carry a substantial risk of loss. All content is for informational purposes only.

Categories
Commentary

Daily Brief For May 2, 2022

The Daily Brief is a free glimpse into the prevailing fundamental and technical drivers of U.S. equity market products. Join the 200+ that read this report daily, below!

What Happened

Overnight, equity index futures auctioned off of Friday’s regular trade lows. Yields, the dollar, and implied volatility metrics were bid.

There were no changes in the newsflow’s tone this weekend; investors remain concerned over the implications of monetary policy shifts and inflation, as well as war, COVID, and the supply pressures associated.

Ahead is data on S&P Global Inc’s (NYSE: SPGI) U.S. manufacturing PMI (9:45 AM ET), as well as the ISM manufacturing index and construction spending (10:00 AM ET).

Graphic updated 6:30 AM ET. Sentiment Neutral if expected /ES open is inside of the prior day’s range. /ES levels are derived from the profile graphic at the bottom of the following section. Levels may have changed since initially quoted; click here for the latest levels. SqueezeMetrics Dark Pool Index (DIX) and Gamma (GEX) calculations are based on where the prior day’s reading falls with respect to the MAX and MIN of all occurrences available. A higher DIX is bullish. At the same time, the lower the GEX, the more (expected) volatility. Learn the implications of volatility, direction, and moneyness. SHIFT data used for S&P 500 (INDEX: SPX) options activity. Note that options flow is sorted by the call premium spent; if more positive, then more was spent on call options. Breadth reflects a reading of the prior day’s NYSE Advance/Decline indicator. VIX reflects a current reading of the CBOE Volatility Index (INDEX: VIX) from 0-100.

What To Expect

Fundamental: The indexes continue to hold well in the context of severe weaknesses under the hood, so to speak, especially in the high-flying technology and growth of 2020-2021.

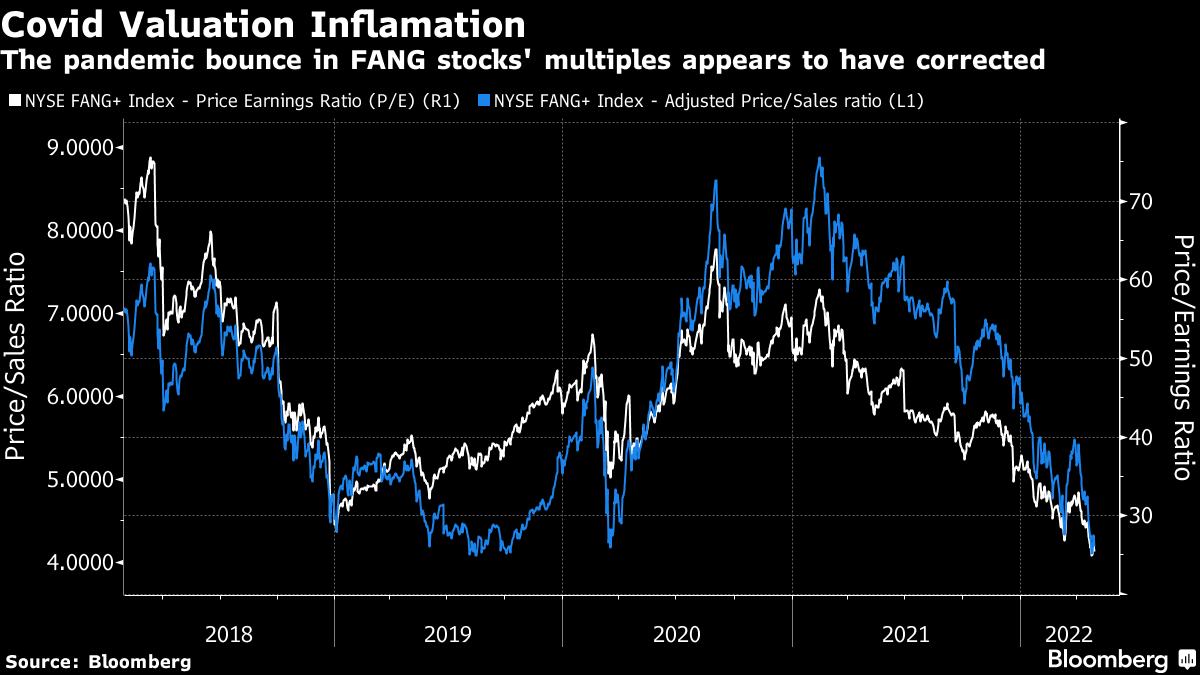
Stocks like Zoom Video Communications (NASDAQ: ZM) and Netflix Inc (NASDAQ: NFLX), the beneficiaries of the work-from-home trends, have de-rated substantially since the start of 2022.

Graphic: Via Bloomberg.

In spite of earnings growth (~10% for S&P 500 companies that have reported, per Bloomberg), “the reaction to earnings surprises in April was asymmetric,” and a display of “the outsized role played by outliers.” 

For context, “Mega-cap growth (MCG) & Tech earnings are missing by -6.0% at the aggregate level [while] the median company [is] beating by 5.7%.”

This is as inflation, among other factors, continues to bite into the “over-optimistic multiples driven by the assumption that pandemic-era performance could continue in perpetuity.”

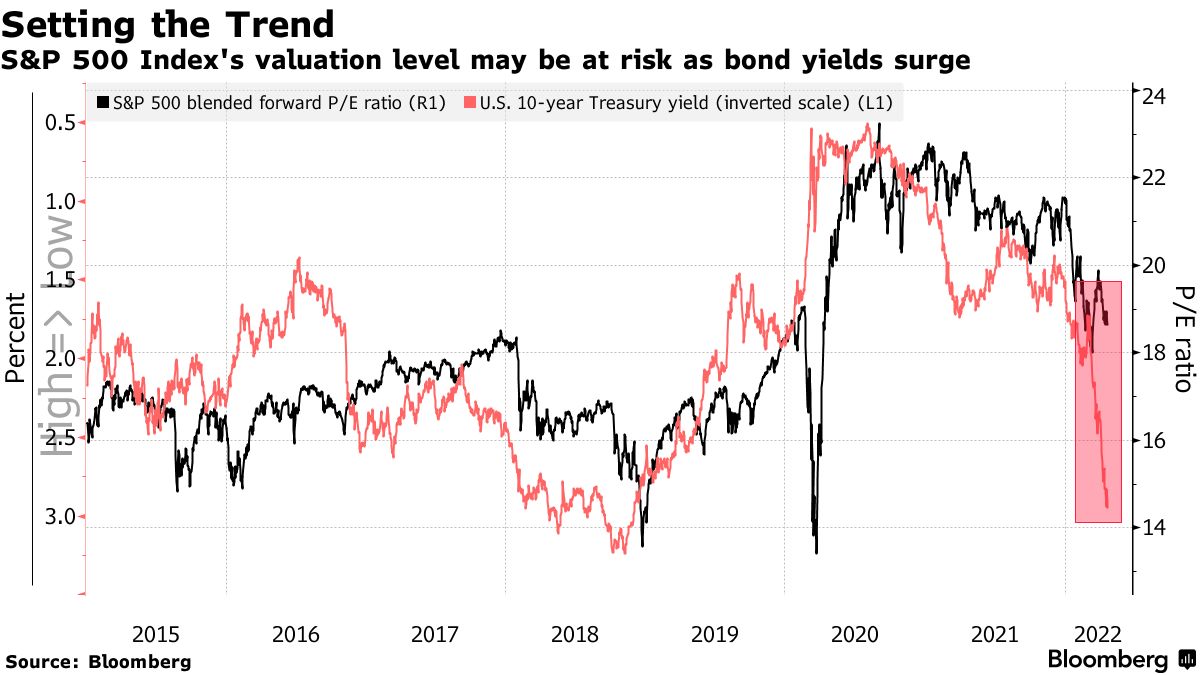
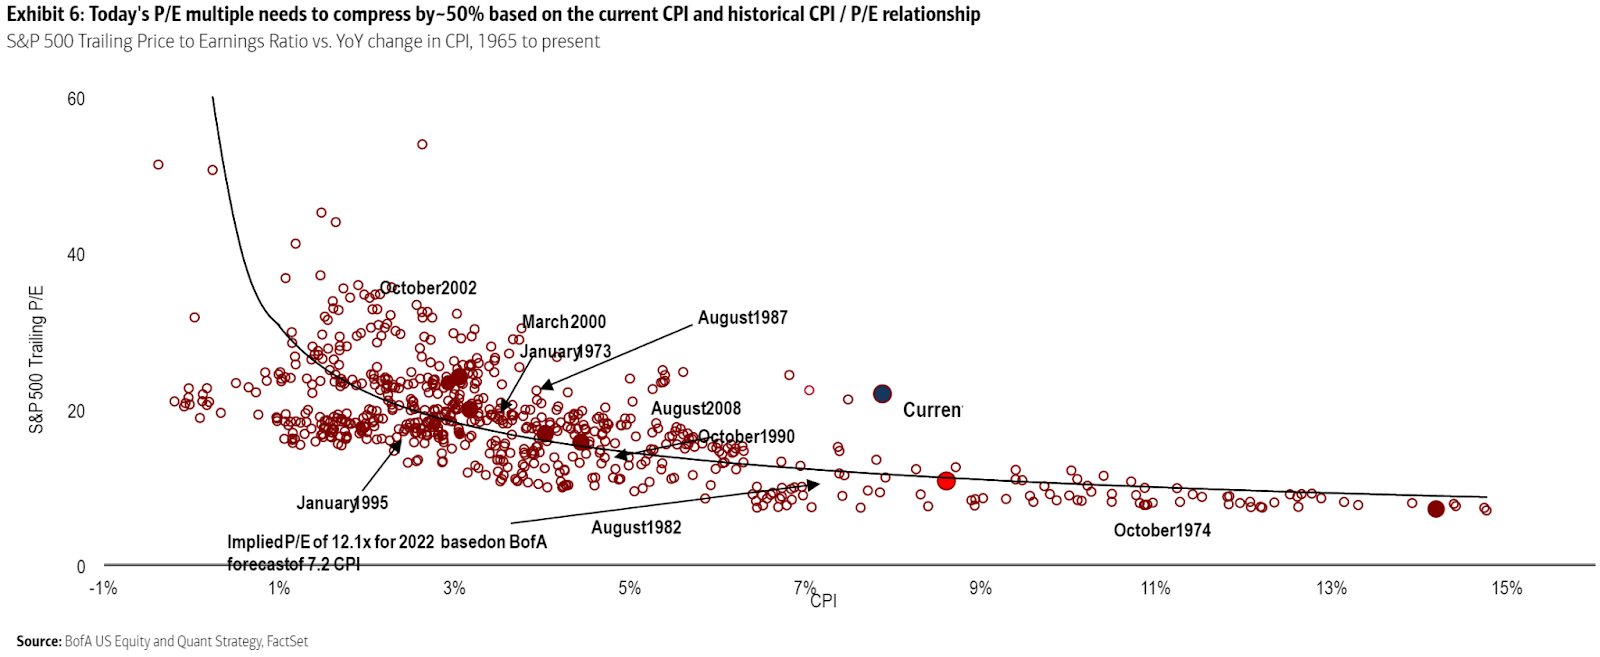
Per Bank of America Corporation (NYSE: BAC), the S&P’s current P/E is way too high, given the current CPI.

Graphic: Via Bank of America Corporation. Taken from Bloomberg. “It’s straightforward common sense that higher inflation would lead to paying a lower multiple of earnings because you expect future earnings to be eaten into by inflation. And common sense is borne out empirically; all else equal, higher inflation does indeed tend to mean lower earnings multiples.”

Notwithstanding, trimming outliers, inflation may have peaked and that is a positive for those equity investors who think “inflation is high, but they’re confident that it’s transitory,” therefore current valuations are just.

Graphic: Via Bloomberg.

Per @ConvexityMaven, recession chatter is unwarranted. The economy is expanding and the only worry investors should have is “if the Fed cannot chill nominal GDP.”

That means “rates are going north” and, according to Bank of America Corporation’s Michael Hartnett, “asset prices must reset lower.”

Some investors, like the Japanese, have heeded this message and are offloading billions in Treasuries in anticipation of more attractive levels and “stabilization in long-dated yields.”

Perspectives: Some, including Credit Suisse Group AG’s (NYSE: CS) Zoltan Pozsar, believe market participants are in for a world of [much more] hurt as “central banks can only deal with nominal, not real chokepoints.”

“Banks’ stock buybacks are lowering SLRs as we speak, and the Fed is about to embark on QT, and these nominal balance sheet and liquidity trends, will at some point clash with the realities of a garden variety of supply chain issues,” as a result of geopolitical chokepoints.

Graphic: Per Bloomberg, “[E]very $1 trillion of QT will equate to a decline of roughly 10% in stocks over the next 12 months or so.”

Given Pozsar’s findings, “The Fed will do QE again by summer 2023.”

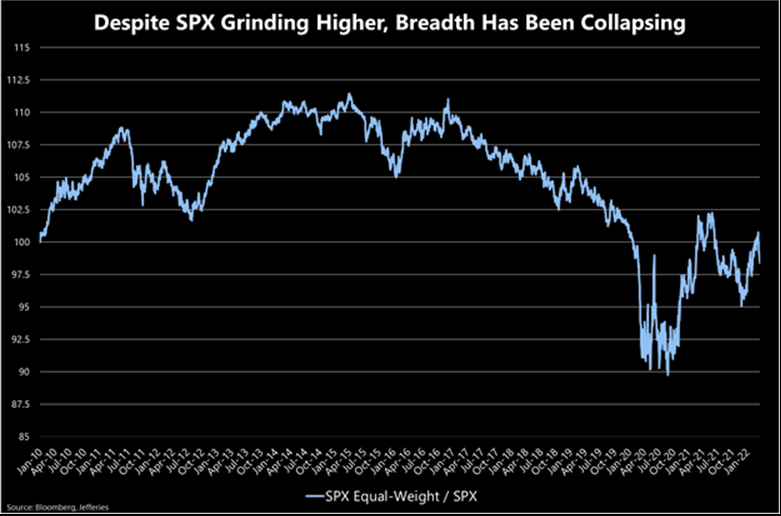
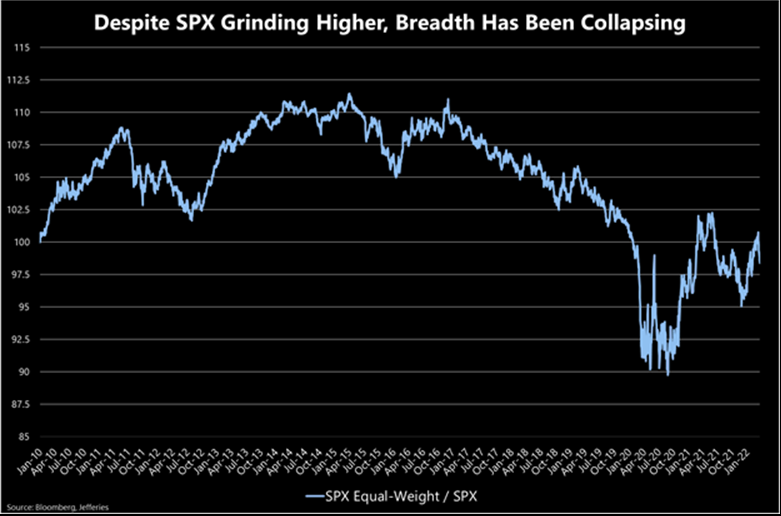
Positioning: Recall that the indexes are trading relatively strong, in comparison to constituents, especially those that are smaller technology and growth companies.

Essentially, “we’re two-thirds of the way through a dot-com type collapse,” explains Simplify Asset Management’s Mike Green.

“It’s just happened underneath the surface of the indices which is [that] … dynamic of passive flows supporting the largest stocks within the index, whereas the smaller stocks can be influenced to a greater extent by the behavior of discretionary managers.”

This liquidity supply, apart from passive flows, stems from index-level hedging pressures, also.

Here’s why, as borrowed from our April 27, 2022 commentary.

Participants are well-hedged and use weakness as an opportunity to buy into a less highly valued broader market.

Well-hedged means that customers (i.e., you and I) own protection against long equity exposure. So, that could mean customers own puts and/or are short calls. One of the most dominant flows is the long put, short call.

Such trade offers customers positive, yet asymmetric (gamma), exposure to direction (delta). In other words, negative delta and positive gamma. 

The counterparty has exposure to positive delta and negative gamma. If the underlyings trade lower and volatility rises, all else equal, the position will lose. To hedge against these losses, the counterparties will sell underlying into weakness.

If prices reverse and move higher, these counterparties will re-hedge and buy underlying.

Normally, as seen over the bull run of 2020 and 2021, markets are in an uptrend and there’s a strong supply of volatility. Often, customers sell more calls than puts and, in an uptrend, those calls solicit more active hedging than the put options.

Recall that the customer is short the call. That means the counterparty is long the call (a positive delta and gamma trade) and will make money if prices rise, all else equal. 

The hedging of this particular exposure (i.e., sell strength, buy weakness), in an uptrend, occurs slower (i.e., counterparts will allow their profits to run), and that’s what can help the market sustain lower volatility trends for longer periods.

When prices reverse and underlyings trade lower, put options solicit increased hedging activity. Given the nature of counterparty exposure to those puts, that hedging happens quickly and can take from market liquidity as to volatility (i.e., buy strength, sell weakness).

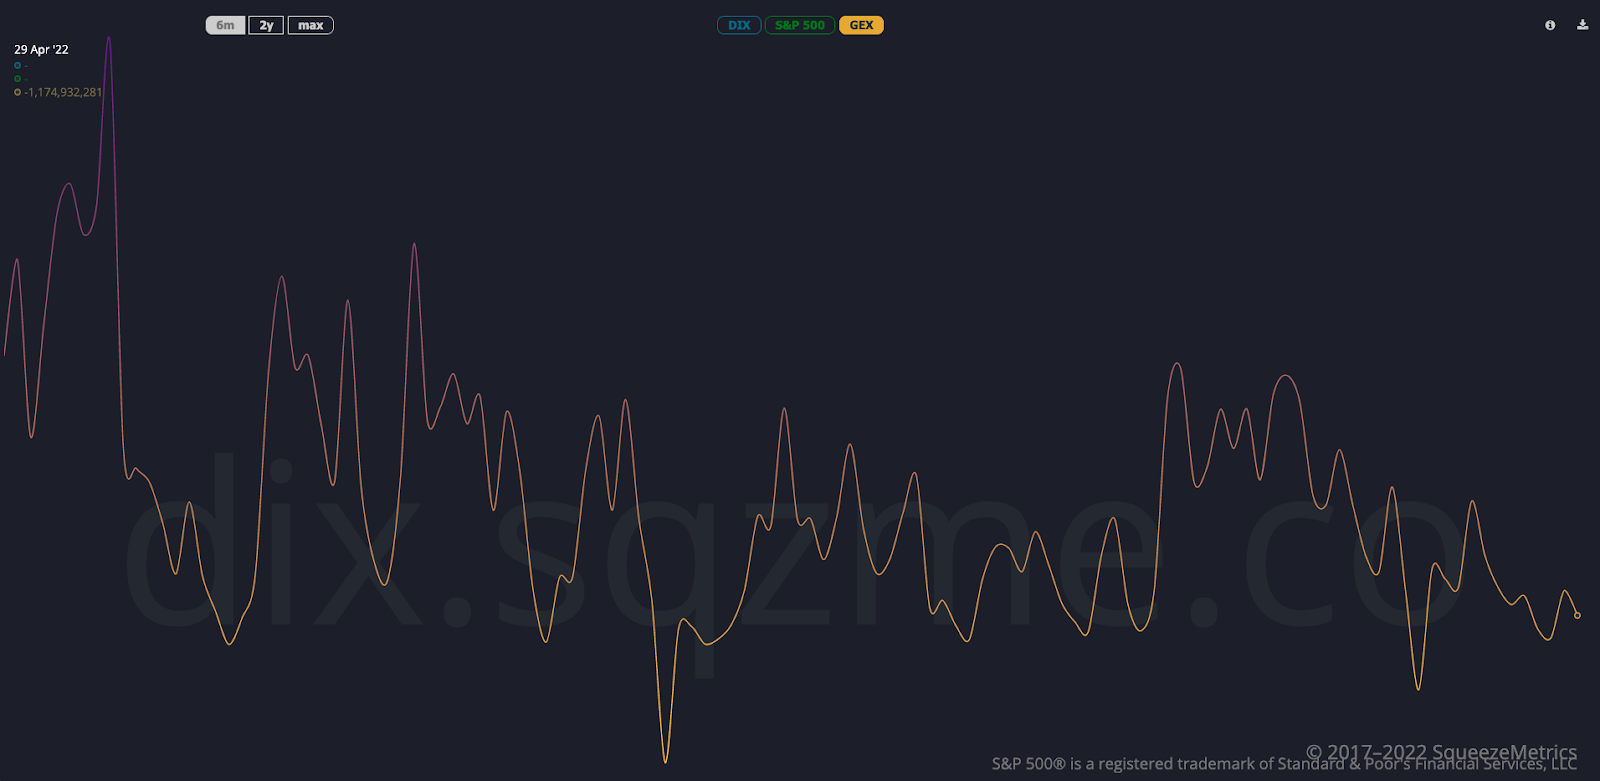
Graphic: Via SqueezeMetrics. Equity move lower solicits increased hedging activity of put options. Counterparties have negative gamma exposure to these puts. Therefore, to hedge, they buy strength and sell weakness, adding to realized volatility. This trend is ongoing.

So, what now?

Participants are most concerned (and hedging against) unforeseen monetary policy action and economic chokepoints like a potential Russian default. 

Investors will get clarity on some of these issues in the coming sessions.

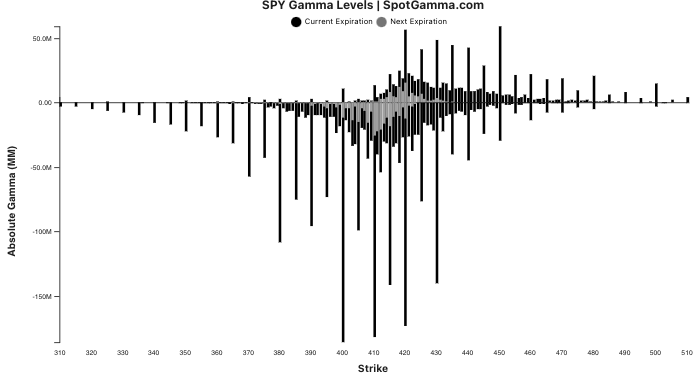
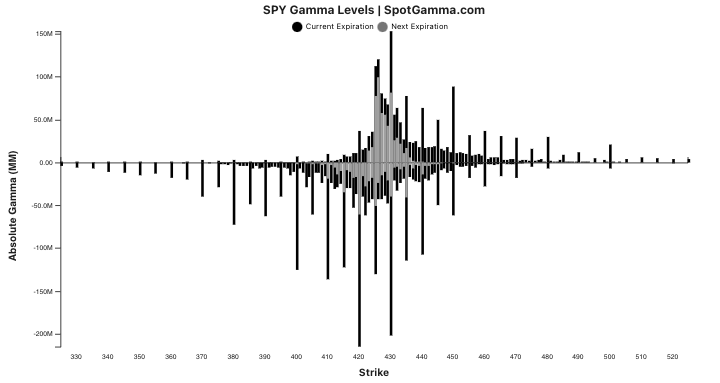
Graphic: Via SpotGamma, the estimated gamma for calls by strike as a positive number and puts as a negative number on the S&P 500 ETF, the SPY. Notice the weight on the put side.

Barring a worst-case scenario, if markets do not perform to the downside (i.e., do not trade lower), those highly-priced (often very short-dated) bets on direction will quickly decay, and hedging flows with respect to time and volatility may bolster sharp rallies.

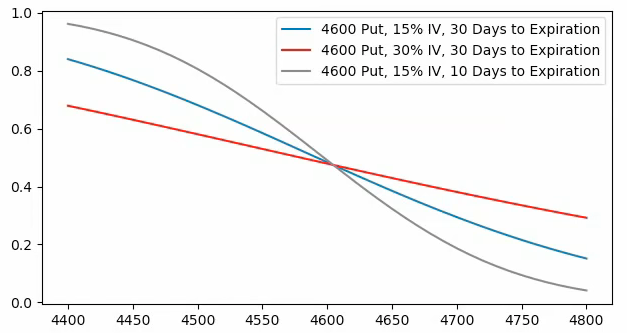
Graphic: Via SpotGamma. “SPX prices X-axis. Option delta Y-axis. When the factors of implied volatility and time change, hedging ratios change. For instance, if SPX is at $4,700.00 and IV jumps 15% (all else equal), the dealer may sell an additional 0.2 deltas to hedge their exposure to the addition of a positive 0.2 delta. The graphic is for illustrational purposes, only.”

Whether those price rises kick off a sustained reversal depends on what the fundamental situation is, then.

Presently, the largest index constituents are starting to succumb to worsening fundamentals and that will, ultimately, feed into the indexes which are pinned due to passive and hedging flows.

In other words, fundamentals will trump this talk of positioning (i.e., it is only in the short-term does this positioning we’ve talked about have greater implications).

Consideration: The returns distribution, based on implied volatility metrics alone, is skewed positive (though there are some large negative outliers pursuant to The Ambrus Group’s Kris Sidial recent explanation that despite negative sentiment, “nobody is truly scared” and “Fixed strike vols continue to underperform, along with the lack of concern in the VX term structure”).

Caution.

Graphic: Via SpotGamma, “Put vs Call gamma suggests stretched positioning.”

Technical: As of 6:30 AM ET, Monday’s regular session (9:30 AM – 4:00 PM ET), in the S&P 500, will likely open in the middle part of a balanced overnight inventory, inside of prior-range and -value, suggesting a limited potential for immediate directional opportunity.

In the best case, the S&P 500 trades higher; activity above the $4,118.75 regular trade low (RTH Low) puts in play the $4,158.25 overnight high (ONH). Initiative trade beyond the ONH could reach as high as the $4,247.00 untested point of control (VPOC) and $4,279.75 ONH, or higher.

In the worst case, the S&P 500 trades lower; activity below the $4,118.75 RTH Low puts in play the $4,101.25 overnight low (ONL). Initiative trade beyond the ONL could reach as low as the $4,055.75 low volume area (LVNode) and $3,978.50 low volume area (LVNode), or lower.

Click here to load today’s key levels into the web-based TradingView charting platform. Note that all levels are derived using the 65-minute timeframe. New links are produced, daily.
Graphic: 65-minute profile chart of the Micro E-mini S&P 500 Futures.

Considerations: Terribly weak price action, last week, with the S&P 500, Nasdaq 100, and Russell 2000 all flirting with early 2022 lows.

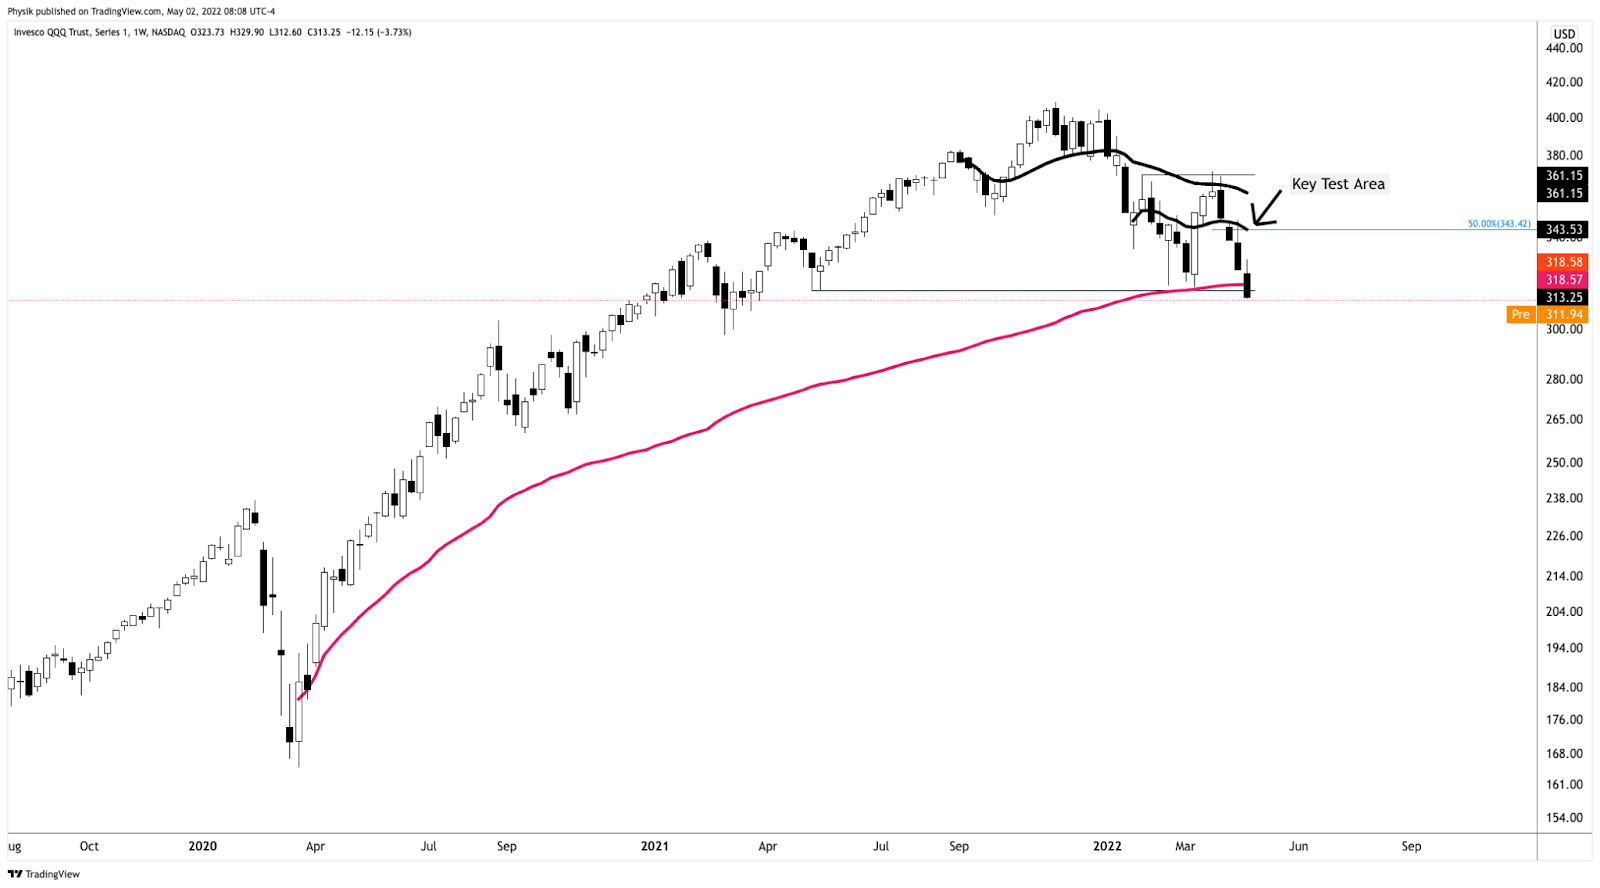
The weaker of the bunch – the Invesco QQQ Trust Series 1 (NASDAQ: QQQ) – just broke a major VWAP anchored from the lows of March 2020. 

That indicator denotes the level at which the average buyer/seller is in.

In other words, it is the fairest price to pay for Nasdaq 100 exposure (since March 2020) and, instead of being construed as a so-called demand zone, the level ought to be looked at as overhead supply on tests, higher. Caution.

Graphic: Invesco QQQ Trust Series 1 (NASDAQ: QQQ) with anchored VWAPs.

Definitions

Overnight Rally Highs (Lows): Typically, there is a low historical probability associated with overnight rally-highs (lows) ending the upside (downside) discovery process.

Volume Areas: A structurally sound market will build on areas of high volume (HVNodes). Should the market trend for long periods of time, it will lack sound structure, identified as low volume areas (LVNodes). LVNodes denote directional conviction and ought to offer support on any test. 

If participants were to auction and find acceptance into areas of prior low volume (LVNodes), then future discovery ought to be volatile and quick as participants look to HVNodes for favorable entry or exit.

POCs: POCs are valuable as they denote areas where two-sided trade was most prevalent in a prior day session. Participants will respond to future tests of value as they offer favorable entry and exit.

Volume-Weighted Average Prices (VWAPs): A metric highly regarded by chief investment officers, among other participants, for quality of trade. Additionally, liquidity algorithms are benchmarked and programmed to buy and sell around VWAPs.

About

After years of self-education, strategy development, mentorship, and trial-and-error, Renato Leonard Capelj began trading full-time and founded Physik Invest to detail his methods, research, and performance in the markets.

Capelj also develops insights around impactful options market dynamics at SpotGamma and is a Benzinga reporter.

Some of his works include conversations with ARK Invest’s Catherine Wood, investors Kevin O’Leary and John Chambers, FTX’s Sam Bankman-Fried, Kai Volatility’s Cem Karsan, The Ambrus Group’s Kris Sidial, among many others.

Disclaimer

In no way should the materials herein be construed as advice. Derivatives carry a substantial risk of loss. All content is for informational purposes only.

Categories
Commentary

Daily Brief For April 29, 2022

The Daily Brief is a free glimpse into the prevailing fundamental and technical drivers of U.S. equity market products. Join the 200+ that read this report daily, below!

What Happened

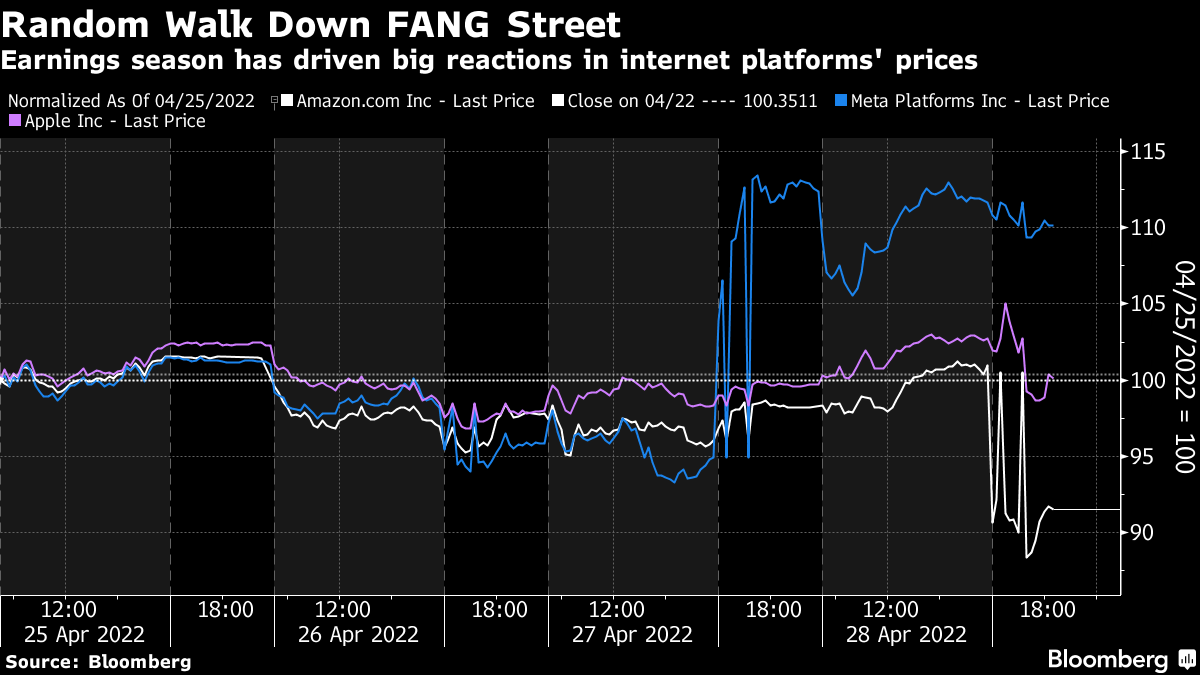
Overnight, equity index futures auctioned sideways-to-lower after a mid-day price bump Thursday, on the heels of dismal earnings, among other things including a contraction in economic growth, last quarter.

Amazon Inc (NASDAQ: AMZN) shares fell after the company projected sluggish sales as well as higher costs.

Apple Inc (NASDAQ: AAPL) saw strong sales and profit help top estimates. The company announced a $90 billion share buyback and fears over supply constraints.

Tesla Inc’s (NASDAQ: TSLA) Elon Musk offloaded $4 billion worth of shares just after his deal to buy Twitter Inc (NYSE: TWTR) was reached days before.

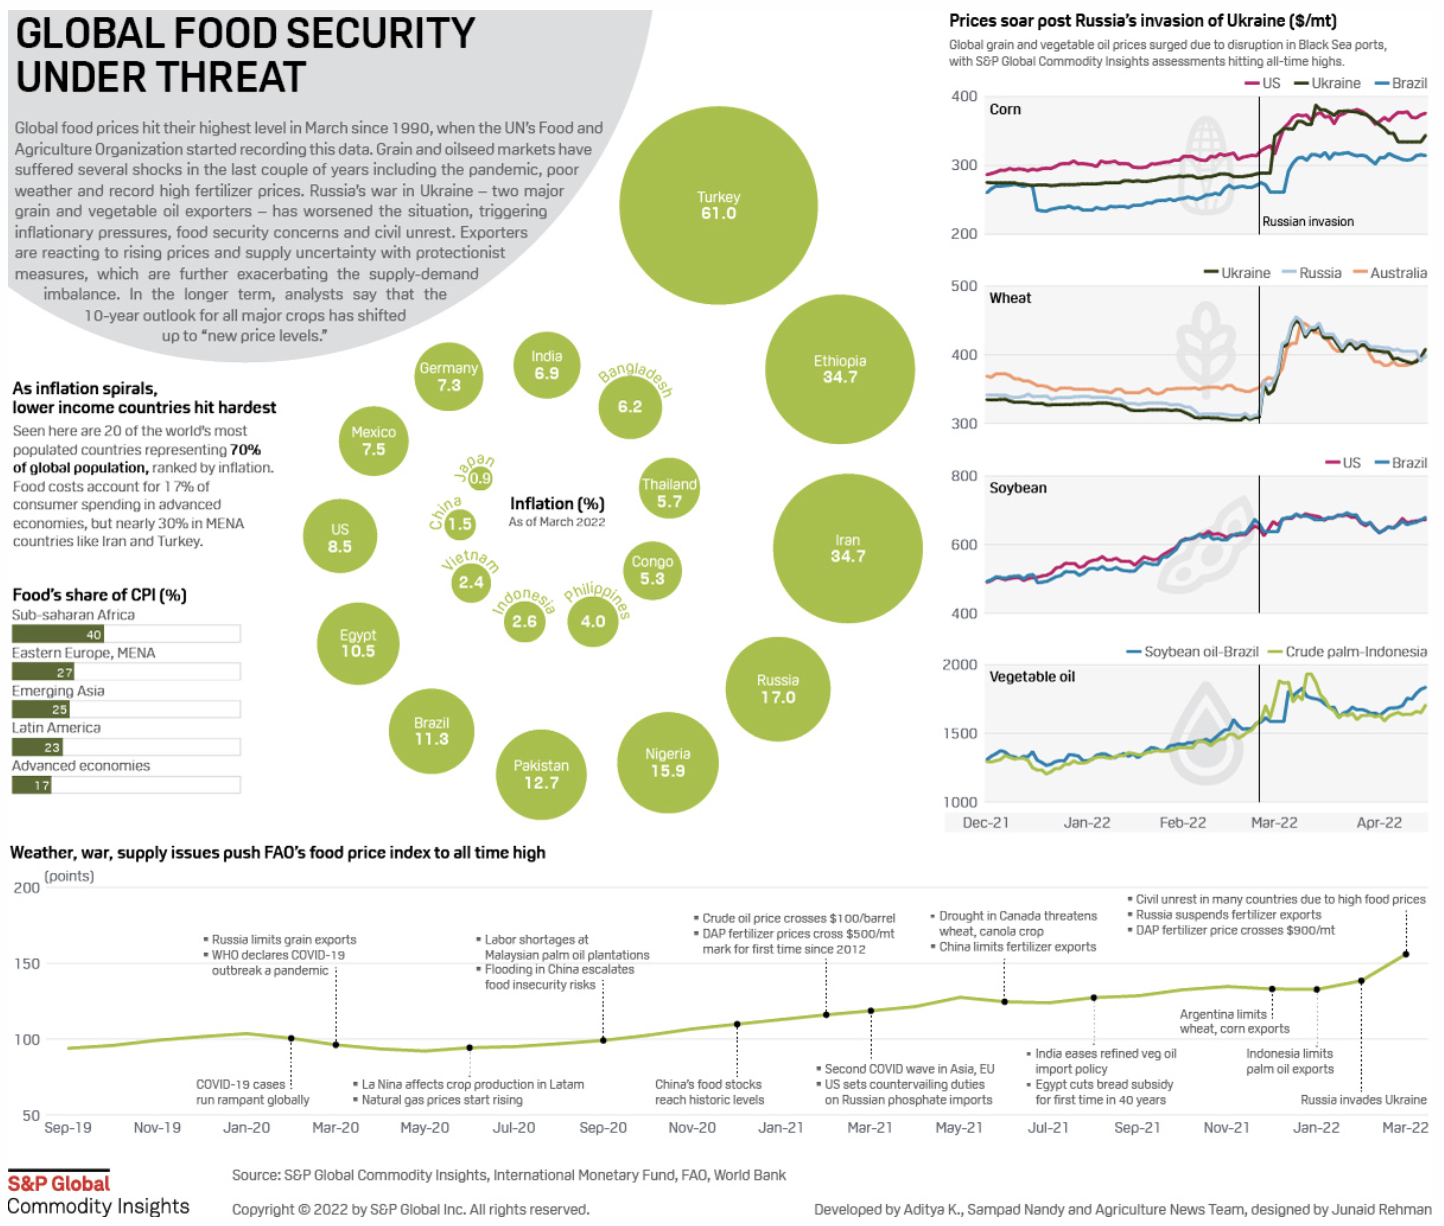
Also in the news: Russia’s urgency to avoid a default. Food Inflation hits an all-time high. China’s currency plunge raises the risk of 2015-style panic. No-money-down crypto mortgages and why housing may be topping. Barclays PLC (NYSE: BCS) halts ETN sales.

Ahead is data on the employment cost index, PCE, personal income and consumer spending (8:30 AM ET), as well as Chicago PMI (9:45 AM ET), and University of Michigan consumer sentiment and inflation expectations (10:00 AM ET).

Graphic updated 6:30 AM ET. Sentiment Neutral if expected /ES open is inside of the prior day’s range. /ES levels are derived from the profile graphic at the bottom of the following section. Levels may have changed since initially quoted; click here for the latest levels. SqueezeMetrics Dark Pool Index (DIX) and Gamma (GEX) calculations are based on where the prior day’s reading falls with respect to the MAX and MIN of all occurrences available. A higher DIX is bullish. At the same time, the lower the GEX, the more (expected) volatility. Learn the implications of volatility, direction, and moneyness. SHIFT data used for S&P 500 (INDEX: SPX) options activity. Note that options flow is sorted by the call premium spent; if more positive, then more was spent on call options. Breadth reflects a reading of the prior day’s NYSE Advance/Decline indicator. VIX reflects a current reading of the CBOE Volatility Index (INDEX: VIX) from 0-100.

What To Expect

Fundamental: In hindsight, a very volatile week characterized by large, two-sided action and little constructive movement (i.e., a week that ended sideways rather than up or down).

Graphic: Via Bloomberg. Indexes sideways, mainly, as large constituents report their earnings.

This is ahead of what many think is likely to be front-loaded 50 basis point tightening next week and in June with rates, ultimately, trading in the range of 2.25-2.50% end-of-year.

Graphic: Via CME Group Inc’s (NASDAQ: CME) FedWatch Tool.

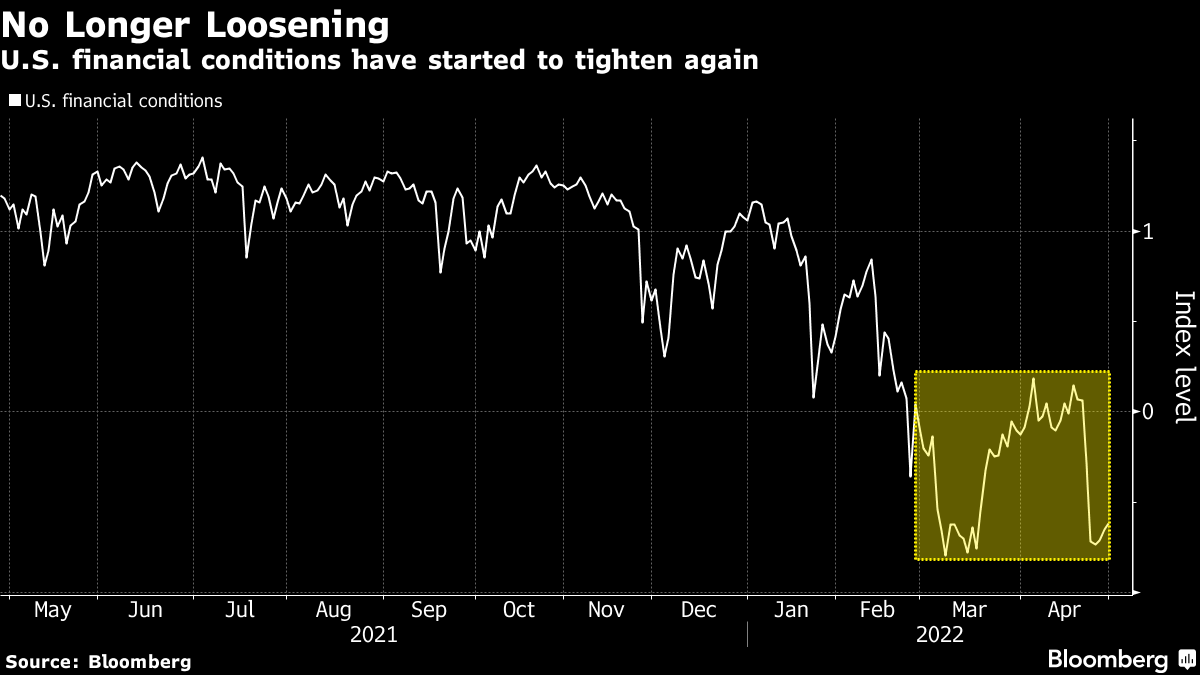
In light of tightening expectations, Columbia Threadneedle’s Gene Tannuzzo says “Tighter financial conditions are the mechanism that reduces demand and ultimately slows inflation.”

Graphic: Via Bloomberg. Financial conditions have started to tighten.

“If financial conditions don’t tighten [i.e., stocks regain their swagger] and inflation remains high, in their eyes, they need to hike more.”

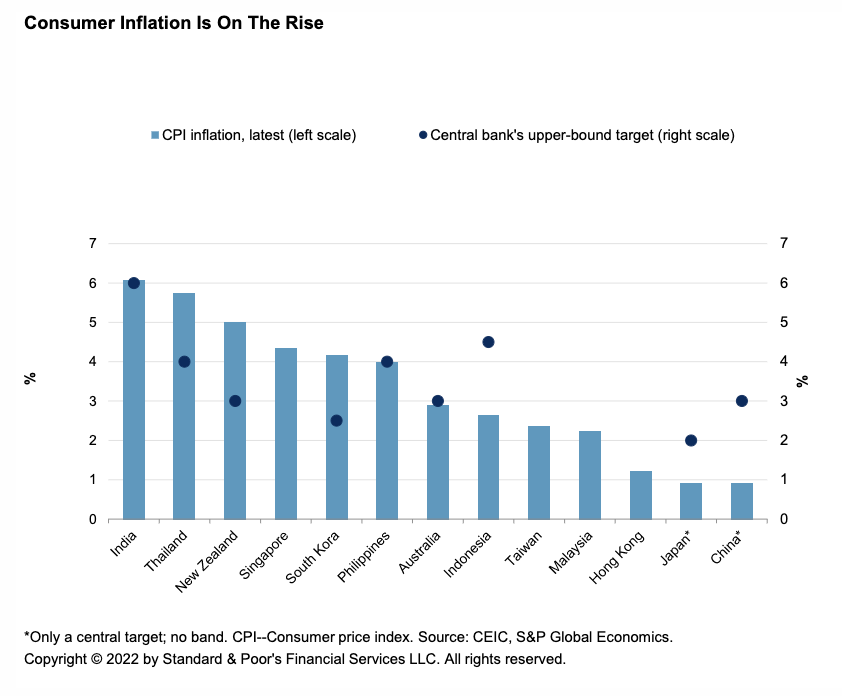
Graphic: Via S&P Global Inc (NYSE: SPGI). Food Inflation Hits All-Time High, Fuels Security Risks.

In regards to balance sheet reduction, “QT will consist of run-off caps of USD 60bn for US Treasuries (UST) and USD 35bn for mortgage-backed securities (MBS), which will make up for a cap of USD 95bn per month going forward,” Nordea Bank (OTC: NRDBY) research says.

“The balance sheet reduction will revolve around coupon securities, with the Fed’s c. USD 326bn Treasury bills only allowed roll-off in months when maturing caps do not reach the cap. We expect the Fed to use a 3-month roll-on period in its reduction, which will make up for a relatively smooth and predictable treasury run-off.”

Positioning: Our April 27 discussion on positioning went into great detail on the likelihood of continued volatility and lower prices. 

On April 28 we noted the implications of heightened implied volatility and no follow-through to the downside. 

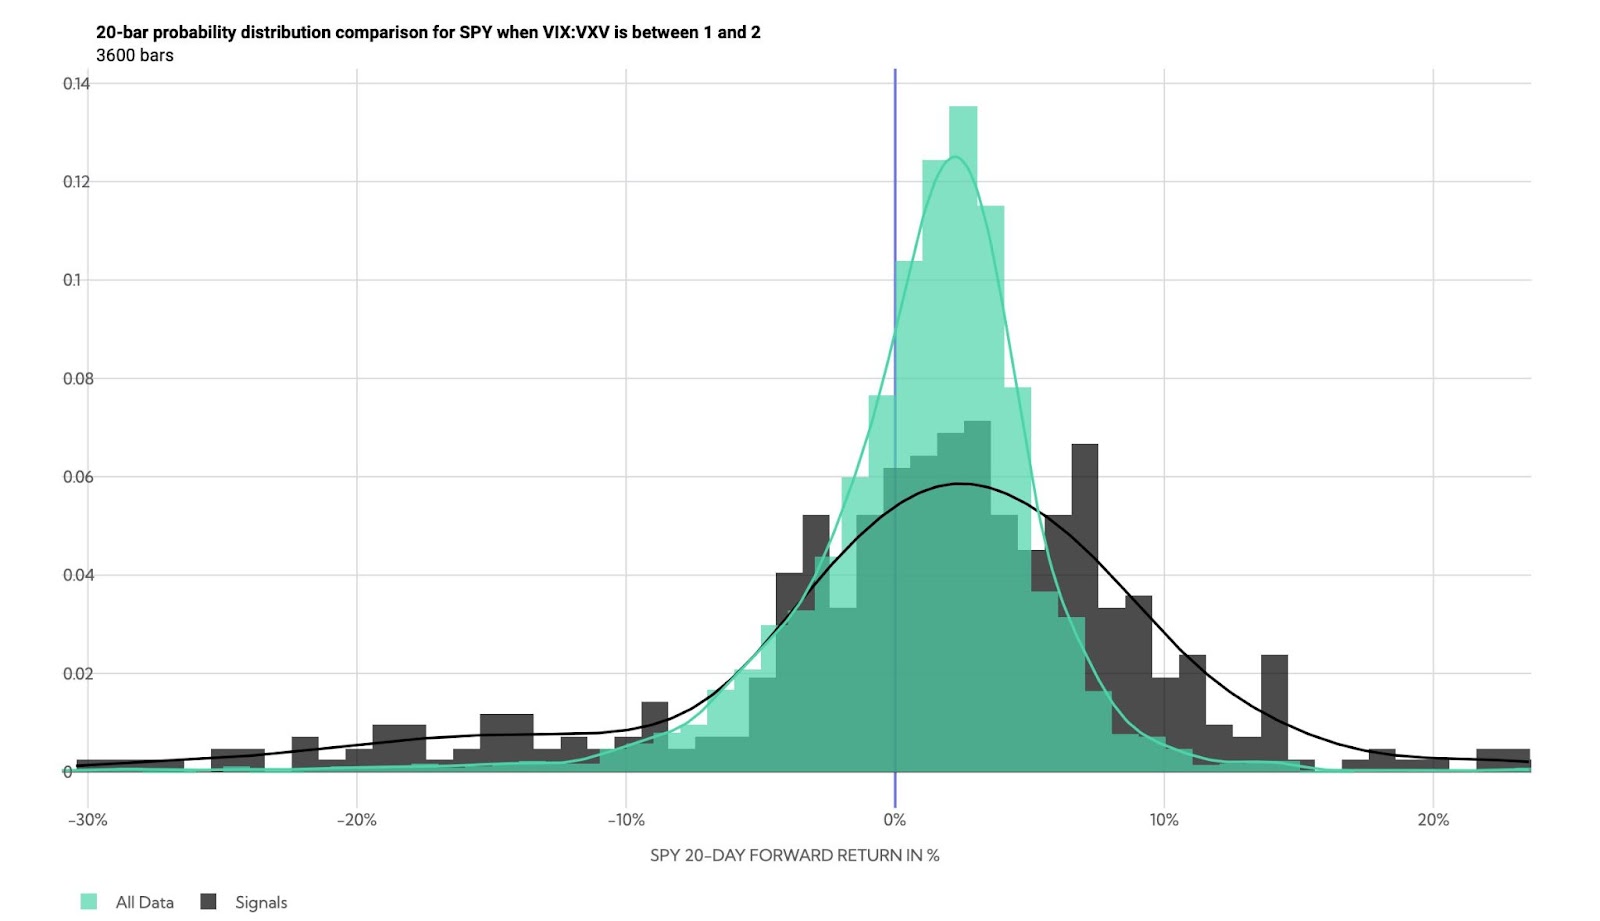
The returns distribution, based on implied volatility metrics alone, was skewed positive, albeit with a potential for large negative outliers.

Graphic: Via @HalfersPower. “In backwardation via $VIX: $VIX3M next month [realized volatility] is highest amongst the deciles (d10 >1) ~43% subsequent realized volatility.”

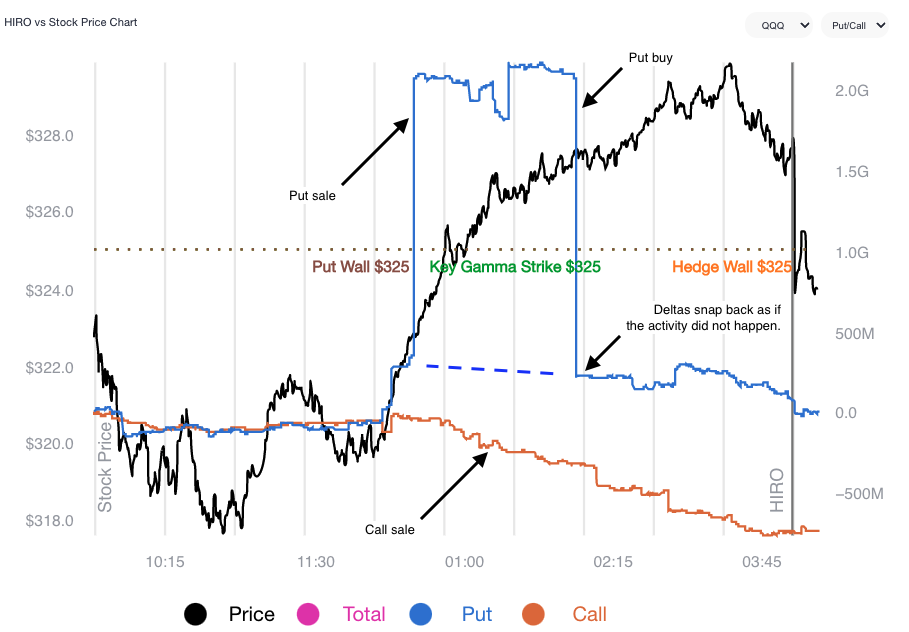
During Thursday’s trade, markets endured a near-vertical price rise alongside repositioning and what SpotGamma says is a “put-heavy expiration [Friday] (20% of gamma roll-off expected).”

Graphic: SpotGamma’s Hedging Impact of Real-Time Options indicator for the QQQ.

The idea is as follows: customers are well-hedged (customers own puts and/or are short calls) and this offers them positive, yet asymmetric (gamma), exposure to direction (delta). In other words, negative delta and positive gamma

The counterparty has exposure to positive delta and negative gamma. If the underlyings trade lower and volatility rises, all else equal, the position will lose. To hedge against these losses, the counterparties will sell underlying into weakness.

If this exposure is to roll off or underlying prices reverse and move higher, these counterparties will re-hedge and buy underlying. That’s what SpotGamma is hinting at.

Graphic: Via SpotGamma, the estimated gamma for calls by strike as a positive number and puts as a negative number on the S&P 500 ETF, the SPY. Notice the weight on the put side.

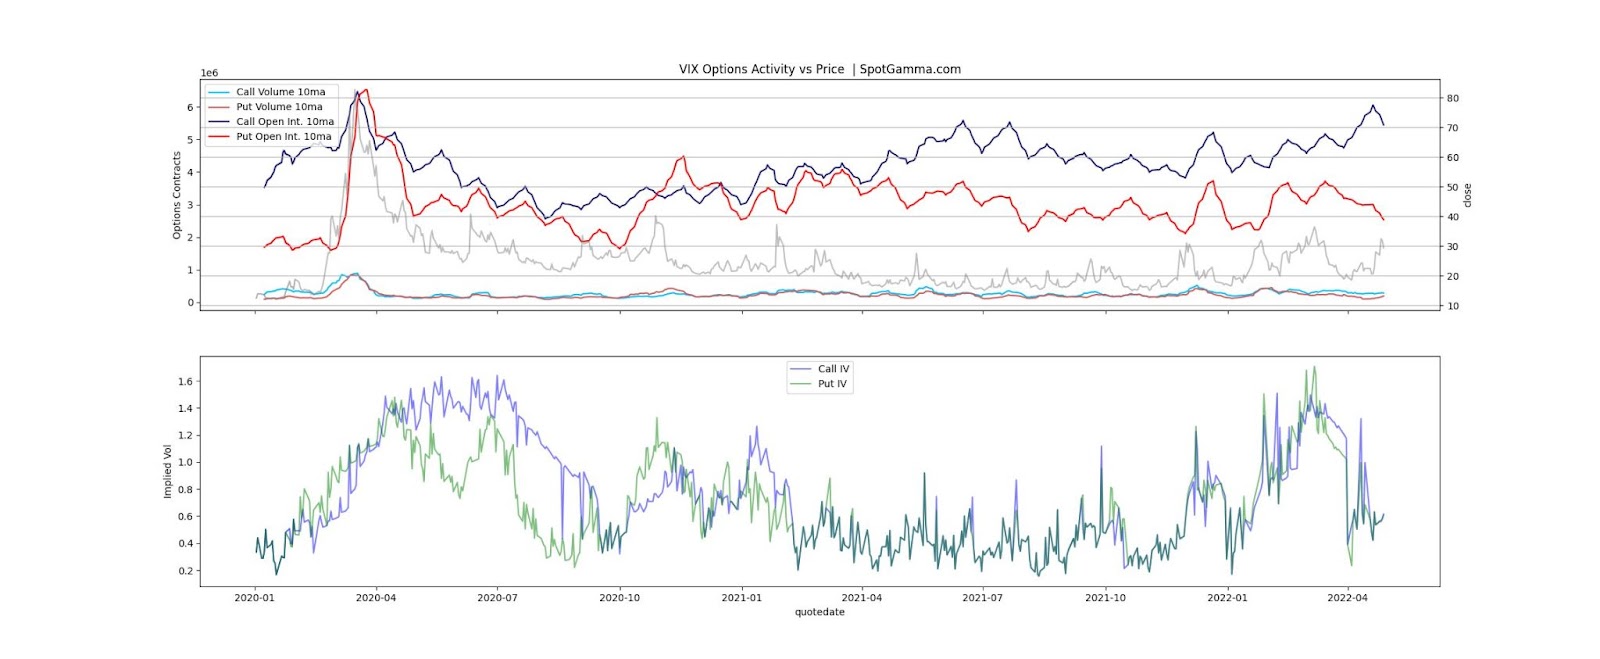
SpotGamma also notes: “VIX call open interest (blue) is near March ’20 highs. With VIX near 1-yr highs put interest (red) is near lows. Equity rally/vol decline seems like it would catch most everyone offsides.”

Graphic: Via SpotGamma.

Technical: As of 6:15 AM ET, Friday’s regular session (9:30 AM – 4:00 PM ET), in the S&P 500, will likely open in the middle part of a balanced overnight inventory, inside of prior-range and -value, suggesting a limited potential for immediate directional opportunity.

In the best case, the S&P 500 trades higher; activity above the $4,235.00 overnight low (ONL) puts in play the $4,279.75 overnight high (ONH). Initiative trade beyond the ONH could reach as high as the $4,303.50 regular trade high (RTH High) and $4,337.00 untested point of control (VPOC), or higher.

In the worst case, the S&P 500 trades lower; activity below the $4,235.00 ONL puts in play the $4,191.00 VPOC. Initiative trade beyond the VPOC could reach as low as the $4,182.50 ONL and $4,156.75 regular trade low (RTH Low), or lower.

Click here to load today’s key levels into the web-based TradingView charting platform. Note that all levels are derived using the 65-minute timeframe. New links are produced, daily.
Graphic: 65-minute profile chart of the Micro E-mini S&P 500 Futures.

Considerations: Into this week, markets were extremely weak alongside hawkish remarks from the Fed and dismal responses to earnings results, among other things.

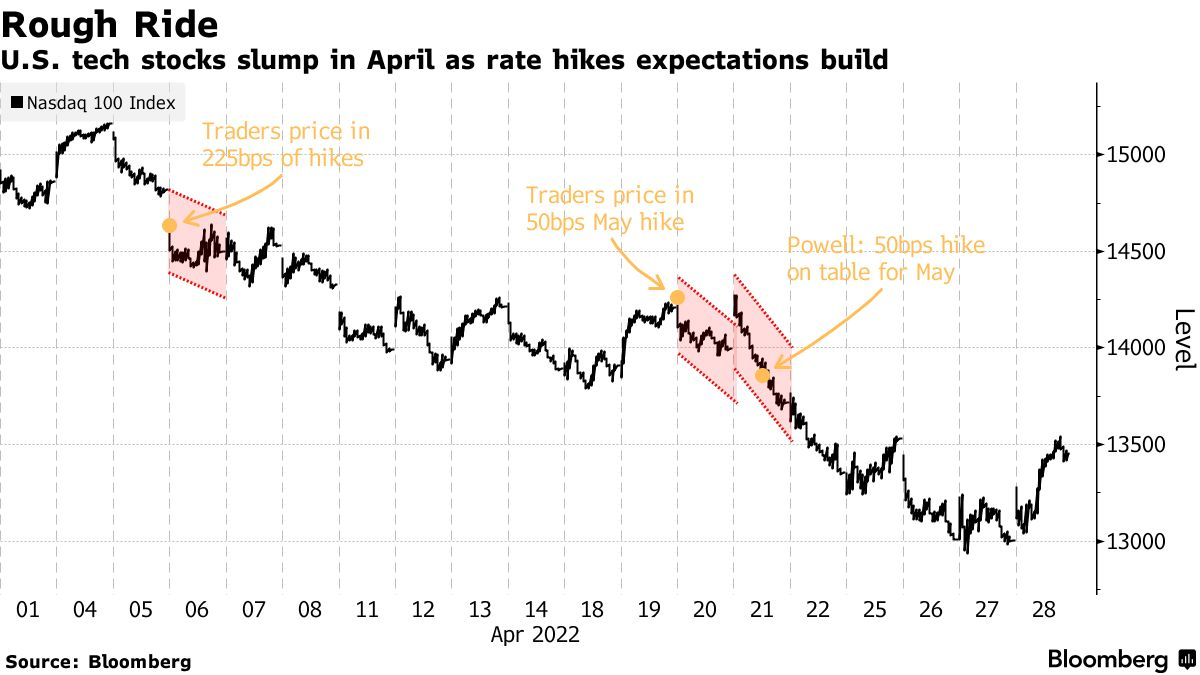
Graphic: Via Bloomberg.

Then, as a major index – the Invesco QQQ Trust Series 1 (NASDAQ: QQQ) – tested a major VWAP anchored from the lows of March 2020. After, a rounded bottom began to form while implied volatility metrics continued to trend higher.

Graphic: Invesco QQQ Trust Series 1 (NASDAQ: QQQ) with anchored VWAPs.

Thursday’s price rise and volatility compression, particularly at the short-end of the term structure coincided with some of the strongest breadth in days. 

Notwithstanding, the entire advance was taken back overnight and now the S&P 500 is trading back inside a multi-day consolidation. 

If a short-term trader, playing responsively (i.e., fading edges) is likely the best course of action until the indexes, at least, are able to break above this week’s ranges and remain there (i.e., not trade back down).

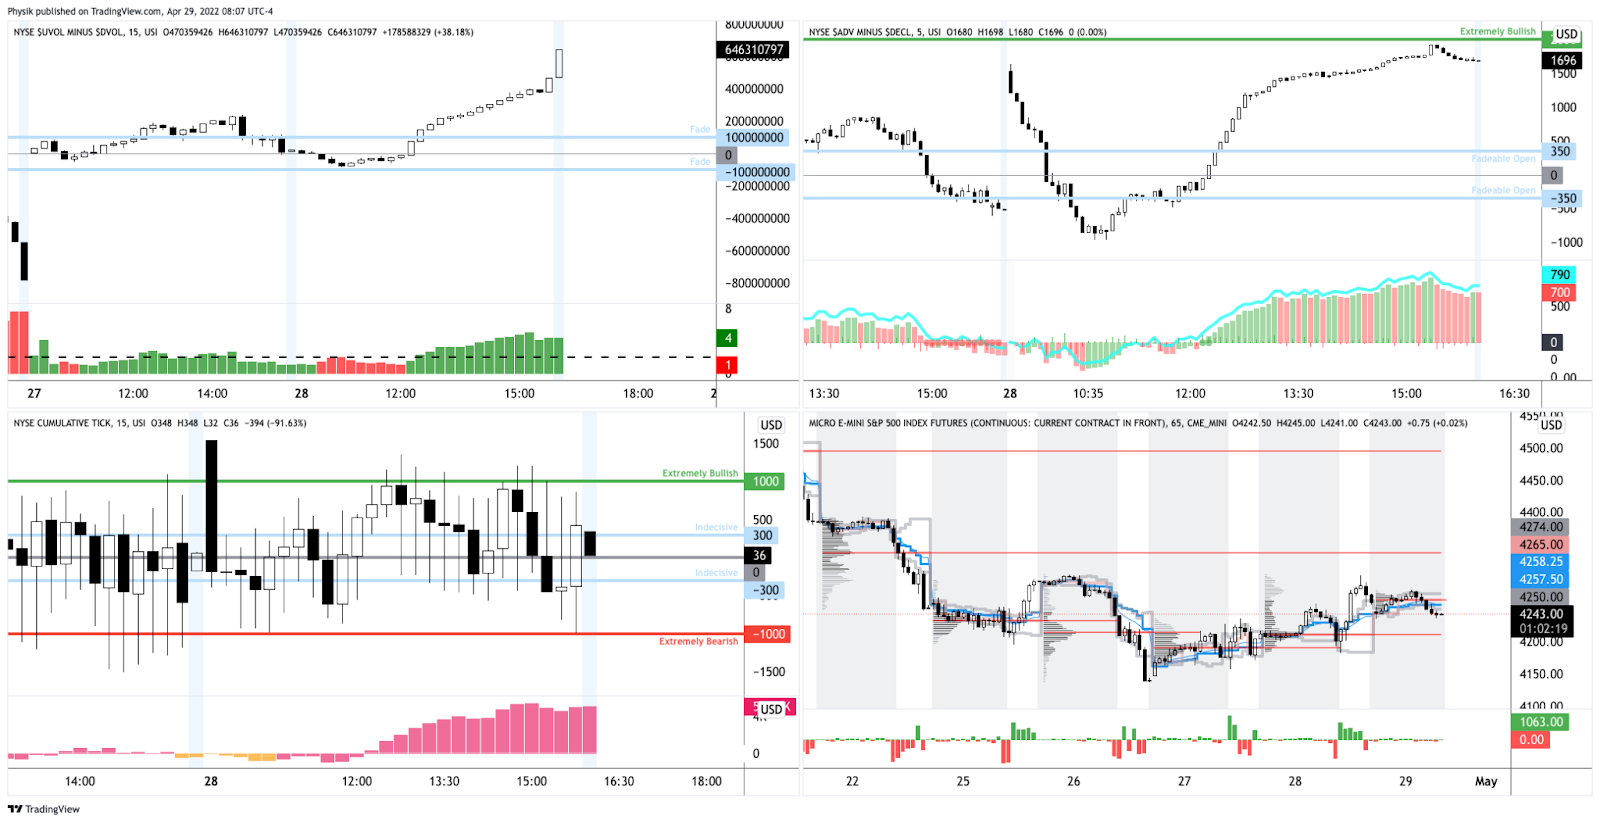
Graphic: Market Internals as pioneered by (a mentor of mine) Peter Reznicek. Notice the indicator in the top right, weighted S&P sectors (histogram) versus unweighted (blue line). During late last week, participants sold the entire market, heavily (as supported by the difference between the volume flowing into stocks that are up versus those that are down).

Definitions

Overnight Rally Highs (Lows): Typically, there is a low historical probability associated with overnight rally-highs (lows) ending the upside (downside) discovery process.

Volume Areas: A structurally sound market will build on areas of high volume (HVNodes). Should the market trend for long periods of time, it will lack sound structure, identified as low volume areas (LVNodes). LVNodes denote directional conviction and ought to offer support on any test. 

If participants were to auction and find acceptance into areas of prior low volume (LVNodes), then future discovery ought to be volatile and quick as participants look to HVNodes for favorable entry or exit.

POCs: POCs are valuable as they denote areas where two-sided trade was most prevalent in a prior day session. Participants will respond to future tests of value as they offer favorable entry and exit.

Volume-Weighted Average Prices (VWAPs): A metric highly regarded by chief investment officers, among other participants, for quality of trade. Additionally, liquidity algorithms are benchmarked and programmed to buy and sell around VWAPs.

About

After years of self-education, strategy development, mentorship, and trial-and-error, Renato Leonard Capelj began trading full-time and founded Physik Invest to detail his methods, research, and performance in the markets.

Capelj also develops insights around impactful options market dynamics at SpotGamma and is a Benzinga reporter.

Some of his works include conversations with ARK Invest’s Catherine Wood, investors Kevin O’Leary and John Chambers, FTX’s Sam Bankman-Fried, Kai Volatility’s Cem Karsan, The Ambrus Group’s Kris Sidial, among many others.

Disclaimer

In no way should the materials herein be construed as advice. Derivatives carry a substantial risk of loss. All content is for informational purposes only.

Categories
Commentary

Daily Brief For April 28, 2022

The Daily Brief is a free glimpse into the prevailing fundamental and technical drivers of U.S. equity market products. Join the 200+ that read this report daily, below!

What Happened

Overnight, equity index futures auctioned sideways-to-higher alongside some upbeat earnings announcements.

Meta Platforms Inc (NASDAQ: FB) surged post-market, yesterday, after its main social network Facebook added more users than expected. 

PayPal Holdings Inc (NYSE: PYPL) vowed to rein in costs and boost profits while Qualcomm Inc (NASDAQ: QCOM) rose on an upbeat forecast.

There’s a strong push-and-pull between what’s good and bad. File Deutsche Bank’s (NYSE: DB) recent comments on a pending recession under what’s bad.

The bank sees the Fed Target Rate reaching up to 6% which “will push the economy into a significant recession by late next year.”

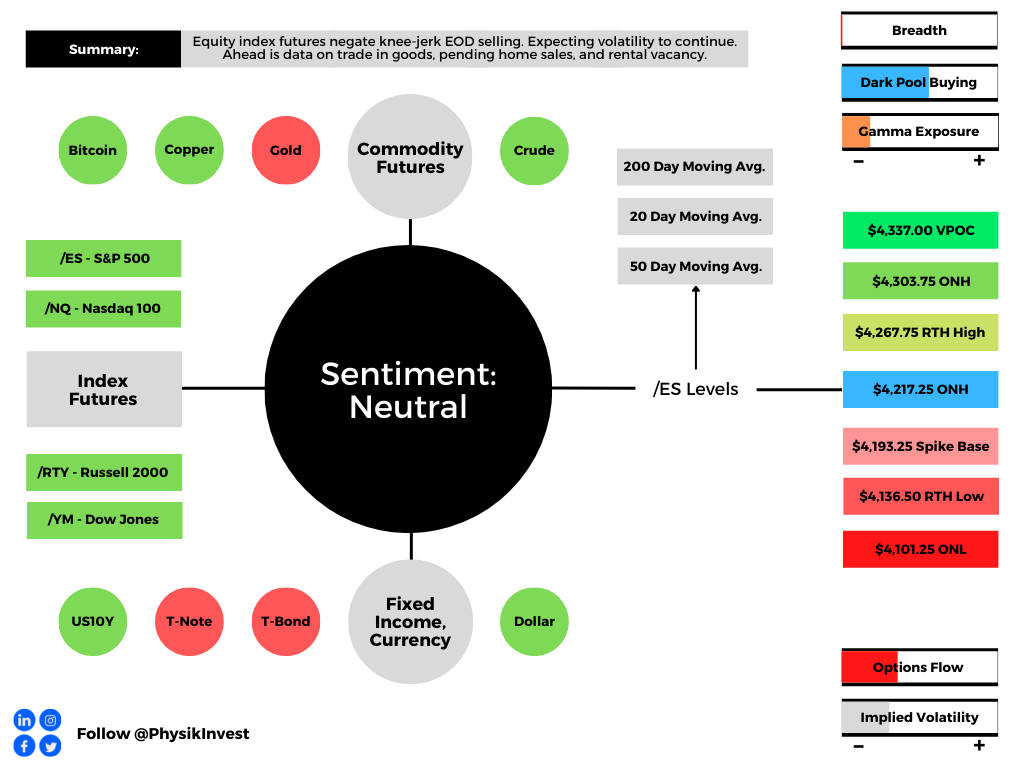
Graphic updated 7:00 AM ET. Sentiment Risk-On if expected /ES open is above the prior day’s range. Sentiment Risk-Off if expected /ES open is below the prior day’s range. /ES levels are derived from the profile graphic at the bottom of the following section. Levels may have changed since initially quoted; click here for the latest levels. SqueezeMetrics Dark Pool Index (DIX) and Gamma (GEX) calculations are based on where the prior day’s reading falls with respect to the MAX and MIN of all occurrences available. A higher DIX is bullish. At the same time, the lower the GEX, the more (expected) volatility. Learn the implications of volatility, direction, and moneyness. SHIFT data used for S&P 500 (INDEX: SPX) options activity. Note that options flow is sorted by the call premium spent; if more positive, then more was spent on call options. Breadth reflects a reading of the prior day’s NYSE Advance/Decline indicator. VIX reflects a current reading of the CBOE Volatility Index (INDEX: VIX) from 0-100.

What To Expect

Fundamental: Divergences across different assets and markets continue.

For instance, the equity market’s pricing of risk which we can take as being reflected by the CBOE Volatility Index [INDEX: VIX]) is not moving lock-step with that of measures elsewhere.

Graphic: Via Bloomberg.

The fear in one market tends to spread to others. Regardless of the cause, it seems that equity and bond market participants are not on the same page.

Is that really true, though? Not necessarily. 

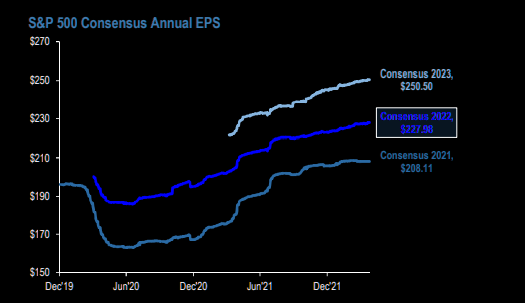
If we look at some single stocks, Netflix Inc (NASDAQ: NFLX), among others (all the while S&P 500 earnings have been revised up) has suffered through a substantial de-rate and volatility as participants priced the implications of policy evolution, slower economic growth, and beyond.

Graphic: Via JPMorgan Chase & Co (NYSE: JPM). Taken from The Market Ear.

That has us returning to pinning at the index level, relative to what the constituents are doing.

As well explained in Physik Invest’s March 3, 2022 commentary, this is more so a function of positioning and structural flows, or supply of liquidity.

Absent some exogenous event, participants are well-hedged for what is known (e.g., rate hikes and quantitative tightening (QT), COVID resurgences, Russia and Ukraine, among other things).

The caveat is that the Federal Reserve is far more aggressive than expected, ramping up QT, “a direct flow of capital to capital markets or flow out of,” per Kai Volatility’s Cem Karsan. 

For context, it is the intention to take from the max liquidity (which pushed participants out of the risk curve and promoted a divergence from fundamentals) markets were supplied with, and this has the effect of removing market excesses, some of which have fed into volatility markets.

In part, some of the QT has been reflected in bond prices, JPMorgan Chase & Co (NYSE: JPM) explains. However, should there be far more aggressive monetary action, as Deutsche research suggests, coupled with a worsening of the geopolitical and/or economic situation abroad (e.g., Russian default), markets are likely to succumb.

“Using the balance sheet as a tightening tool represents a large change in the Fed’s attitude, and IS NOT priced into the market,” MacroTourist’s Kevin Muir adds.

“An increase in the pace of tightening of QT should mean lower stocks, wider credit spreads, and a slight reduction in the need for front-end hikes.”

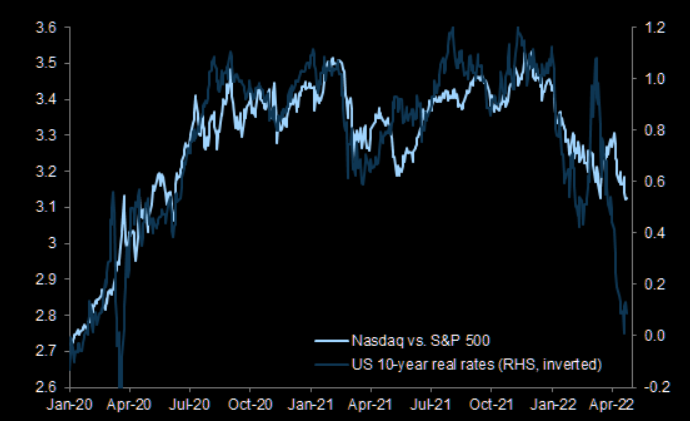
Graphic: Via Goldman Sachs Group Inc (NYSE: GS). Taken from The Market Ear. The “Nasdaq has underperformed the S&P 500 but by less than what the move in real yields would suggest.”

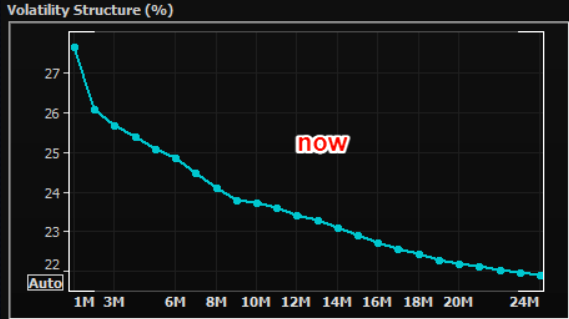
Positioning: Volatility to continue as markets have traded lower and participants have priced up the cost of insurance – particularly at the short-end – on underlying equity exposure.

Graphic: SPX volatility term structure via Refinitiv. Taken from The Market Ear.

This is due to options delta (exposure to direction) being far more sensitive (gamma) across shorter time horizons (i.e., the range across which options deltas shift from “near-zero to near-100% becomes very narrow.”)

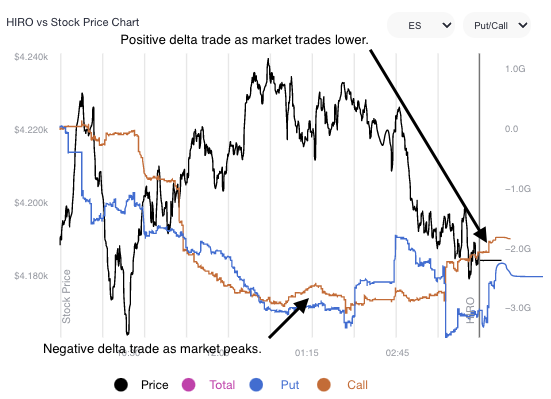
Yesterday, markets were pinned after exploring lower in the days prior. The activity was concentrated in short-dated bets at those levels, and that’s in part a result of some of the hedging that went on.

Graphic: Via SpotGamma’s Hedging Impact of Real-Time Options Indicator.

If markets do not perform to the downside (i.e., do not trade lower), those short-dated bets on direction will quickly decay, and hedging flows with respect to time (charm) and volatility (vanna) may bolster sharp rallies.

Whether those price rises have legs depends on what the fundamental situation is, then. Regardless, the returns distribution, based on implied volatility metrics alone, is skewed positive, albeit there are some large negative outliers.

Graphic: Via @HalfersPower. “In backwardation via $VIX: $VIX3M next month [realized volatility] is highest amongst the deciles (d10 >1) ~43% subsequent realized volatility.”

Technical: As of 7:00 AM ET, Thursday’s regular session (9:30 AM – 4:00 PM ET), in the S&P 500, will likely open in the middle part of a positively skewed overnight inventory, just inside of prior-range and -value, suggesting a limited potential for immediate directional opportunity.

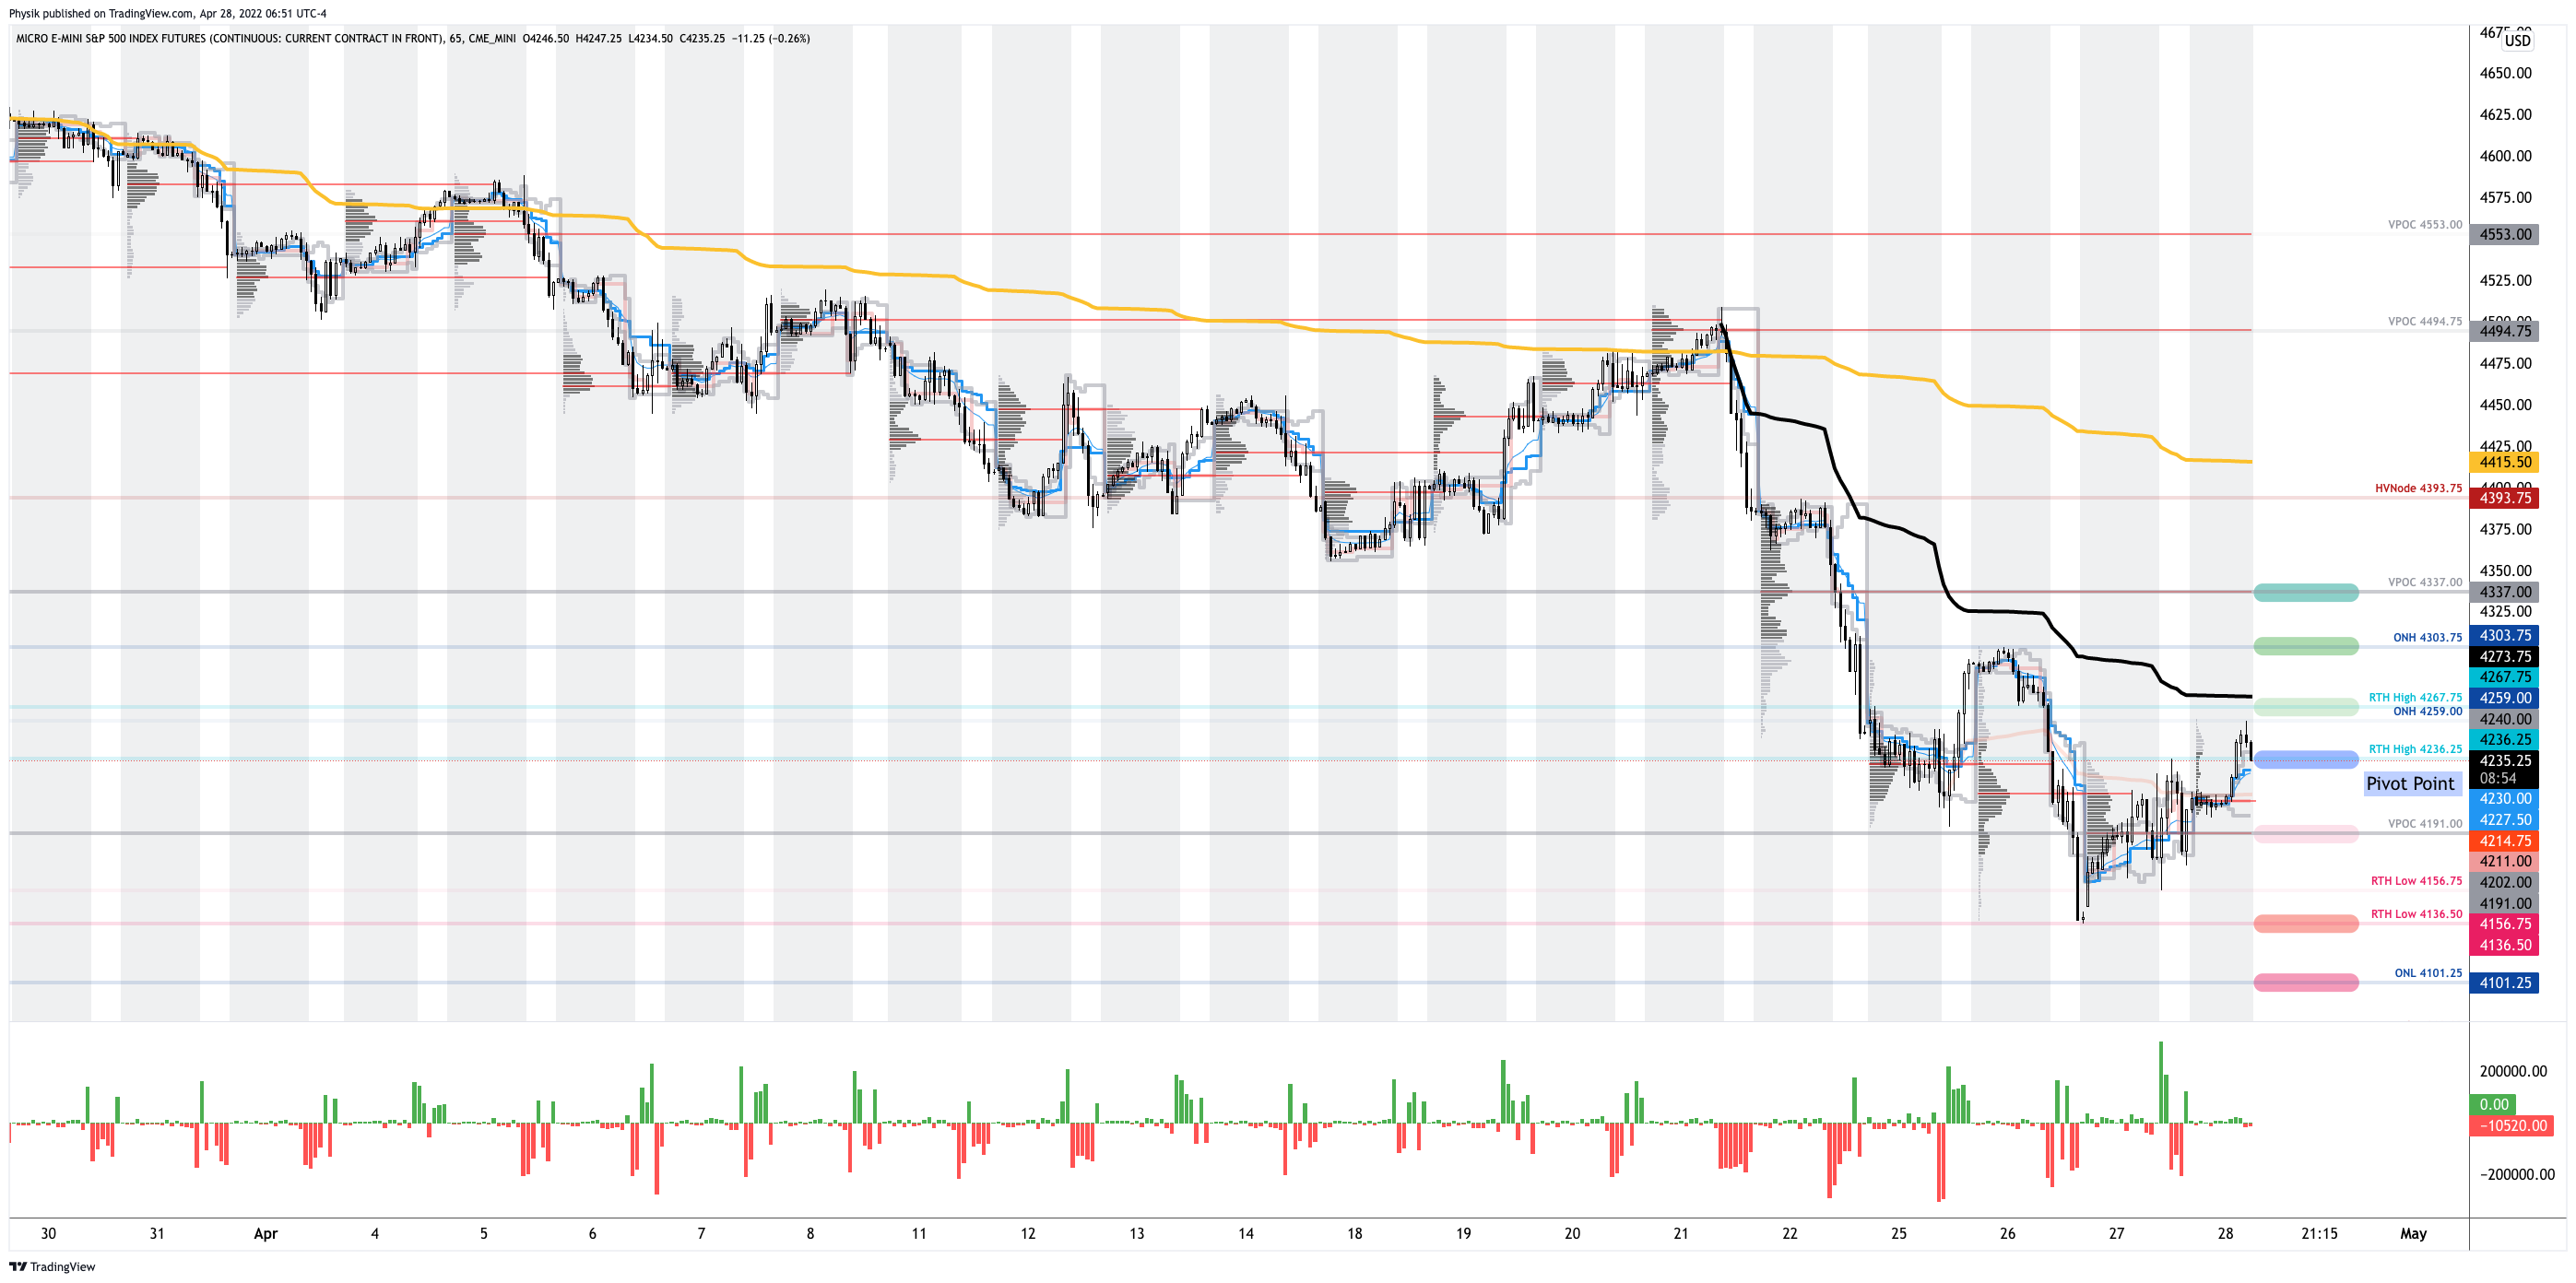
In the best case, the S&P 500 trades higher; activity above the $4,236.25 regular trade high (RTH High) puts in play the $4,267.75 RTH High. Initiative trade beyond the $4,267.75 RTH High could reach as high as the $4,303.75 overnight high (ONH) and $4,337.00 untested point of control (VPOC), or higher.

In the worst case, the S&P 500 trades lower; activity below the $4,236.25 RTH High puts in play the $4,191.00 VPOC. Initiative trade beyond the VPOC could reach as low as the $4,136.00 regular trade low (RTH Low) and $4,101.25 overnight low (ONL), or lower.

Click here to load today’s key levels into the web-based TradingView charting platform. Note that all levels are derived using the 65-minute timeframe. New links are produced, daily.
Graphic: 65-minute profile chart of the Micro E-mini S&P 500 Futures.

Considerations: Markets are higher after testing some key levels outlined in prior letters.

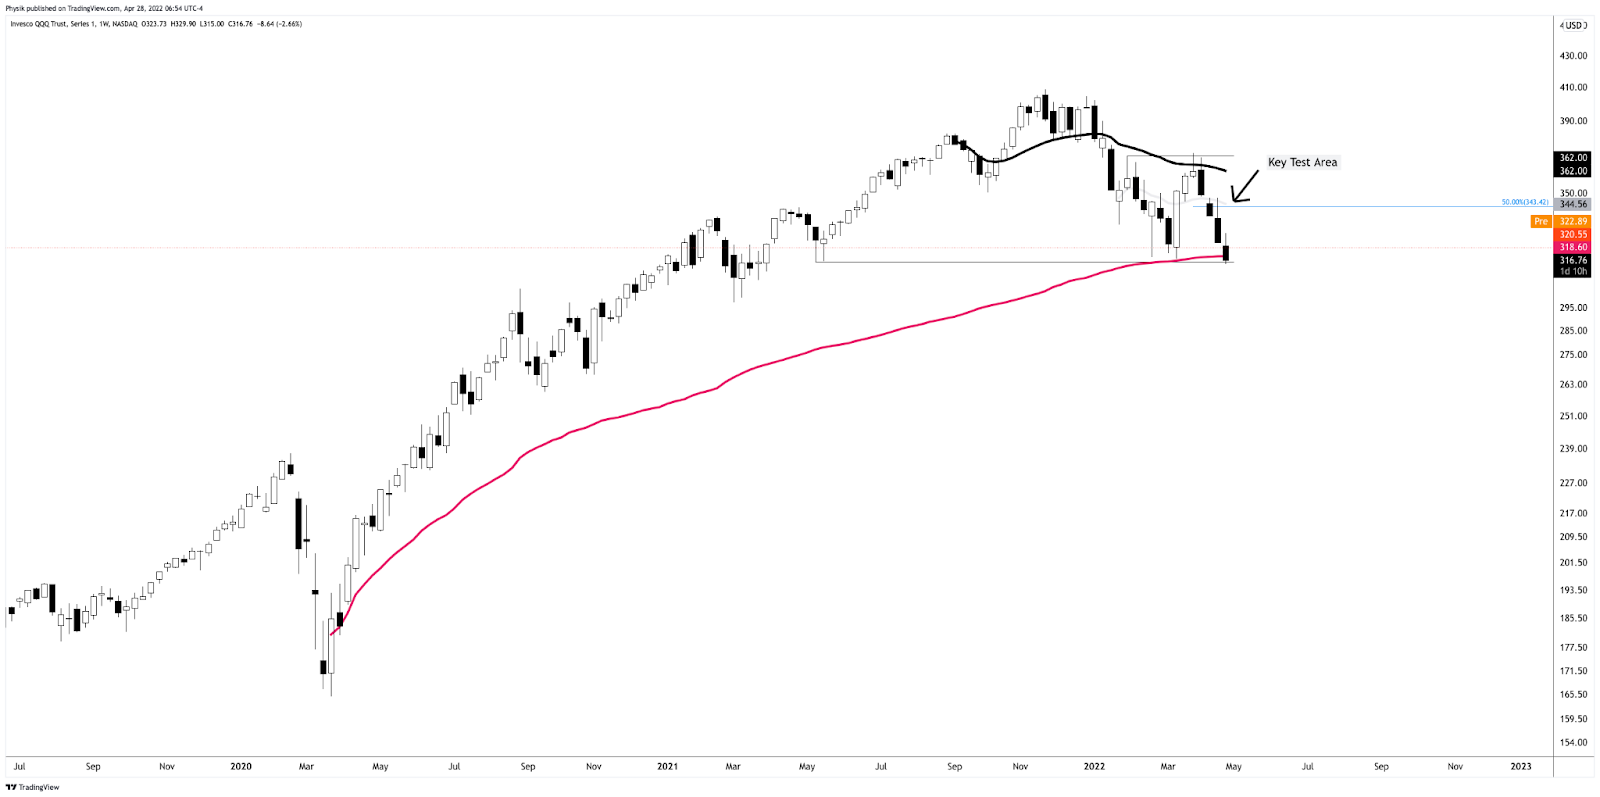
The Invesco QQQ Trust Series 1 (NASDAQ: QQQ), one of the weakest products this letter monitors, just tested a major VWAP, yesterday, anchored from the lows of March 2020. 

Graphic: Invesco QQQ Trust Series 1 (NASDAQ: QQQ) with anchored VWAPs.

The Nasdaq has led the market down. It may lead the market higher on reversals. We’ll continue to monitor market breadth, among other metrics, for signs of strength.

Definitions

Overnight Rally Highs (Lows): Typically, there is a low historical probability associated with overnight rally-highs (lows) ending the upside (downside) discovery process.

Volume Areas: A structurally sound market will build on areas of high volume (HVNodes). Should the market trend for long periods of time, it will lack sound structure, identified as low volume areas (LVNodes). LVNodes denote directional conviction and ought to offer support on any test. 

If participants were to auction and find acceptance into areas of prior low volume (LVNodes), then future discovery ought to be volatile and quick as participants look to HVNodes for favorable entry or exit.

Gamma: Gamma is the sensitivity of an option to changes in the underlying price. Dealers that take the other side of options trades hedge their exposure to risk by buying and selling the underlying. When dealers are short-gamma, they hedge by buying into strength and selling into weakness. When dealers are long-gamma, they hedge by selling into strength and buying into weakness. The former exacerbates volatility. The latter calms volatility.

Vanna: The rate at which the delta of an option changes with respect to volatility.

Charm: The rate at which the delta of an option changes with respect to time.

POCs: POCs are valuable as they denote areas where two-sided trade was most prevalent in a prior day session. Participants will respond to future tests of value as they offer favorable entry and exit.

Volume-Weighted Average Prices (VWAPs): A metric highly regarded by chief investment officers, among other participants, for quality of trade. Additionally, liquidity algorithms are benchmarked and programmed to buy and sell around VWAPs.

About

After years of self-education, strategy development, mentorship, and trial-and-error, Renato Leonard Capelj began trading full-time and founded Physik Invest to detail his methods, research, and performance in the markets.

Capelj also develops insights around impactful options market dynamics at SpotGamma and is a Benzinga reporter.

Some of his works include conversations with ARK Invest’s Catherine Wood, investors Kevin O’Leary and John Chambers, FTX’s Sam Bankman-Fried, Kai Volatility’s Cem Karsan, The Ambrus Group’s Kris Sidial, among many others.

Disclaimer

In no way should the materials herein be construed as advice. Derivatives carry a substantial risk of loss. All content is for informational purposes only.

Categories
Commentary

Daily Brief For April 27, 2022

The Daily Brief is a free glimpse into the prevailing fundamental and technical drivers of U.S. equity market products. Join the 200+ that read this report daily, below!

What Happened

Overnight, equity index futures probed higher, essentially negating Tuesday’s end-of-day, knee-jerk liquidation.

Tuesday’s selling came alongside Russia cutting gas to Poland and Bulgaria, Vice President Kamala Harris testing positive for COVID-19, and heavy selling in growth and tech stocks, amid doubts corporate profits can withstand the Federal Reserve’s bid to tame inflation.

As Jerome Schneider of Pacific Investment Management Co says, QT will “have a profound effect on the cost of liquidity and more importantly the cost of transacting business and reallocating assets from one avenue to another avenue.” 

“There might not necessarily be a rapid deceleration or decline in the stock market or other risk assets, but there’s going to be a changing cost of capital that this balance sheet is going to be part of.”

After the close, weakness continued. Alphabet Inc (NASDAQ: GOOGL) (NASDAQ: GOOG) missed on slowing sales growth and digital-ad spending. One of the biggest losers was Tesla Inc (NASDAQ: TSLA) which shed 12% or so on news that Elon Musk would use his fortune, much of which is tied up in Tesla, to buy Twitter Inc (NYSE: TWTR).

Germany’s passage of a bigger borrowing budget, coupled with China’s pledge to boost infrastructure bolstered an overnight advance that fed into price action at home. The S&P 500, in particular, for a brief moment, took back a key level, negating much of yesterday’s liquidation.

Ahead is data on international trade in goods (8:30 AM ET), as well as pending home sales and the rental vacancy rate (10:00 AM ET).

Graphic updated 7:00 AM ET. Sentiment Neutral if expected /ES open is inside of the prior day’s range. /ES levels are derived from the profile graphic at the bottom of the following section. Levels may have changed since initially quoted; click here for the latest levels. SqueezeMetrics Dark Pool Index (DIX) and Gamma (GEX) calculations are based on where the prior day’s reading falls with respect to the MAX and MIN of all occurrences available. A higher DIX is bullish. At the same time, the lower the GEX, the more (expected) volatility. Learn the implications of volatility, direction, and moneyness. SHIFT data used for S&P 500 (INDEX: SPX) options activity. Note that options flow is sorted by the call premium spent; if more positive, then more was spent on call options. Breadth reflects a reading of the prior day’s NYSE Advance/Decline indicator. VIX reflects a current reading of the CBOE Volatility Index (INDEX: VIX) from 0-100.

What To Expect

Positioning: Markets are positioned for continued volatility. 

Based on a reading of market gamma exposure (GEX) and buying support (DIX), the returns distribution is skewed positive. There’s buying in the context of an environment in which the hedging of options positioning implies selling into weakness and buying of strength.

Graphic: Via Barclays PLC (NYSE: BCS) research.

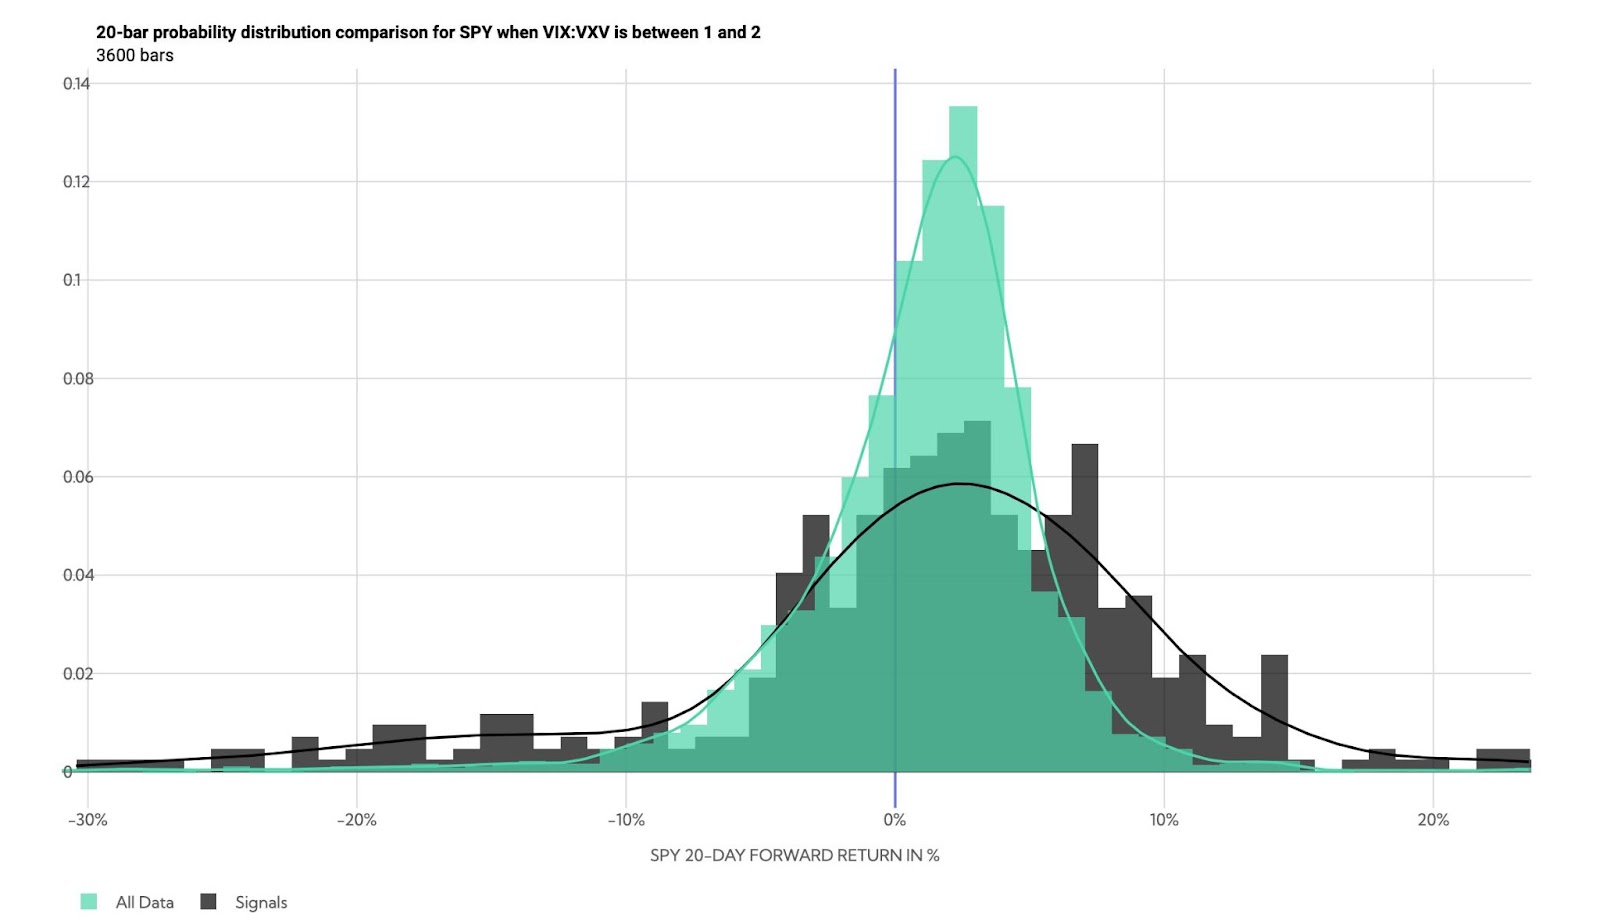
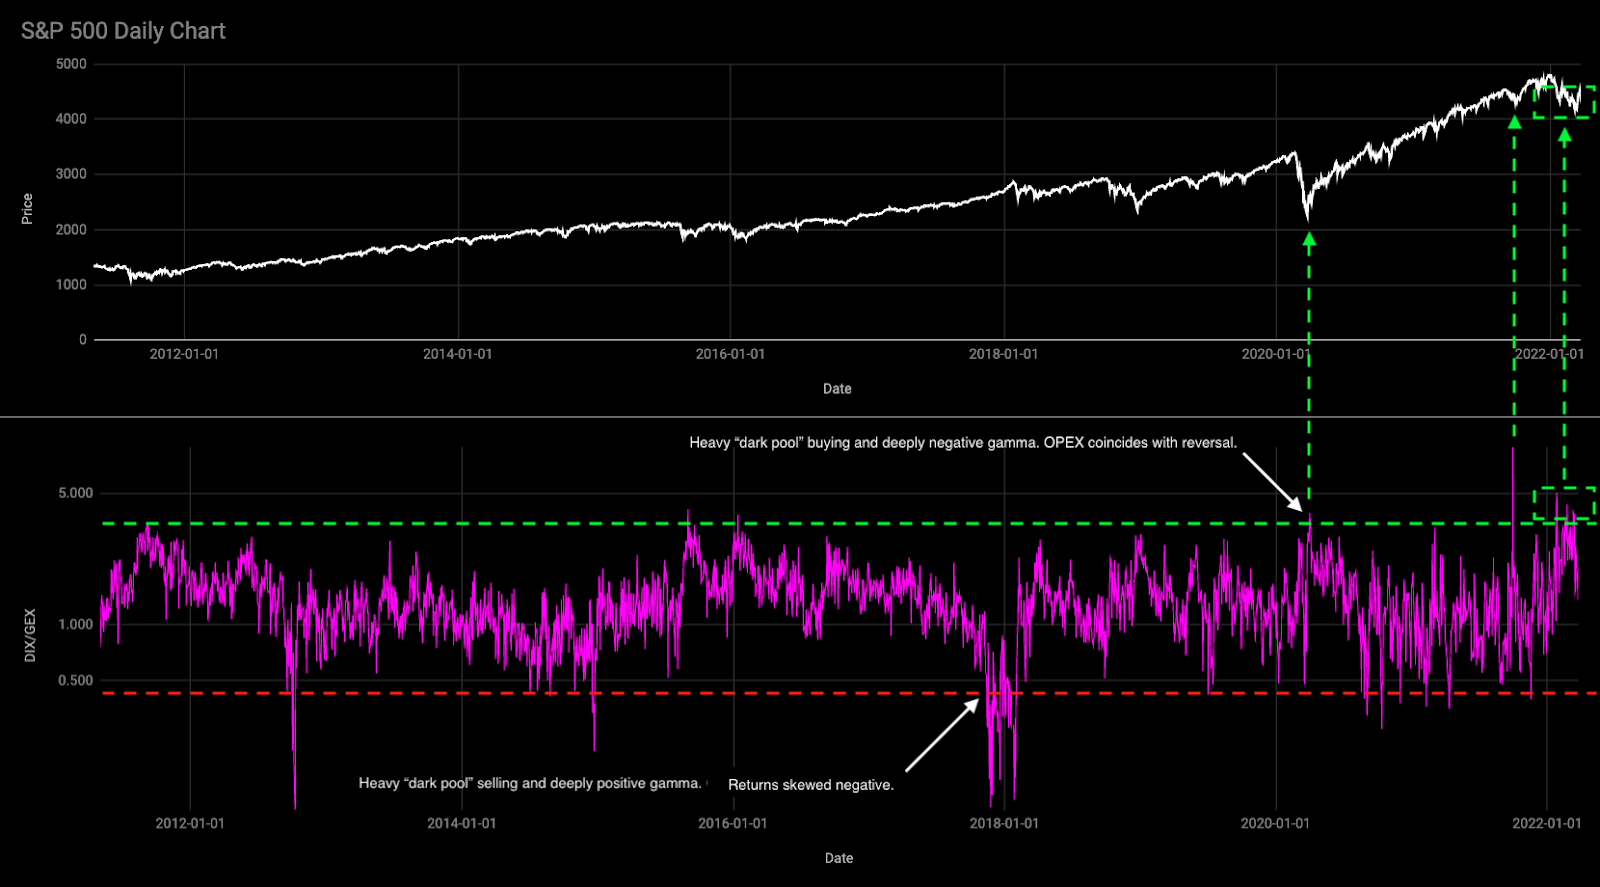
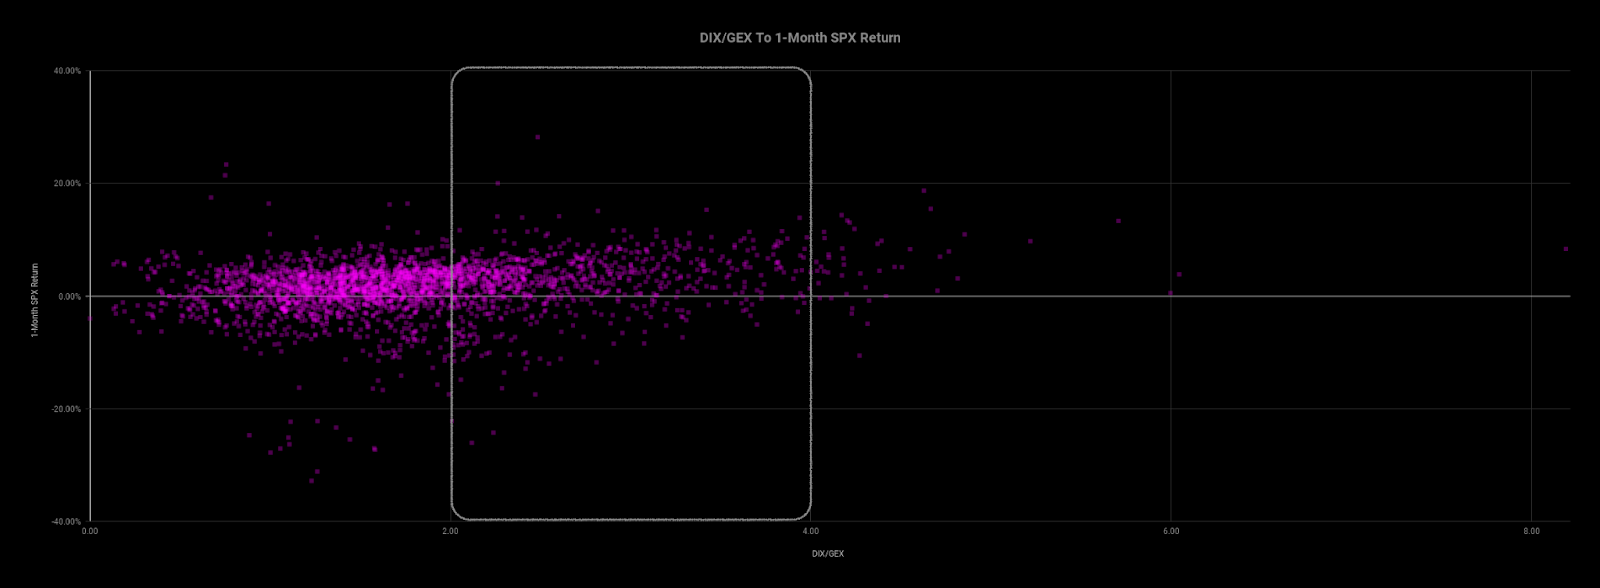
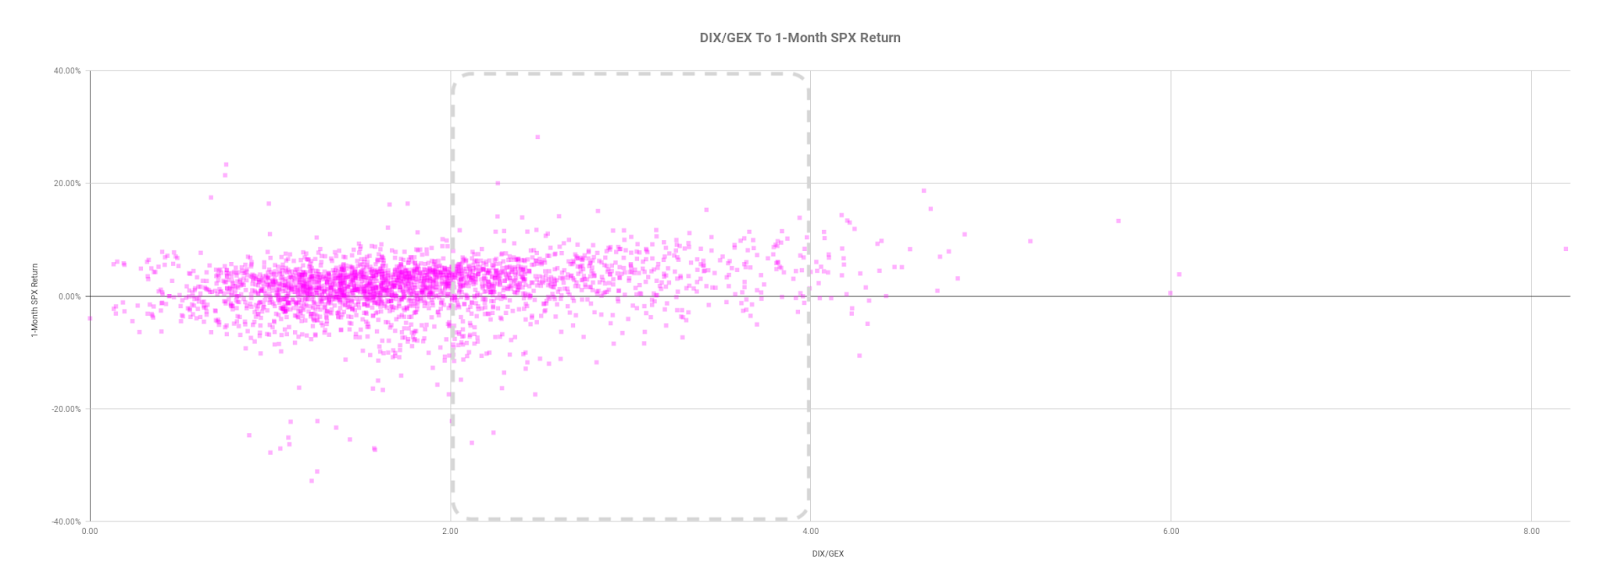
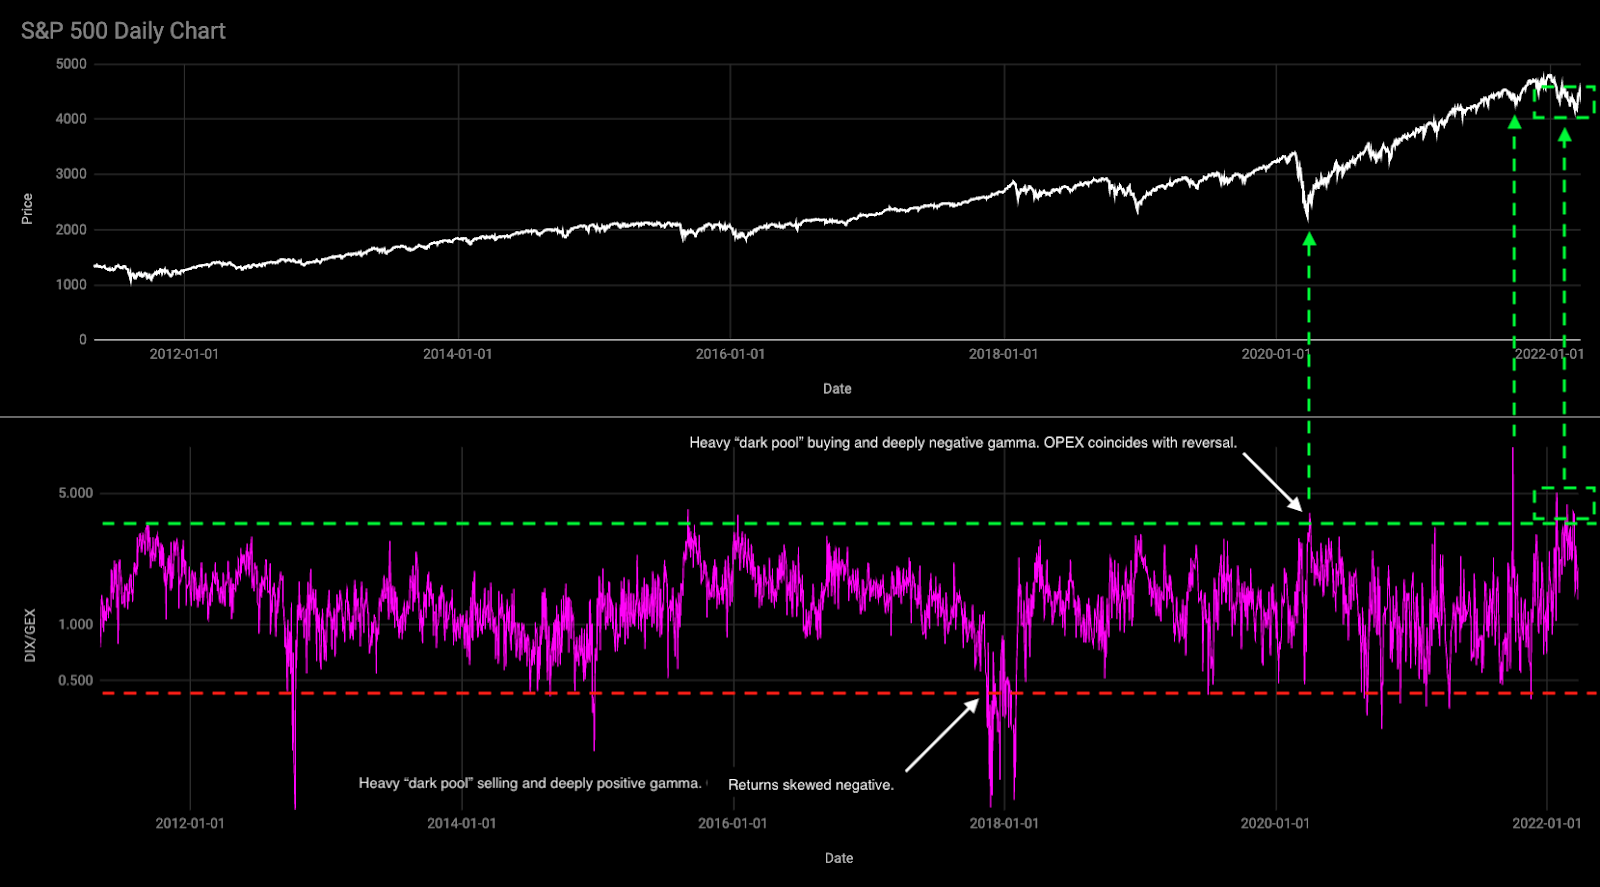
In the most simple way that I can explain: when positioning is stretched one way, that often tends to mark a turning point – the returns distribution is either skewed positive or negative.

Graphic: Via Physik Invest. Data via SqueezeMetrics. Updated March of 2022. A high DIX/GEX ratio often portends positive 1-month returns.

An updated read, after Tuesday’s weak close, tells us that we can (1) definitely expect larger ranges to continue and (2) potential for short-term bounces

Based on overnight activity, one of those is happening, now.

Graphic: Via Physik Invest. Data via SqueezeMetrics.

This is as participants are both well-hedged and using weakness as an opportunity to buy into a less highly valued market.

Well-hedged means that customers (i.e., you and I) own protection against long equity exposure. So, that could mean customers own puts and/or are short calls. One of the most dominant flows is the long put, short call.

Such trade offers customers positive, yet asymmetric (gamma), exposure to direction (delta). In other words, negative delta and positive gamma. 

The counterparty has exposure to positive delta and negative gamma. If the underlyings trade lower and volatility rises, all else equal, the position will lose. To hedge against these losses, the counterparties will sell underlying into weakness.

If prices reverse and move higher, these counterparties will re-hedge and buy underlying.

Normally, as seen over the bull run of 2020 and 2021, markets are in an uptrend and there’s a strong supply of volatility. Often, customers sell more calls than puts and, in an uptrend, those calls solicit more active hedging than the put options.

Recall that the customer is short the call. That means the counterparty is long the call (a positive delta and gamma trade) and will make money if prices rise, all else equal. 

The hedging of this particular exposure (i.e., sell strength, buy weakness), in an uptrend, occurs slower (i.e., counterparts will allow their profits to run), and that’s what can help the market sustain lower volatility trends for longer periods.

When prices reverse and underlyings trade lower, put options solicit increased hedging activity. Given the nature of counterparty exposure to those puts, that hedging happens quickly and can take from market liquidity as to volatility (i.e., buy strength, sell weakness).

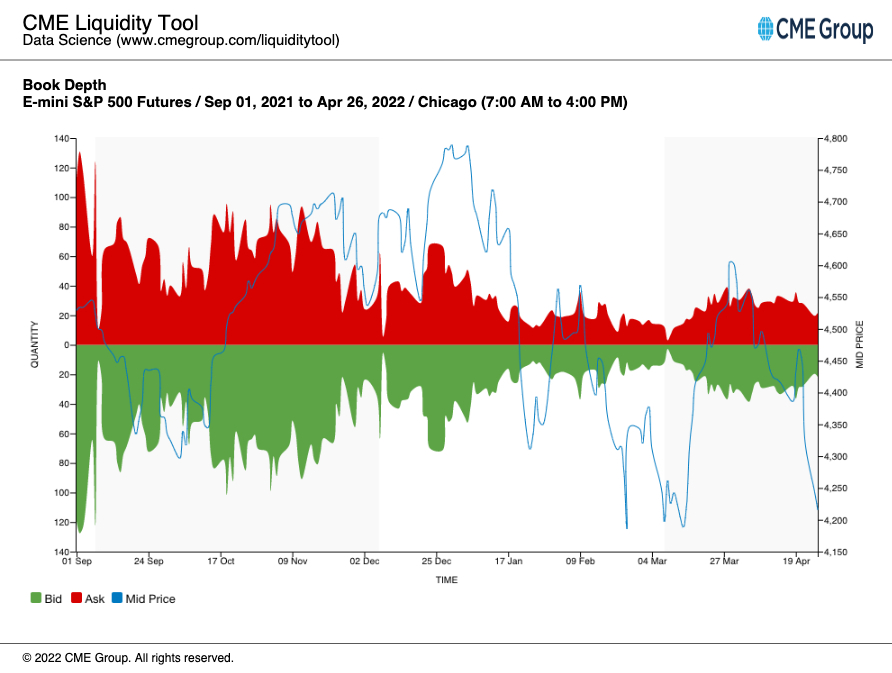
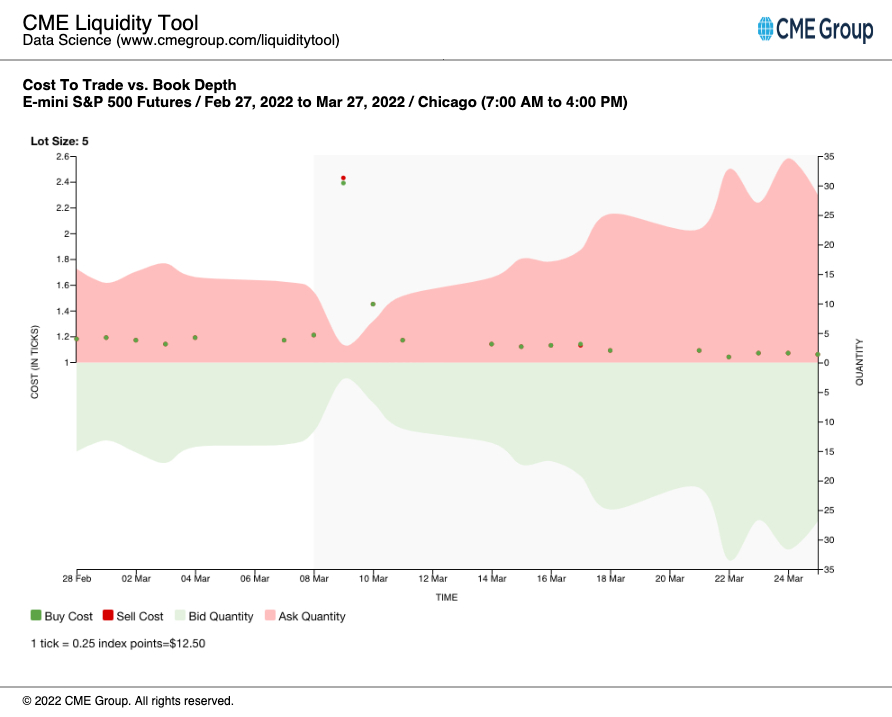
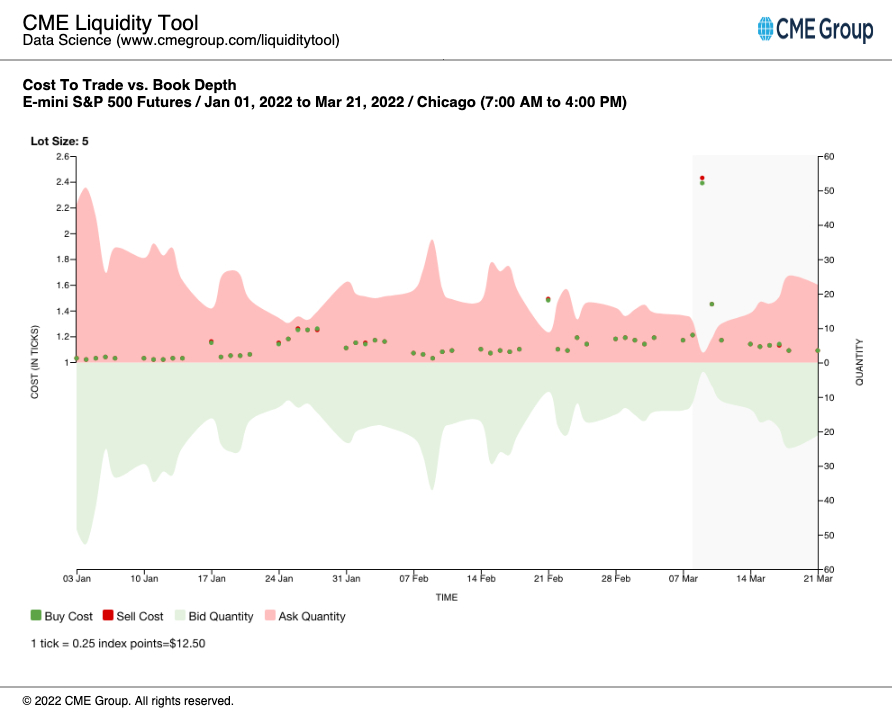
See, below, E-mini S&P 500 book depth, a proxy for market liquidity, and how much it has declined since the end of last year when markets became more volatile and noise around the Federal Reserve’s intent to taper bond-buying and raise rates grew louder.

Graphic: Via CME Group Inc (NASDAQ: CME) Liquidity Tool. Note how in late March, book depth rose as markets rose and customer call activity solicited increased hedging of counterparty long-gamma exposure (i.e., buy weakness, sell strength), adding to market liquidity.

In the above environment, counterparty hedging matters; the market is more sensitive to the flow, so to speak. That sensitivity is expected to continue.

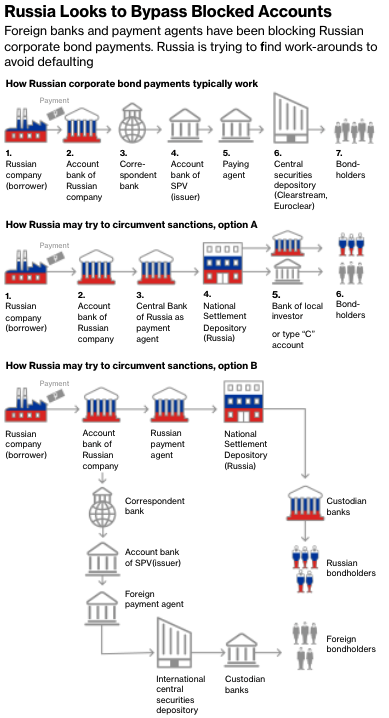
SpotGamma, an options data and analysis service, sees the early May period as pivotal. Then is the Federal Open Market Committee (FOMC) meeting and the potential Russian default, per Moody’s Corporation (NYSE: MCO).

As quoted: “Russia ‘may be considered in default’ if it does not pay two bonds in US dollars by end of a grace period on May 4.”

Graphic: Via Bloomberg.

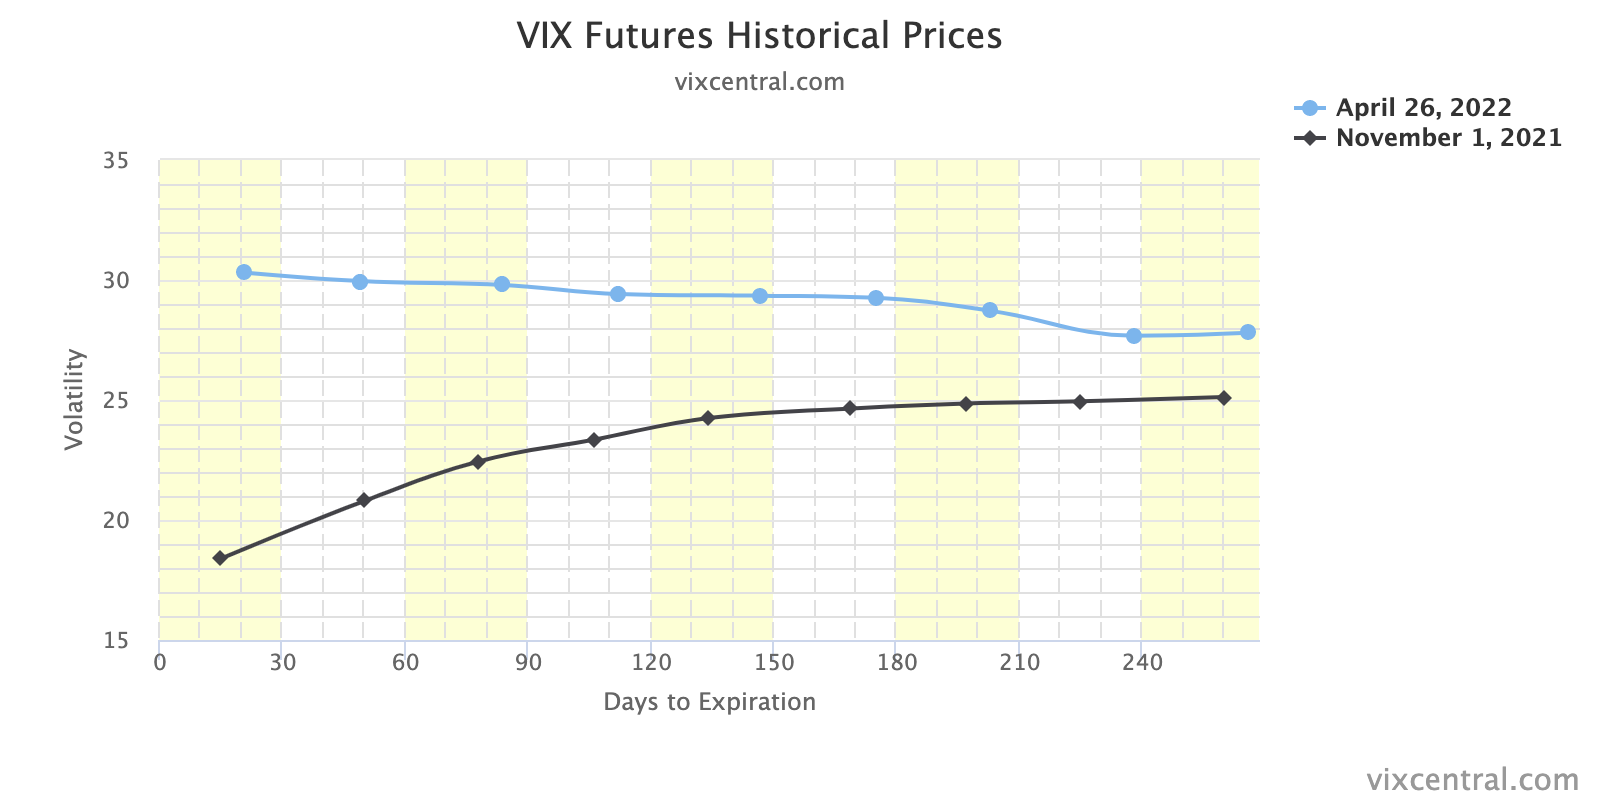
Until those events are resolved, participants will likely continue to (remain) hedge(d). Upon resolve, customers likely monetize their protection to offset losses on underlying equity exposure. 

That means selling volatility which reduces counterparty exposure to short puts (negative gamma and positive delta). To re-hedge, underlying is bought back and that may support a price rise.

Graphic: VIX term structure via VIX Central. Expansion (higher) solicits counterparty selling which pressures the market lower. Compression (lower) solicits counterparty buying which bolsters attempts higher.

Whether that price rise has legs depends on what the fundamental situation is, then. See the below section titled Considerations for a full technical picture and the most likely turning points.

Technical: As of 7:00 AM ET, Wednesday’s regular session (9:30 AM – 4:00 PM ET), in the S&P 500, will likely open in the middle part of a balanced overnight inventory, inside of prior-range and -value, suggesting a limited potential for immediate directional opportunity.

In the best case, the S&P 500 trades higher; activity above the $4,217.25 overnight high (ONH) puts in play the $4,267.75 regular trade high (RTH High). Initiative trade beyond the RTH High could reach as high as the $4,303.75 ONH and $4,337.00 VPOC, or higher.

In the worst case, the S&P 500 trades lower; activity below the $4,217.25 ONH puts in play the $4,193.25 spike base. Initiative trade beyond the spike base could reach as low as the $4,136.50 regular trade low (RTH Low) and $4,101.25 overnight low (ONL), or lower.

Considerations: Spikes mark the beginning of a break from value. Spikes higher (lower) are validated by trade at or above (below) the spike base (i.e., the origin of the spike).

Additionally, the indexes continue to trade below their 20-, 50-, and 200-day simple moving averages, confirming the trend change and bearish tone (further validated by poor breadth).

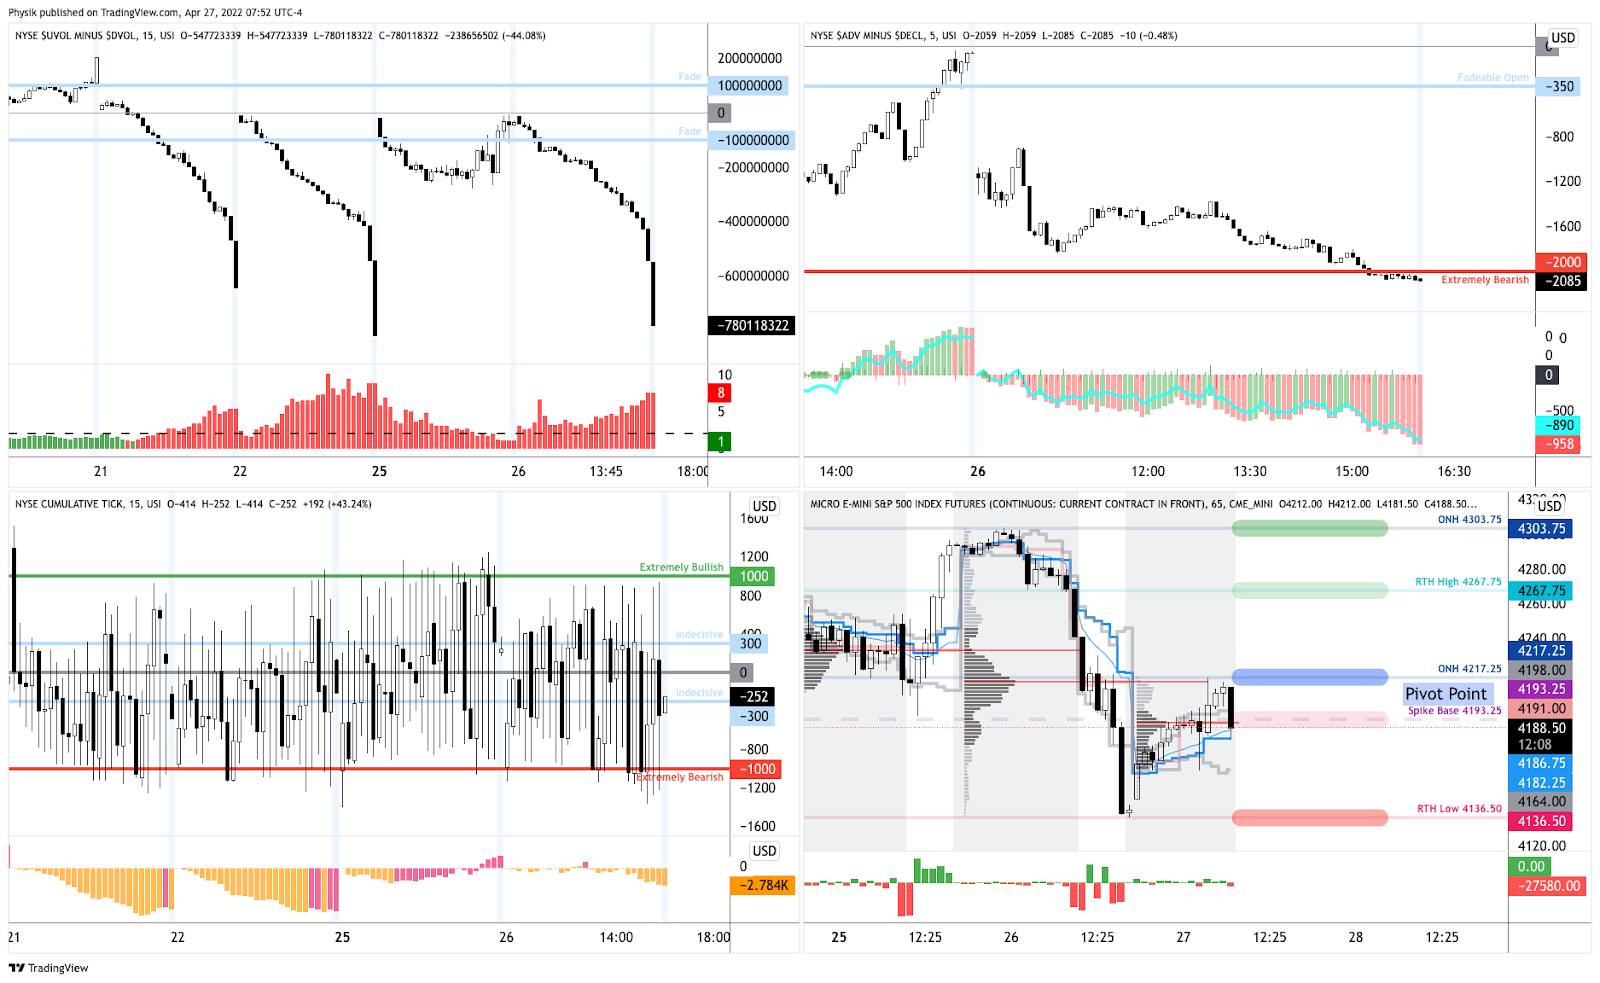
Graphic: Market Internals as pioneered by (a mentor of mine) Peter Reznicek. Notice the indicator in the top right, weighted S&P sectors (histogram) versus unweighted (blue line). During late last week, participants sold the entire market, heavily (as supported by the difference between the volume flowing into stocks that are up versus those that are down).

All indexes remain, as stated, yesterday, below their volume-weighted average prices (VWAPs) anchored from the start of this year (or their respective peaks). 

VWAPs are a metric highly regarded by chief investment officers (CIOs), among other participants, for quality of trade. Liquidity algorithms, too, are benchmarked and programmed to buy and sell around VWAPs.

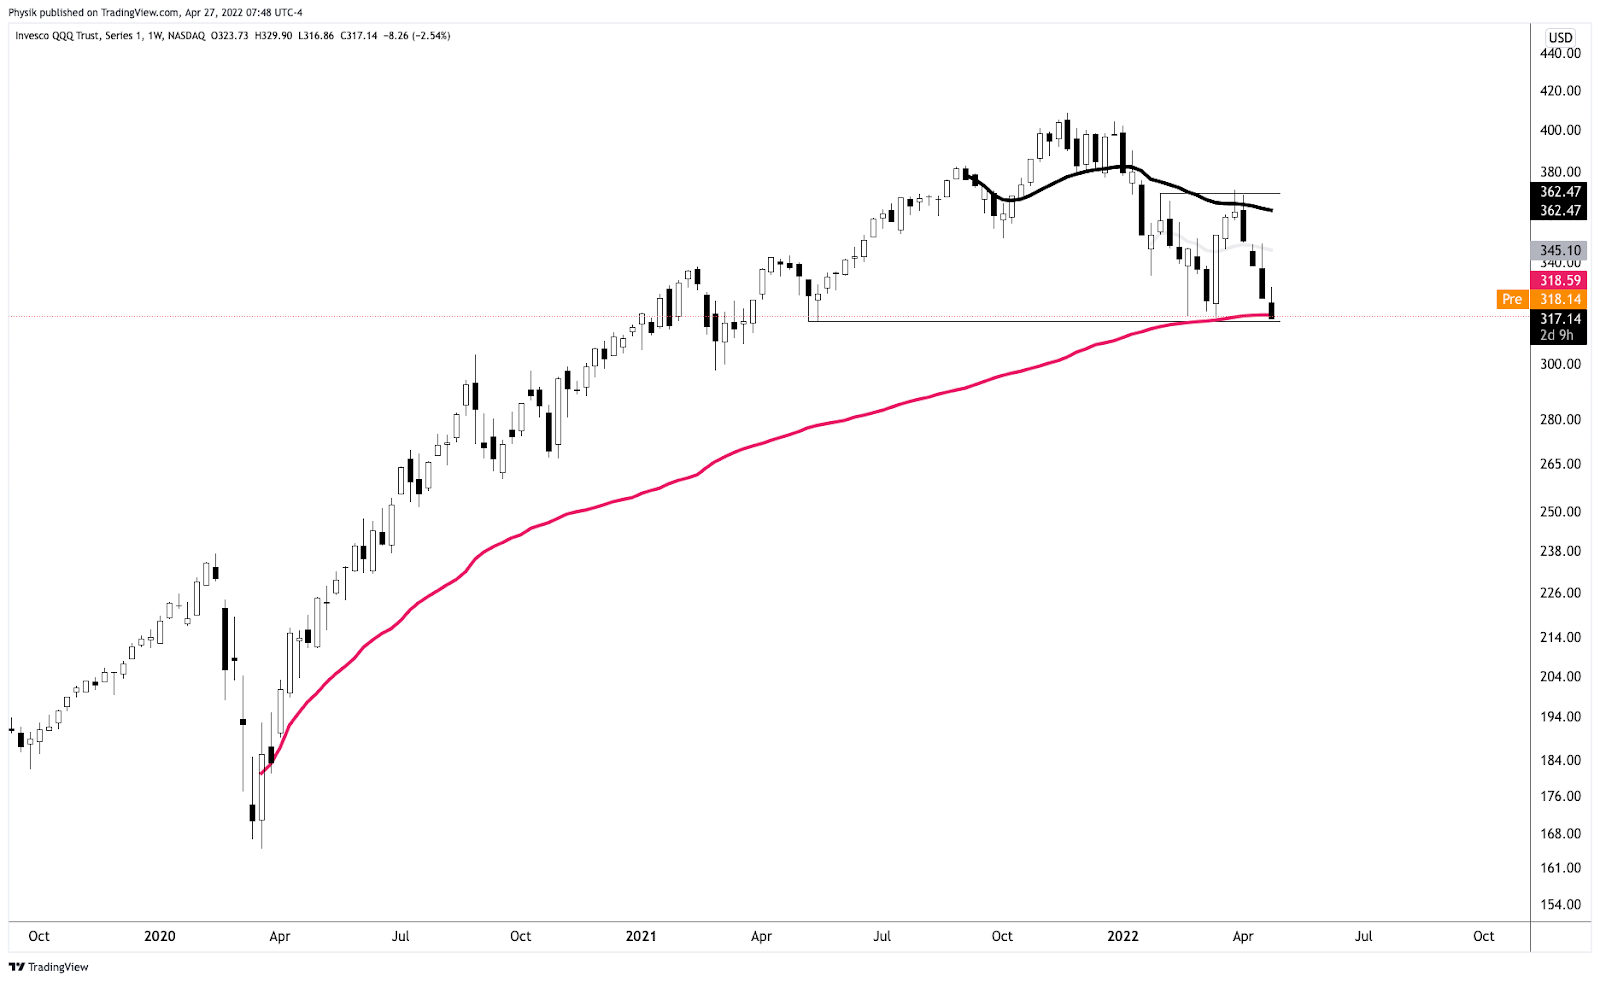
The Invesco QQQ Trust Series 1 (NASDAQ: QQQ) just tested a major VWAP, yesterday, anchored from the lows of March 2020. That’s a fair price to pay for Nasdaq 100 exposure.

Graphic: Invesco QQQ Trust Series 1 (NASDAQ: QQQ) with anchored VWAPs.

Notwithstanding, notice the flat-to-declining AVWAP that’s black in color. So long as prices remain below this level, the index is likely a sell. 

Should that level flatten (and begin to rise), and if the QQQ was able to trade above it for a sustained period, there is potential for sustained upside.

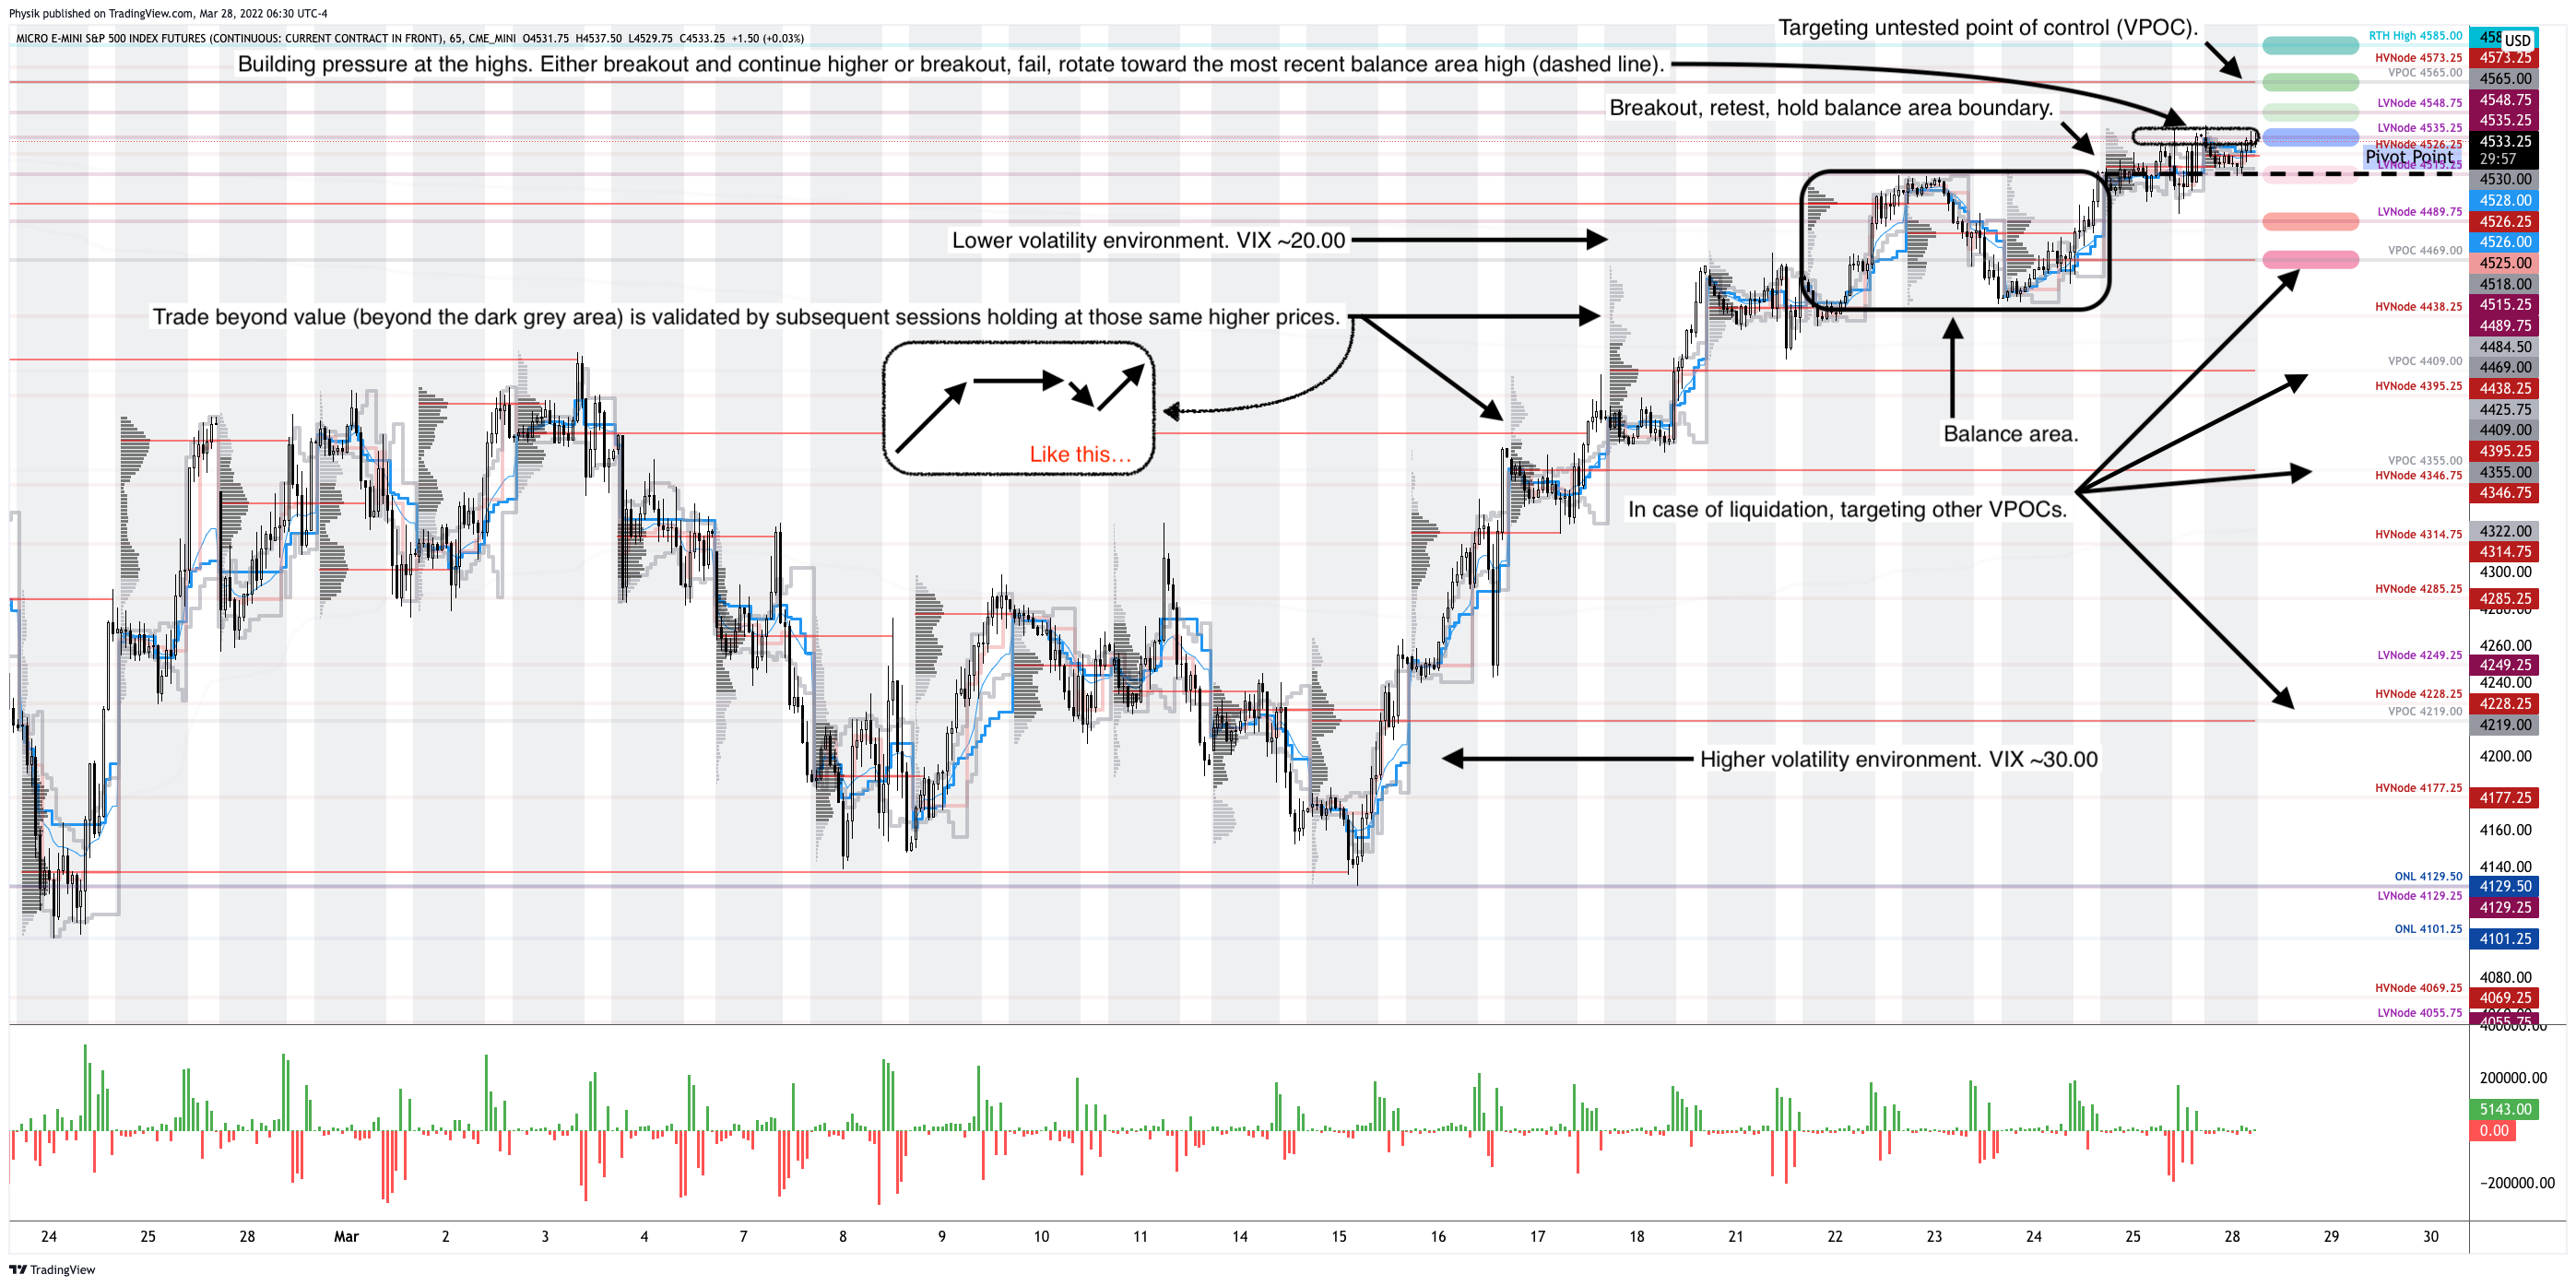
Click here to load today’s key levels into the web-based TradingView charting platform. Note that all levels are derived using the 65-minute timeframe. New links are produced, daily.
Graphic: 65-minute profile chart of the Micro E-mini S&P 500 Futures.

Definitions

Overnight Rally Highs (Lows): Typically, there is a low historical probability associated with overnight rally-highs (lows) ending the upside (downside) discovery process.

Volume Areas: A structurally sound market will build on areas of high volume (HVNodes). Should the market trend for long periods of time, it will lack sound structure, identified as low volume areas (LVNodes). LVNodes denote directional conviction and ought to offer support on any test. 

If participants were to auction and find acceptance into areas of prior low volume (LVNodes), then future discovery ought to be volatile and quick as participants look to HVNodes for favorable entry or exit.

POCs: POCs are valuable as they denote areas where two-sided trade was most prevalent in a prior day session. Participants will respond to future tests of value as they offer favorable entry and exit.

About

After years of self-education, strategy development, mentorship, and trial-and-error, Renato Leonard Capelj began trading full-time and founded Physik Invest to detail his methods, research, and performance in the markets.

Capelj also develops insights around impactful options market dynamics at SpotGamma and is a Benzinga reporter.

Some of his works include conversations with ARK Invest’s Catherine Wood, investors Kevin O’Leary and John Chambers, FTX’s Sam Bankman-Fried, Kai Volatility’s Cem Karsan, The Ambrus Group’s Kris Sidial, among many others.

Disclaimer

In no way should the materials herein be construed as advice. Derivatives carry a substantial risk of loss. All content is for informational purposes only.
Categories
Commentary

Daily Brief For April 25, 2022

Editor’s Note: Wow, what a month! Looks like there was a ton of volatility we weren’t able to navigate together.

I’m back now and will be making changes to both the quantity and quality of notes sent. In total transparency, I took on way too much work, and quality suffered a tad. I look forward to making things a bit more sustainable and am grateful for your interest in remaining a subscriber.

Interested in getting this free glimpse into the prevailing fundamental and technical drivers of U.S. equity market products. Join the 200+ that read this report daily, below, today!

What Happened

Overnight, the equity index and most commodity futures explored lower. Bonds and implied volatility metrics were bid.

This is alongside news that China’s reaction to a local COVID-19 outbreak may feed into global slowdowns just as supply pressures, among other things, are pushing the Federal Reserve (Fed) to adopt a more hawkish policy stance.

Notable is the pace at which China’s yuan is falling. 

Per TD Securities, it suggests “the PBOC is utilizing the yuan as another tool to provide stimulus to the economy at a time when they are showing restraint on the monetary policy front.” 

Ahead, there are no important economic events scheduled. See who is reporting earnings, here.

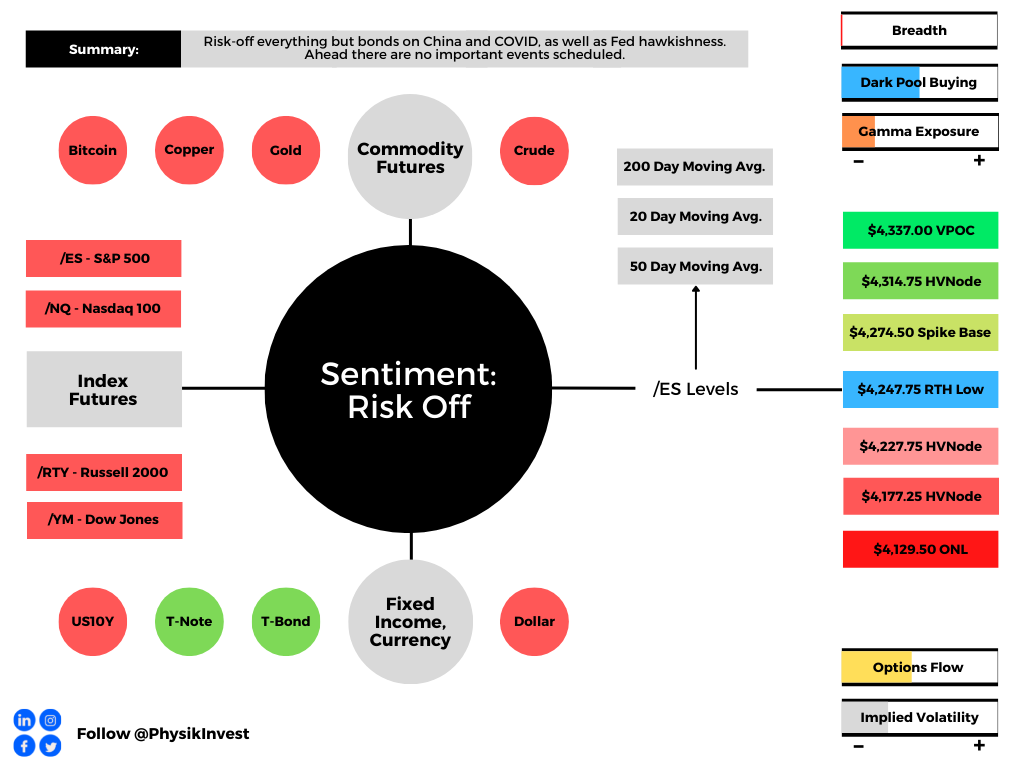
Graphic updated 7:30 AM ET. Sentiment Risk-Off if expected /ES open is below the prior day’s range. /ES levels are derived from the profile graphic at the bottom of the following section. Levels may have changed since initially quoted; click here for the latest levels. SqueezeMetrics Dark Pool Index (DIX) and Gamma (GEX) calculations are based on where the prior day’s reading falls with respect to the MAX and MIN of all occurrences available. A higher DIX is bullish. At the same time, the lower the GEX, the more (expected) volatility. Learn the implications of volatility, direction, and moneyness. SHIFT data used for S&P 500 (INDEX: SPX) options activity. Note that options flow is sorted by the call premium spent; if more positive, then more was spent on call options. Breadth reflects a reading of the prior day’s NYSE Advance/Decline indicator. VIX reflects a current reading of the CBOE Volatility Index (INDEX: VIX) from 0-100.

What To Expect

Fundamental: A push-and-pull, continues.

At a high level, it was surmised that many of the responses to geopolitical tension and inflation were priced in. The economy, since early pandemic disruptions, has strengthened and the need for ultra-accommodative policies is no more.

Graphic: Via S&P Global Inc (NYSE: SPGI).

That means low rates and quantitative easing (QE) – easy money so to speak – are on the way out, at least for the time being.

Recall that QE is a policy to expand the Federal Reserve’s balance sheet “to provide monetary accommodation, typically when interest rates are at a zero-lower bound (when nominal interest rates are at, or near, zero),” as JH Investment Management explains.

With QT, central banks remove assets (e.g., government bonds they bought from the private sector) from their balance sheet “either through the sale of assets they had purchased or deciding against reinvesting the principal sum of maturing securities.”

With that, we note that when bonds rise in value, their yields decline; “when the Fed embarks on bond-buying program[s] to support the U.S. economy, … [it nudges] the prices of these assets higher while pushing yields lower, which also has the effect of driving yield-hungry investors into relatively riskier asset categories that promise high returns.”

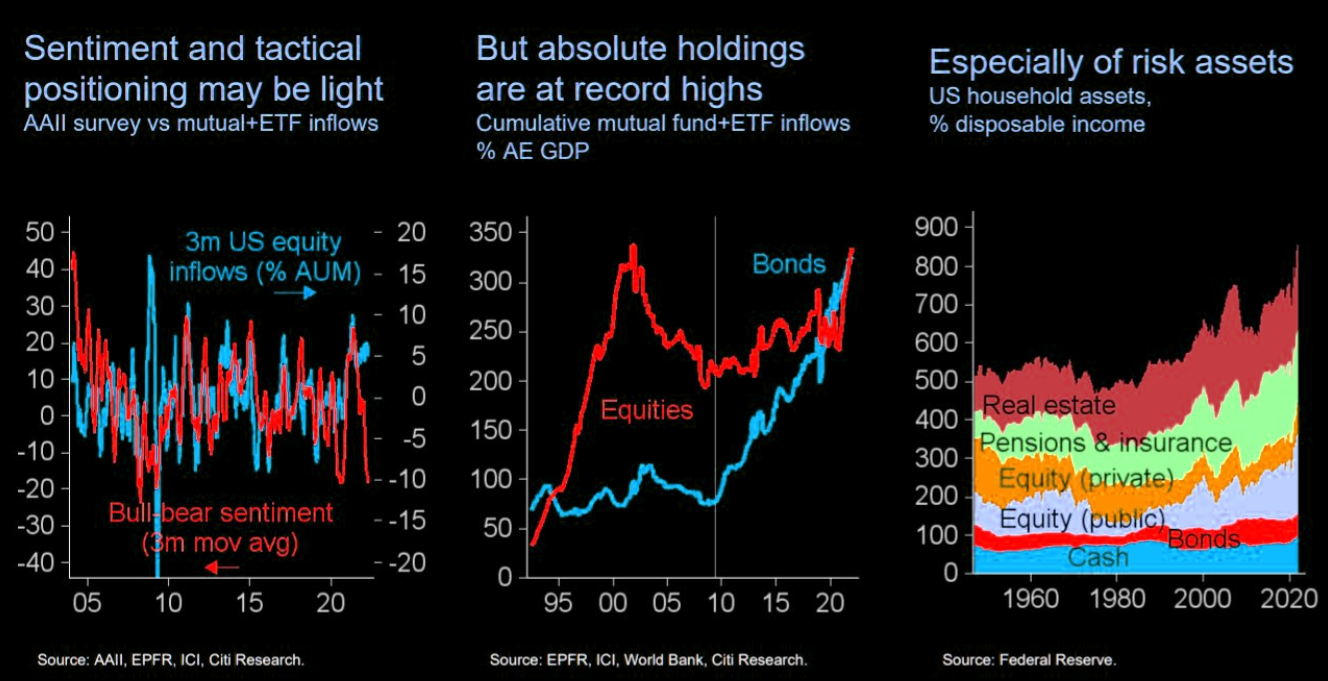
Graphic: Via ICI. Taken from The Market Ear.

As a result, participants’ demand for risk assets prompts their divergence from fundamentals. As liquidity is removed and funding costs increase, this may prompt risk assets to converge with fundamentals.

This is because, for investors to take on additional risk for return, they must receive in excess of the risk-free rate (as provided by the Treasury). This excess is the risk premium.

Previously, as the Damped Spring’s Andy Constan had previously commented, “[a]dditional risk premium expansion pressures from these levels is not likely.”

“However, if, in the unlikely event, details of QT do emerge suggesting a start of QT before June and at a greater size than expected, we would no longer be willing to hold [risk] assets as that would cause an end to any risk premium contraction possibilities.”

Well, that’s what happened in early April when Fed members said their debt holdings would be reduced “at a rapid pace” as soon as May, as well as hike rates, faster. 

“Given that the recovery has been considerably stronger and faster than in the previous cycle, I expect the balance sheet to shrink considerably more rapidly than in the previous recovery,” the Fed’s Lael Brainard said

The Fed may even raise “caps” on the pace of QT.

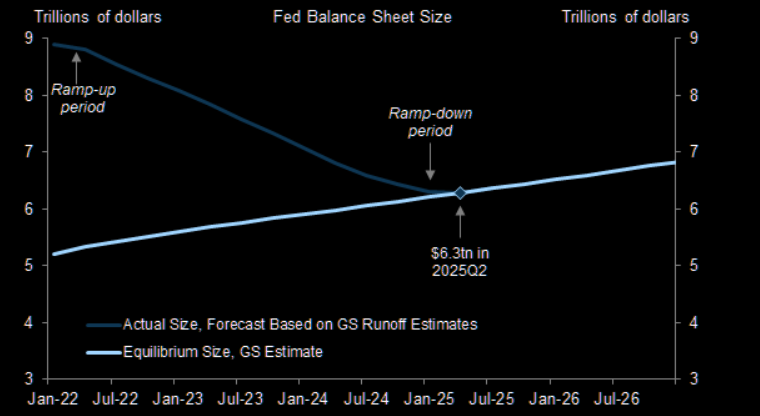
Graphic: Via The Market Ear. Goldman Sachs Group Inc (NYSE: GS) sees the balance sheet shrinking “to an equilibrium size of just over $6tn by early- or mid-2025, though there is substantial uncertainty about its terminal size.”

Per CME Group Inc’s (NASDAQ: CME) FedWatch Tool, market participants are pricing a near-100% probability that the Fed will move the target rate to 75-100 bps (+50 or +75 bps).

Graphic: Via CME Group Inc. FedWatch Tool suggests a near-100% chance of a Fed hike that moves the target rate between 75 and 100 bps.

At a high-level, rates hikes take time to flow through to the economy while “QT is a direct flow of capital to capital markets or flow out of,” according to statements by Kai Volatility’s Cem Karsan. 

“An increase in the pace of tightening of QT should mean lower stocks, wider credit spreads and a slight reduction in the need for front-end hikes,” explains Kevin Muir of the MacroTourist.

“Using the balance sheet as a tightening tool represents a large change in the Fed’s attitude, and IS NOT priced into the market.”

Graphic: Bloomberg. “Everyone bearish, but redemptions just starting,” said BofA strategists led by Michael Hartnett, adding that the environment of “extreme inflation” and rates shock is just setting in, as the Federal Reserve tightens monetary policy. “75 basis points is the new 25 basis points,” Hartnett said, referring to the scope of future interest-rate hikes.

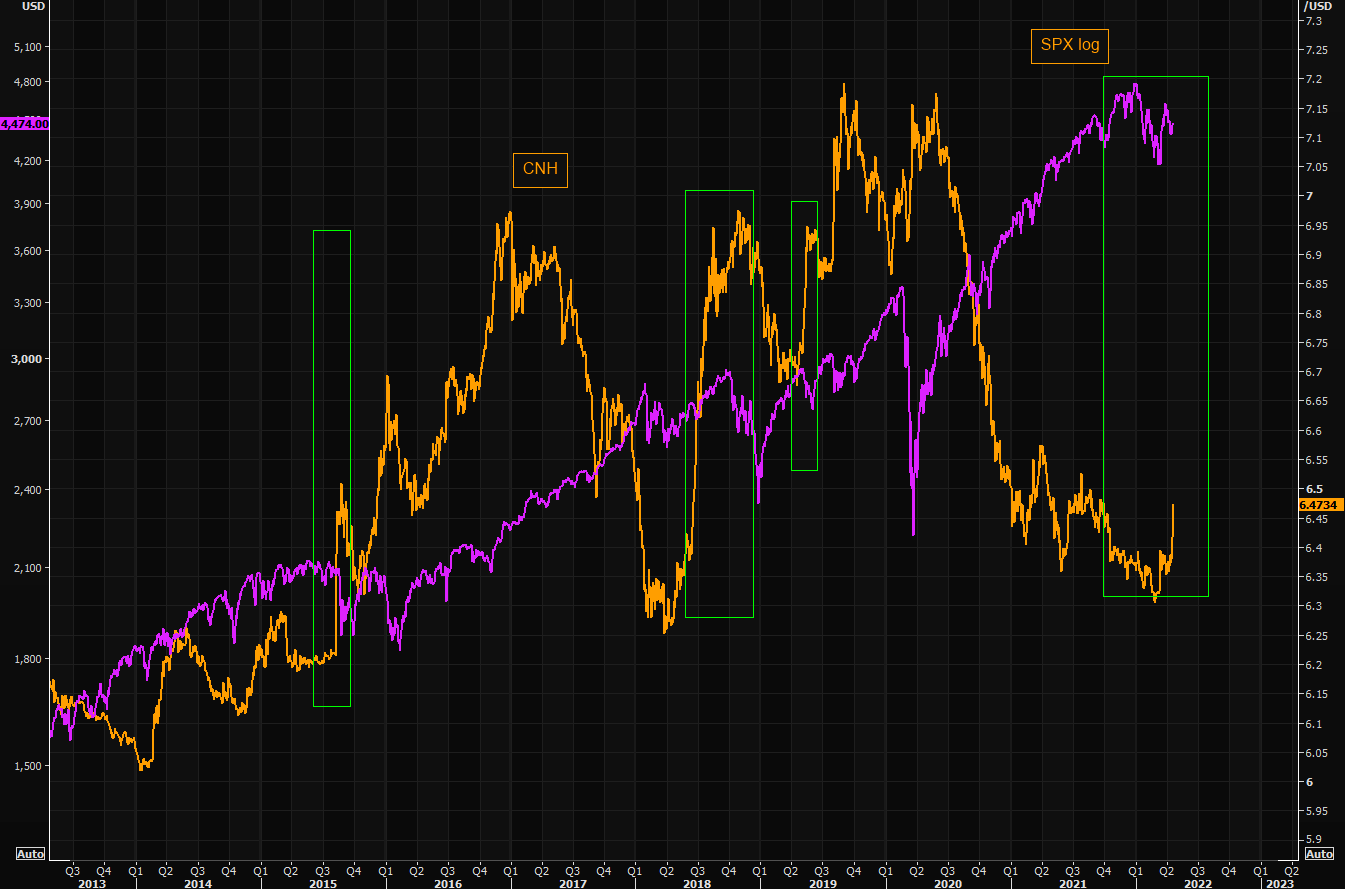
As an aside, adding to earlier comments on the yuan’s fall, Bob Parker, a senior adviser at Credit Suisse Group AG (NYSE: CS) explains that “When Chinese investors lose confidence in their own economy/markets, capital outflows from China accelerate, … [and] this, then, leads to a central bank which has to prop up the currency by selling some of the country’s huge reserve piles.” 

“Part of their reserves will have been/are in U.S. equities so as the reserves fall, they are natural sellers of the S&P.”

Graphic: Via Refinitiv. Taken from The Market Ear. CNH versus SPX.

Positioning: In a comparison of options positioning and passive buying support, the returns distribution is skewed positive and points to building support for a potential short-term bounce.

Graphic: Via Physik Invest. Data via SqueezeMetrics.

The most recent liquidation resulted in participants reaching for protection and this exacerbated movement to the downside amidst the reflexive hedging.

As this short-dated exposure decays, the counterparts’ hedges are to be tapered and this may assist in the market hammering out a bottom or rallying. 

On the contrary, however, as SpotGamma explained in a recent note, “[t]op of mind as we head into new trade on Monday is the likelihood traders will not aggressively sell volatility (i.e., if they sell volatility -> that drives volatility lower -> resulting in hedging flows that support the market) until the FOMC (5/4) and/or some resolution on the geopolitical front.”

“Therefore, [] expect larger trading ranges this upcoming week.”

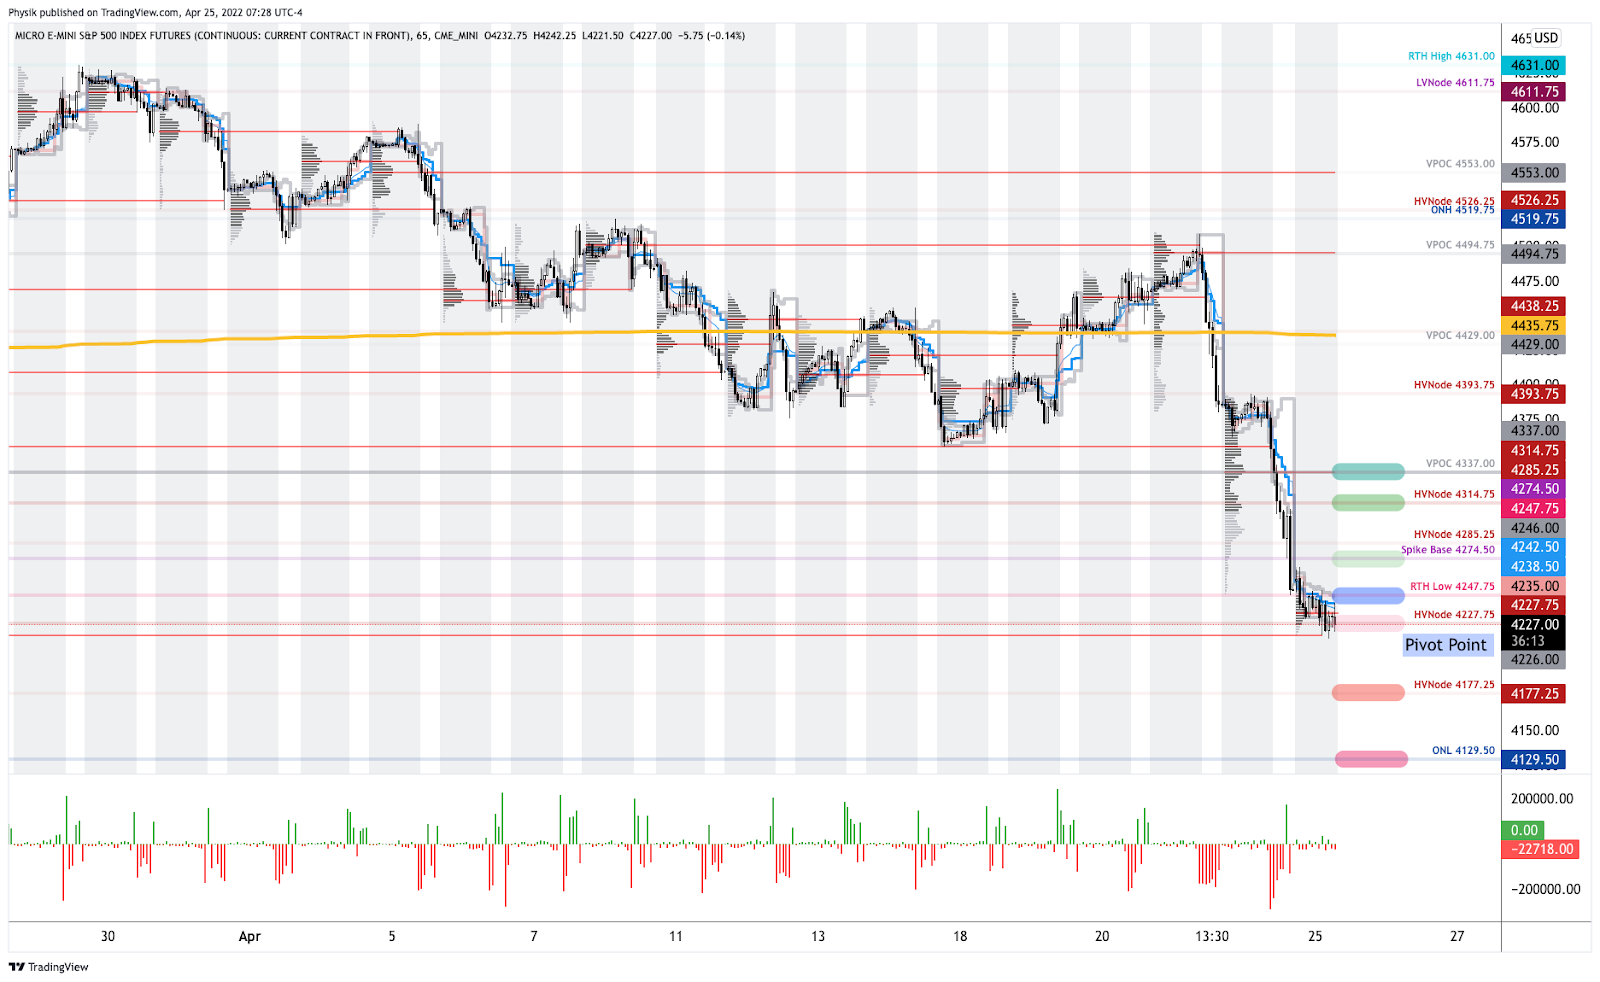
Technical: As of 6:30 AM ET, Monday’s regular session (9:30 AM – 4:00 PM ET), in the S&P 500, will likely open in the lower part of a negatively skewed overnight inventory, outside of prior-range and -value, suggesting a potential for immediate directional opportunity.

In the best case, the S&P 500 trades higher; activity above the $4,247.75 regular trade low (RTH Low) puts in play the $4,274.50 spike base. Initiative trade beyond the spike base could reach as high as the $4,314.75 high volume area (HVNode) and $4,337.00 untested point of control (VPOC), or higher.

In the worst case, the S&P 500 trades lower; activity below the $4,247.75 RTH Low puts in play the $4,227.75 HVNode. Initiative trade beyond the $4,227.75 HVNode could reach as low as the $4,177.25 HVNode and $4,129.50 overnight low (ONL), or lower.

Considerations: Spikes mark the beginning of a break from value. Spikes higher (lower) are validated by trade at or above (below) the spike base (i.e., the origin of the spike).

In a spike up (down) situation, trade below (above) the spike base, negates the buying (selling).

Click here to load today’s key levels into the web-based TradingView charting platform. Note that all levels are derived using the 65-minute timeframe. New links are produced, daily.
Graphic: 65-minute profile chart of the Micro E-mini S&P 500 Futures.

What People Are Saying

Definitions

Overnight Rally Highs (Lows): Typically, there is a low historical probability associated with overnight rally-highs (lows) ending the upside (downside) discovery process.

Volume Areas: A structurally sound market will build on areas of high volume (HVNodes). Should the market trend for long periods of time, it will lack sound structure, identified as low volume areas (LVNodes). LVNodes denote directional conviction and ought to offer support on any test. 

If participants were to auction and find acceptance into areas of prior low volume (LVNodes), then future discovery ought to be volatile and quick as participants look to HVNodes for favorable entry or exit.

POCs: POCs are valuable as they denote areas where two-sided trade was most prevalent in a prior day session. Participants will respond to future tests of value as they offer favorable entry and exit.

About

After years of self-education, strategy development, mentorship, and trial-and-error, Renato Leonard Capelj began trading full-time and founded Physik Invest to detail his methods, research, and performance in the markets.

Capelj also develops insights around impactful options market dynamics at SpotGamma and is a Benzinga reporter.

Some of his works include conversations with ARK Invest’s Catherine Wood, investors Kevin O’Leary and John Chambers, FTX’s Sam Bankman-Fried, Kai Volatility’s Cem Karsan, The Ambrus Group’s Kris Sidial, among many others.

Disclaimer

In no way should the materials herein be construed as advice. Derivatives carry a substantial risk of loss. All content is for informational purposes only.
Categories
Commentary

Daily Brief For April 11, 2022

Hey team, you’re going to have to forgive me. Still am traveling through the rest of this month. Therefore, coverage will remain sporadic and less in-depth. Apologies and take care!

What Happened

Overnight, equity index futures were mixed after last week’s liquidation alongside news that the Federal Reserve was interested in sharper interest-rate hikes and balance-sheet reductions to stem inflation. 

China equities were weak on the implications of COVID-19 outbreaks, among other things. 

Some Russian entities entered into effective default, as ruled by markets. The conflict between Russia and Ukraine, that spurred crippling economic sanctions, is ongoing. 

And, in other news, some Bitcoin (CRYPTO: BTC) pundits suggest weakness in risk assets, like technology, may bring down cryptocurrency. 

Crypto prices “do not trade on the fundamentals of being peer-to-peer, decentralized, censorship-resistant digital networks designed for the transfer of money,” explained BitMEX founder Arthur Hayes on correlations with the Nasdaq 100 trading at record highs. 

Crypto “will lead equities lower as we head into the downturn, and lead equities higher as we work our way out of it.”

Ahead is data on NY Fed median 1- and 3-year expected inflation (11:00 AM ET). Fed-speak by Charles Evans (12:40 PM ET). The quarterly earnings season begins this week. Bank stocks to start reporting Wednesday, April 13.

Graphic updated 6:45 AM ET. Sentiment Risk-Off if expected /ES open is below the prior day’s range. /ES levels are derived from the profile graphic at the bottom of the following section. Levels may have changed since initially quoted; click here for the latest levels. SqueezeMetrics Dark Pool Index (DIX) and Gamma (GEX) calculations are based on where the prior day’s reading falls with respect to the MAX and MIN of all occurrences available. A higher DIX is bullish. At the same time, the lower the GEX, the more (expected) volatility. Learn the implications of volatility, direction, and moneyness. SHIFT data used for S&P 500 (INDEX: SPX) options activity. Note that options flow is sorted by the call premium spent; if more positive, then more was spent on call options. Breadth reflects a reading of the prior day’s NYSE Advance/Decline indicator. VIX reflects a current reading of the CBOE Volatility Index (INDEX: VIX) from 0-100.

What To Expect

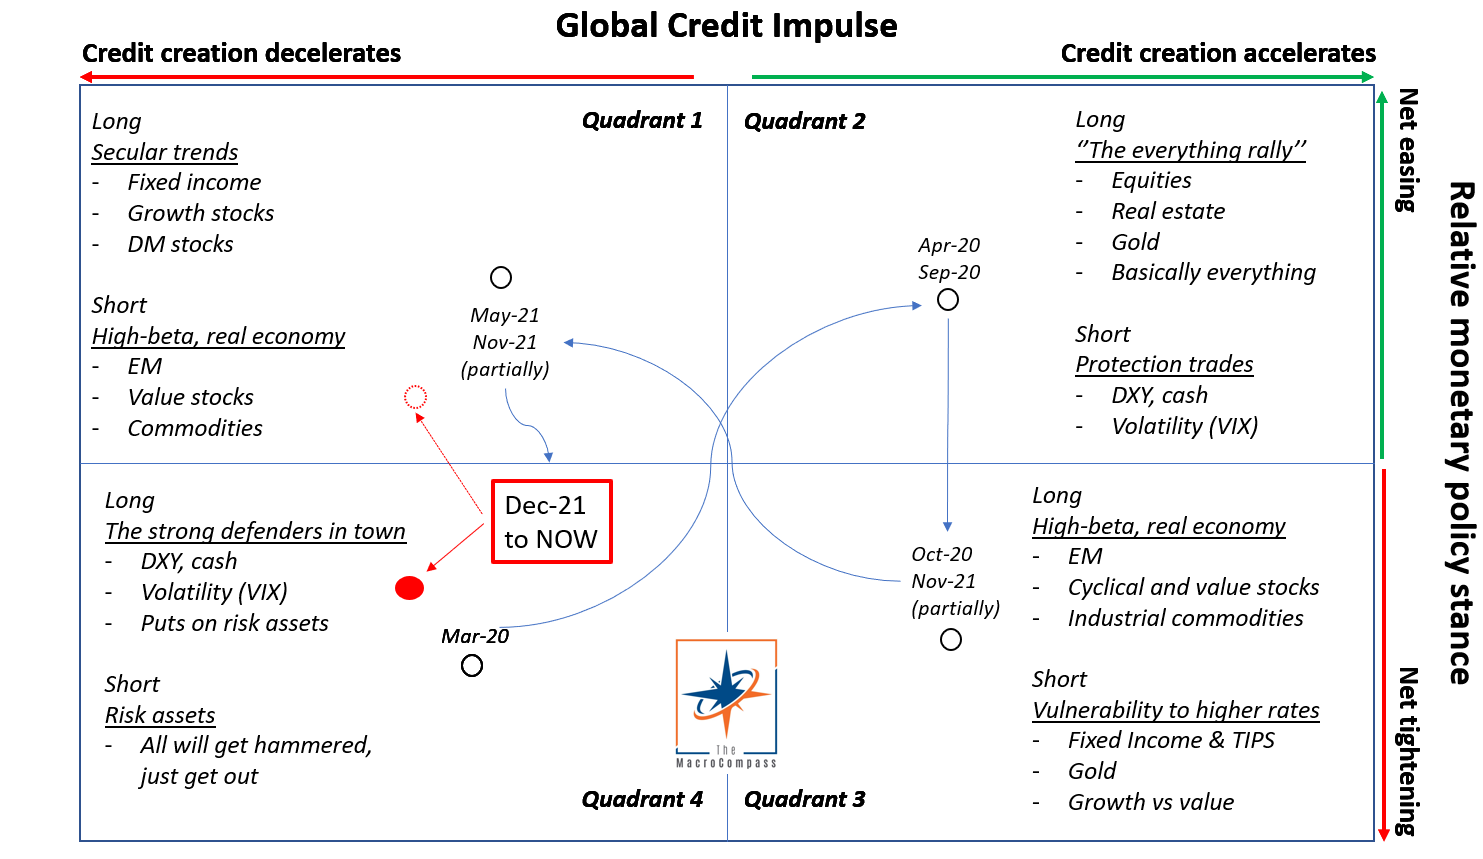
Fundamental: The ruling narrative, so to speak, is concerned with the management of inflation through monetary policies, credit impulse contractions, as well as the implications of Russia’s invasion of Ukraine, China’s COVID-19 actions, and beyond.

Graphic: Via The Macro Compass.

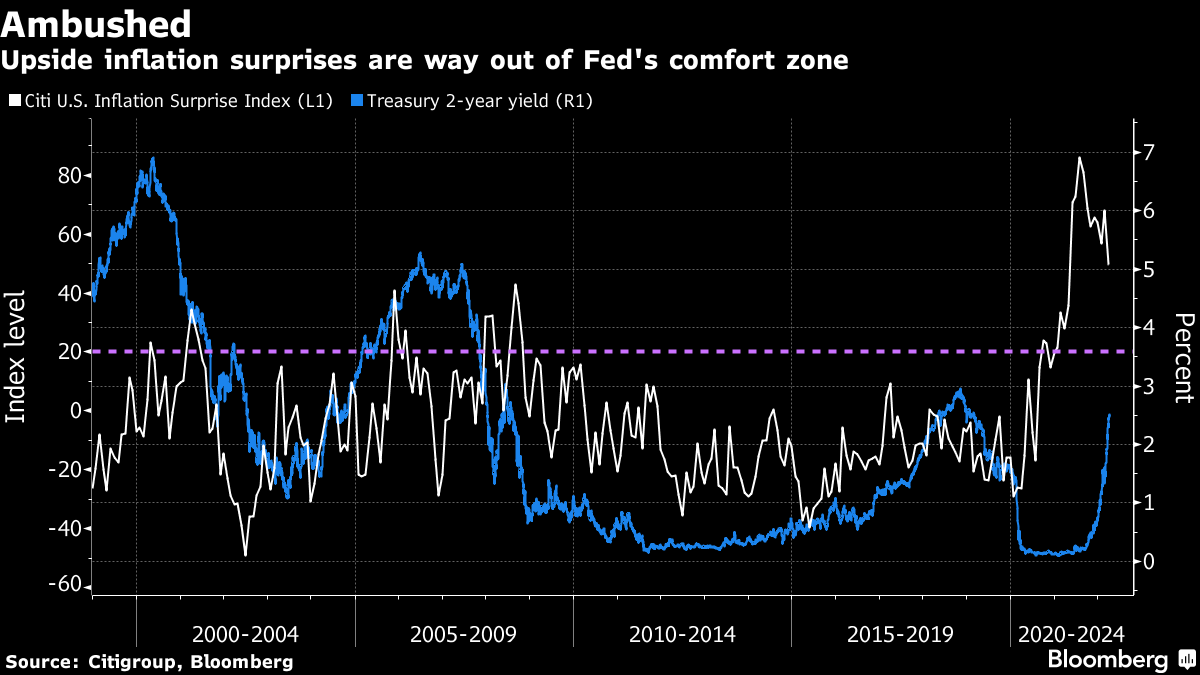
The Federal Reserve’s (Fed) roadmap for shrinking the balance sheet and raising rates was revealed in the recent release of Federal Open Market Committee (FOMC) minutes. 

“The FOMC stayed far too easy for far too long and has belatedly realized their mistake,” said Stephen Stanley, chief economist at Amherst Pierpont Securities LLC. 

“They are now scrambling to get policy back to neutral as quickly as they can. Once they arrive at something close to neutral, they will have to ascertain over time how far into restrictive territory they have to move to get inflation back under control.”

Graphic: Via Bloomberg.

Moreover, as talked about in past commentaries, quantitative tightening (QT) amplifies the impact of rate hikes.

Per statements by JH Investment Management, through QT, central banks remove assets from their balance sheet. This is “either through the sale of assets they purchased or deciding against reinvesting the principal sum of maturing securities.” 

With that, we note that when bonds rise in value, their yields decline; “when the Fed embarks on bond-buying program[s] to support the U.S. economy, … [it nudges] the prices of these assets higher while pushing yields lower, which also has the effect of driving yield-hungry investors into relatively riskier asset categories that promise high returns.”

As liquidity is removed, this may prompt risk assets to converge with fundamentals.

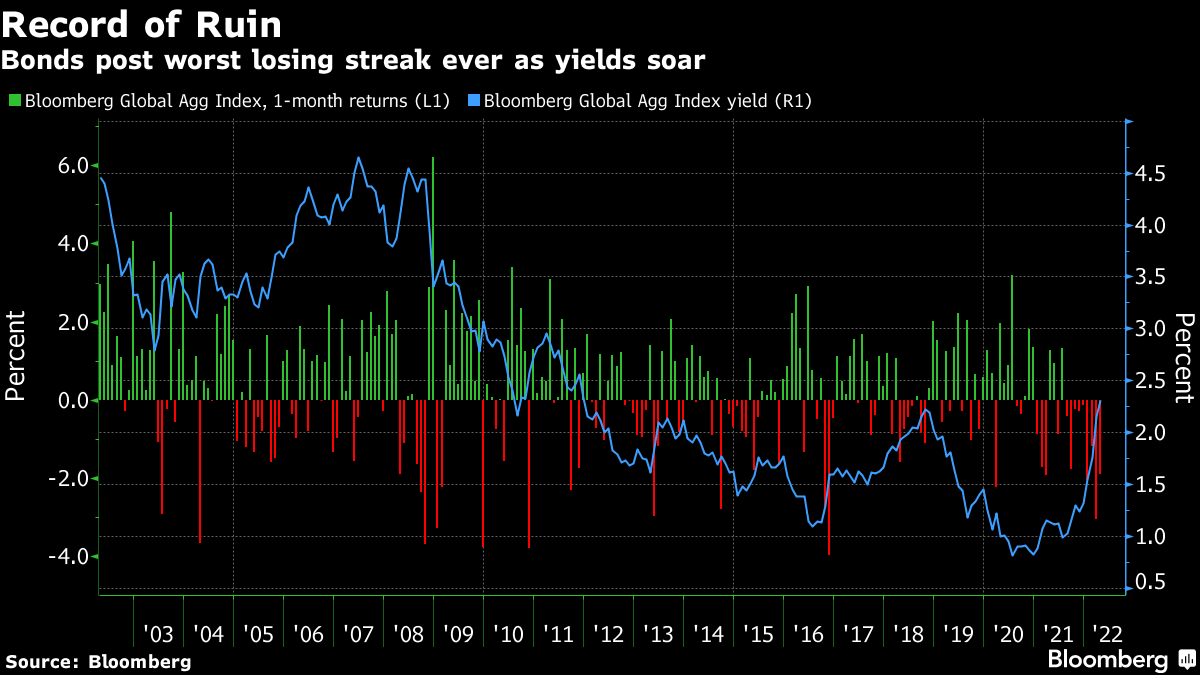
Graphic: Via Bloomberg. Bonds continue their losing streak. This is amid end-of-quarter rebalancing inflows; “Bonds performed so poorly in the past month that exchange-traded fund investors were forced to buy in record amounts.”

At present, via CME Group Inc’s (NASDAQ: CME) FedWatch tool, participants are pricing in a heightened probability of a half-point hike next month.

Graphic: Via CME Group Inc. FedWatch tool.

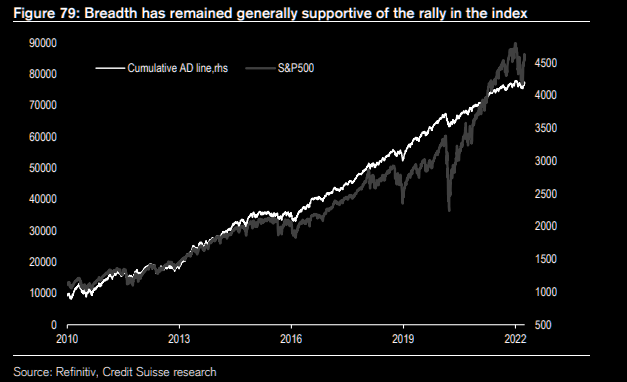
Notwithstanding, per Credit Suisse Group AG (NYSE: CS) research, there has been no meaningful breadth disconnect; breadth remains supportive of higher S&P 500 prices.

Via: Credit Suisse research. Taken from The Market Ear.

At the same time, JPMorgan Chase & Co’s (NYSE: JPM) Mislav Matejka sees continued gains in earnings while equity versus credit and bond yields are still supportive of valuations.

Positioning: Keeping this section light, today.

After quarterly rebalances and options expiries, the reduction in counterparty exposure to positive gamma freed indexes (i.e., unpinned), as expected

Why? 

We see counterparties as those participants who take the other side of customer trades. The collapse in realized volatility and the move higher in equity markets solicited counterparties’ decreased (increased) hedging of put (call) options. 

The naive assumption is that counterparties are short (long) put (call) protection. When implied volatility declines and underlyings move higher, counterparties have less (more) exposure to amplified losses (gains). 

To hedge, they sell into strength and buy into weakness, basically.

As participants start to concentrate their bets in shorter-dated expiries, at higher prices, counterparties take from underlying movement in their provision of liquidity. It takes an options expiry, or some exogenous event, to disrupt this balance. 

That happened at the end of last month. Since then, increases in implied volatility and lower underlying equity prices have helped pressure indexes and increase realized volatility.

Technical: As of 6:45 AM ET, Monday’s regular session (9:30 AM – 4:00 PM ET), in the S&P 500, will likely open in the middle part of a negatively skewed overnight inventory, outside of prior-range and -value, suggesting a potential for immediate directional opportunity.

In the best case, the S&P 500 trades higher; activity above the $4,468.75 poor low puts in play the $4,489.75 low volume area (LVNode). Initiative trade beyond the LVNode could reach as high as the $4,501.00 VPOC and $4,519.75 overnight high (ONH), or higher.

In the worst case, the S&P 500 trades lower; activity below the $4,468.75 poor low puts in play the $4,444.50 weak low. Initiative trade beyond the weak low could reach as low as the $4,409.00 VPOC and $4,395.25 high volume area (HVNode), or lower.

Considerations: Gaps ought to fill quickly. Should they not, that’s a signal of strength; do not fade. Leaving value behind on a gap-fill or failing to fill a gap (i.e., remaining outside of the prior session’s range) is a go-with indicator.

Auctioning and spending at least 1-hour of trade back in the prior range suggests a lack of conviction; in such a case, do not follow the direction of the most recent initiative activity.

Click here to load today’s key levels into the web-based TradingView charting platform. Note that all levels are derived using the 65-minute timeframe. New links are produced, daily.
Graphic: 65-minute profile chart of the Micro E-mini S&P 500 Futures.

Definitions

Overnight Rally Highs (Lows): Typically, there is a low historical probability associated with overnight rally-highs (lows) ending the upside (downside) discovery process.

Volume Areas: A structurally sound market will build on areas of high volume (HVNodes). Should the market trend for long periods of time, it will lack sound structure, identified as low volume areas (LVNodes). LVNodes denote directional conviction and ought to offer support on any test. 

If participants were to auction and find acceptance into areas of prior low volume (LVNodes), then future discovery ought to be volatile and quick as participants look to HVNodes for favorable entry or exit.

POCs: POCs are valuable as they denote areas where two-sided trade was most prevalent in a prior day session. Participants will respond to future tests of value as they offer favorable entry and exit.

Volume-Weighted Average Prices (VWAPs): A metric highly regarded by chief investment officers, among other participants, for quality of trade. Additionally, liquidity algorithms are benchmarked and programmed to buy and sell around VWAPs.

About

After years of self-education, strategy development, mentorship, and trial-and-error, Renato Leonard Capelj began trading full-time and founded Physik Invest to detail his methods, research, and performance in the markets.

Capelj also develops insights around impactful options market dynamics at SpotGamma and is a Benzinga reporter.

Some of his works include conversations with ARK Invest’s Catherine Wood, investors Kevin O’Leary and John Chambers, FTX’s Sam Bankman-Fried, Kai Volatility’s Cem Karsan, The Ambrus Group’s Kris Sidial, among many others.

Disclaimer

In no way should the materials herein be construed as advice. Derivatives carry a substantial risk of loss. All content is for informational purposes only.
Categories
Commentary

Daily Brief For March 29, 2022

The Daily Brief is a free glimpse into the prevailing fundamental and technical drivers of U.S. equity market products. Join the 200+ that read this report daily, below!

What Happened

Overnight, equity index futures auctioned higher alongside progress in cease-fire talks between Russia and Ukraine.

Geopolitical improvements could play into the Federal Reserve’s (Fed) pivot toward more aggressive, front-loaded interest-rate hikes.

Ahead is data on the Case-Shiller and FHFA national house price indexes (9:00 AM ET), consumer confidence, as well as job opens and quits (10:00 AM ET). 

Later, the Fed’s Patrick Harker speaks at 10:45 AM ET, followed by the Atlanta Fed’s Raphael Bostic (6:30 PM ET).

Graphic updated 6:50 AM ET. Sentiment Risk-On if expected /ES open is above the prior day’s range. /ES levels are derived from the profile graphic at the bottom of the following section. Levels may have changed since initially quoted; click here for the latest levels. SqueezeMetrics Dark Pool Index (DIX) and Gamma (GEX) calculations are based on where the prior day’s reading falls with respect to the MAX and MIN of all occurrences available. A higher DIX is bullish. At the same time, the lower the GEX, the more (expected) volatility. Learn the implications of volatility, direction, and moneyness. SHIFT data used for S&P 500 (INDEX: SPX) options activity. Note that options flow is sorted by the call premium spent; if more positive, then more was spent on call options. Breadth reflects a reading of the prior day’s NYSE Advance/Decline indicator. VIX reflects a current reading of the CBOE Volatility Index (INDEX: VIX) from 0-100.

What To Expect

Fundamental: In Monday’s commentary, we discussed the Fed’s intention to tighten policy and yield curve inversions, the implications of quantitative tightening (QT), and other things.

Graphic: Via Bespoke Investment Group. Taken from Bloomberg. The chart “suggests even more tightening than is currently priced by two-year bonds. Nothing as aggressive as this has been seen since Paul Volcker was Fed chair four decades ago.” 

In a nutshell, the gap between shorter and longer yields is smaller, and, in some cases, the shorter yield is above that of the longer yield––the consequence of suppressed yields lifting, now, after the Fed’s historic bond-buying spree and balance sheet growth over the past years.

Graphic: Via Macrodesiac. “The yield curve looks ‘normal’ at the start of the cycle, then flattens mid-cycle (as central banks hike and short-dated yields catch up to growth), then inverts as economic contraction begins. Usually, longer-dated yields are more stable. Economic growth will expand and contract in the short term. Over time it will average out to around 2% per year in developed economies. Shorter-dated yields are more volatile because they’re sensitive to the current market cycle.” 

As Bloomberg’s John Authers explains, “an inverted yield curve is regarded as an alarm for a central bank — it’s taken as the bond market saying that this can go no further, and makes it hard for the Fed or any other central bank to proceed with a tightening.”

There is the “argument that something will break before the central bank gets [inflation back down to 2%].”

Graphic: Via Andreas Steno Larsen. “Policy real rates are basically [at a] record low.”

Though curve inversions often preceded economic slowings, we pointed to the 5-30 curve, yesterday, specifically, which has provided false positives in the past. 

This time things truly are different as, without the Fed’s QE, the fair value of the 2s10s spread could be in the 150bp-200bp range, according to statements by Richard Bernstein Advisors’ Michael Contopoulos says on the potential for steepening via QT.

“Though the Fed is likely to maintain a sizeable balance sheet, thereby keeping yields relatively anchored versus what would be expected had they never bought bonds, there is clearly scope for yields to increase in the long end over coming quarters. Whether or not this happens with ever-higher 2y yields, time will tell, but for now, we would search for other indicators of recession.”

Graphic: Via @mark_ungewitter. Taken from Callum Thomas. “A tell in terms of the lateness-of-cycle.”

Correlation isn’t causation, Authers ends. Markets are reflections of investor psychology and expectations about the future. 

“Just as the Fed now admits that it has been behind the curve, so investors have also been slow on the uptake, and may now be over-compensating. That suggests that a curve inversion here should be treated with some caution.”

Positioning: Alongside participants’ heavy sale of puts and some call buying, implied volatility metrics compressed markedly, and this bolstered a near-vertical price rise in the equity market.

Graphic: SpotGamma’s Hedging Impact of Real-Time Options (HIRO) indicator shows put selling in the SPY coincides with a reversal attempt.

Heading into the end-of-week large quarterly options expiration, comparing buying and options positioning metrics, the returns distribution is skewed positive.

Graphic: Via Physik Invest. Data via SqueezeMetrics.

However, the skew is nothing like what it was in the weeks prior, before the early March reversal period. Caution new buyers.

Graphic: Via Physik Invest. Data via SqueezeMetrics.

As SpotGamma explains, “All else equal, it’s likely the SPX levels out in the $4,600.00 area over the coming sessions as the factors of time and volatility trend toward zero for highly short-dated options exposure concentrated in the end-of-month expiry,” at those higher prices.

“When the gamma of these options increases, as a result, counterparties add liquidity (i.e., sell [buy] more into strength [weakness] against increasing [decreasing] positive delta exposure).”

Technical: As of 6:30 AM ET, Tuesday’s regular session (9:30 AM – 4:00 PM ET), in the S&P 500, will likely open in the upper part of a positively skewed overnight inventory, outside of prior-range and -value, suggesting a potential for immediate directional opportunity.

Gap Scenarios: Gaps ought to fill quickly. Should they not, that’s a signal of strength; do not fade. Leaving value behind on a gap-fill or failing to fill a gap (i.e., remaining outside of the prior session’s range) is a go-with indicator.

Auctioning and spending at least 1-hour of trade back in the prior range suggests a lack of conviction; in such a case, do not follow the direction of the most recent initiative activity.

In the best case, the S&P 500 trades higher; activity above the $4,592.75 overnight high (ONH) puts in play the $4,611.75 low volume area (LVNode). Initiative trade beyond the LVNode could reach as high as the $4,618.75 and $4,631.75 high volume area (HVNode), or higher.

In the worst case, the S&P 500 trades lower; activity below the $4,592.75 ONH puts in play the $4,574.25 HVNode. Initiative trade beyond the HVNode could reach as low as the $4,546.00 spike base and $4,533.00 untested point of control (VPOC), or lower.

Click here to load today’s key levels into the web-based TradingView charting platform. Note that all levels are derived using the 65-minute timeframe. New links are produced, daily.
Graphic: 65-minute profile chart of the Micro E-mini S&P 500 Futures.

Definitions

Spikes: Spike’s mark the beginning of a break from value. Spikes higher (lower) are validated by trade at or above (below) the spike base (i.e., the origin of the spike).

Overnight Rally Highs (Lows): Typically, there is a low historical probability associated with overnight rally-highs (lows) ending the upside (downside) discovery process.

Volume Areas: A structurally sound market will build on areas of high volume (HVNodes). Should the market trend for long periods of time, it will lack sound structure, identified as low volume areas (LVNodes). LVNodes denote directional conviction and ought to offer support on any test. 

If participants were to auction and find acceptance into areas of prior low volume (LVNodes), then future discovery ought to be volatile and quick as participants look to HVNodes for favorable entry or exit.

POCs: POCs are valuable as they denote areas where two-sided trade was most prevalent in a prior day session. Participants will respond to future tests of value as they offer favorable entry and exit.

About

After years of self-education, strategy development, mentorship, and trial-and-error, Renato Leonard Capelj began trading full-time and founded Physik Invest to detail his methods, research, and performance in the markets.

Capelj also develops insights around impactful options market dynamics at SpotGamma and is a Benzinga reporter.

Some of his works include conversations with ARK Invest’s Catherine Wood, investors Kevin O’Leary and John Chambers, FTX’s Sam Bankman-Fried, Kai Volatility’s Cem Karsan, The Ambrus Group’s Kris Sidial, among many others.

Disclaimer

In no way should the materials herein be construed as advice. Derivatives carry a substantial risk of loss. All content is for informational purposes only.
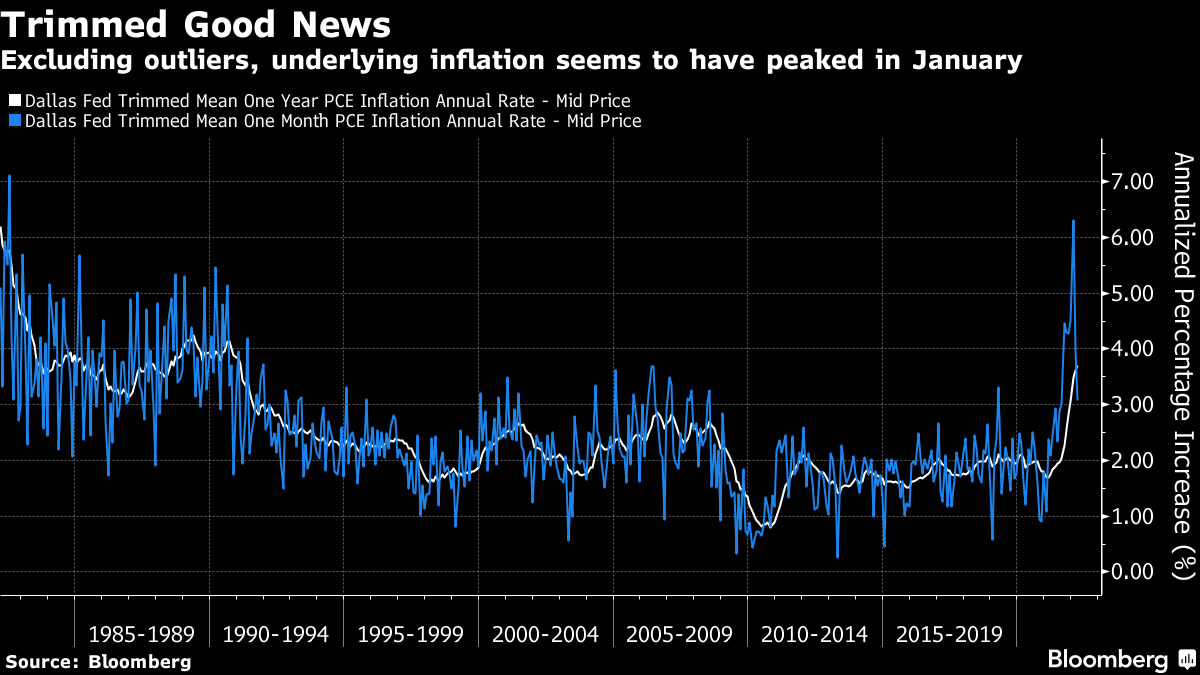
Categories
Commentary

Daily Brief For March 28, 2022

The Daily Brief is a free glimpse into the prevailing fundamental and technical drivers of U.S. equity market products. Join the 200+ that read this report daily, below!

What Happened

Overnight, equity index futures diverged during participants’ attempt to discover higher prices.

Commodities were mixed while bonds extended their slump; central bank authorities, in an effort to rein in inflation amid rising prices, are focused on implementing tighter monetary policies.

For a moment, the (5-30) Treasury curve dropped below zero for the first time since 2006. This is after the Federal Reserve’s (Fed) Jerome Powell said last week the central bank was committed to upping borrowing costs and would hike by 50 basis points if needed.

Graphic updated 6:40 AM ET. Sentiment Neutral if expected /ES open is inside of the prior day’s range. /ES levels are derived from the profile graphic at the bottom of the following section. Levels may have changed since initially quoted; click here for the latest levels. SqueezeMetrics Dark Pool Index (DIX) and Gamma (GEX) calculations are based on where the prior day’s reading falls with respect to the MAX and MIN of all occurrences available. A higher DIX is bullish. At the same time, the lower the GEX, the more (expected) volatility. Learn the implications of volatility, direction, and moneyness. SHIFT data used for S&P 500 (INDEX: SPX) options activity. Note that options flow is sorted by the call premium spent; if more positive, then more was spent on call options. Breadth reflects a reading of the prior day’s NYSE Advance/Decline indicator. VIX reflects a current reading of the CBOE Volatility Index (INDEX: VIX) from 0-100.

What To Expect

Fundamental: Keeping it short, today. 

Last week, we discussed monetary policy and the impact of quantitative tightening (QT) in the face of revisions in global growth expectations. You can check that out, here.

Graphic: Via Goldman Sachs Group Inc (NYSE: GS). Taken from The Market Ear. “GS has significantly lowered our 2022 global growth forecast in recent weeks. The chart shows global 2022 real GDP growth, % change.”

On the belief that the “Fed hiking cycle and balance sheet drain are now priced” as the market enters a seasonally favorable period, strategists like JPMorgan Chase & Co’s (NYSE: JPM) Marko Kolanovic favor risk in high-beta.

“While the commodity supercycle will persist,” Kolanovic said, “the correction in bubble sectors is now likely finished, and geopolitical risk will likely start abating in a few weeks’ time (while a comprehensive resolution may take a few months).”

Graphic: Via Callum Thomas. “April is historically the best month (highest average monthly gain and 74% of all Aprils in history were positive).”

Complicating Kolanovic’s outlook is uncertainty with respect to the Fed’s decision to hike and pare asset holdings as financial conditions tighten.

Graphic: Via Stenos Signals. “On top of already tight financial conditions, the spill-overs from a weakening credit cycle remain mostly unseen. If usual correlations hold, then a contracting credit cycle will lead long bond yields LOWER and not higher during H2-2022.”

In the coming weeks, the thesis that a de-rate (or pricing in of uncertainties) has played out will be put to the test as the Fed reveals its template for QT. Final plans are likely to be unveiled in an announcement at the beginning of May.

Damped Spring Advisors’ Andy Constan explains well his perspectives on what comes next in the below video. Check it out.

Positioning: The CBOE Volatility Index (INDEX: VIX), a measure of participants’ demand for protection, so to speak, appears to have hit a lower bound around 20.00. This is as the VIX term structure steepened, dramatically, over the last weeks, particularly at the front end of the curve.

Graphic: Via Vix Central.

After a long period during which options market participants concentrated their activity on bets on lower prices (negative delta trades that payout in case of movement lower), markets jolted higher as that protection was monetized (and decay ensued).

Alongside this collapse in implied volatility was speculative demand in index heavy-weights like Tesla Inc (NASDAQ: TSLA). Participants bought stock while selling puts (bets on the downside) and buying calls (bets on the upside).

Graphic: SpotGamma’s Hedging Impact of Real-Time Options (HIRO) indicator for TSLA as shown in our March 23, 2022 newsletter. The rising orange line denotes call buying. The rising blue line denotes put selling.

As this speculative demand cools, counterparties to these levered bets on the upside unwind their hedges and this has the effect of pressuring attempts higher.

According to SpotGamma, this is as, heading into this week’s expiration of quarterly options, there’s a “potential for more ‘pinning’ action as close-to-the-money bets concentrated in that expiry near the end of their lifecycle.” You can learn more about this, here.

Why? As time and volatility trend toward zero, the rate of change of options delta (gamma) of near-the-money options increases.

“This happens because the range of spot prices across which option deltas shift from near-zero to near-100% becomes very narrow as options approach maturity (and at maturity, options on one side of the settlement value have zero delta and the other side have 100% delta).”

With, at least at the index level, bets on lower volatility dominating (put and call selling), as the gamma of these near-the-money options increases, counterparties add liquidity, buying (selling) into weakness (strength) as positive delta exposure falls (rises).

Graphic: Analysis of book depth for the E-mini S&P 500 futures contract, via CME Group Inc’s (NASDAQ: CME) Liquidity Tool. For more on the implications of participants’ options positioning and dealer hedging, read here.

Moreover, the odds point to sideways trade, rather than a fast move higher or lower. 

However, after this expiry, it’s likely that the market succumbs to underlying forces. At present, despite the S&P 500 and its peers trading higher, underlying breadth is collapsing.

Graphic: Via Jefferies Financial Group Inc (NYSE: JEF). Taken from The Market Ear. “While the SPX is up over 8% since the lows, the equal-weight version of the index is down nearly 3% relative, its steepest relative decline so far this year. Typically, this would make us uneasy too, but the market narrowed considerably from June to Dec last year, so this might be attributable to a tech bounce from lows.”

Technical: As of 6:40 AM ET, Monday’s regular session (9:30 AM – 4:00 PM ET), in the S&P 500, will likely open in the upper part of a balanced overnight inventory, inside of prior-range and -value, suggesting a limited potential for immediate directional opportunity.

In the best case, the S&P 500 trades higher; activity above the $4,535.25 low volume area (LVNode) puts in play the $4,548.75 LVNode. Initiative trade beyond the $4,548.75 LVNode could reach as high as the $4,565.00 untested point of control (VPOC) and $4,585.00 regular trade high (RTH High), or higher.

In the worst case, the S&P 500 trades lower; activity below the $4,535.25 LVNode puts in play the $4,515.25 LVNode. Initiative trade beyond the $4,515.25 LVNode could reach as low as the $4,489.75 LVNode and $4,469.00 VPOC, or lower.

Click here to load today’s key levels into the web-based TradingView charting platform. Note that all levels are derived using the 65-minute timeframe. New links are produced, daily.
Graphic: 65-minute profile chart of the Micro E-mini S&P 500 Futures.

What People Are Saying

Definitions

Volume Areas: A structurally sound market will build on areas of high volume (HVNodes). Should the market trend for long periods of time, it will lack sound structure, identified as low volume areas (LVNodes). LVNodes denote directional conviction and ought to offer support on any test. 

If participants were to auction and find acceptance into areas of prior low volume (LVNodes), then future discovery ought to be volatile and quick as participants look to HVNodes for favorable entry or exit.

POCs: POCs are valuable as they denote areas where two-sided trade was most prevalent in a prior day session. Participants will respond to future tests of value as they offer favorable entry and exit.

Balance (Two-Timeframe Or Bracket): Rotational trade that denotes current prices offer favorable entry and exit. Balance areas make it easy to spot a change in the market (i.e., the transition from two-time frame trade, or balance, to one-time frame trade, or trend). 

About

After years of self-education, strategy development, mentorship, and trial-and-error, Renato Leonard Capelj began trading full-time and founded Physik Invest to detail his methods, research, and performance in the markets.

Capelj also develops insights around impactful options market dynamics at SpotGamma and is a Benzinga reporter.

Some of his works include conversations with ARK Invest’s Catherine Wood, investors Kevin O’Leary and John Chambers, FTX’s Sam Bankman-Fried, Kai Volatility’s Cem Karsan, The Ambrus Group’s Kris Sidial, among many others.

Disclaimer

In no way should the materials herein be construed as advice. Derivatives carry a substantial risk of loss. All content is for informational purposes only.
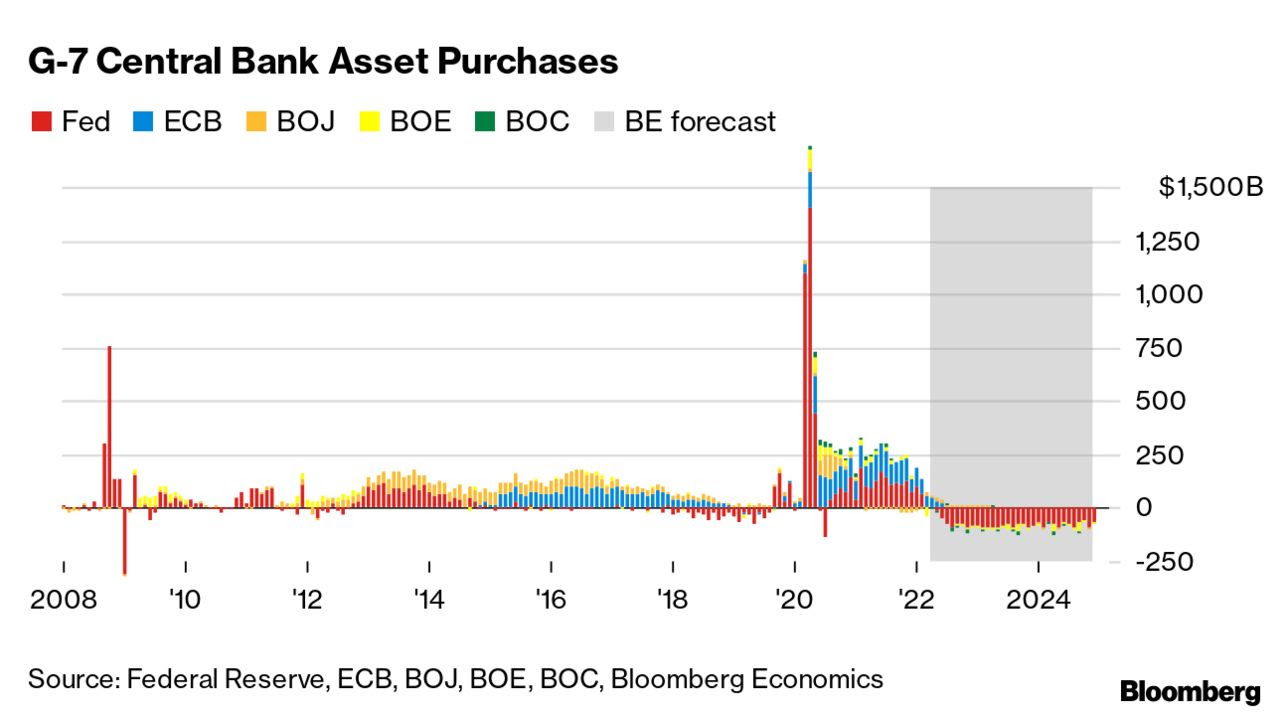
Categories
Commentary

Daily Brief For March 22, 2022

Editor’s Note: The Daily Brief is a free glimpse into the prevailing fundamental and technical drivers of U.S. equity market products. Join the 200+ that read this report daily, below!

What Happened

Overnight, equity index futures were sideways to higher, and this validates higher prices, more. 

This is as implied volatility metrics – such as the Cboe Volatility Index (INDEX: VIX) – continue to suggest less demand for protection and a potential easing of concern.

As discussed in detail, yesterday, participants are not committing themselves to increased call option (i.e., insurance for shorts or bets on the upside) exposures, a dynamic usually seen at the start of sustained reversals. 

Given this, as well as institutional selling in spite of underinvestment (watch a chat), and the Federal Reserve’s (Fed) commitment to reining in inflation via “aggressive” monetary policy (i.e., hike and taper asset purchases) action, there is concern over the sustainability of this rally.

Ahead is Fed-speak. The New York Fed’s John Williams speaks at 10:35 AM ET. San Francisco Fed’s Mary Daly talks at 2:00 PM ET. The Cleveland Fed’s Loretta Mester talks at 5:00 PM ET.

Graphic updated 6:30 AM ET. Sentiment Neutral if expected /ES open is inside of the prior day’s range. /ES levels are derived from the profile graphic at the bottom of the following section. Levels may have changed since initially quoted; click here for the latest levels. SqueezeMetrics Dark Pool Index (DIX) and Gamma (GEX) calculations are based on where the prior day’s reading falls with respect to the MAX and MIN of all occurrences available. A higher DIX is bullish. At the same time, the lower the GEX, the more (expected) volatility. Learn the implications of volatility, direction, and moneyness. SHIFT data used for S&P 500 (INDEX: SPX) options activity. Note that options flow is sorted by the call premium spent; if more positive, then more was spent on call options. Breadth reflects a reading of the prior day’s NYSE Advance/Decline indicator. VIX reflects a current reading of the CBOE Volatility Index (INDEX: VIX) from 0-100.
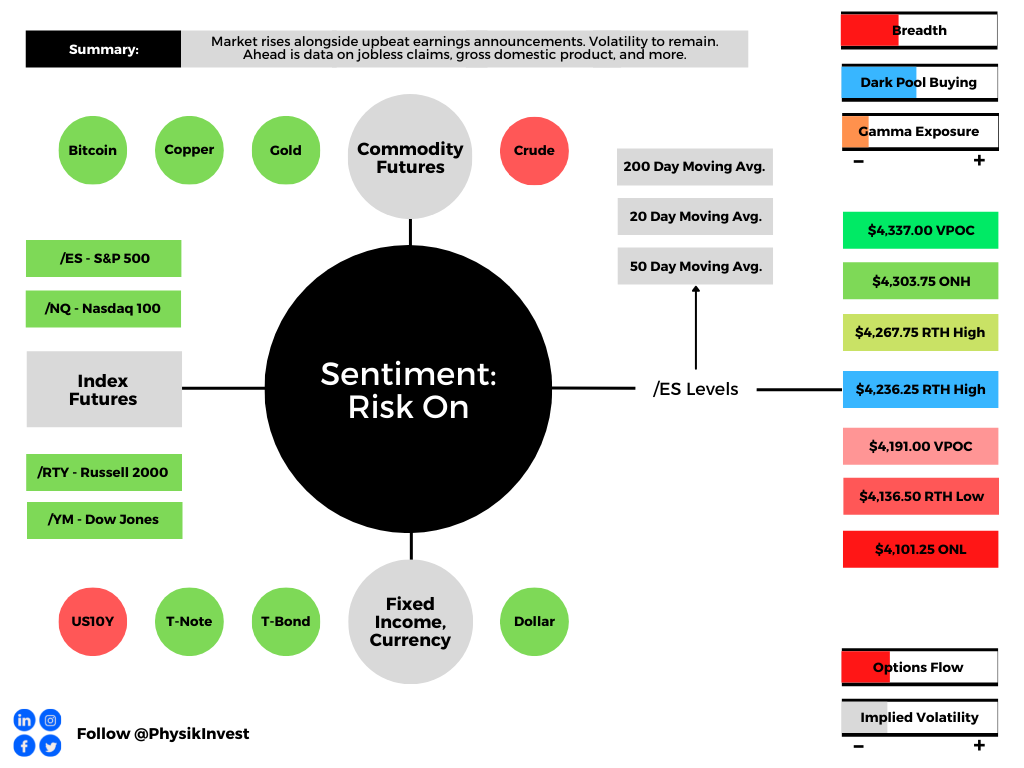
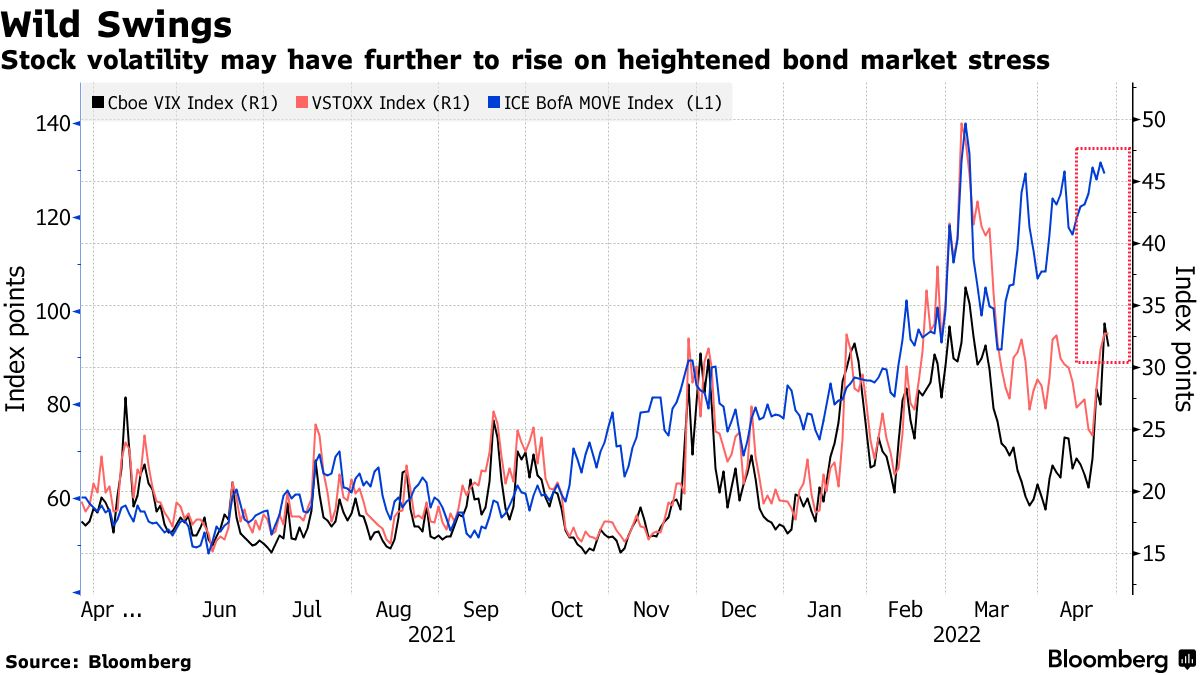
What To Expect

Fundamental: Based on remarks by the Fed’s Jerome Powell, quantitative tightening (QT) will move at a pace of $1 trillion a year. This is a faster pace than that of the prior QT.

Read yesterday’s commentary for more on QE and QT.

According to Joseph Wang’s detailed discussion on the implications of QT, the “[a]nticipation of QT is already widening the spread between Agency MBS and Treasuries but does not yet appear to affect Treasury prices.”

“The supply and demand dynamics suggest that the market may simply be slow to react. In that case, Treasury prices will also have to adjust downward, maybe by a lot.”

Pursuant to that remark, Damped Spring’s Andy Constan explains that quantitative easing (QE), “which decreased risk premiums and increased wealth was inflationary to assets but ineffective in generating inflation of goods and services.”

Essentially, QT is not a good tool to fight inflation.

“Raising rates is the strong tool to fight inflation for the Fed and decreasing the budget deficit growth is the tool for Fiscal policymakers; … the [Fed] will do both QT to reduce the balance sheet and hike rates to fight inflation.”

Moreover, higher bond yields (lower bond prices) are usually not good for stocks. The question is whether participants want to take on the added risk of investing at high valuations?

Graphic: Via S&P Global Inc (NYSE: SPGI). Markets tend not, necessarily, to perform poorly during rising interest rate environments. 

The QT narrative amplifies the impact of rate hikes

Lisa Shalett, CIO at Morgan Stanley (NYSE: MS) Wealth Management, discussed recently QT at $80 billion per month (and $500 billion in balance sheet reduction through year-end), as well as how the added risks are to be compensated through lower price-to-earnings multiples in the stock market.

“In tightening terms, that’s the equivalent of another 25-basis-point hike,” Shalett explained. “In contrast, balance sheet run-off totaled $700 billion from 2017 through 2019 before the Fed stopped because markets seized and stocks sold off.”

Graphic: Via Index Indicators. Breadth, here, is measured by the % of SPX stocks above the 50-day average.

Positioning: As discussed before, a feature of falling markets is the demand for protection. 

When this protection is monetized (or decay ensues), options counterparties add to the market liquidity (i.e., buying back short futures hedges).

Graphic: Via CME Group Inc (NYSE: CME). Book depth thickens since early March swing low.

A feature of markets entering a sustainable recovery is the demand for call options.

Based on metrics published by SpotGamma, call-buying was near its lows.

Graphic: Via SpotGamma. “Plots show the premium per trade aggregated each week, with calls in blue and puts in orange. This is only customer flow (i.e. retail, hedge funds). Starting with equities, call buying this past week was at LOWS going back to 2020 (top right).”

Looking at intraday measures, yesterday, we see that participants’ commitment to a change in direction remains low, still.

Graphic: SpotGamma’s Hedging Impact of Real-Time Options trade. The rising blue line denotes put selling (a positive delta impact). The falling orange line denotes call selling (a negative delta impact).

It’s possible that the bottoming process has yet to conclude. Instead, a build of positive options gamma (via the supply of protection – call selling – and more active hedging of call options near the money) may give the market some support.

To explain, in accordance with the HIRO graphic above, we surmise counterparties are long calls and therefore tend toward selling into strength (buying into weakness) amid increasing (decreasing) positive delta exposure.

As short-dated activity clusters in the area just north of the most recent price rise, and this protection decays, dealer exposure to positive delta (gamma) falls (rises).”

“Taken together, dealers add to the market liquidity. When there is rising liquidity, volatility (a measure of how ample liquidity is) falls,” SpotGamma adds. 

“Was the SPX to liquidate, again, demand for protection and increases in volatility likely have us targeting options-based support.”

Graphic: Via SpotGamma. Key levels of interest.

In other words, based on the information we have at the moment, the market is prone to sharp drops lower, and the rally is questionable. Caution.

Technical: As of 6:30 AM ET, Tuesday’s regular session (9:30 AM – 4:00 PM ET), in the S&P 500, will likely open in the upper part of a positively skewed overnight inventory, inside of prior-range and -value, suggesting a limited potential for immediate directional opportunity.

In the best case, the S&P 500 trades higher; activity above the $4,464.75 low volume area (LVNode) puts in play the $4,499.00 untested point of control (VPOC). Initiative trade beyond the VPOC could reach as high as the $4,526.25 high volume area (HVNode) and $4,565.00 VPOC, or higher.

In the worst case, the S&P 500 trades lower; activity below the $4,464.75 LVNode puts in play the $4,438.25 HVNode. Initiative trade beyond the HVNode could reach as low as the $4,409.00 and $4,355.00 VPOC, or lower.

Considerations: Push-and-pull, as well as responsiveness near key-technical areas (that are discernable visually on a chart), suggests technically-driven traders with short time horizons are very active. 

Such traders often lack the wherewithal to defend retests and, additionally, the type of trade may be indicative of the other time frame participants waiting for more information to initiate trades.

Click here to load today’s key levels into the web-based TradingView charting platform. Note that all levels are derived using the 65-minute timeframe. New links are produced, daily.
Graphic: 65-minute profile chart of the Micro E-mini S&P 500 Futures.

Definitions

Cave-Fill Process: Widened the area deemed favorable to transact at by an increased share of participants. This is a good development.

Volume Areas: A structurally sound market will build on areas of high volume (HVNodes). Should the market trend for long periods of time, it will lack sound structure, identified as low volume areas (LVNodes). LVNodes denote directional conviction and ought to offer support on any test. 

If participants were to auction and find acceptance into areas of prior low volume (LVNodes), then future discovery ought to be volatile and quick as participants look to HVNodes for favorable entry or exit.

Liquidation Breaks: The profile shape suggests participants were “too” long and had poor location.

POCs: POCs are valuable as they denote areas where two-sided trade was most prevalent in a prior day session. Participants will respond to future tests of value as they offer favorable entry and exit.

Excess: A proper end to price discovery; the market travels too far while advertising prices. Responsive, other-timeframe (OTF) participants aggressively enter the market, leaving tails or gaps which denote unfair prices.

About

After years of self-education, strategy development, mentorship, and trial-and-error, Renato Leonard Capelj began trading full-time and founded Physik Invest to detail his methods, research, and performance in the markets.

Capelj also develops insights around impactful options market dynamics at SpotGamma and is a Benzinga reporter.

Some of his works include conversations with ARK Invest’s Catherine Wood, investors Kevin O’Leary and John Chambers, FTX’s Sam Bankman-Fried, Kai Volatility’s Cem Karsan, The Ambrus Group’s Kris Sidial, among many others.

Disclaimer

In no way should the materials herein be construed as advice. Derivatives carry a substantial risk of loss. All content is for informational purposes only.