Categories
Commentary

Daily Brief For April 28, 2022

The Daily Brief is a free glimpse into the prevailing fundamental and technical drivers of U.S. equity market products. Join the 200+ that read this report daily, below!

What Happened

Overnight, equity index futures auctioned sideways-to-higher alongside some upbeat earnings announcements.

Meta Platforms Inc (NASDAQ: FB) surged post-market, yesterday, after its main social network Facebook added more users than expected. 

PayPal Holdings Inc (NYSE: PYPL) vowed to rein in costs and boost profits while Qualcomm Inc (NASDAQ: QCOM) rose on an upbeat forecast.

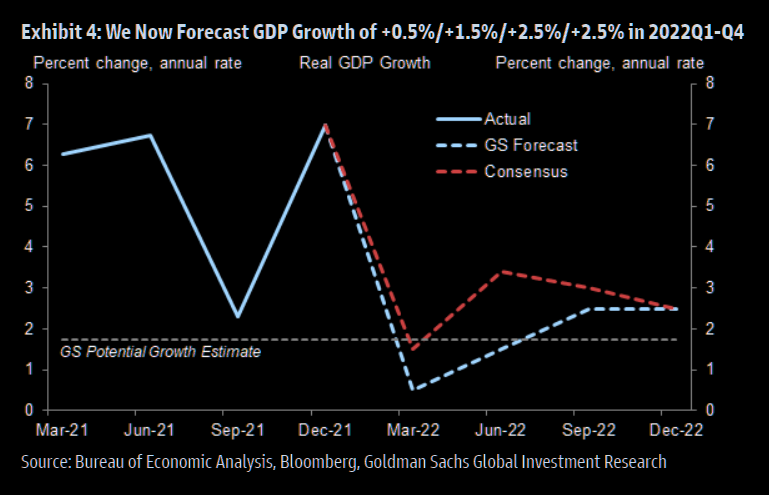
There’s a strong push-and-pull between what’s good and bad. File Deutsche Bank’s (NYSE: DB) recent comments on a pending recession under what’s bad.

The bank sees the Fed Target Rate reaching up to 6% which “will push the economy into a significant recession by late next year.”

Graphic updated 7:00 AM ET. Sentiment Risk-On if expected /ES open is above the prior day’s range. Sentiment Risk-Off if expected /ES open is below the prior day’s range. /ES levels are derived from the profile graphic at the bottom of the following section. Levels may have changed since initially quoted; click here for the latest levels. SqueezeMetrics Dark Pool Index (DIX) and Gamma (GEX) calculations are based on where the prior day’s reading falls with respect to the MAX and MIN of all occurrences available. A higher DIX is bullish. At the same time, the lower the GEX, the more (expected) volatility. Learn the implications of volatility, direction, and moneyness. SHIFT data used for S&P 500 (INDEX: SPX) options activity. Note that options flow is sorted by the call premium spent; if more positive, then more was spent on call options. Breadth reflects a reading of the prior day’s NYSE Advance/Decline indicator. VIX reflects a current reading of the CBOE Volatility Index (INDEX: VIX) from 0-100.

What To Expect

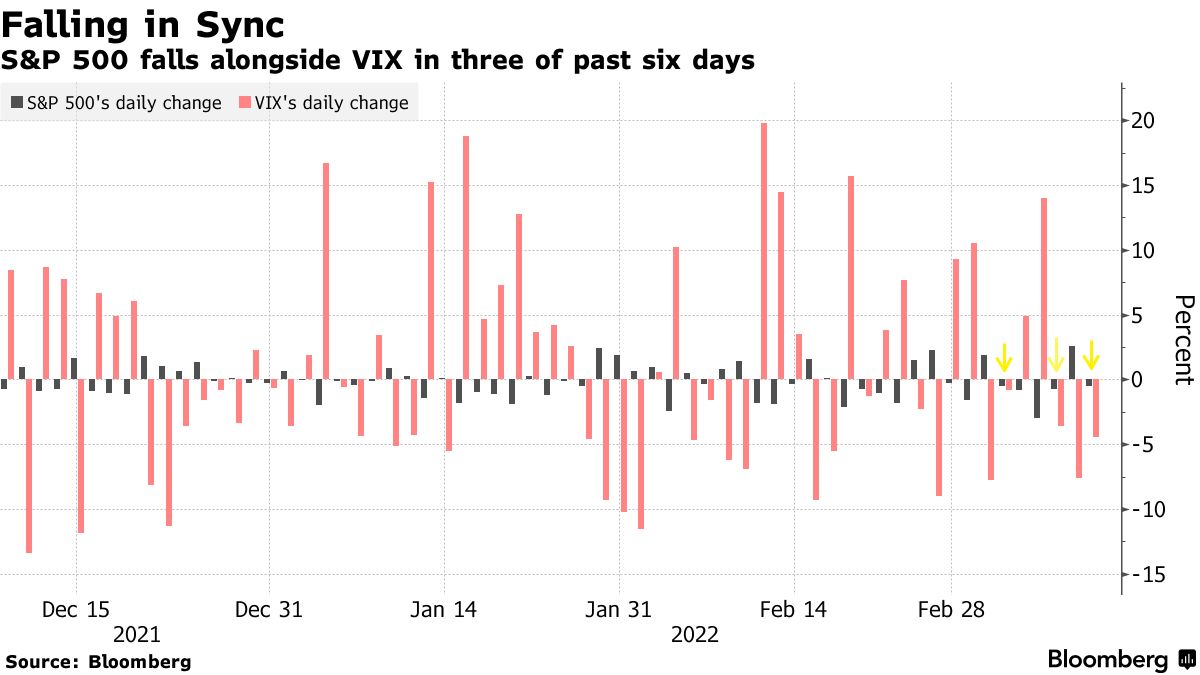
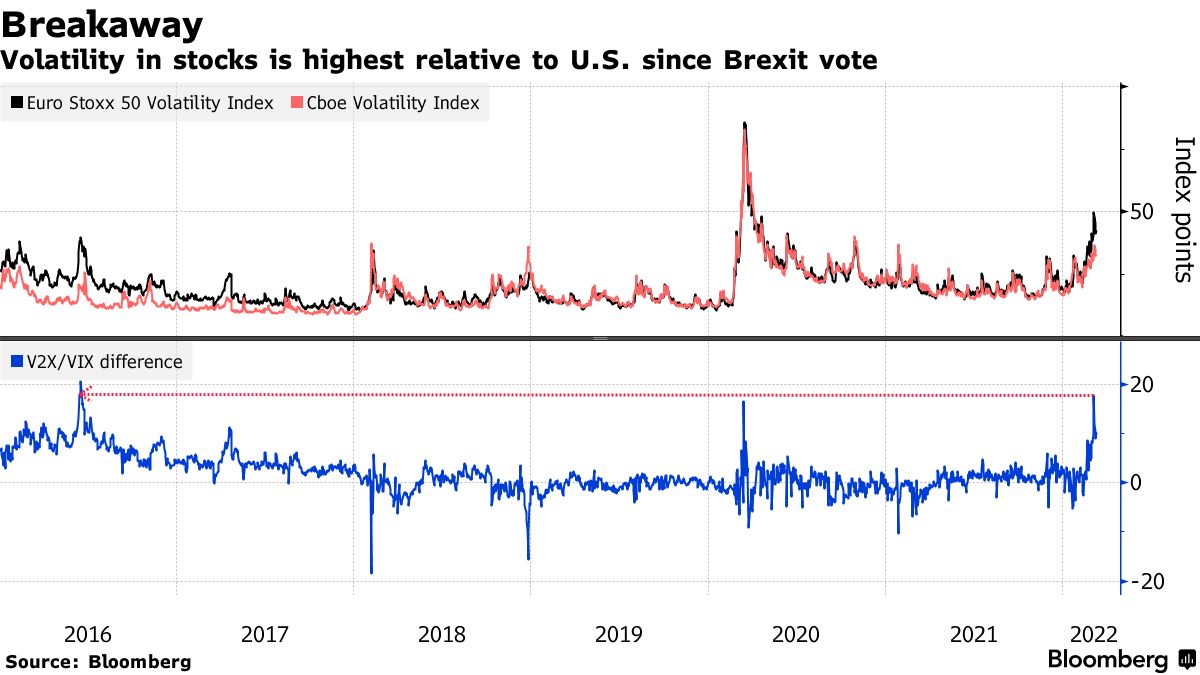
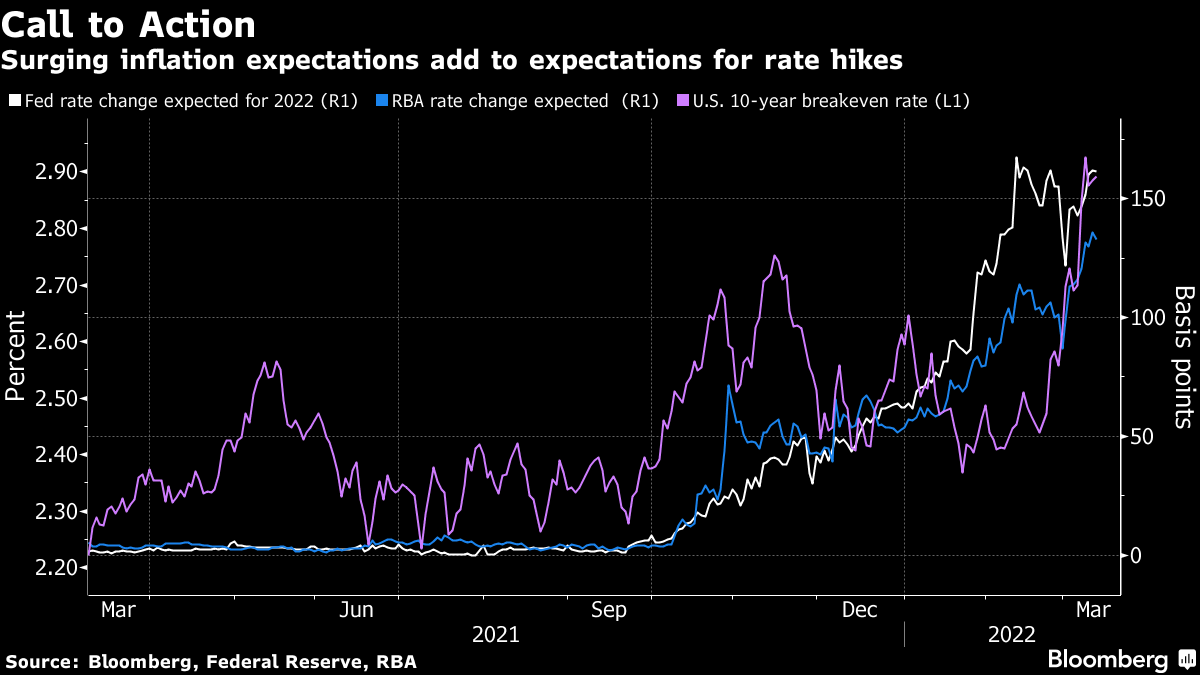
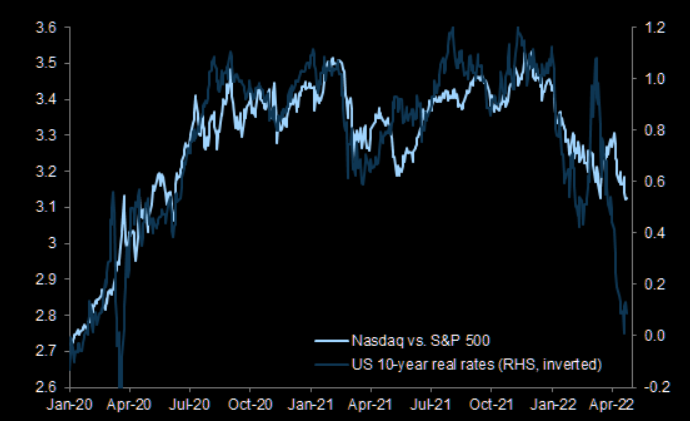
Fundamental: Divergences across different assets and markets continue.

For instance, the equity market’s pricing of risk which we can take as being reflected by the CBOE Volatility Index [INDEX: VIX]) is not moving lock-step with that of measures elsewhere.

Graphic: Via Bloomberg.

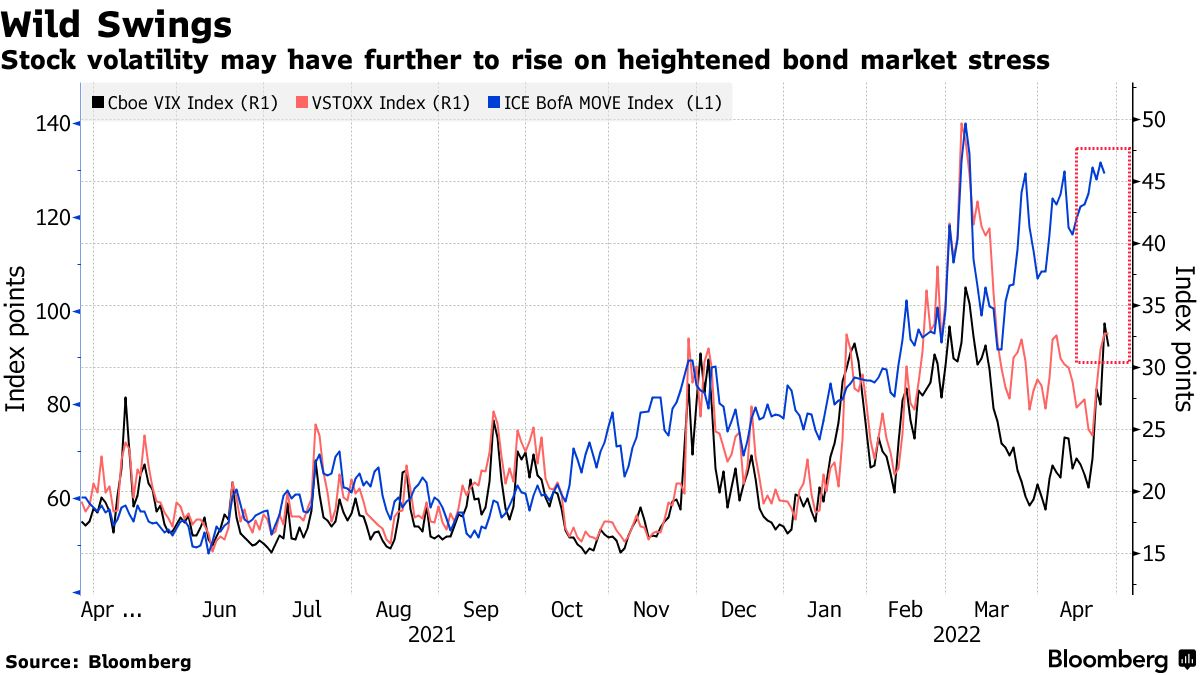
The fear in one market tends to spread to others. Regardless of the cause, it seems that equity and bond market participants are not on the same page.

Is that really true, though? Not necessarily. 

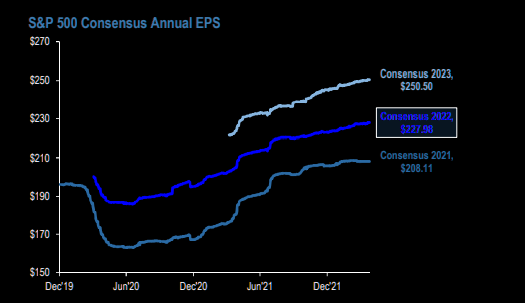
If we look at some single stocks, Netflix Inc (NASDAQ: NFLX), among others (all the while S&P 500 earnings have been revised up) has suffered through a substantial de-rate and volatility as participants priced the implications of policy evolution, slower economic growth, and beyond.

Graphic: Via JPMorgan Chase & Co (NYSE: JPM). Taken from The Market Ear.

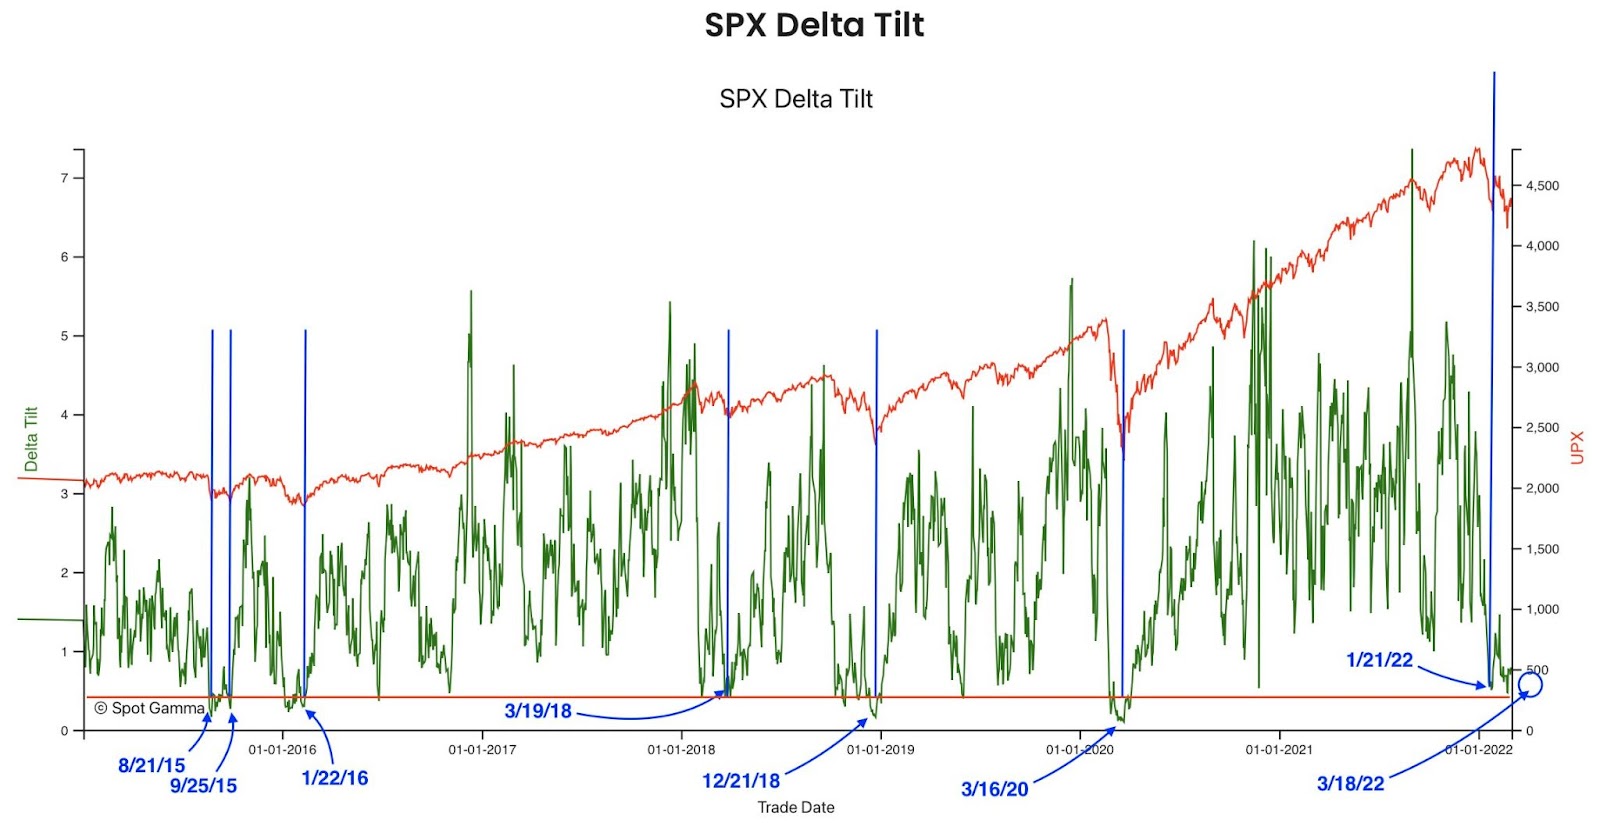
That has us returning to pinning at the index level, relative to what the constituents are doing.

As well explained in Physik Invest’s March 3, 2022 commentary, this is more so a function of positioning and structural flows, or supply of liquidity.

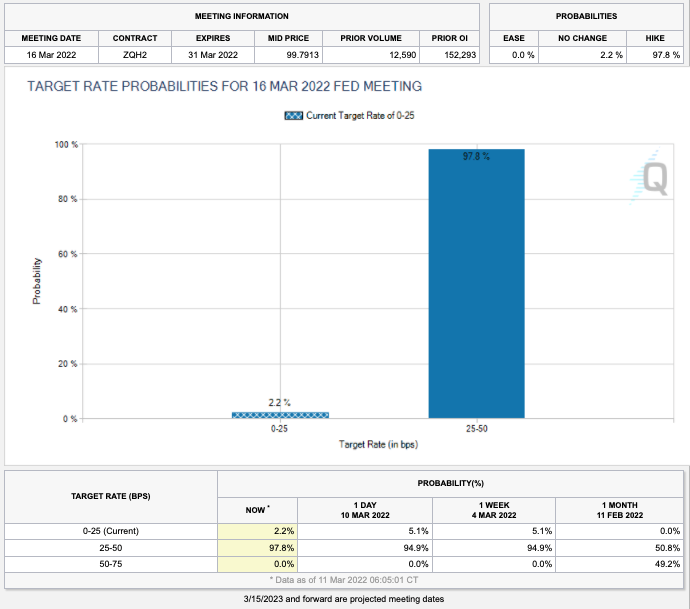
Absent some exogenous event, participants are well-hedged for what is known (e.g., rate hikes and quantitative tightening (QT), COVID resurgences, Russia and Ukraine, among other things).

The caveat is that the Federal Reserve is far more aggressive than expected, ramping up QT, “a direct flow of capital to capital markets or flow out of,” per Kai Volatility’s Cem Karsan. 

For context, it is the intention to take from the max liquidity (which pushed participants out of the risk curve and promoted a divergence from fundamentals) markets were supplied with, and this has the effect of removing market excesses, some of which have fed into volatility markets.

In part, some of the QT has been reflected in bond prices, JPMorgan Chase & Co (NYSE: JPM) explains. However, should there be far more aggressive monetary action, as Deutsche research suggests, coupled with a worsening of the geopolitical and/or economic situation abroad (e.g., Russian default), markets are likely to succumb.

“Using the balance sheet as a tightening tool represents a large change in the Fed’s attitude, and IS NOT priced into the market,” MacroTourist’s Kevin Muir adds.

“An increase in the pace of tightening of QT should mean lower stocks, wider credit spreads, and a slight reduction in the need for front-end hikes.”

Graphic: Via Goldman Sachs Group Inc (NYSE: GS). Taken from The Market Ear. The “Nasdaq has underperformed the S&P 500 but by less than what the move in real yields would suggest.”

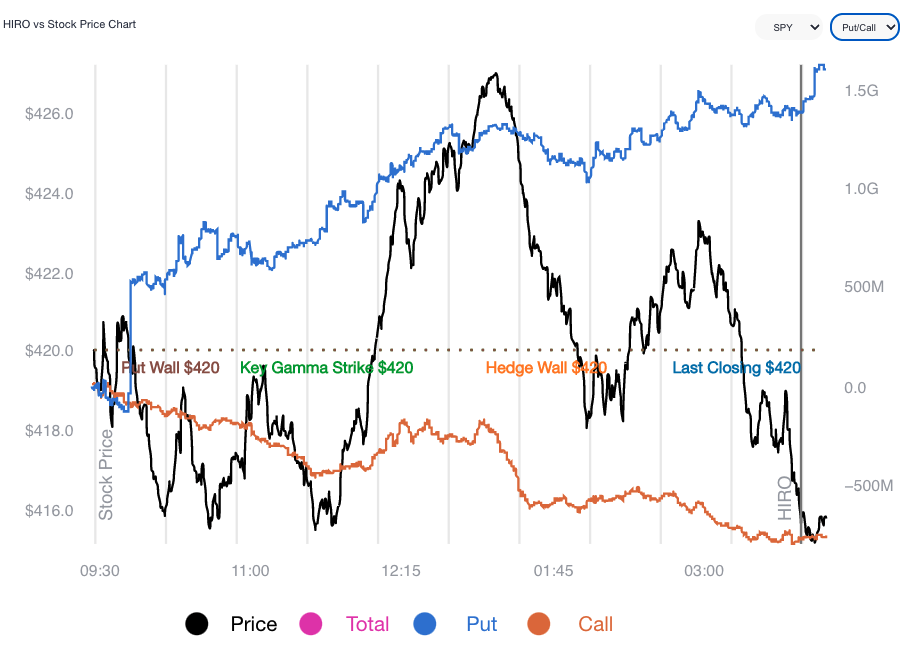
Positioning: Volatility to continue as markets have traded lower and participants have priced up the cost of insurance – particularly at the short-end – on underlying equity exposure.

Graphic: SPX volatility term structure via Refinitiv. Taken from The Market Ear.

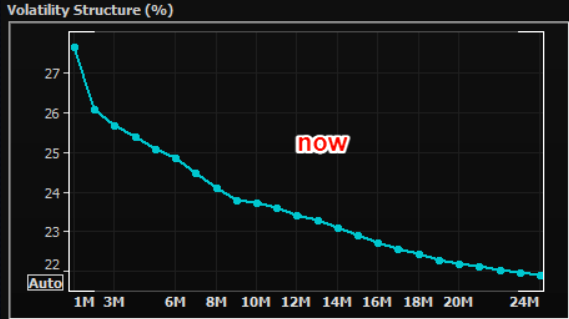
This is due to options delta (exposure to direction) being far more sensitive (gamma) across shorter time horizons (i.e., the range across which options deltas shift from “near-zero to near-100% becomes very narrow.”)

Yesterday, markets were pinned after exploring lower in the days prior. The activity was concentrated in short-dated bets at those levels, and that’s in part a result of some of the hedging that went on.

Graphic: Via SpotGamma’s Hedging Impact of Real-Time Options Indicator.

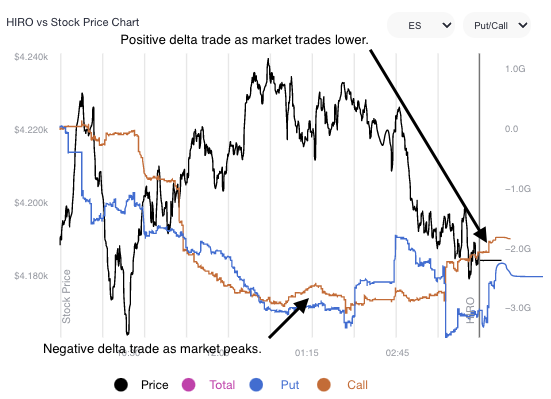
If markets do not perform to the downside (i.e., do not trade lower), those short-dated bets on direction will quickly decay, and hedging flows with respect to time (charm) and volatility (vanna) may bolster sharp rallies.

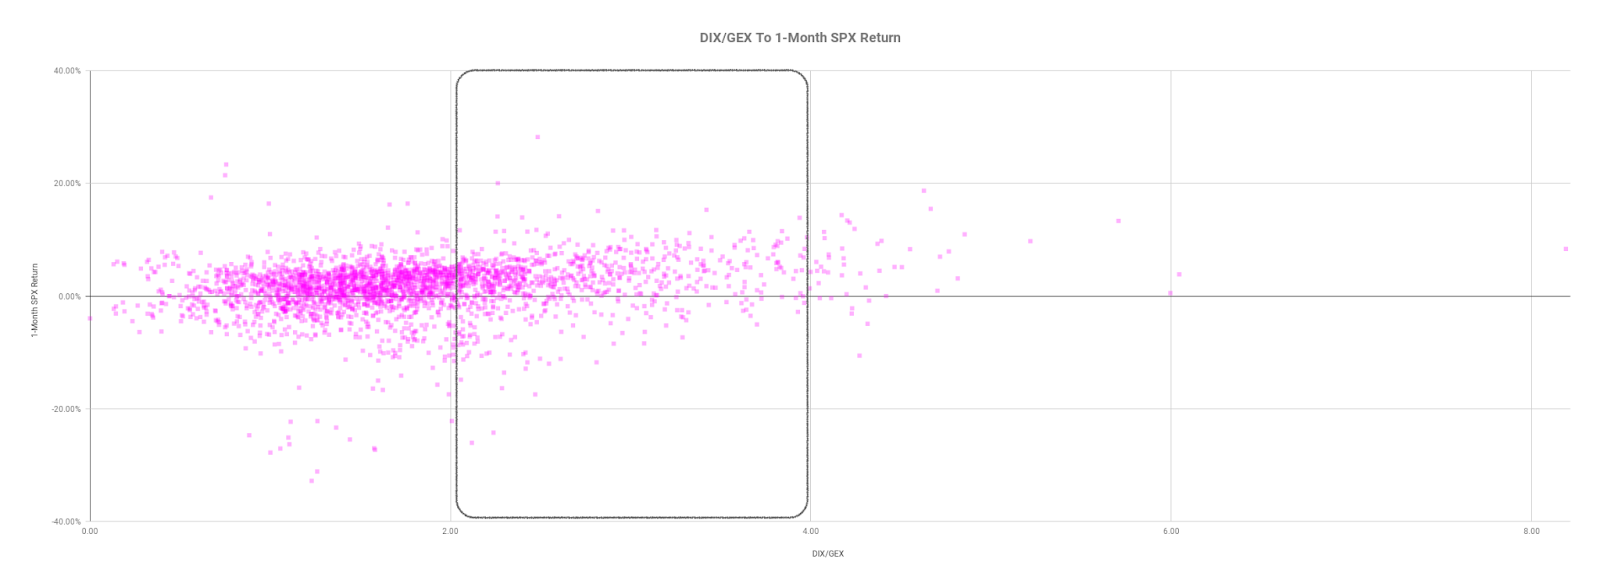
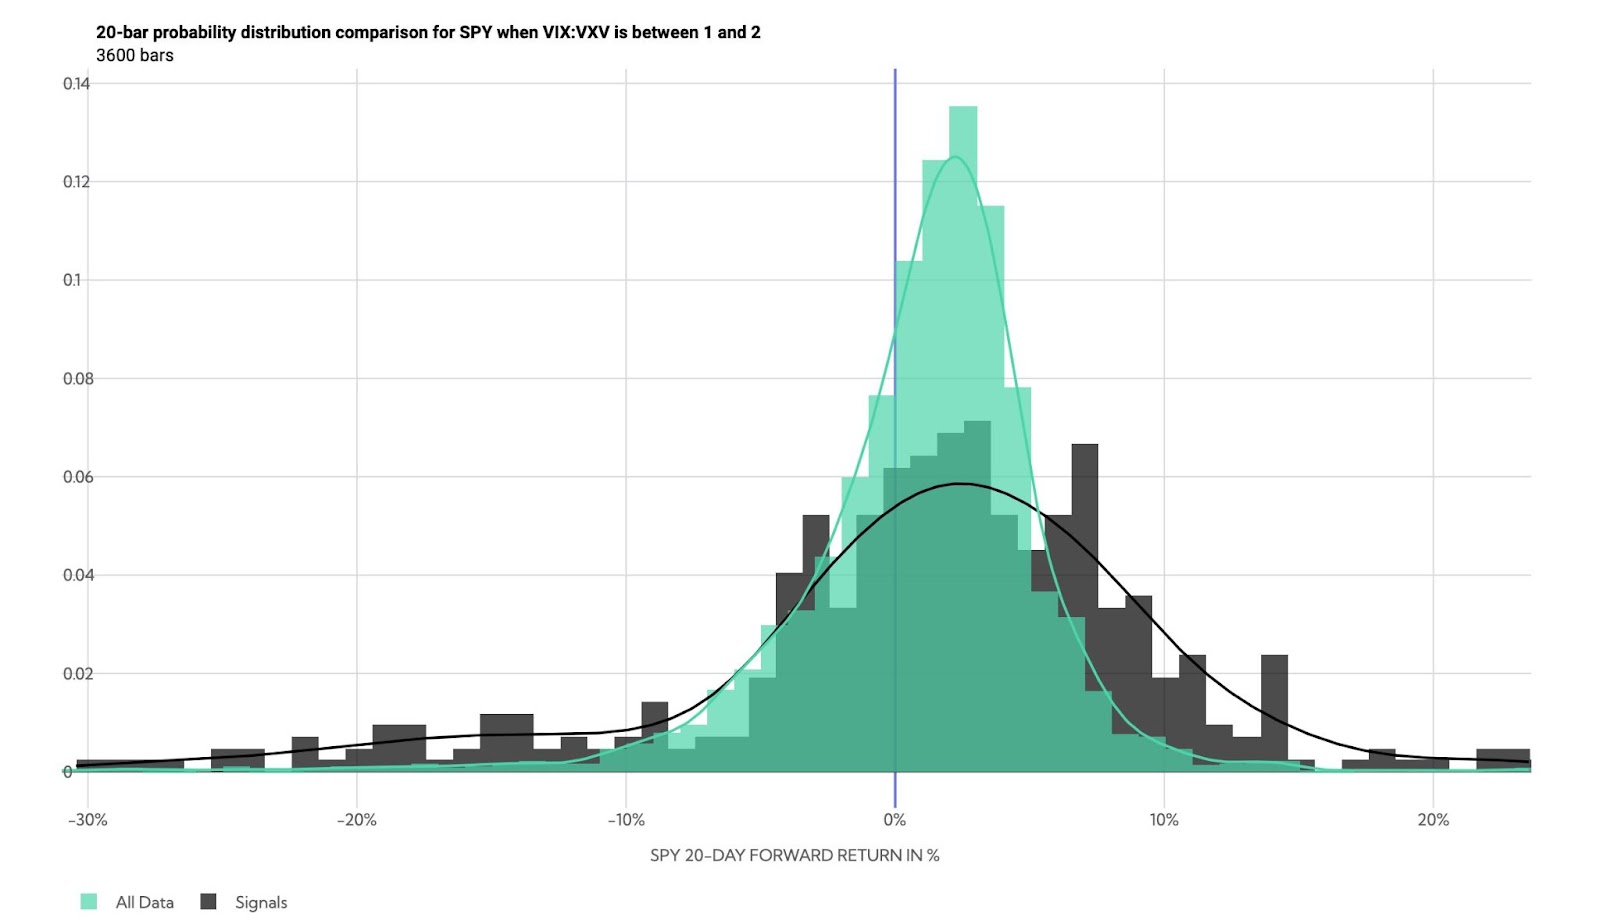
Whether those price rises have legs depends on what the fundamental situation is, then. Regardless, the returns distribution, based on implied volatility metrics alone, is skewed positive, albeit there are some large negative outliers.

Graphic: Via @HalfersPower. “In backwardation via $VIX: $VIX3M next month [realized volatility] is highest amongst the deciles (d10 >1) ~43% subsequent realized volatility.”

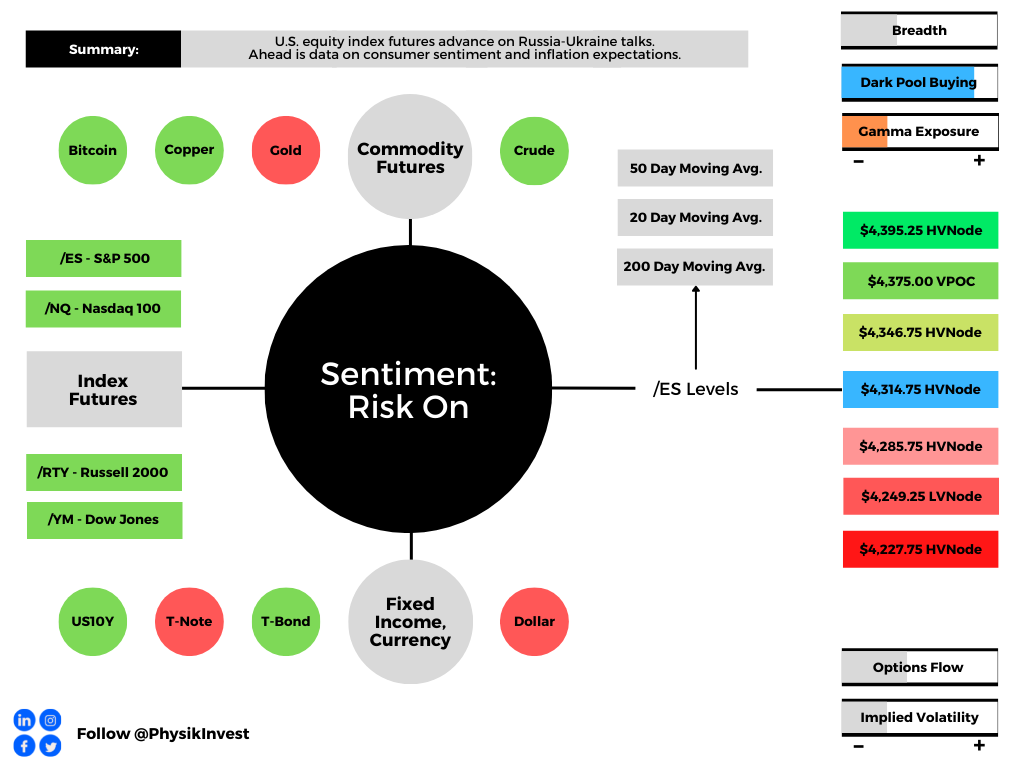
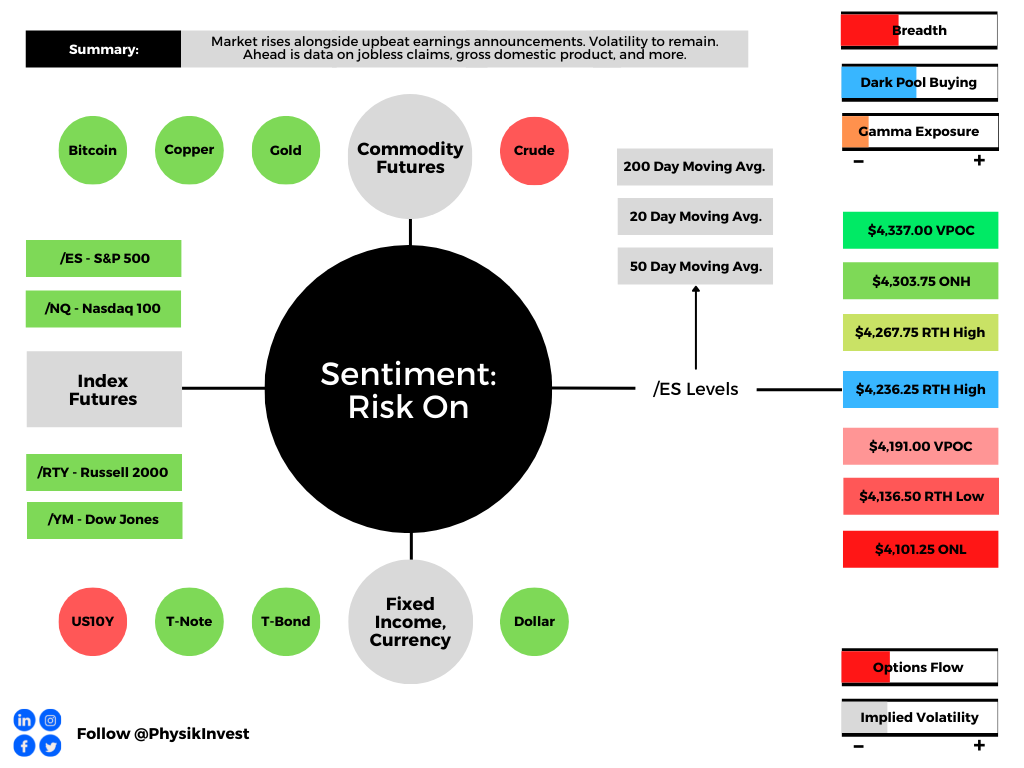
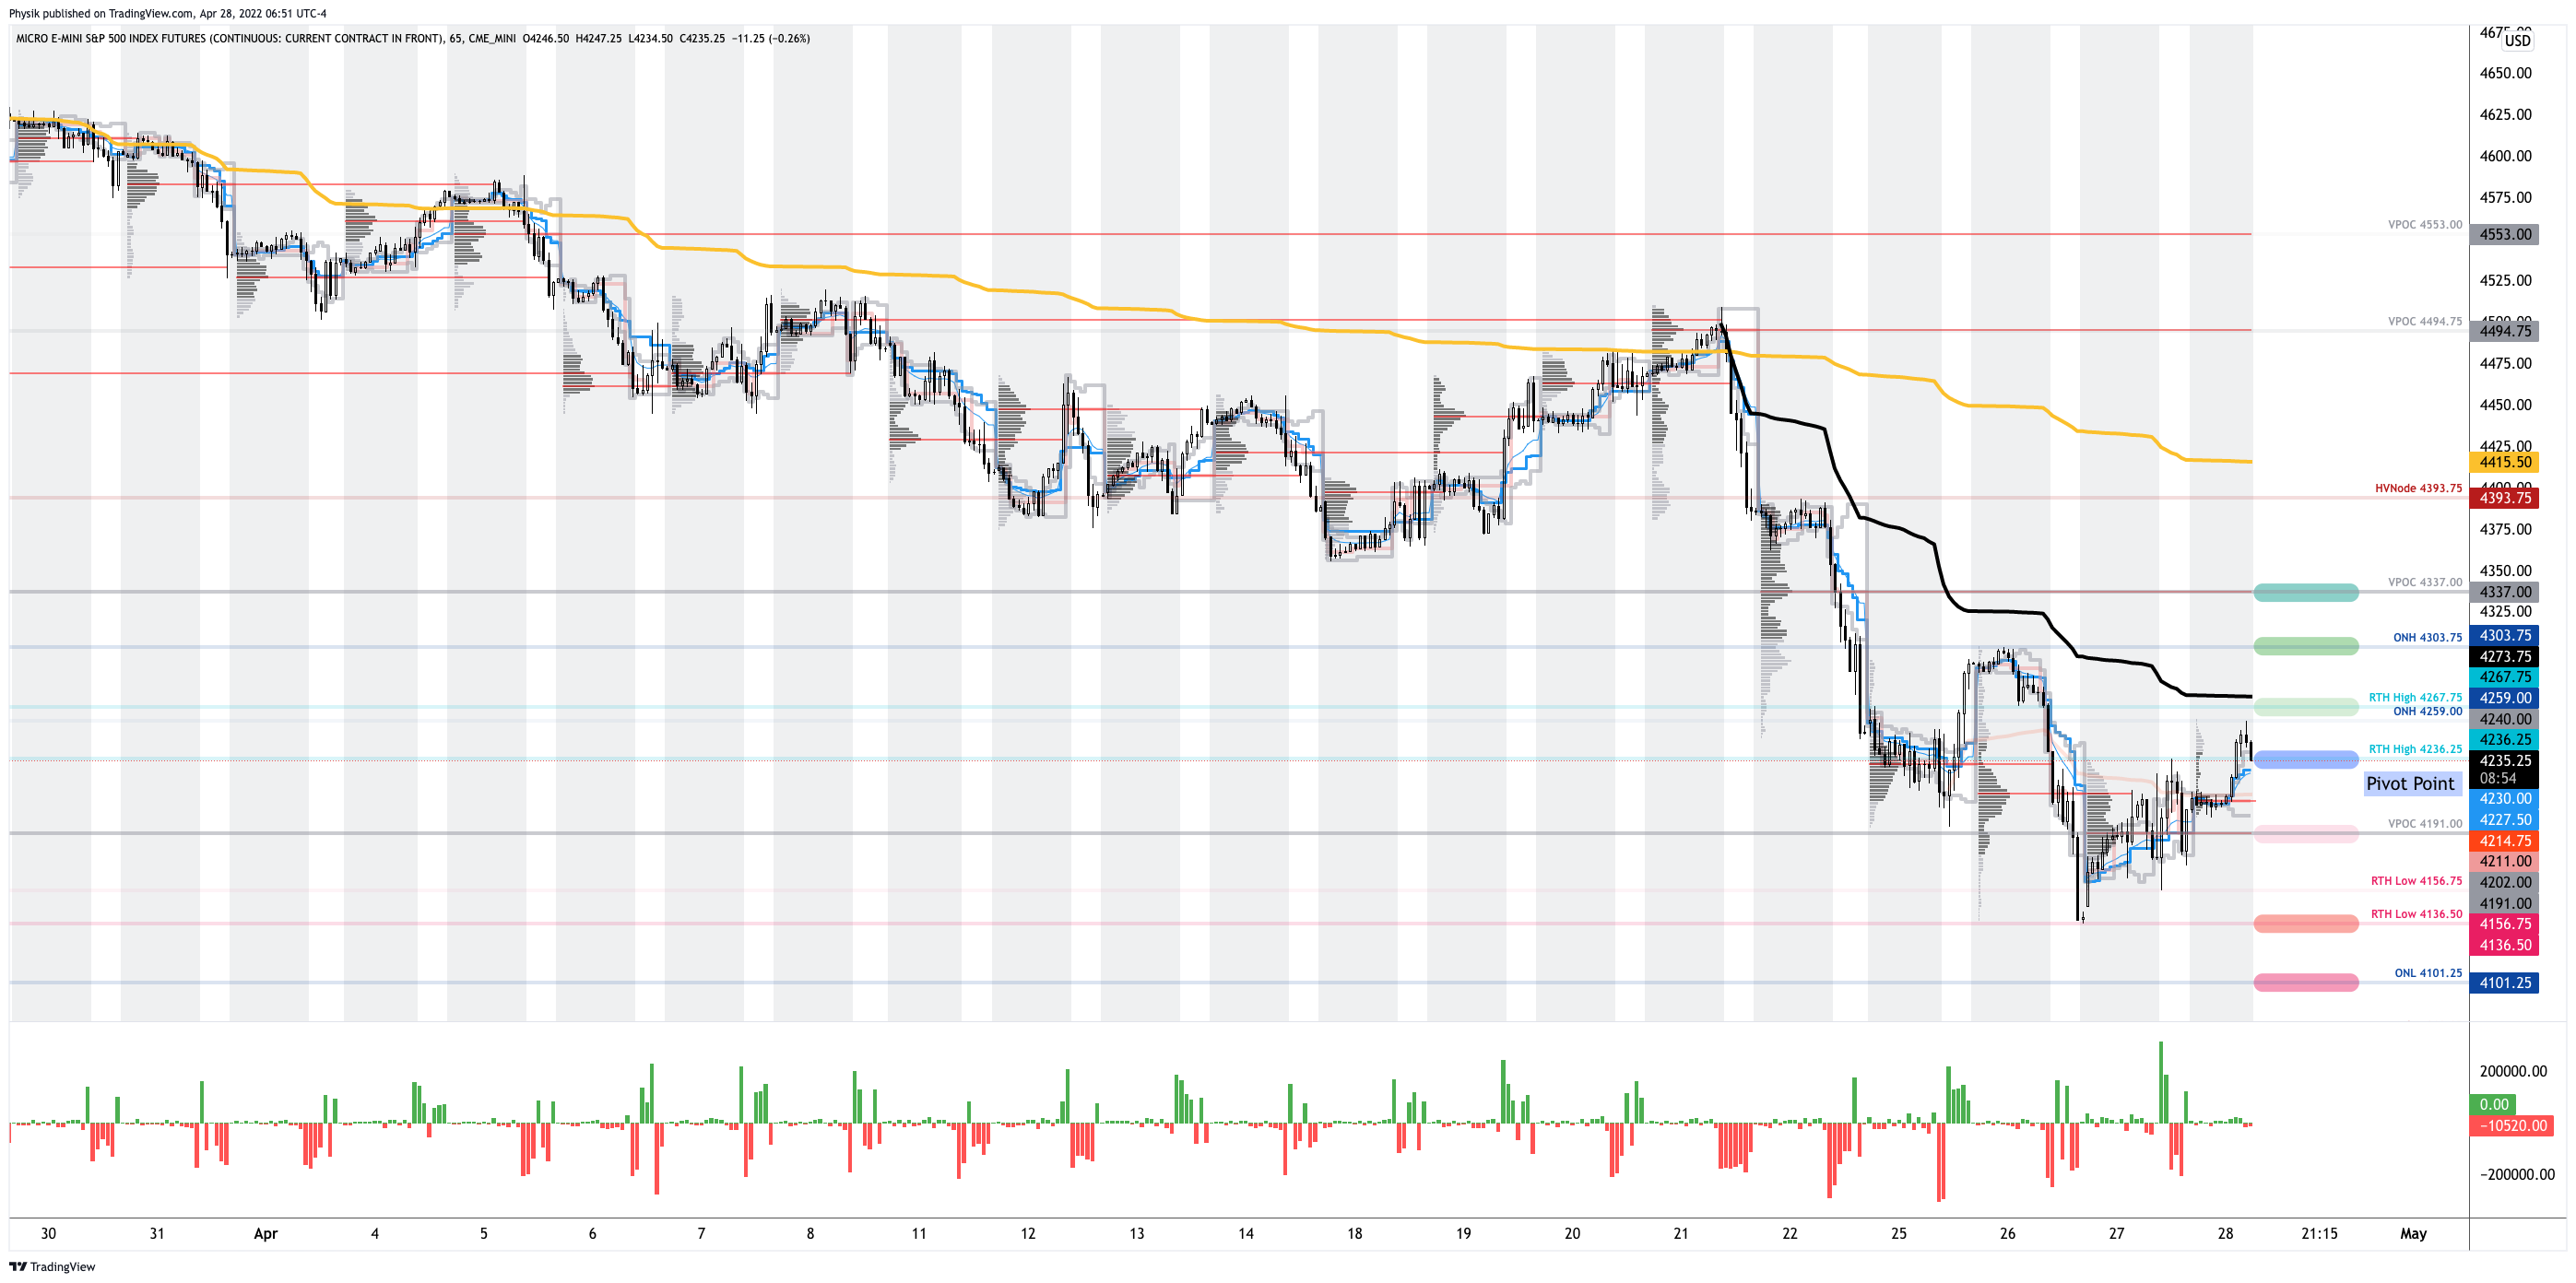
Technical: As of 7:00 AM ET, Thursday’s regular session (9:30 AM – 4:00 PM ET), in the S&P 500, will likely open in the middle part of a positively skewed overnight inventory, just inside of prior-range and -value, suggesting a limited potential for immediate directional opportunity.

In the best case, the S&P 500 trades higher; activity above the $4,236.25 regular trade high (RTH High) puts in play the $4,267.75 RTH High. Initiative trade beyond the $4,267.75 RTH High could reach as high as the $4,303.75 overnight high (ONH) and $4,337.00 untested point of control (VPOC), or higher.

In the worst case, the S&P 500 trades lower; activity below the $4,236.25 RTH High puts in play the $4,191.00 VPOC. Initiative trade beyond the VPOC could reach as low as the $4,136.00 regular trade low (RTH Low) and $4,101.25 overnight low (ONL), or lower.

Click here to load today’s key levels into the web-based TradingView charting platform. Note that all levels are derived using the 65-minute timeframe. New links are produced, daily.
Graphic: 65-minute profile chart of the Micro E-mini S&P 500 Futures.

Considerations: Markets are higher after testing some key levels outlined in prior letters.

The Invesco QQQ Trust Series 1 (NASDAQ: QQQ), one of the weakest products this letter monitors, just tested a major VWAP, yesterday, anchored from the lows of March 2020. 

Graphic: Invesco QQQ Trust Series 1 (NASDAQ: QQQ) with anchored VWAPs.

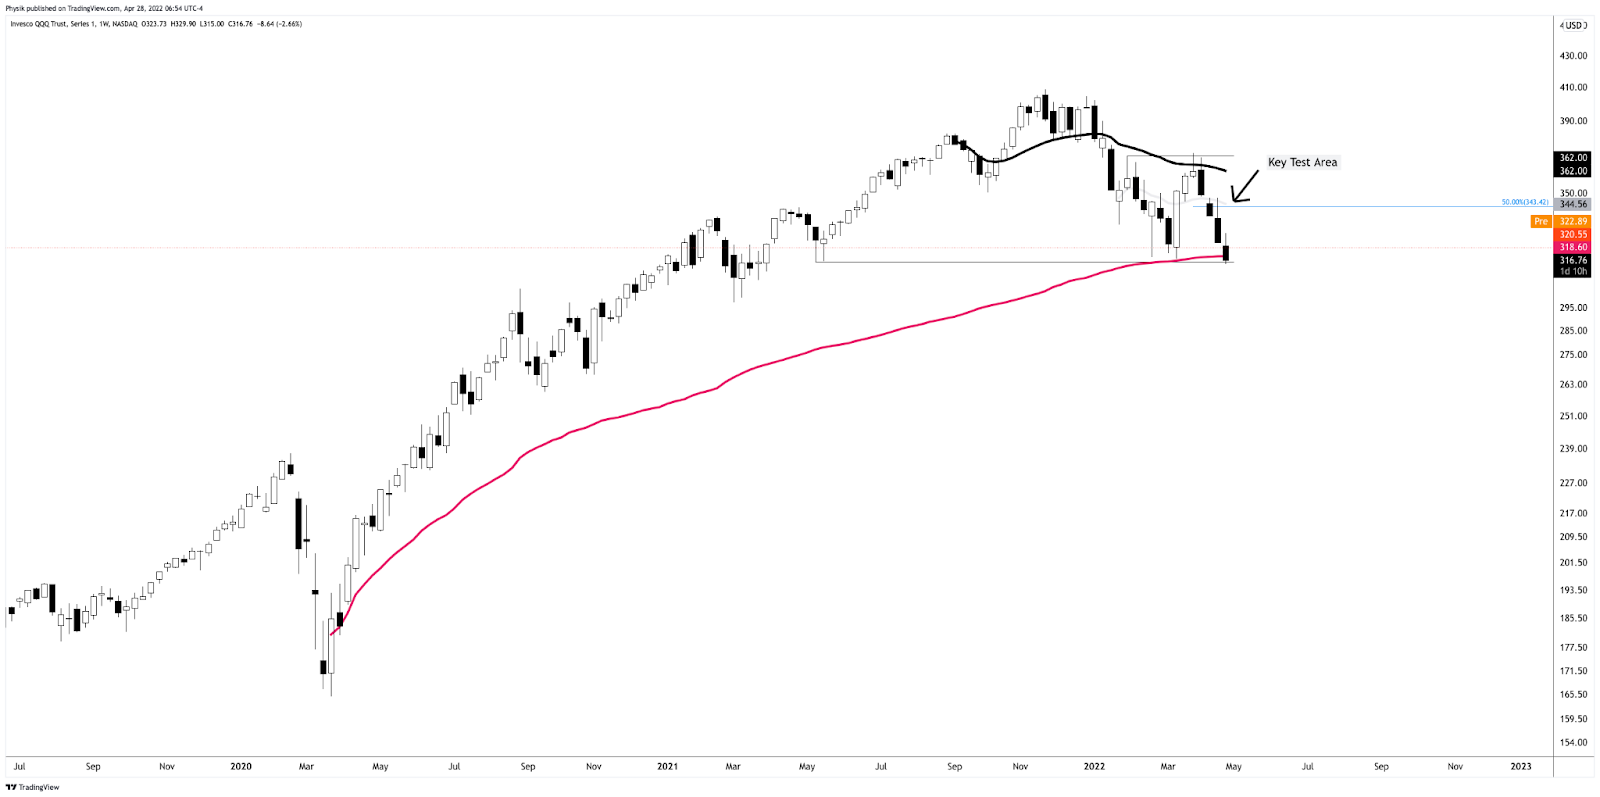
The Nasdaq has led the market down. It may lead the market higher on reversals. We’ll continue to monitor market breadth, among other metrics, for signs of strength.

Definitions

Overnight Rally Highs (Lows): Typically, there is a low historical probability associated with overnight rally-highs (lows) ending the upside (downside) discovery process.

Volume Areas: A structurally sound market will build on areas of high volume (HVNodes). Should the market trend for long periods of time, it will lack sound structure, identified as low volume areas (LVNodes). LVNodes denote directional conviction and ought to offer support on any test. 

If participants were to auction and find acceptance into areas of prior low volume (LVNodes), then future discovery ought to be volatile and quick as participants look to HVNodes for favorable entry or exit.

Gamma: Gamma is the sensitivity of an option to changes in the underlying price. Dealers that take the other side of options trades hedge their exposure to risk by buying and selling the underlying. When dealers are short-gamma, they hedge by buying into strength and selling into weakness. When dealers are long-gamma, they hedge by selling into strength and buying into weakness. The former exacerbates volatility. The latter calms volatility.

Vanna: The rate at which the delta of an option changes with respect to volatility.

Charm: The rate at which the delta of an option changes with respect to time.

POCs: POCs are valuable as they denote areas where two-sided trade was most prevalent in a prior day session. Participants will respond to future tests of value as they offer favorable entry and exit.

Volume-Weighted Average Prices (VWAPs): A metric highly regarded by chief investment officers, among other participants, for quality of trade. Additionally, liquidity algorithms are benchmarked and programmed to buy and sell around VWAPs.

About

After years of self-education, strategy development, mentorship, and trial-and-error, Renato Leonard Capelj began trading full-time and founded Physik Invest to detail his methods, research, and performance in the markets.

Capelj also develops insights around impactful options market dynamics at SpotGamma and is a Benzinga reporter.

Some of his works include conversations with ARK Invest’s Catherine Wood, investors Kevin O’Leary and John Chambers, FTX’s Sam Bankman-Fried, Kai Volatility’s Cem Karsan, The Ambrus Group’s Kris Sidial, among many others.

Disclaimer

In no way should the materials herein be construed as advice. Derivatives carry a substantial risk of loss. All content is for informational purposes only.

Categories
Commentary

Daily Brief For March 11, 2022

Editor’s Note: The Daily Brief is a free glimpse into the prevailing fundamental and technical drivers of U.S. equity market products. Join the 200+ that read this report daily, below!

What Happened

On reports that there was progress in talks between Russia and Ukraine, stock index futures advanced putting the S&P 500 back inside a large consolidation area.

Thus far, trade has been volatile and responsive to key visual levels suggesting that the larger other time frame (non-technical) participants are waiting for more information to initiate trades.

Ahead is data on the University of Michigan Sentiment (10:00 AM ET) and inflation expectations (10:00 AM ET).

Graphic updated 6:45 AM ET. Sentiment Risk-On if expected /ES open is above the prior day’s range. /ES levels are derived from the profile graphic at the bottom of the following section. Levels may have changed since initially quoted; click here for the latest levels. SqueezeMetrics Dark Pool Index (DIX) and Gamma (GEX) calculations are based on where the prior day’s reading falls with respect to the MAX and MIN of all occurrences available. A higher DIX is bullish. At the same time, the lower the GEX, the more (expected) volatility. Learn the implications of volatility, direction, and moneyness. SHIFT data used for S&P 500 (INDEX: SPX) options activity. Note that options flow is sorted by the call premium spent; if more positive, then more was spent on call options. Breadth reflects a reading of the prior day’s NYSE Advance/Decline indicator. VIX reflects a current reading of the CBOE Volatility Index (INDEX: VIX) from 0-100.

What To Expect

Fundamental: Yesterday’s letter covered a lot of ground. Check it out if you haven’t already.

Volatility is heightened and the narratives we may attribute that to are concerned with the intent to tighten monetary policy, slower economic growth, and geopolitics.

Graphic: Via Goldman Sachs Group Inc (NYSE: GS). Taken from The Market Ear. “We are downgrading our US GDP forecast to reflect higher oil prices and other drags on growth related to the war in Ukraine.”

In comparison, though, U.S. equity product volatility is less than that in Europe and this points to the “risk premium for investing in Europe’s markets that are teeming with cyclical stocks acutely vulnerable to growth and inflation risks,” among other things.

Adding to the turbulence was the European Central Bank’s pivot toward hawkishness; the institution will accelerate the wind-down of its monetary stimulus. Pursuant to this decision, Euro-area equity funds had their largest weekly outflows on record.

Graphic: Via Bloomberg. 

U.S. policymakers are expected to ramp their tightening efforts, next week, also, as inflation expectations are surging.

Graphic: Via Bloomberg. “[T]he central bank is widely expected to announce a 25-basis point increase Wednesday, along with fresh projections for the economy and path of interest rates.”

Per CME Group Inc’s (NASDAQ: CME) FedWatch Tool, participants are pricing a near 100% chance of a hike in the target rate.

Graphic: Via CME Group Inc (NASDAQ: CME). Participants price in an increased probability of a shift in the target rate. Click here to access the FedWatch Tool.

In the face of all the bearish narratives, however, many products – at the single-stock level – have been de-rating now for nearly a year. 

Ahead of bullish seasonality and rebalancing flow (from fixed income into equities), JPMorgan Chase & Co (NYSE: JPM) strategists suggest that “we could be through [the] worst of it.” 

“When either All Strats or Equity L/S net leverage fell by at least 1.5z or more, the SPX generally rallied over the next 1wk and 4wks,” a bulletin published by The Market Ear read. 

Positioning: Based on a comparison of present options positioning and buying metrics, the returns distribution is skewed positive, albeit less so than before. 

Graphic: Via Physik Invest. Data via SqueezeMetrics.

Adding, over the past weeks, we talked about the SPX and VIX down dynamic. This in part has to do with the supply and demand of protection, at the index level. Hyperlinked are our past conversations.

Graphic: Via Bloomberg. S&P 500 (INDEX: SPX) down, CBOE Volatility Index (INDEX: VIX) down.

“We’re back to another point of people being well hedged and well-positioned,” Amy Wu Silverman of Royal Bank of Canada’s (NYSE: RY) capital markets group, said. 

“You’re also seeing people selling that volatility and doing some overwriting. That can probably dampen volatility.”

Graphic: SpotGamma’s Hedging Impact of Real-Time Options (HIRO) indicator for the SPDR S&P 500 ETF Trust (NYSE: SPY). Into the S&P 500’s March 8, 2022 decline, participants sold volatility on both sides of the options chain.

“When implied volatility is high, that same 1% move lower is much more ‘expected’ so there generally won’t be the same upward pressure on volatility and in fact it might decline,” said Christopher Jacobson, a strategist at Susquehanna Financial Group LLP.

“Along the same lines, investors at that point have had more opportunity and time to hedge, so those same market moves may not lead to as much hedging activity.”

Graphic: Via SpotGamma. “Netting call & put delta, you can see we’re near extremes in terms of put:call positions. Often large put positions are removed by expirations, which seems to coincide with market lows. Many of these are quarterly expirations which coincide w/FOMC meetings – such as next week.”

Taking this together, in accordance with metrics referred to earlier, “we could be closer to the end than the beginning of the discretionary de-risking,” as JPMorgan analysts best explain.

Further, the compression of volatility (via passage of FOMC) or removal of counterparty negative exposure (via OPEX) may serve to alleviate some of this pressure

Until then, participants can expect the options landscape to add to market volatility.

Technical: As of 6:30 AM ET, Friday’s regular session (9:30 AM – 4:00 PM ET), in the S&P 500, will likely open in the upper part of a positively skewed overnight inventory, outside of prior-range and -value, suggesting a potential for immediate directional opportunity.

Balance-Break + Gap Scenarios: A change in the market (i.e., the transition from two-time frame trade, or balance, to one-time frame trade, or trend) is occurring.

Monitor for acceptance (i.e., more than 1-hour of trade) outside of the balance area. 

Leaving value behind on a gap-fill or failing to fill a gap (i.e., remaining outside of the prior session’s range) is a go-with indicator. 

Rejection (i.e., return inside of balance) portends a move to the opposite end of the balance.

In the best case, the S&P 500 trades higher; activity above the $4,314.75 high volume area (HVNode) puts in play the $4,346.75 HVNode. Initiative trade beyond the $4,346.75 HVNode could reach as high as the $4,375.00 untested point of control (VPOC) and $4,395.25 HVNode, or higher.

In the worst case, the S&P 500 trades lower; activity below the $4,314.75 HVNode puts in play the $4,285.75 HVNode. Initiative trade beyond the $4,285.75 HVNode could reach as low as the $4,249.25 low volume area (LVNode) and $4,227.75 HVNode, or lower.

Considerations: Push-and-pull, as well as responsiveness near key-technical areas (that are discernable visually on a chart), suggests technically-driven traders with short time horizons are very active. 

Such traders often lack the wherewithal to defend retests and, additionally, the type of trade may be indicative of the other time frame participants waiting for more information to initiate trades.

Click here to load today’s key levels into the web-based TradingView charting platform. Note that all levels are derived using the 65-minute timeframe. New links are produced, daily.
Graphic: 65-minute profile chart of the Micro E-mini S&P 500 Futures.

What People Are Saying

Definitions

Overnight Rally Highs (Lows): Typically, there is a low historical probability associated with overnight rally-highs (lows) ending the upside (downside) discovery process.

Volume Areas: A structurally sound market will build on areas of high volume (HVNodes). Should the market trend for long periods of time, it will lack sound structure, identified as low volume areas (LVNodes). LVNodes denote directional conviction and ought to offer support on any test. 

If participants were to auction and find acceptance into areas of prior low volume (LVNodes), then future discovery ought to be volatile and quick as participants look to HVNodes for favorable entry or exit.

POCs: POCs are valuable as they denote areas where two-sided trade was most prevalent in a prior day session. Participants will respond to future tests of value as they offer favorable entry and exit.

About

After years of self-education, strategy development, mentorship, and trial-and-error, Renato Leonard Capelj began trading full-time and founded Physik Invest to detail his methods, research, and performance in the markets.

Capelj is also a Benzinga finance and technology reporter interviewing the likes of Shark Tank’s Kevin O’Leary, JC2 Ventures’ John Chambers, FTX’s Sam Bankman-Fried, and ARK Invest’s Catherine Wood, as well as a SpotGamma contributor developing insights around impactful options market dynamics.

Disclaimer

Physik Invest does not carry the right to provide advice.

In no way should the materials herein be construed as advice. Derivatives carry a substantial risk of loss. All content is for informational purposes only.