Editor’s Note: The Daily Brief is a free glimpse into the prevailing fundamental and technical drivers of U.S. equity market products. Join the 200+ that read this report daily, below!
What Happened
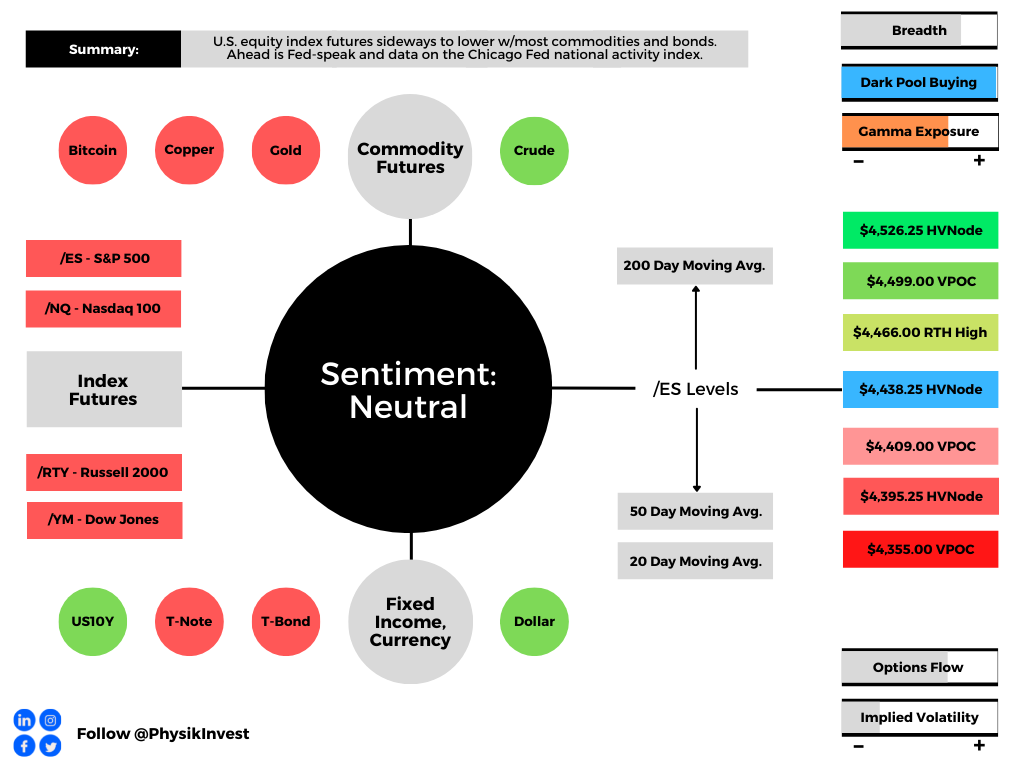
Overnight, equity index futures auctioned sideways to lower with commodities and bonds.
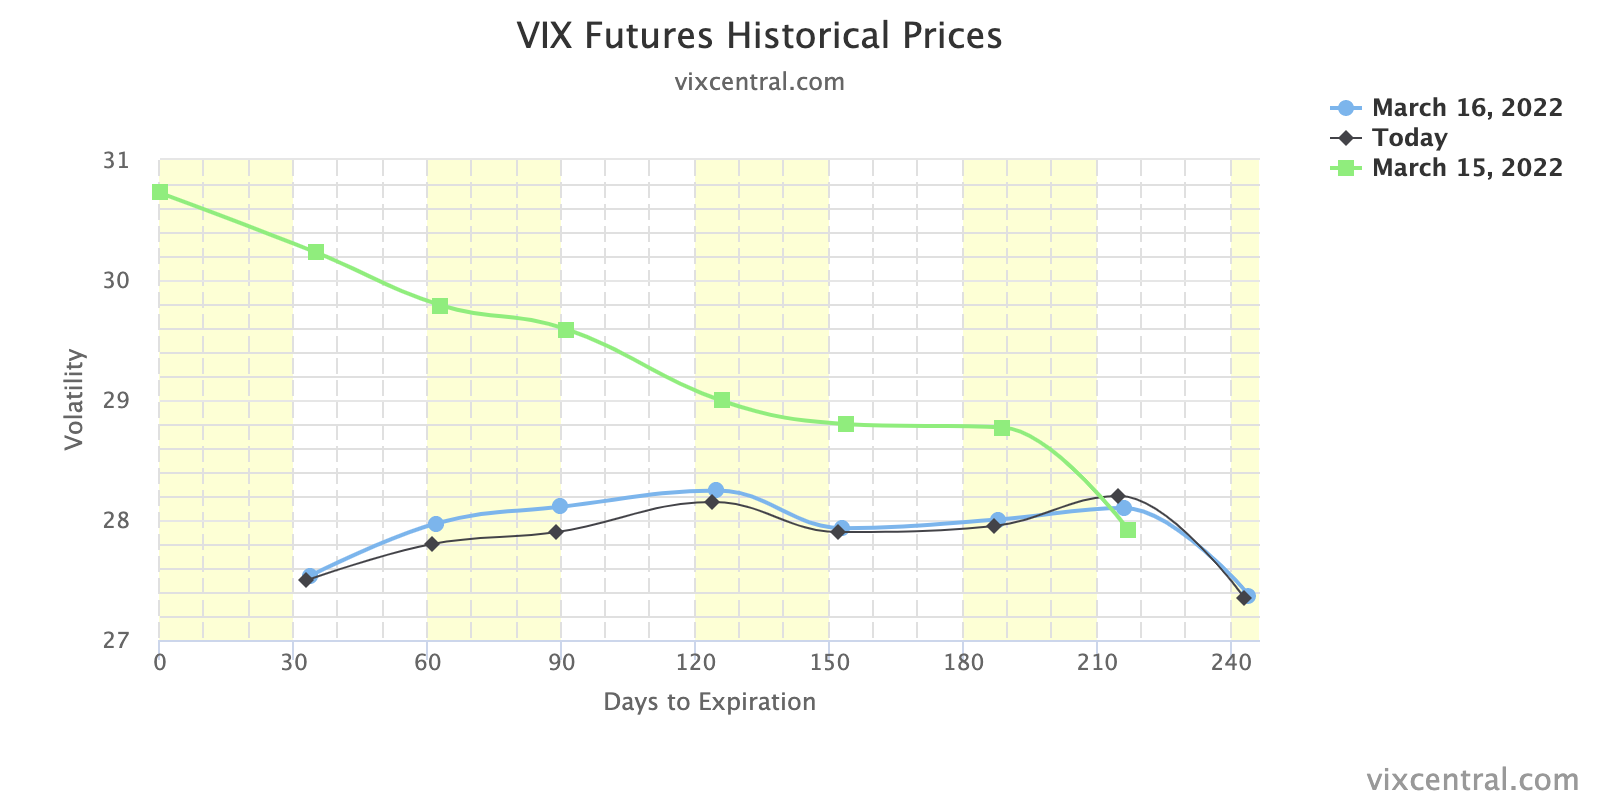
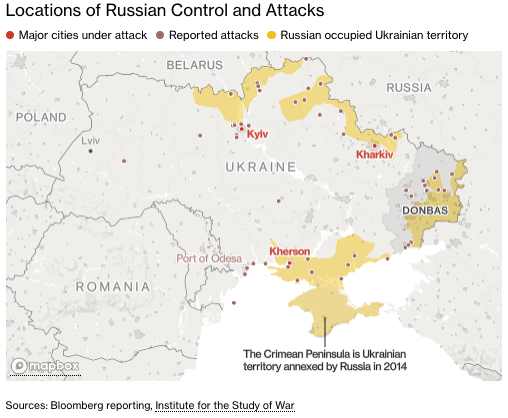
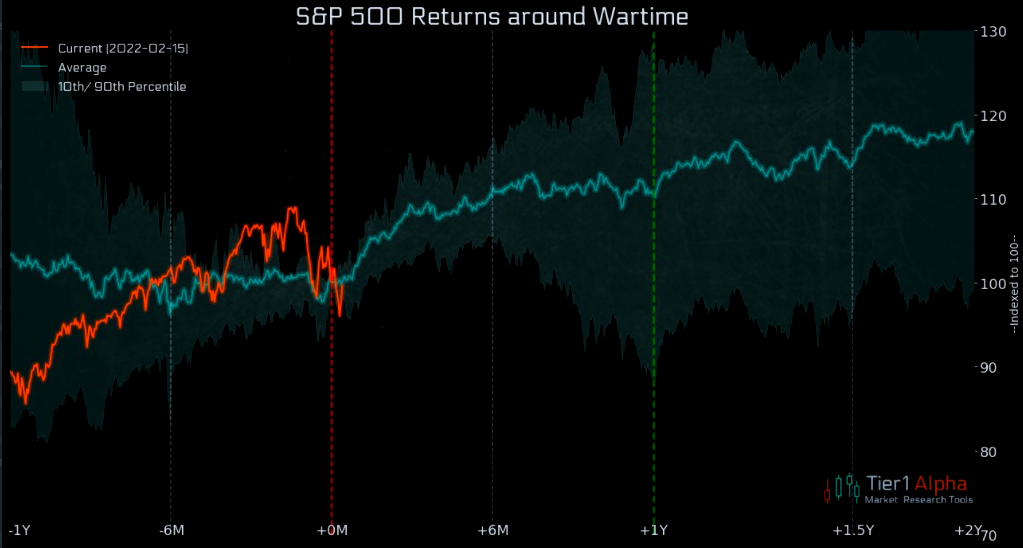
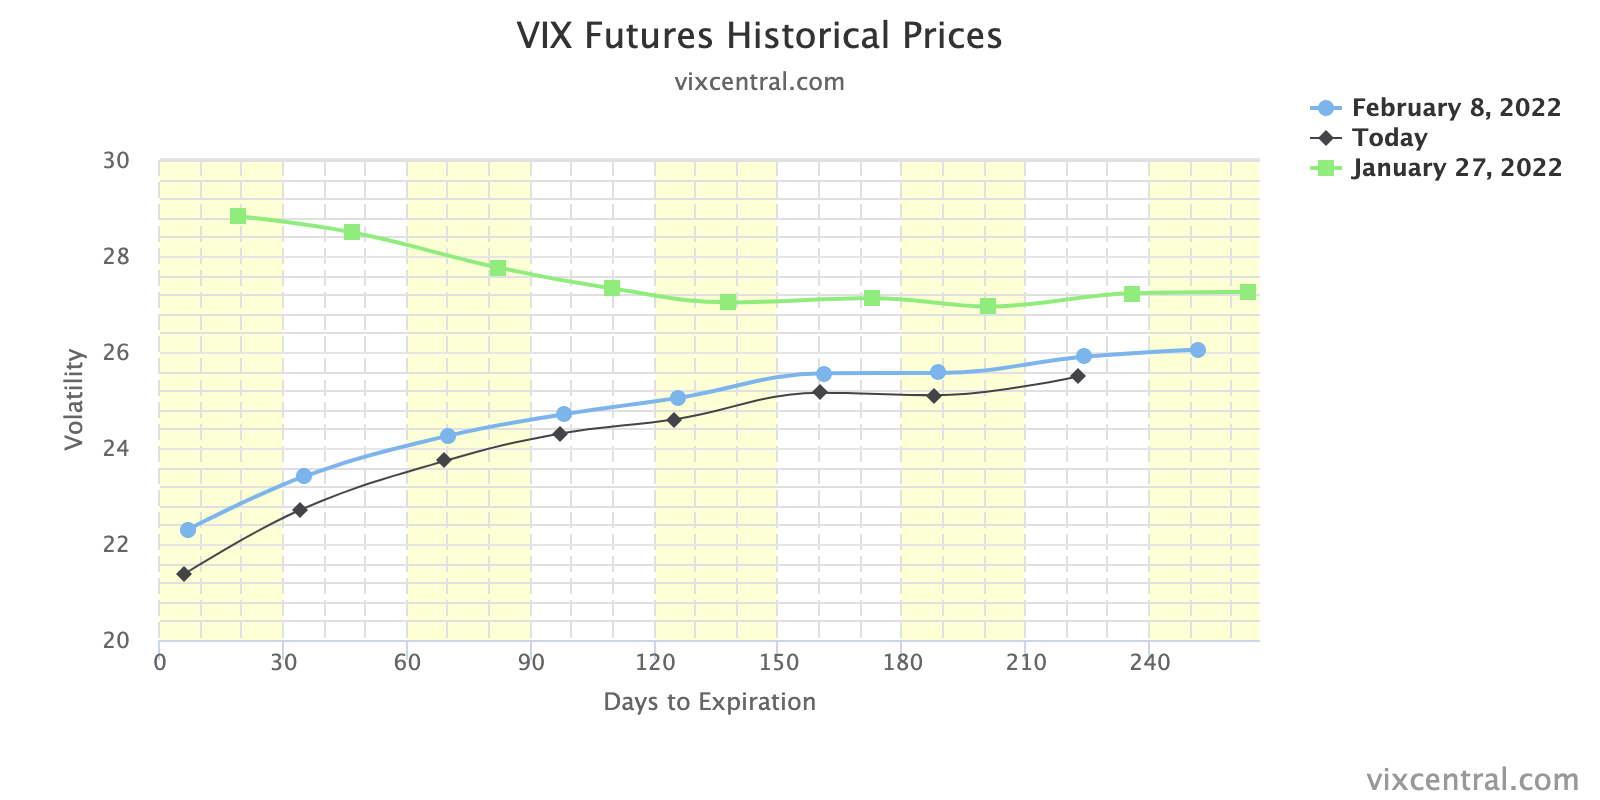
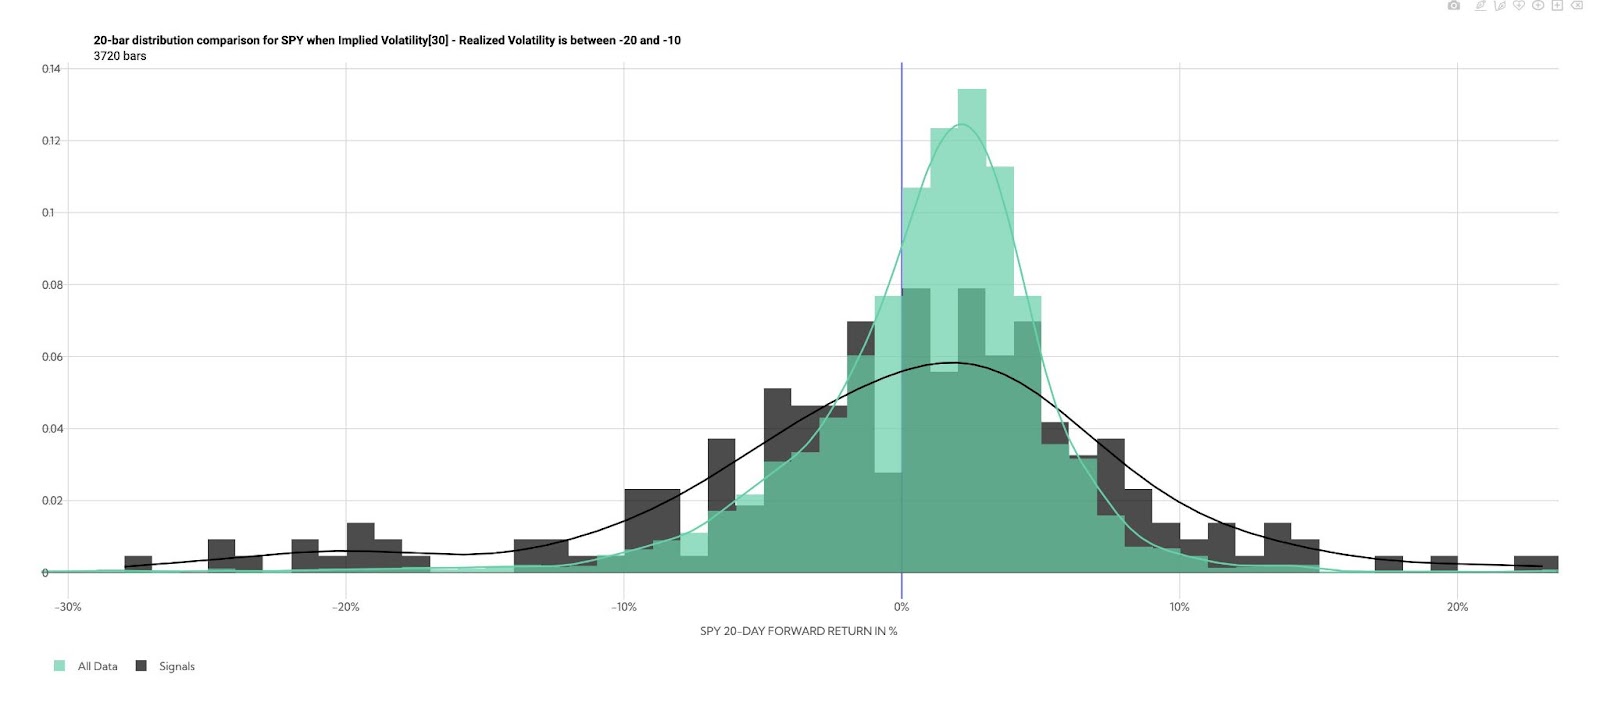
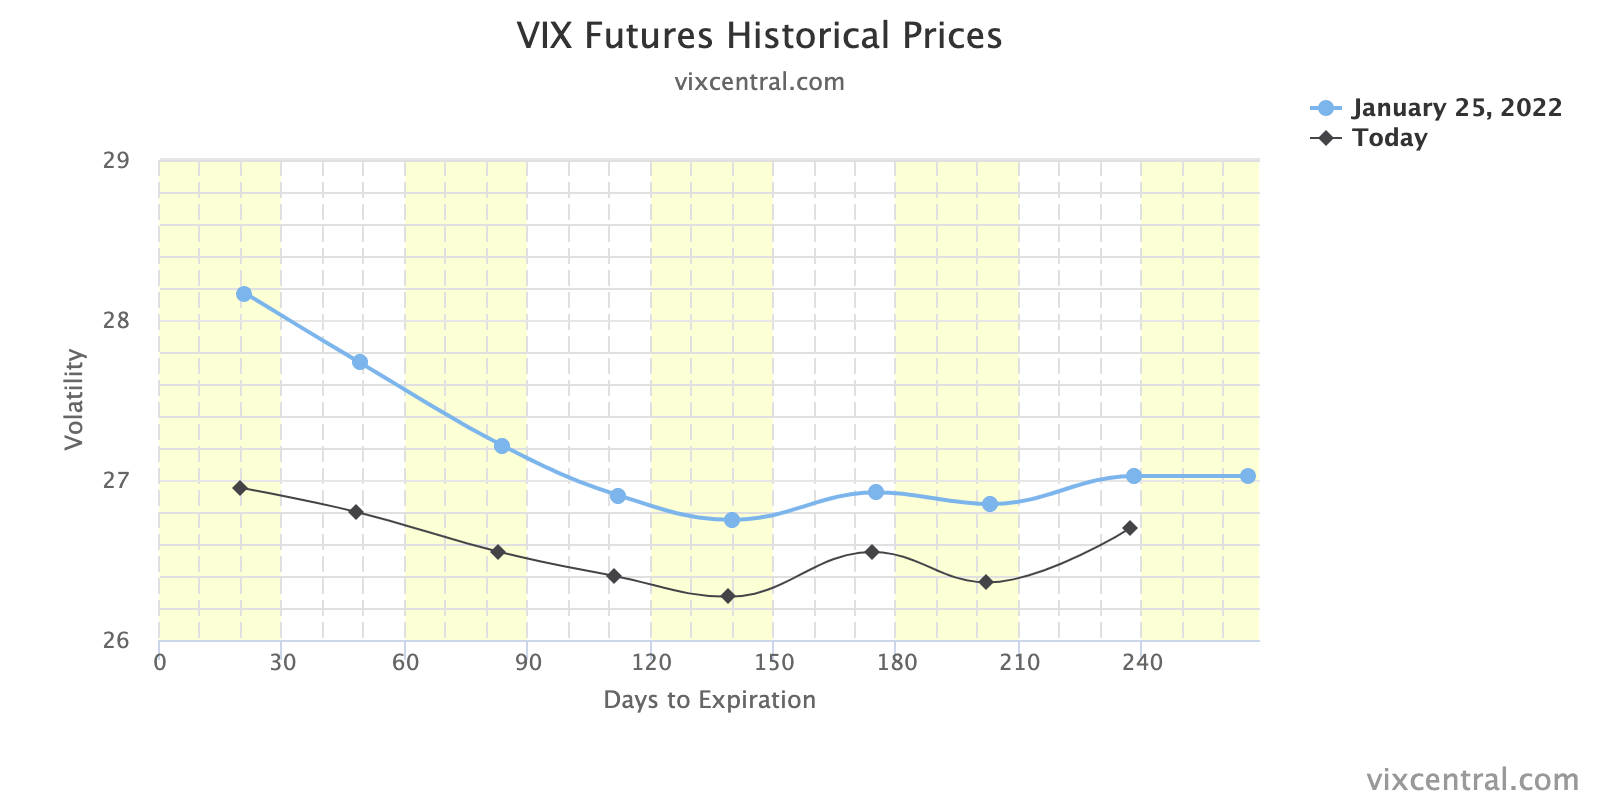
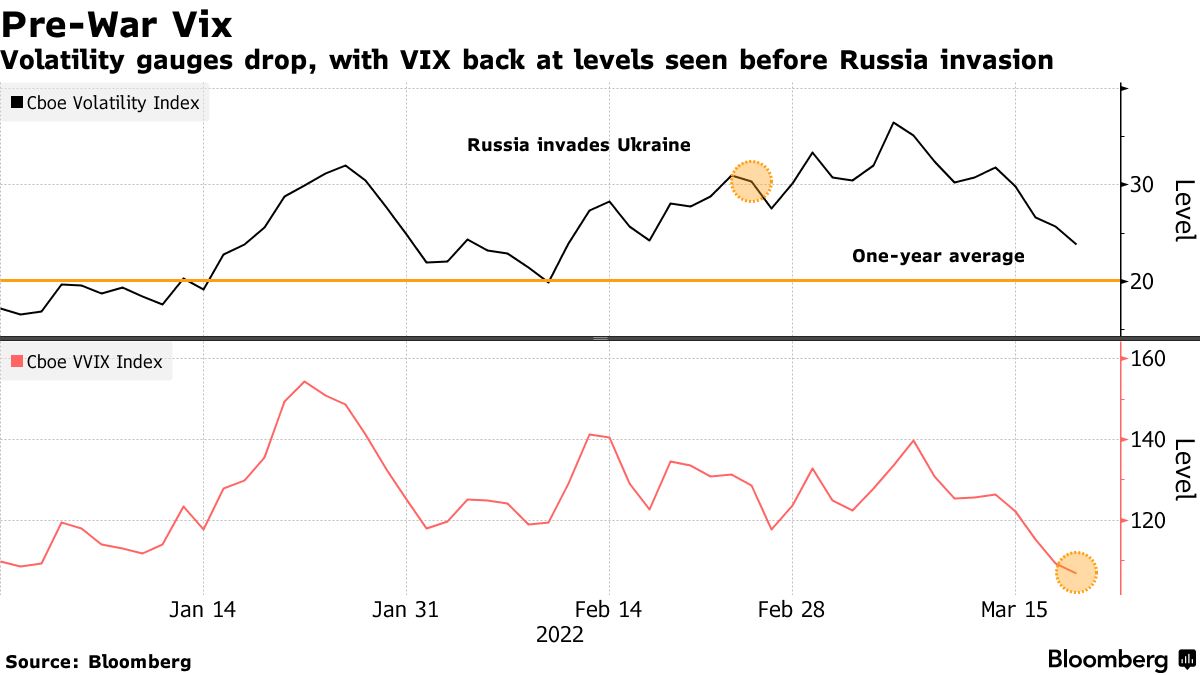
There are no overnight fundamental catalysts to make note of. However, it bears mentioning that implied volatility metrics – via the Cboe Volatility Index (INDEX: VIX) – are back to levels seen before Russia’s invasion of Ukraine. One may conclude that concerns are easing.
Ahead is data on the Chicago Fed national activity index (8:30 AM ET) and Fed-speak by Chair Jerome Powell (12:00 PM ET).
What To Expect
Fundamental: In spite of uncertainties with respect to economic growth and the implications of tighter monetary policy to rein in inflation, as well as geopolitical conflicts abroad, the pricing of equity market risk – via the VIX – is back at levels before Russia’s invasion of Ukraine.
That leads us to question whether the de-rate (or pricing in of uncertainties) has played out?
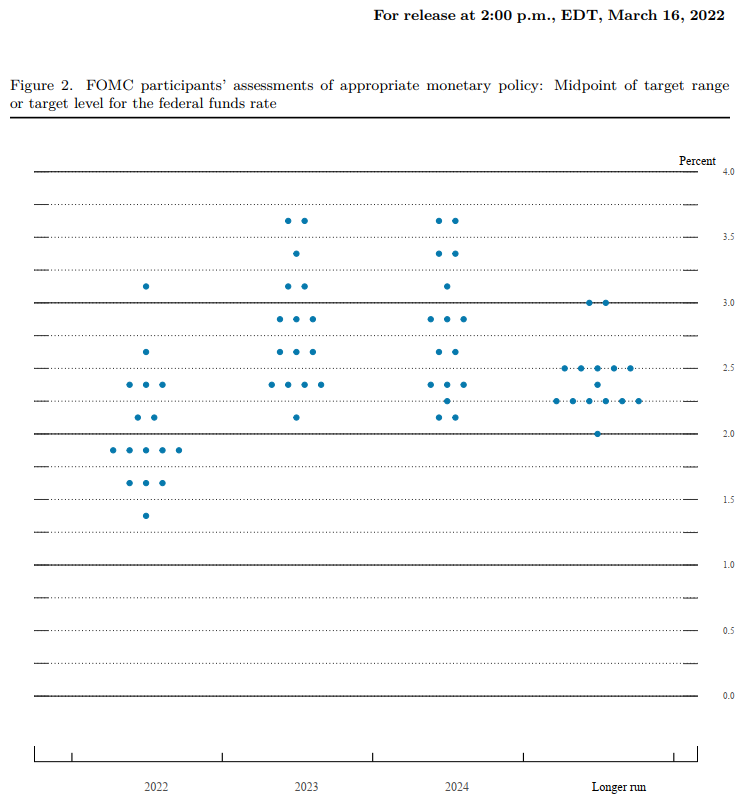
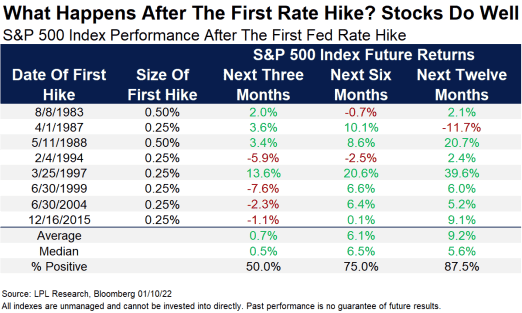
Potentially. With greater clarity on the Federal Reserve’s commitment to raising borrowing costs (as discussed March 17 in detail), strategists like JPMorgan Chase & Co’s (NYSE: JPM) Marko Kolanovic suggest it is time to add risk in beaten-down, high-beta positions.
“While the commodity supercycle will persist,” Kolanovic said, “the correction in bubble sectors is now likely finished, and geopolitical risk will likely start abating in a few weeks’ time (while a comprehensive resolution may take a few months).”
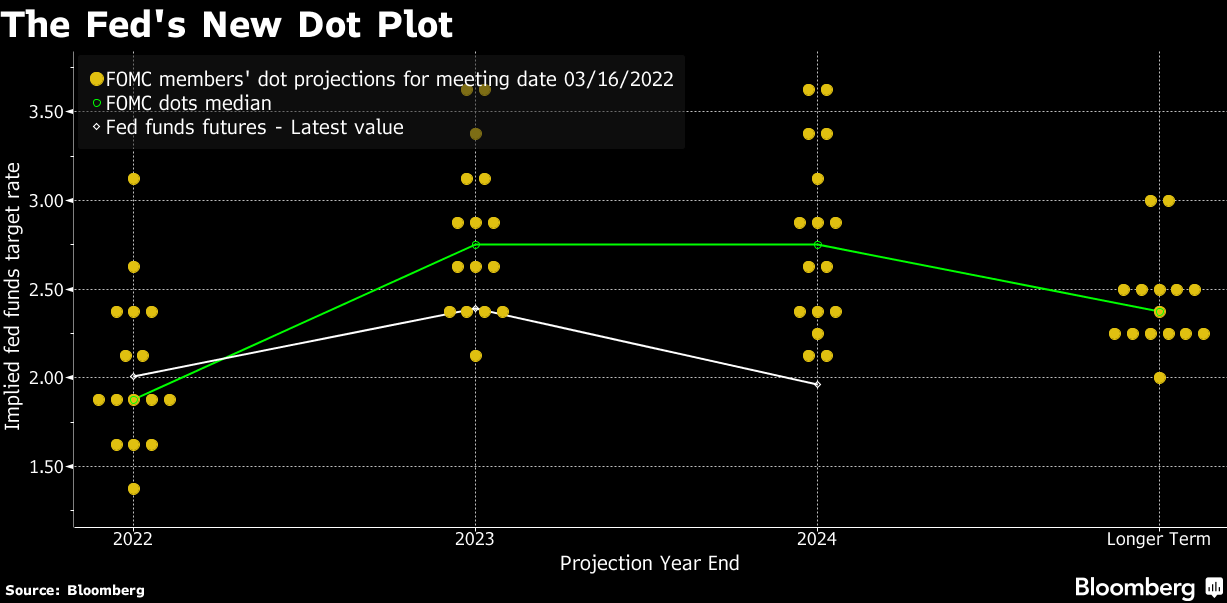
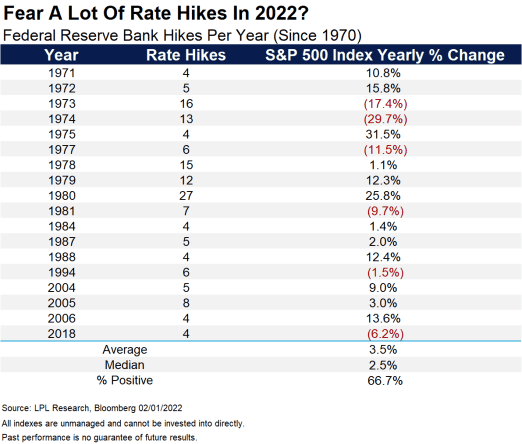
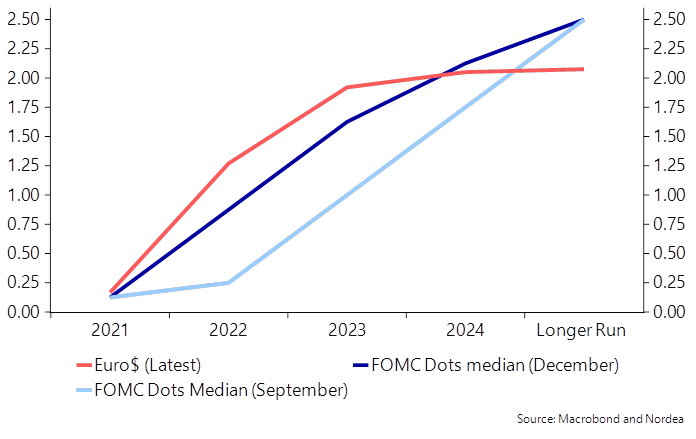
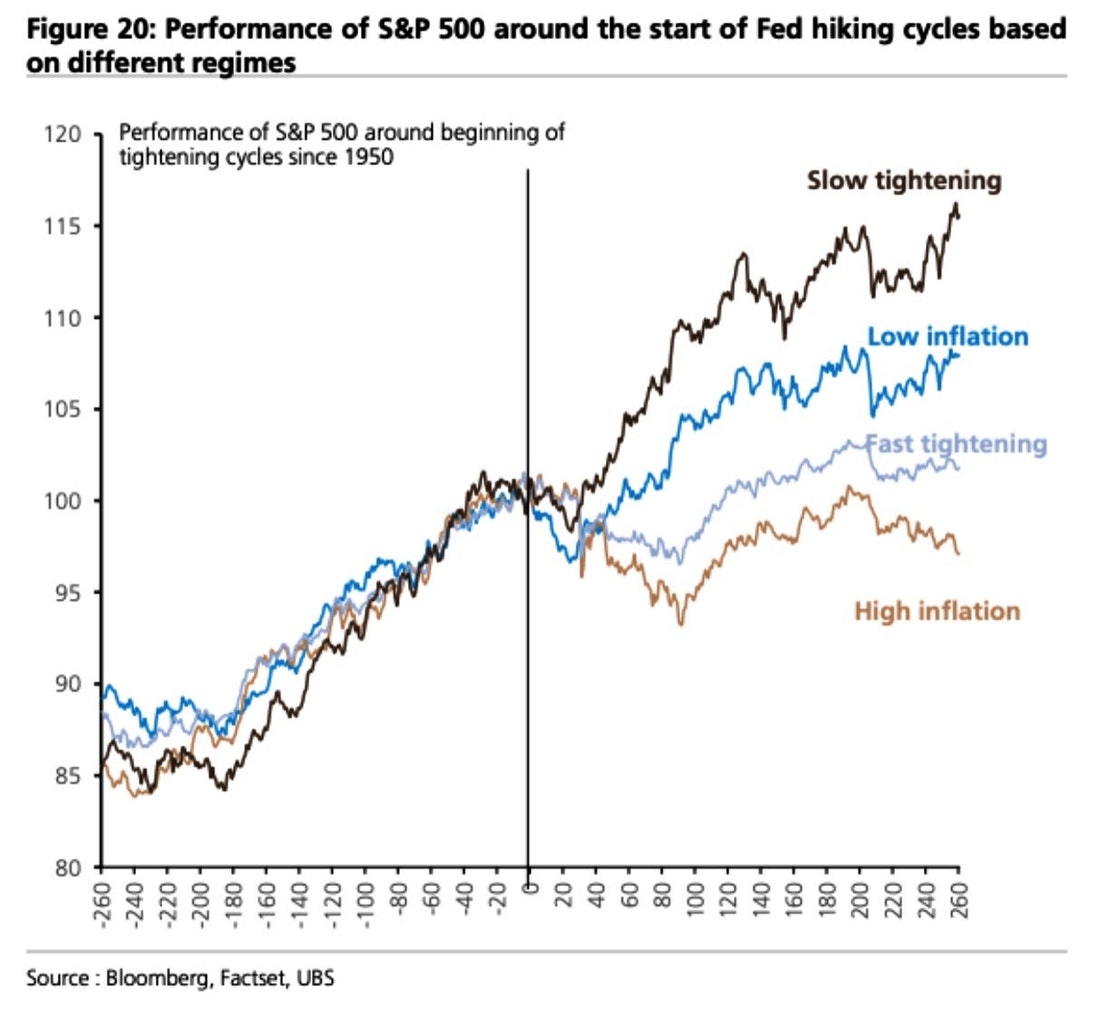
Complicating Kolanovic’s outlook is uncertainty with respect to the Fed’s decision to hike and taper asset purchases faster, as some Fed members say they are “very open to.”
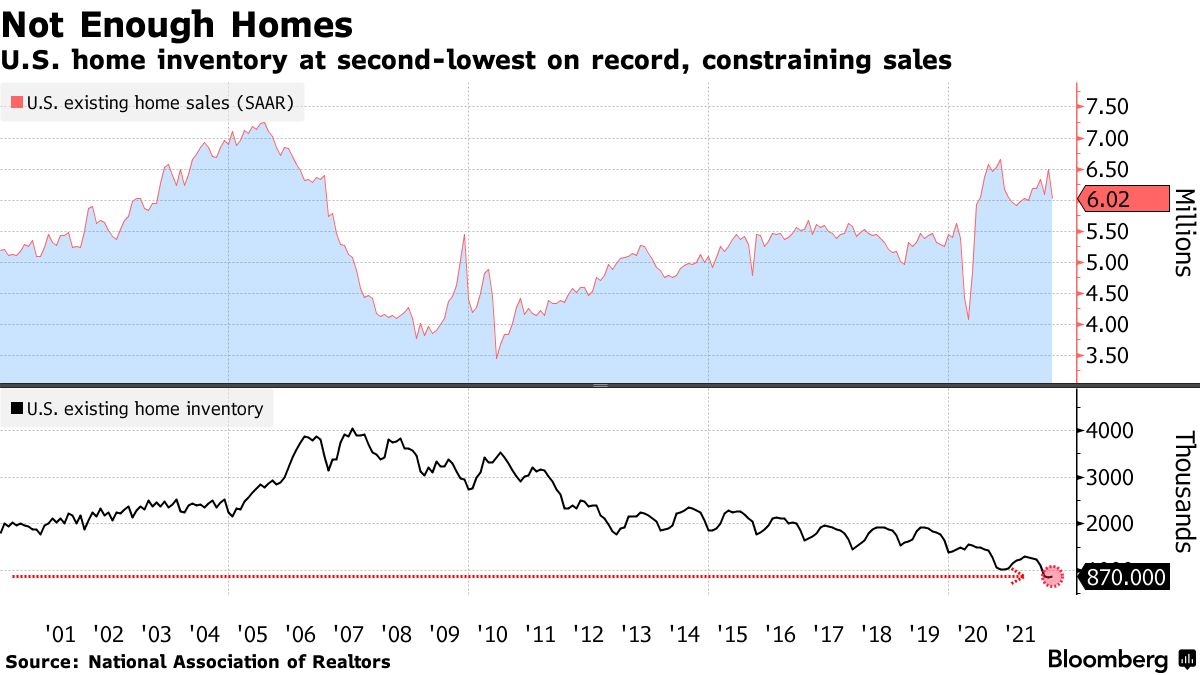
At a high level, higher rates make borrowing more costly (i.e., higher rates on mortgages and business loans, as well as credit cards, among other things, disincentivize borrowing, and this funnels into less growth and inflation).
These higher rates compound the challenges of limited supply, for instance, in housing.
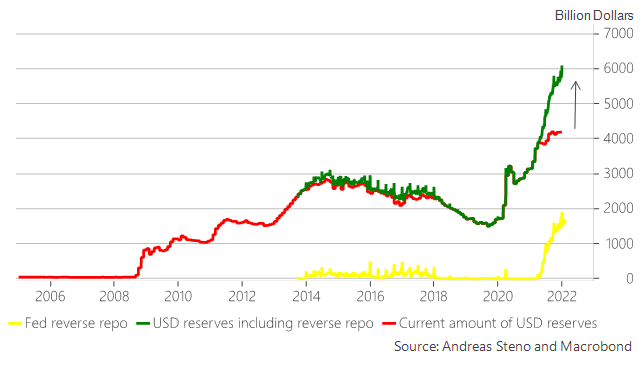
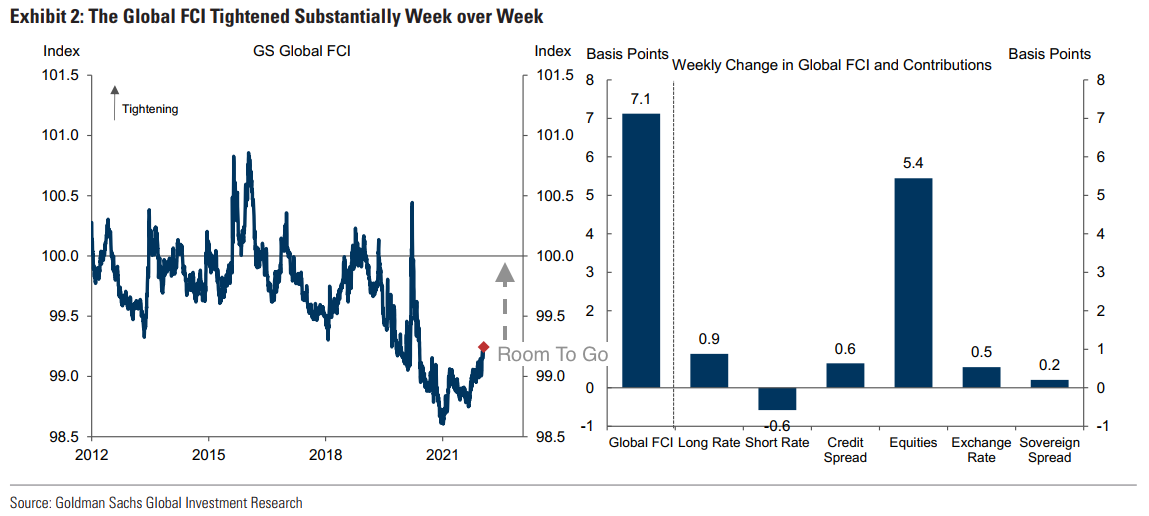
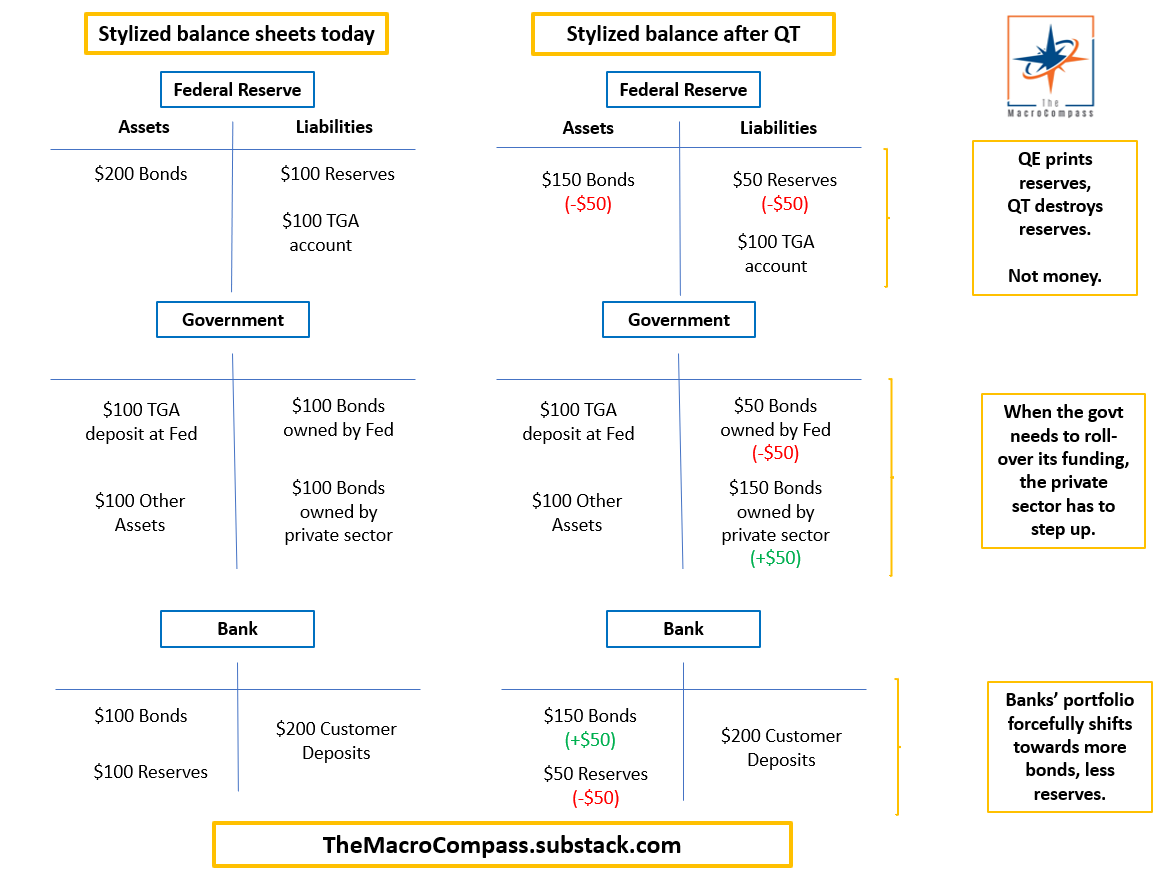
There’s also the topic of using quantitative tightening (QT) to fight inflation, too.
Recall that quantitative easing (QE) is a policy to expand the Federal Reserve’s balance sheet “to provide monetary accommodation, typically when interest rates are at a zero-lower bound (when nominal interest rates are at, or near, zero),” as JH Investment Management explains.
With QT, central banks remove assets (e.g., government bonds they bought from the private sector) from their balance sheet “either through the sale of assets they had purchased or deciding against reinvesting the principal sum of maturing securities.”
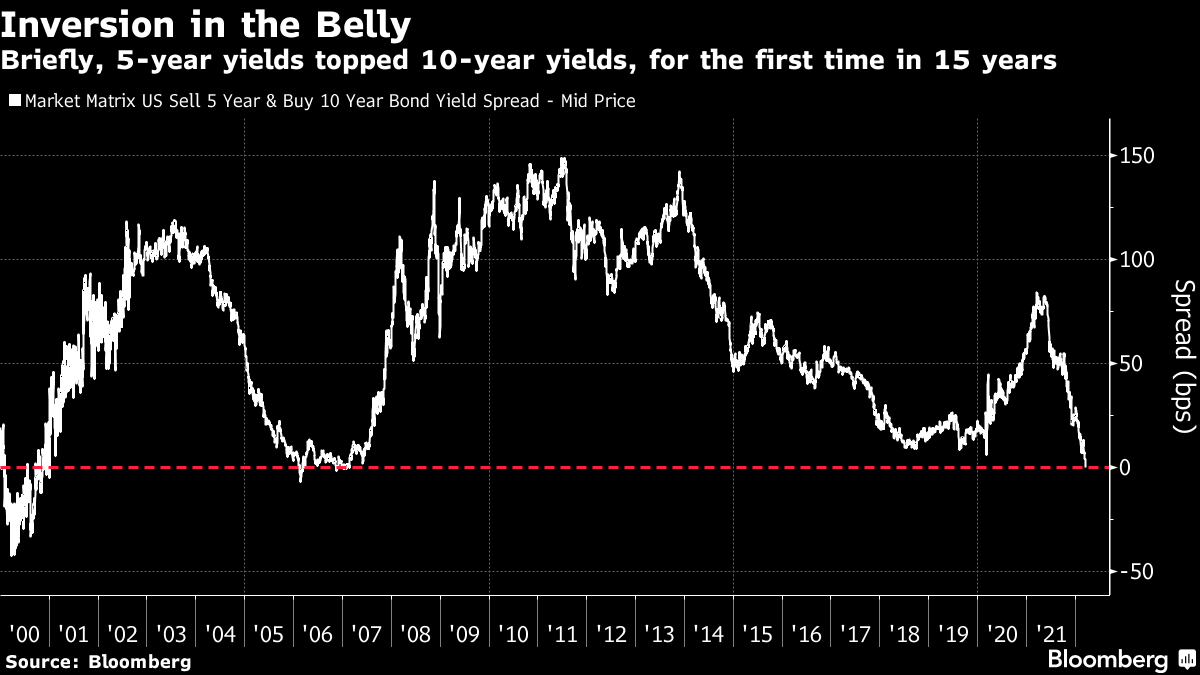
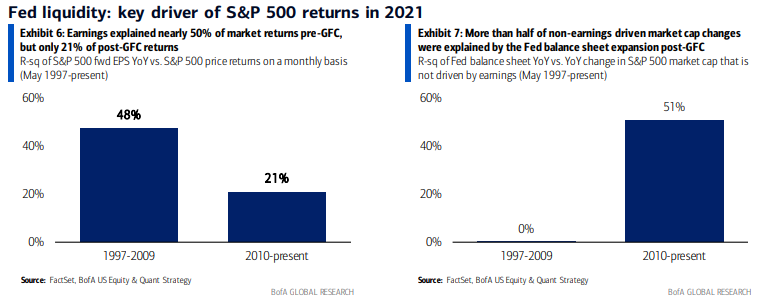
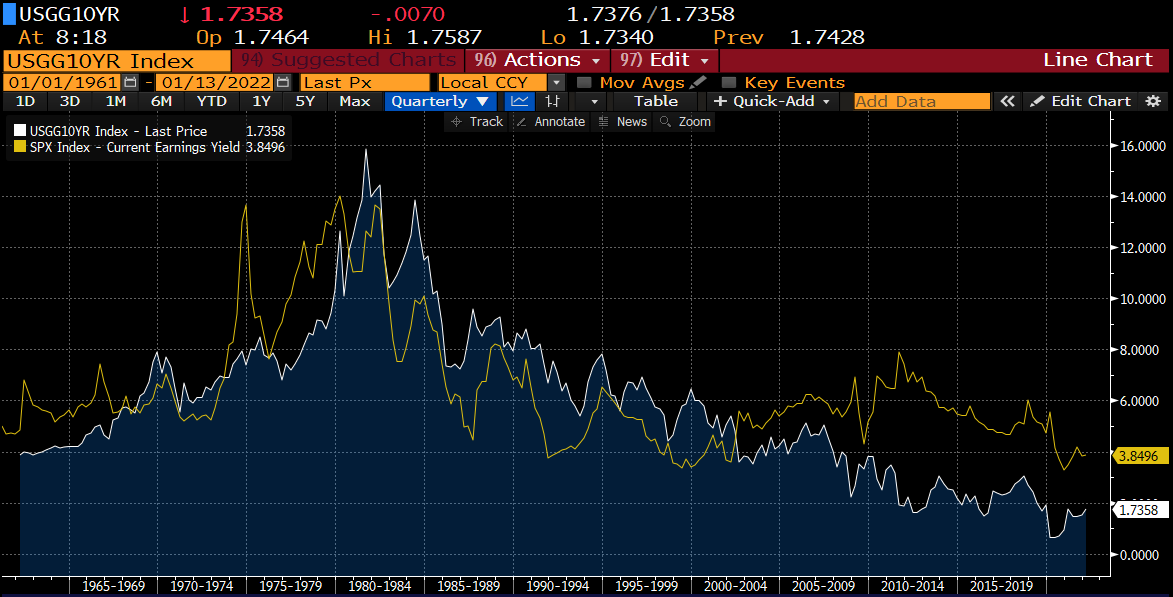
With that, we note that when bonds rise in value, their yields decline; “when the Fed embarks on bond-buying program[s] to support the U.S. economy, … [it nudges] the prices of these assets higher while pushing yields lower, which also has the effect of driving yield-hungry investors into relatively riskier asset categories that promise high returns.”
As a result, participants’ demand for risk assets prompts their divergence from fundamentals. As liquidity is removed and funding costs increase, this may prompt risk assets to converge with fundamentals.
This is as, for investors to take on additional risk for return, they must receive in excess of the risk-free rate (as provided by the Treasury). This excess is the risk premium.
At present, according to commentary by Damped Spring’s Andy Constan, “Additional risk premium expansion pressures from these levels is not likely from news emanating from” Fed meetings.
“However, if, in the unlikely event, details of QT do emerge suggesting a start of QT before June and at a greater size than expected, we would no longer be willing to hold [risk] assets as that would cause an end to any risk premium contraction possibilities.”
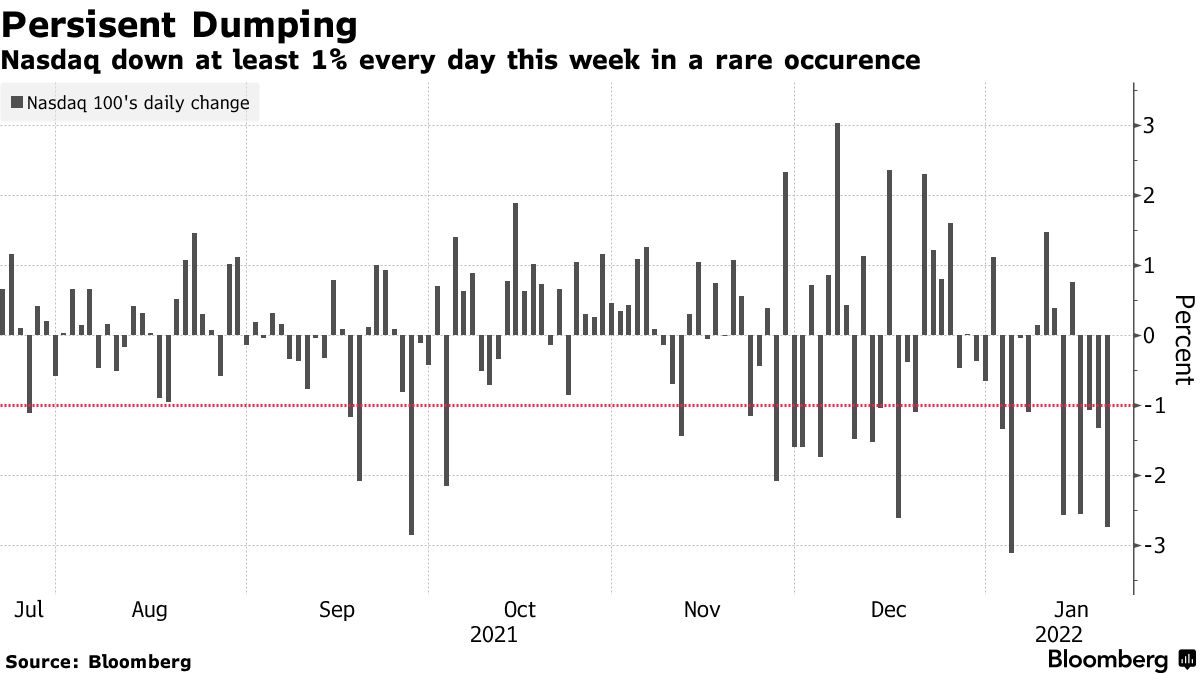
Positioning: According to Morgan Stanley’s (NYSE: MS) trade desk, institutions (e.g., volatility targeting funds and trend following commodity-trading advisers) dumped nearly $200 billion in global equities over the first two months of 2022.
Hedge funds’ net leverage, too, “fell 7.5 percentage points over the two weeks through March 11, the largest decrease over any comparable period since at least January 2016,” according to Goldman Sachs Group Inc (NYSE: GS).
“Institutional traders, major money managers, asset managers, and hedge funds, their moves have to do with the current market conditions — a lot of volatility, a lot of uncertainty, inflation concerns, geopolitical concerns,” says Bloomberg’s Jackson Gutenplan.
“As the market continues to downtrend, institutions selling out of positions are overwhelming any retail buying pressure.”
Given this, as mentioned in the prior fundamentals section, strategists like JPM’s Kolanovic suggest these are some of the reasons to boost risk.
“Current risk positioning is very light. This is a result of high and persistent volatility, and risk aversion caused by global geopolitical developments,” Kolanovic says. “And for this reason, risks are skewed to the upside.”
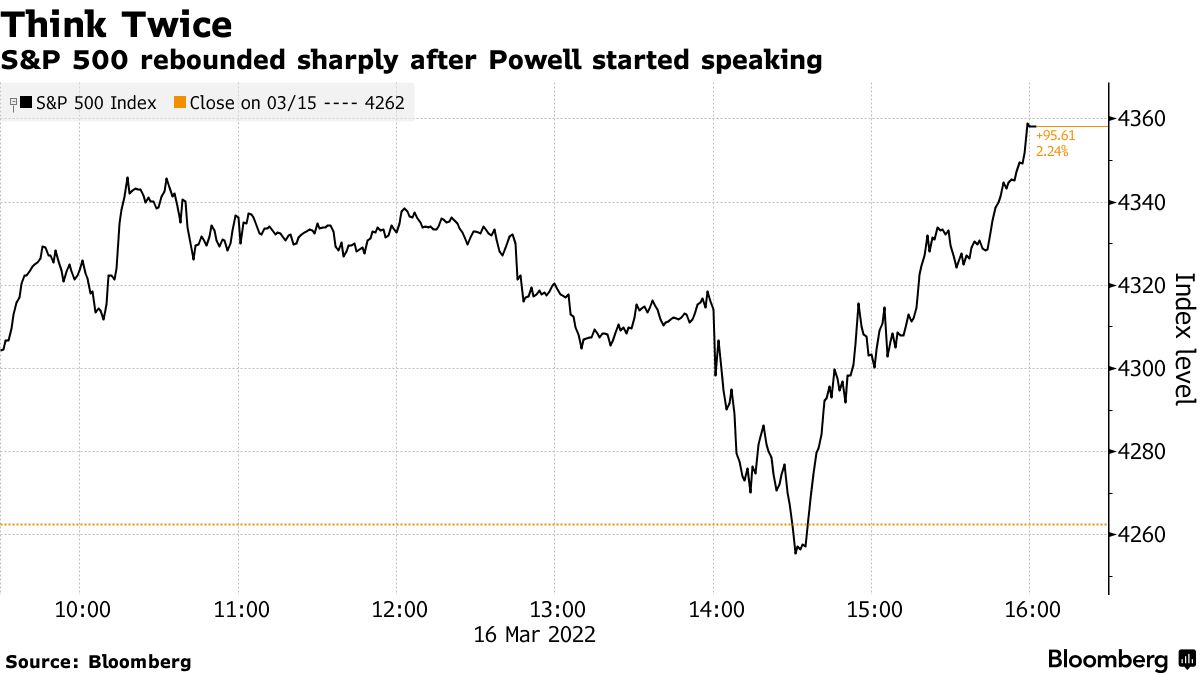
And so, alongside the buying of futures and stock to offset the decay of counterparty positive delta (post-FOMC and through OPEX), retail investor buying remained undeterred last week.
But, as Zephyr’s Ryan Nauman says, “even though retail has gained a lot of momentum over the past two years, institutional money still outweighs the retail money, and it’s still going to move markets.”
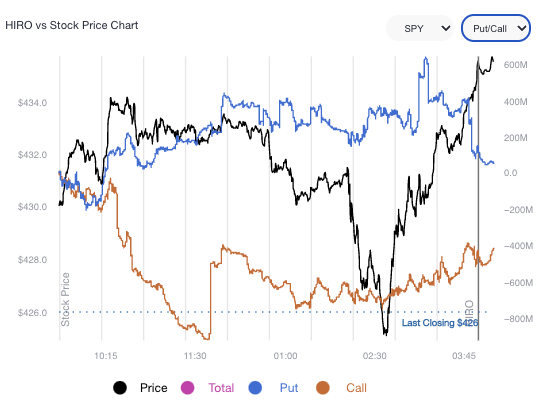
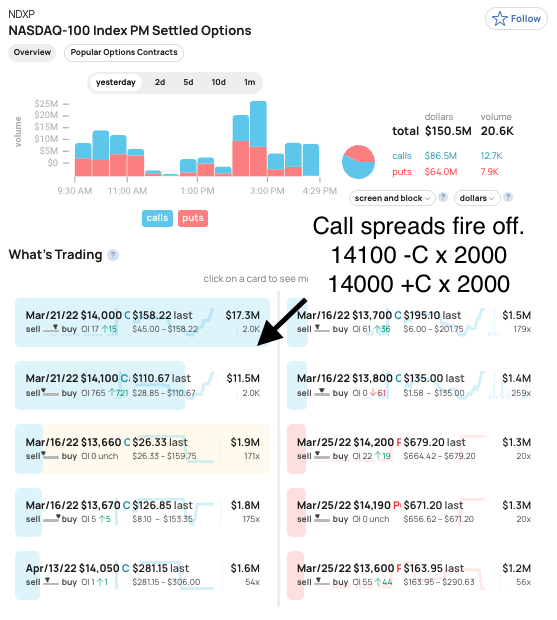
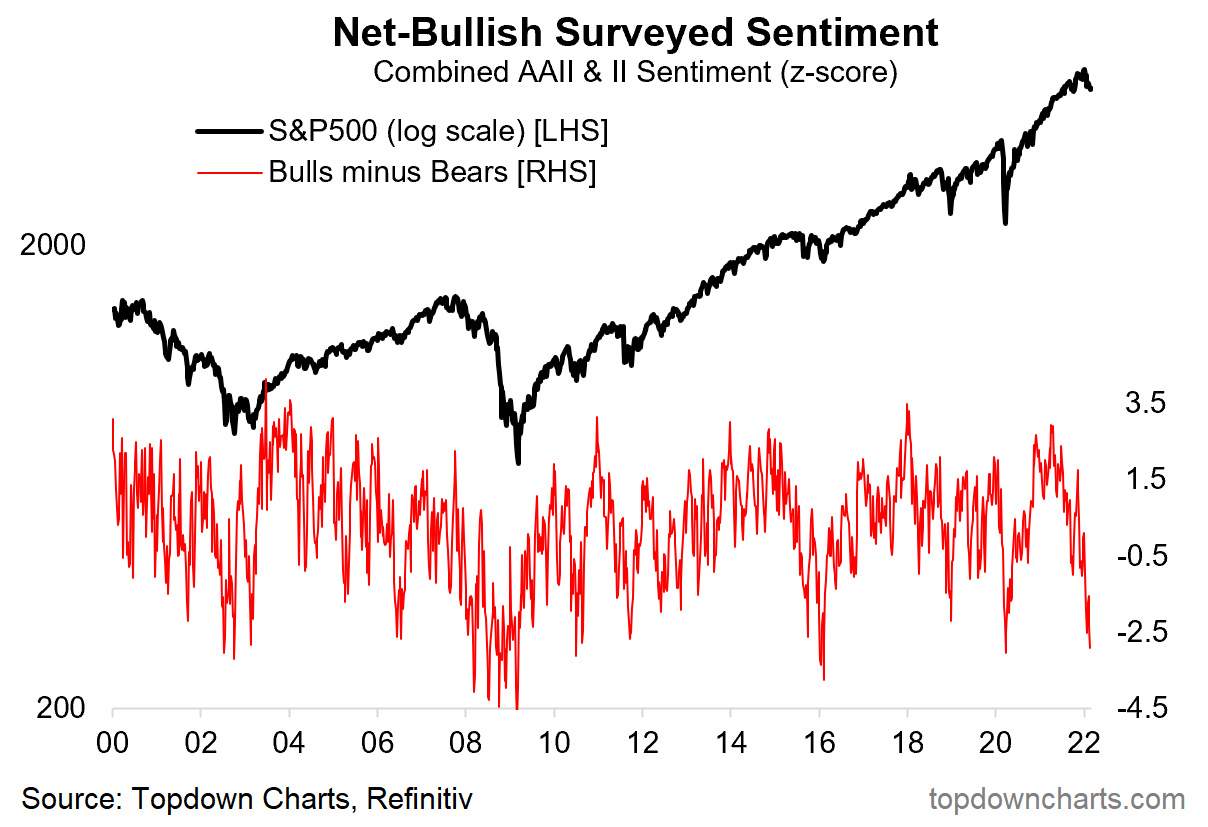
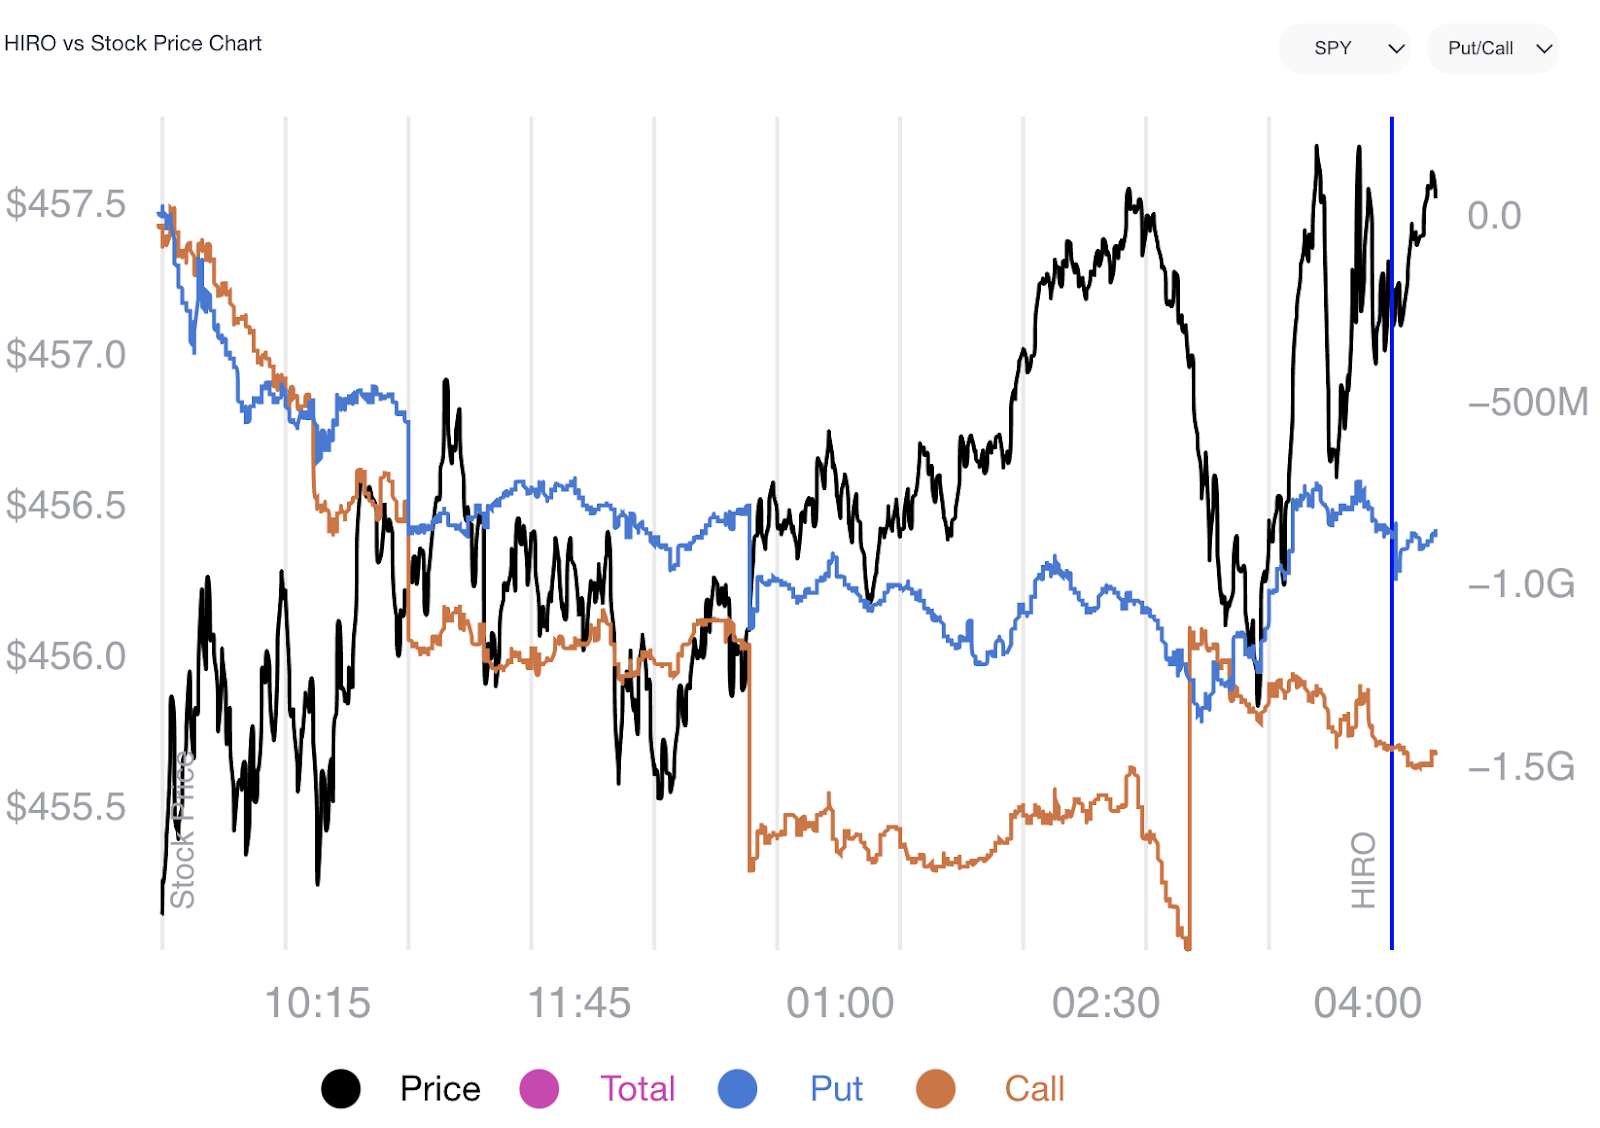
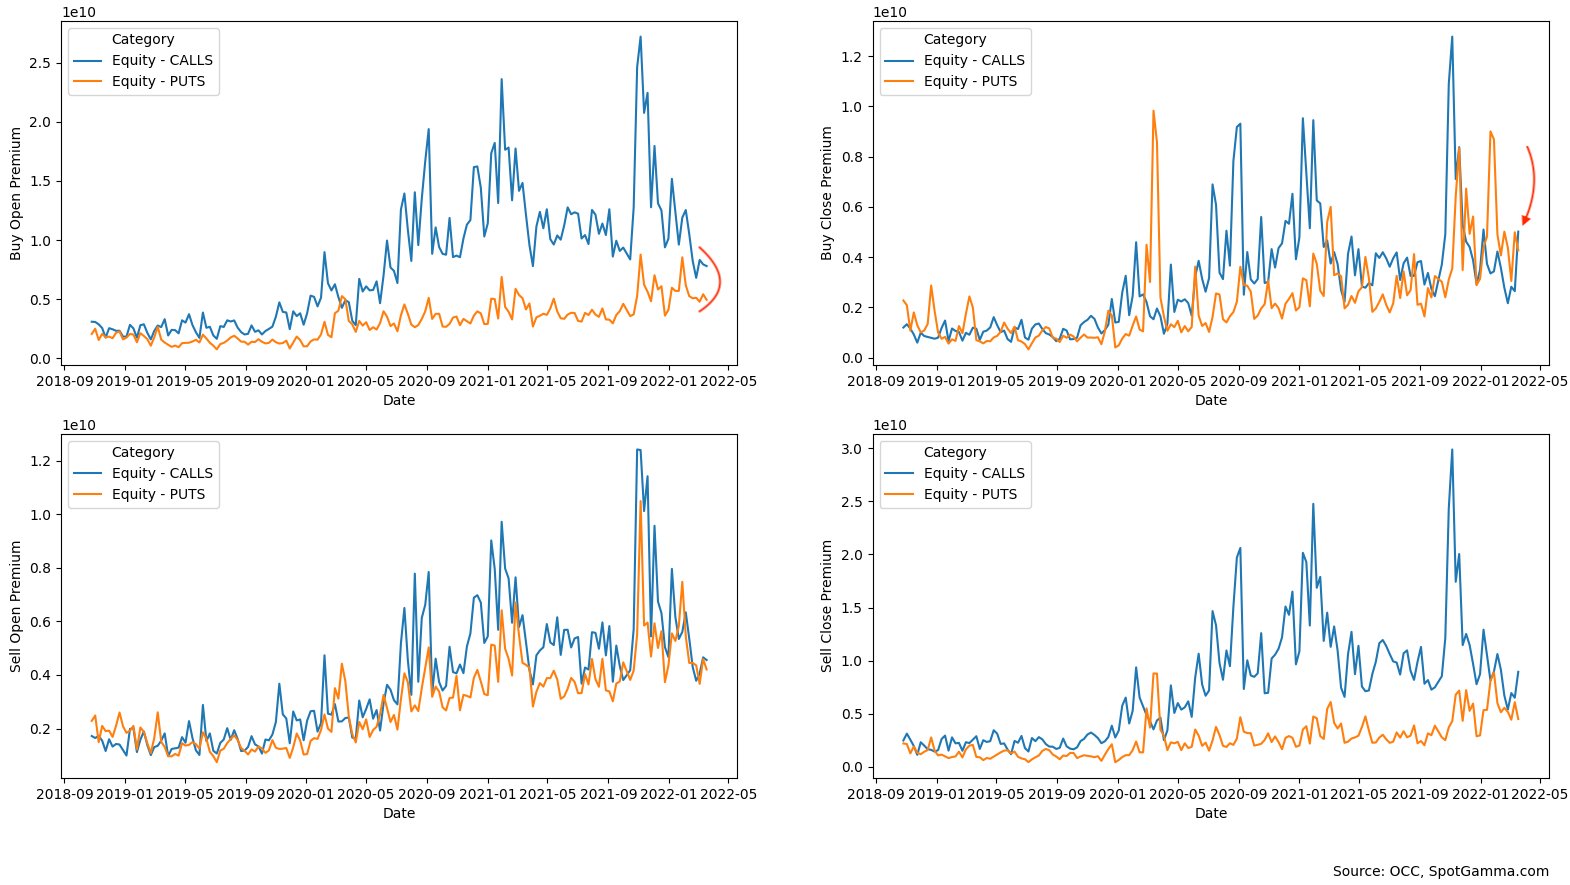
That is in the face of lackluster options activity. According to SpotGamma, call-buying, a feature of sustained bull markets “was at lows going back to 2020,” last week.
“Maybe you get to an extreme bearishness, and that’s usually where you bottom out,” adds Liz Young of SoFi Technologies Inc (NASDAQ: SOFI) in a statement on mom-and-pop investors eventually following institutional selling trends.
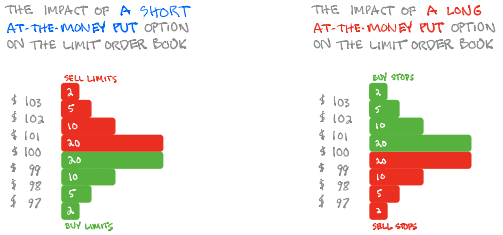
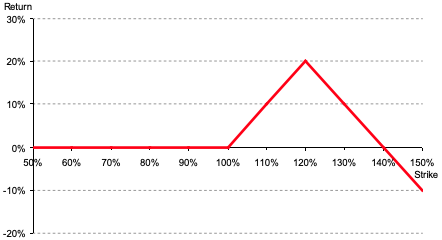
As this commentary has said before, a way to participate in the upside (while lowering debit risk) is through complex options structures, such as the ratio spread. Note, ratio spreads may carry margin risk, depending on the structure, resulting in undefined losses, potentially.
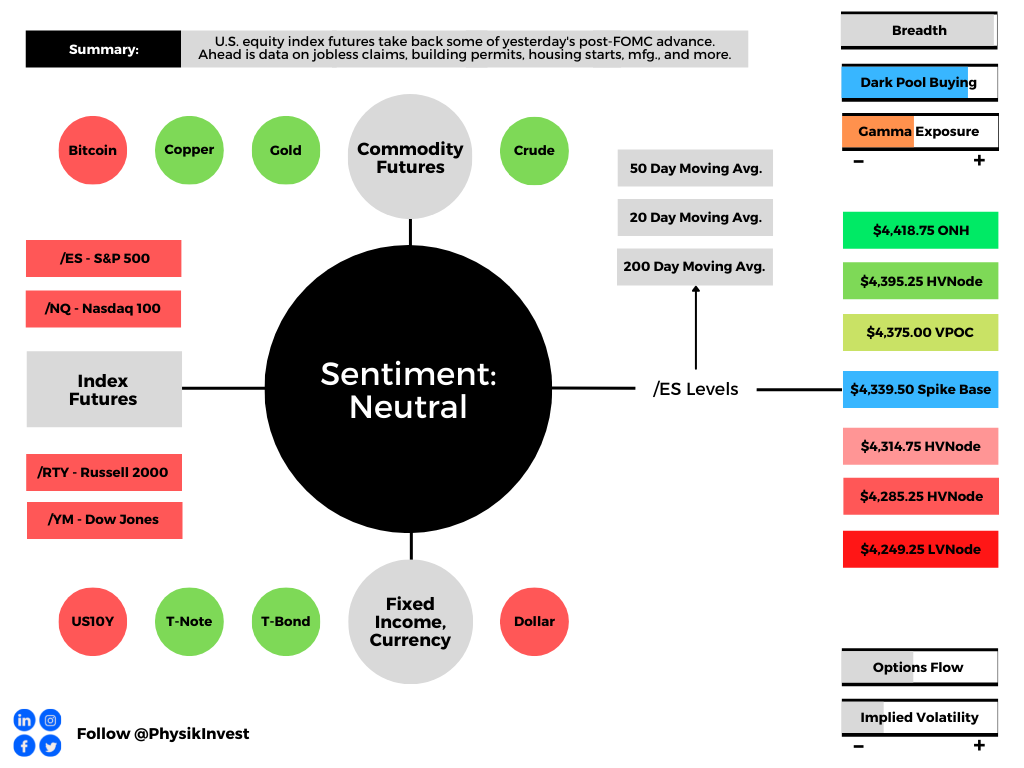
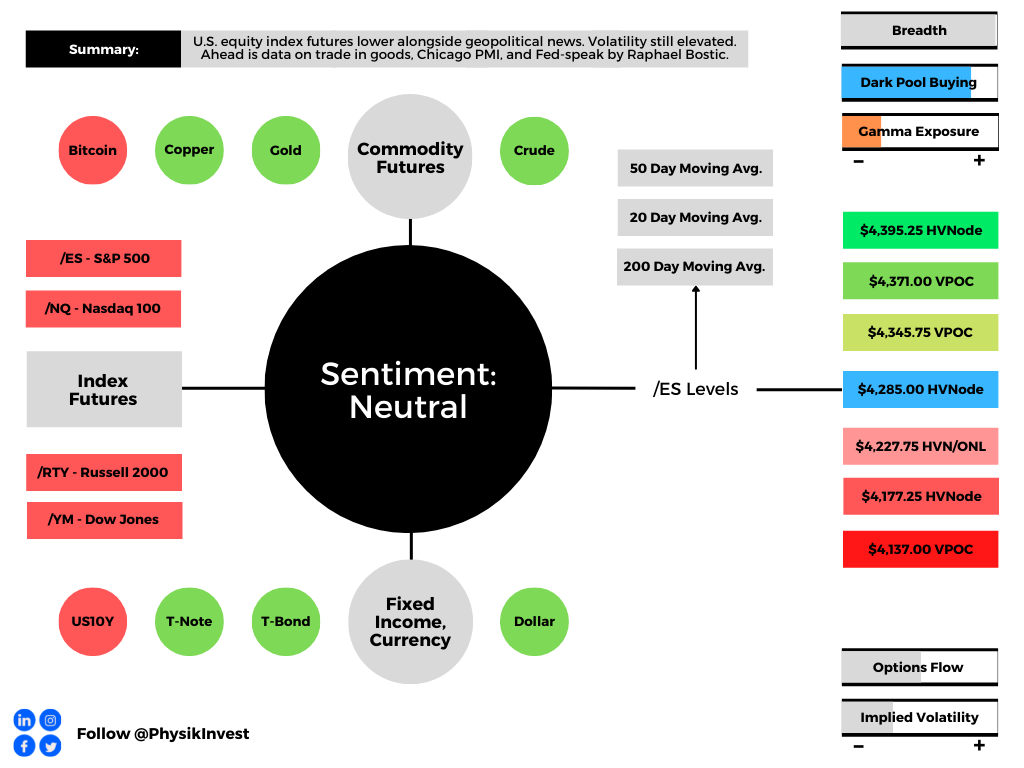
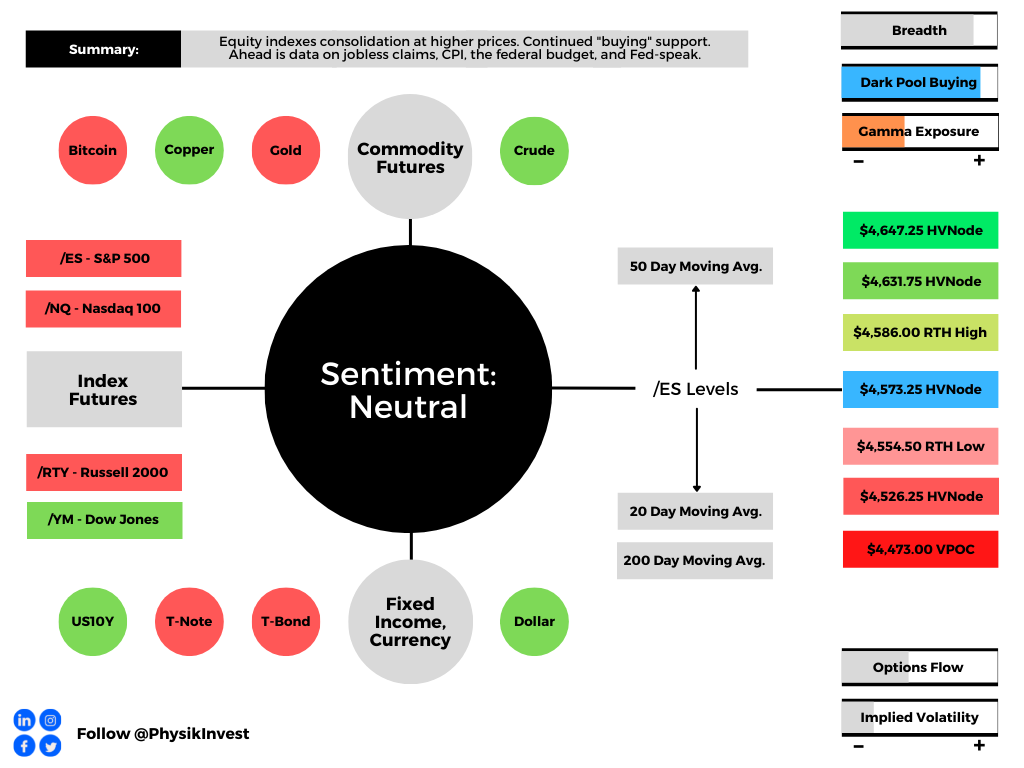
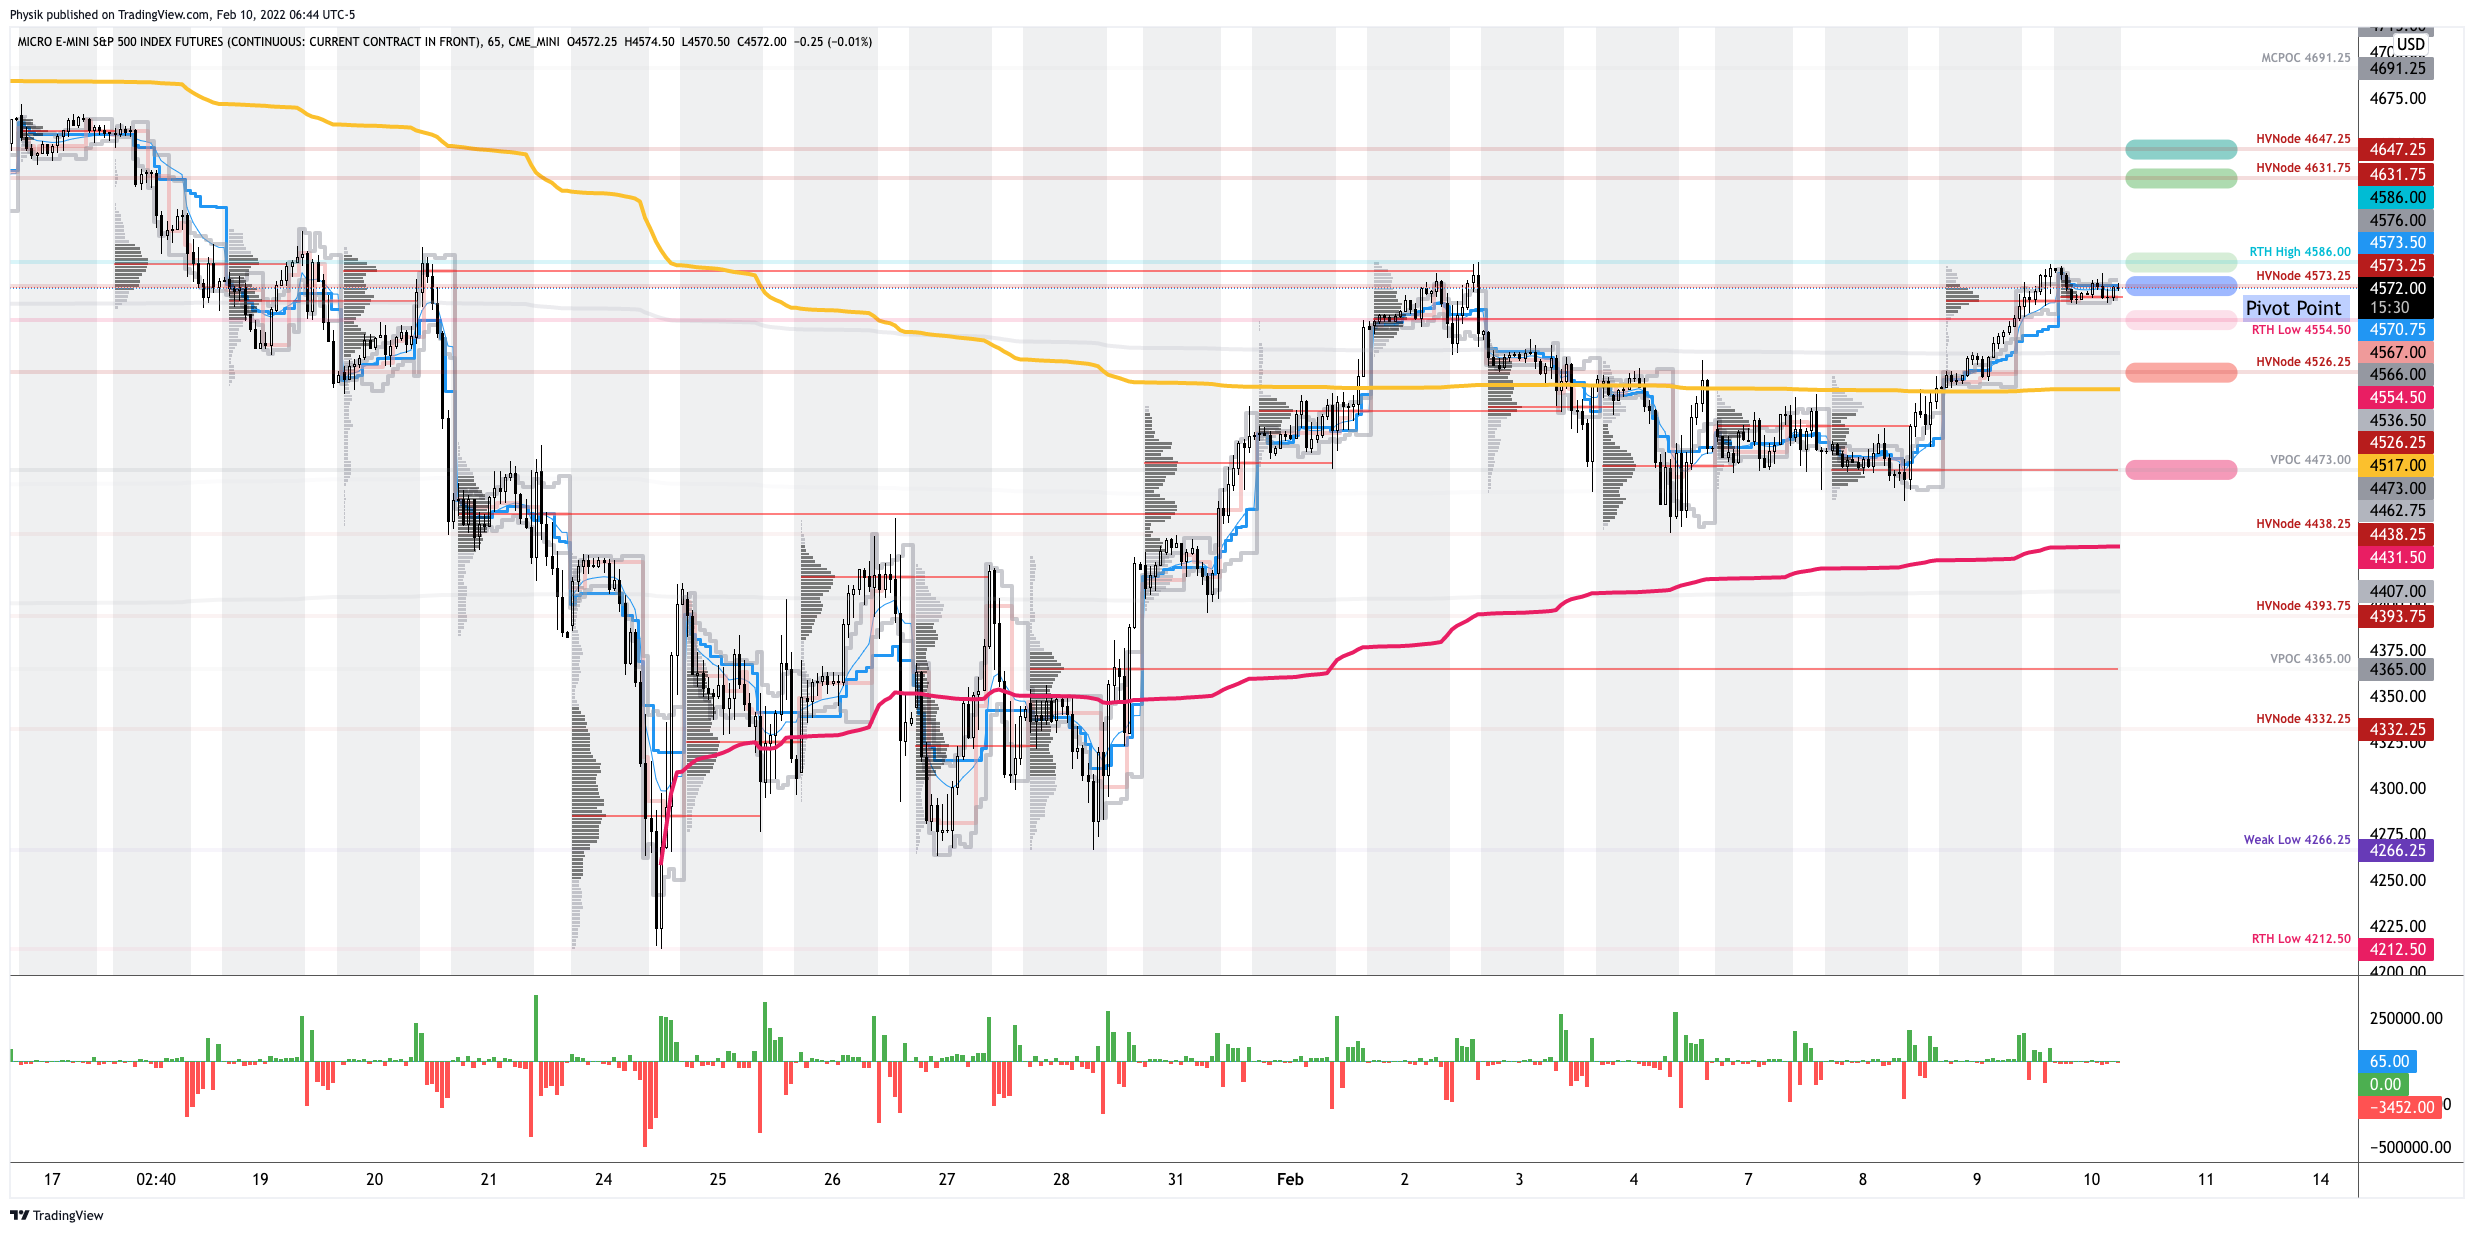
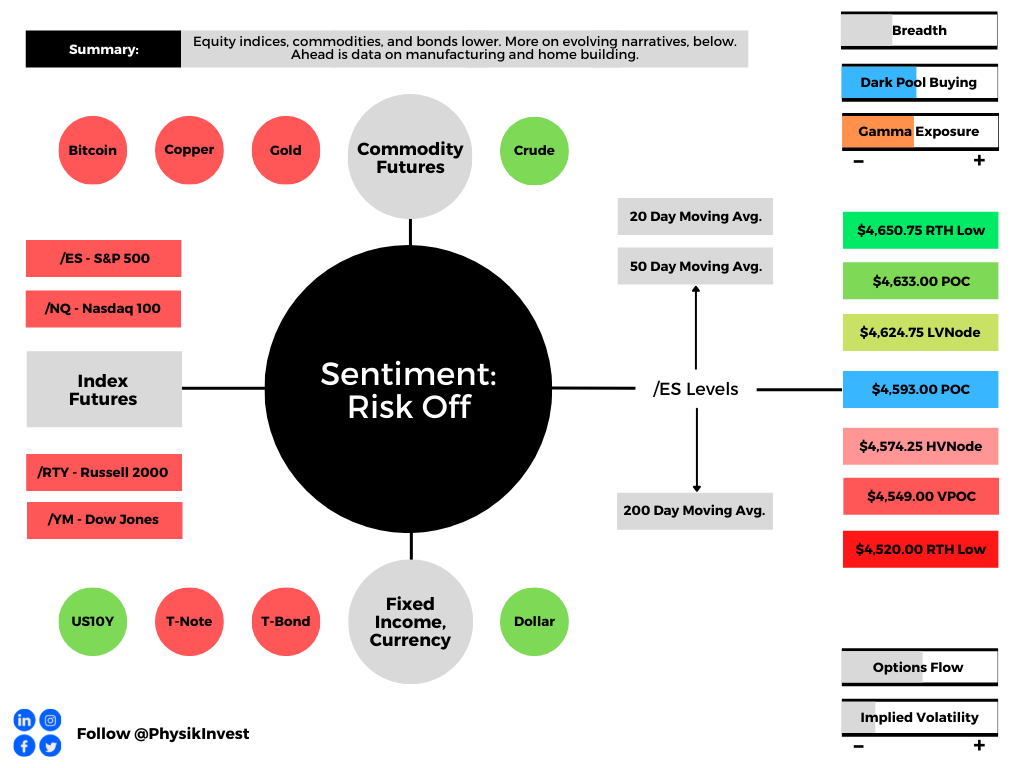
Technical: As of 6:30 AM ET, Monday’s regular session (9:30 AM – 4:00 PM ET), in the S&P 500, will likely open in the middle part of a negatively skewed overnight inventory, inside of prior-range and -value, suggesting a limited potential for immediate directional opportunity.
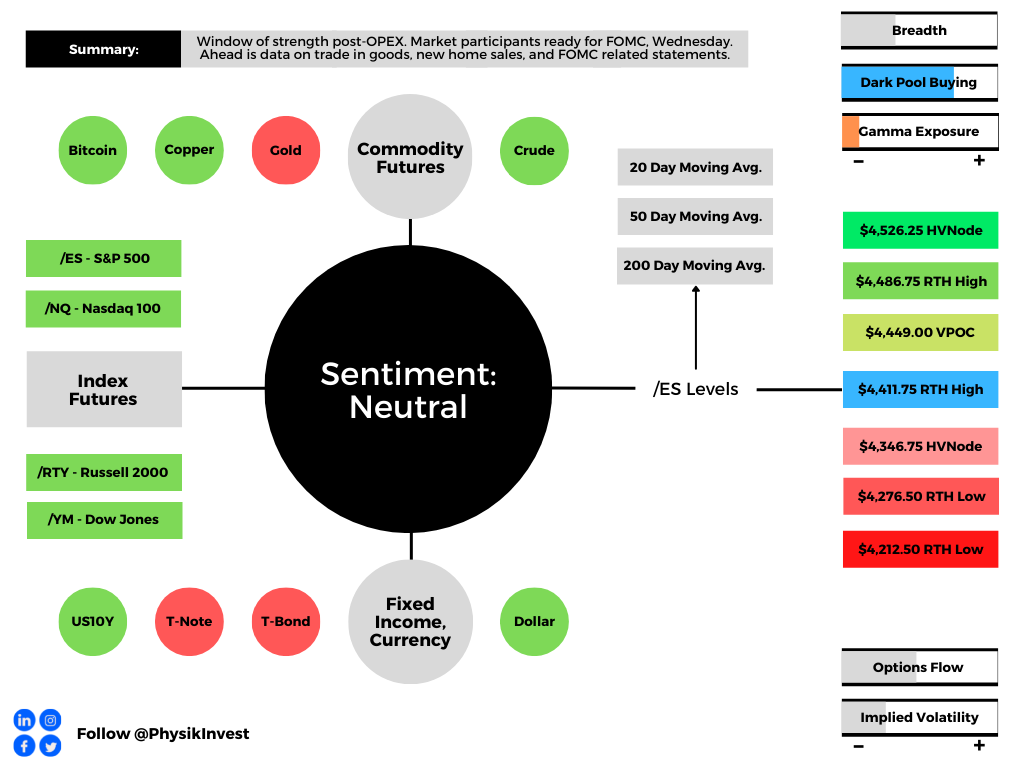
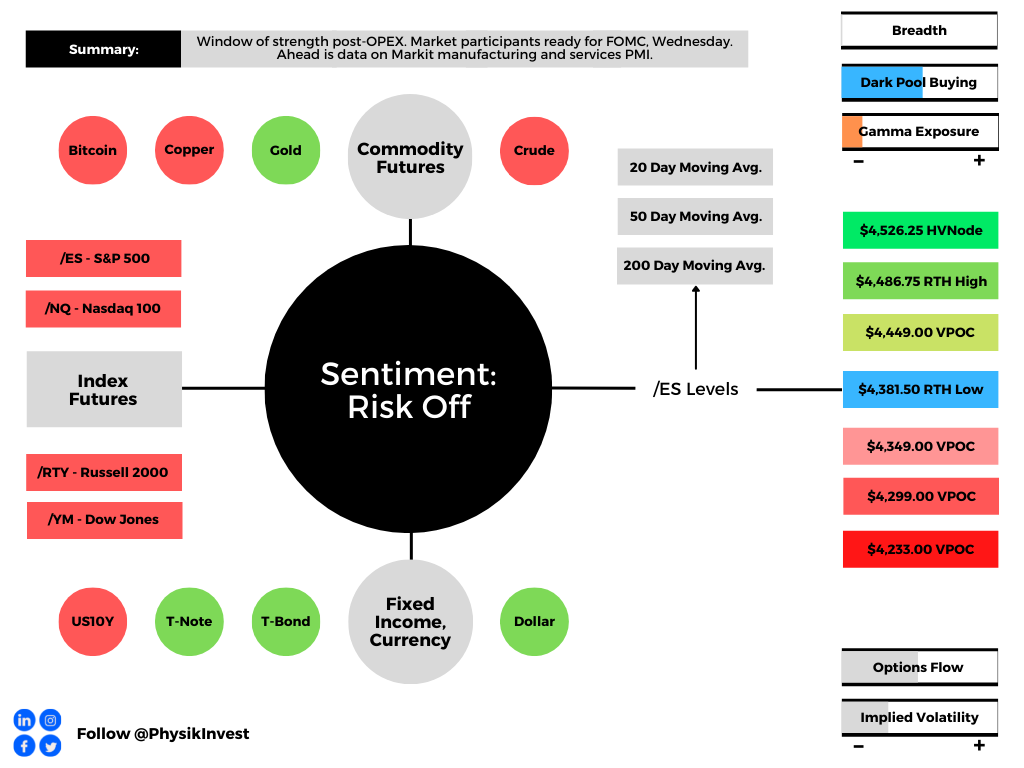
In the best case, the S&P 500 trades higher; activity above the $4,438.25 high volume area (HVNode) puts in play the $4,466.00 regular trade high (RTH High). Initiative trade beyond the RTH High could reach as high as the $4,499.00 untested point of control (VPOC) and $4,526.25 HVNode, or higher.
In the worst case, the S&P 500 trades lower; activity below the $4,438.25 HVNode puts in play the $4,409.00 VPOC. Initiative trade beyond the VPOC could reach as low as the $4,395.25 HVNode and $4,355.00 VPOC, or lower.
Considerations: Push-and-pull, as well as responsiveness near key-technical areas (that are discernable visually on a chart), suggests technically-driven traders with short time horizons are very active.
Such traders often lack the wherewithal to defend retests and, additionally, the type of trade may be indicative of the other time frame participants waiting for more information to initiate trades.
Click here to load today’s key levels into the web-based TradingView charting platform. Note that all levels are derived using the 65-minute timeframe. New links are produced, daily.

Definitions
Volume Areas: A structurally sound market will build on areas of high volume (HVNodes). Should the market trend for long periods of time, it will lack sound structure, identified as low volume areas (LVNodes). LVNodes denote directional conviction and ought to offer support on any test.
If participants were to auction and find acceptance into areas of prior low volume (LVNodes), then future discovery ought to be volatile and quick as participants look to HVNodes for favorable entry or exit.
POCs: POCs are valuable as they denote areas where two-sided trade was most prevalent in a prior day session. Participants will respond to future tests of value as they offer favorable entry and exit.
About
After years of self-education, strategy development, mentorship, and trial-and-error, Renato Leonard Capelj began trading full-time and founded Physik Invest to detail his methods, research, and performance in the markets.
Capelj also develops insights around impactful options market dynamics at SpotGamma and is a Benzinga reporter.
Some of his works include conversations with ARK Invest’s Catherine Wood, investors Kevin O’Leary and John Chambers, FTX’s Sam Bankman-Fried, Kai Volatility’s Cem Karsan, The Ambrus Group’s Kris Sidial, among many others.
Disclaimer
In no way should the materials herein be construed as advice. Derivatives carry a substantial risk of loss. All content is for informational purposes only.