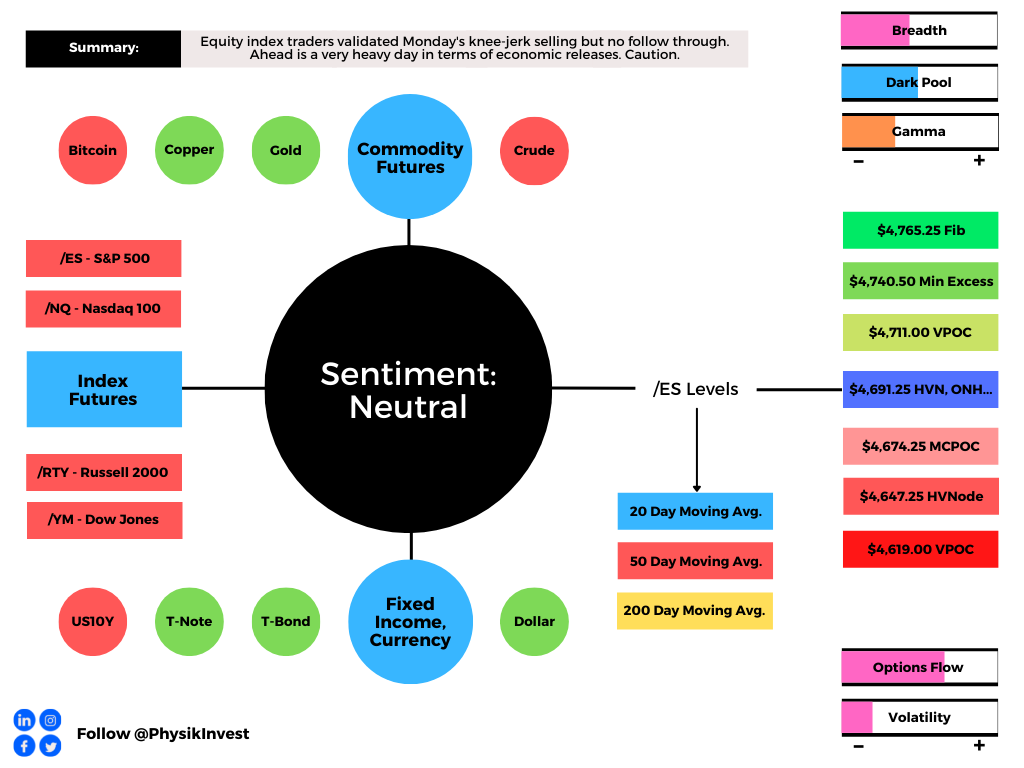
What Happened
Overnight, equity index futures auctioned within the confines of Tuesday’s range, unable to follow through on attempts higher or lower. This comes as there was a clear validation of Monday’s knee-jerk selling.
This sideways-to-lower price action in the index products is happening alongside a sell-off in new issues and richly priced technology stocks. Part of the weakness may have something to do with investors booking capital losses to lower their capital gains.
The other part of it, according to Bloomberg, is an exodus among professional investors who were counting on high-flyers to salvage their year.
“There was a desire to kind of keep up with the broader index. And there was definitely a view that those are higher-beta assets and that’s a way to try and play a little bit of catch-up,” Barclays Plc’s (NYSE: BCS) Todd Sandoz said. “When the market turns and it’s not working, you need to take risks down. And everybody’s in those names, so you also probably have a view to try to cut things faster.”
With indices pinned and heavily weighted constituents sideways to higher, there is only one form of reconciliation – a decline in correlation. Nonetheless, fundamentals are no different; investors may be able to buy quality stocks at a discount amidst the market’s entry into a seasonally bullish period.
Buybacks and increased retail engagement, resilient activity, and macro metrics, as well as excess liquidity, in the face of central bank cautiousness, suggest “dips should be bought,” according to Barclays.
Ahead is data on jobless claims, GDP, durable and core capital goods orders, and trade in goods (8:30 AM ET). Thereafter is data on personal and disposable income, consumer spending, core inflation, home sales, sentiment, and 5-year inflation expectations (10:00 AM ET). FOMC minutes come later (2:00 PM ET).
What To Expect
On divergent intraday breadth and market liquidity metrics, the worst-case outcome occurred, evidenced by an acceptance of Monday’s knee-jerk, high-tempo selling.
Though this activity marks a potential willingness to start trending lower, the nature of Monday’s liquidation, as well as the failure to follow-through (i.e., expand the range to the downside) forces us to question whether participants have it in them to push indices lower.
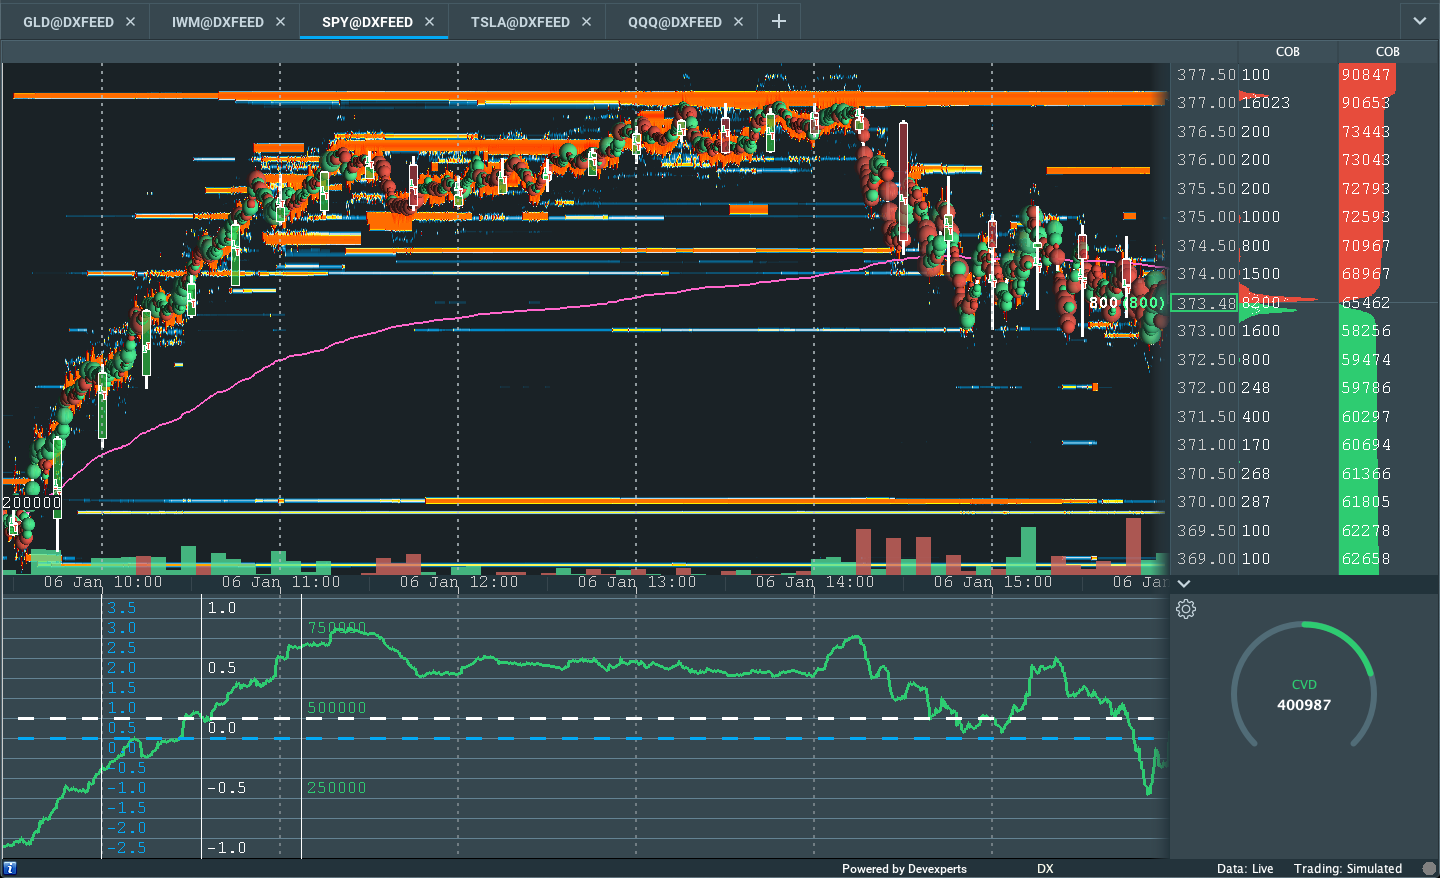
In light of the activity we’re seeing, it’s tough to pick a direction and stick with it; the higher odds play, in light of the divergences we’re seeing in breadth metrics between exchanges, as well as market liquidity (below), is to responsively buy dips and sell rips.
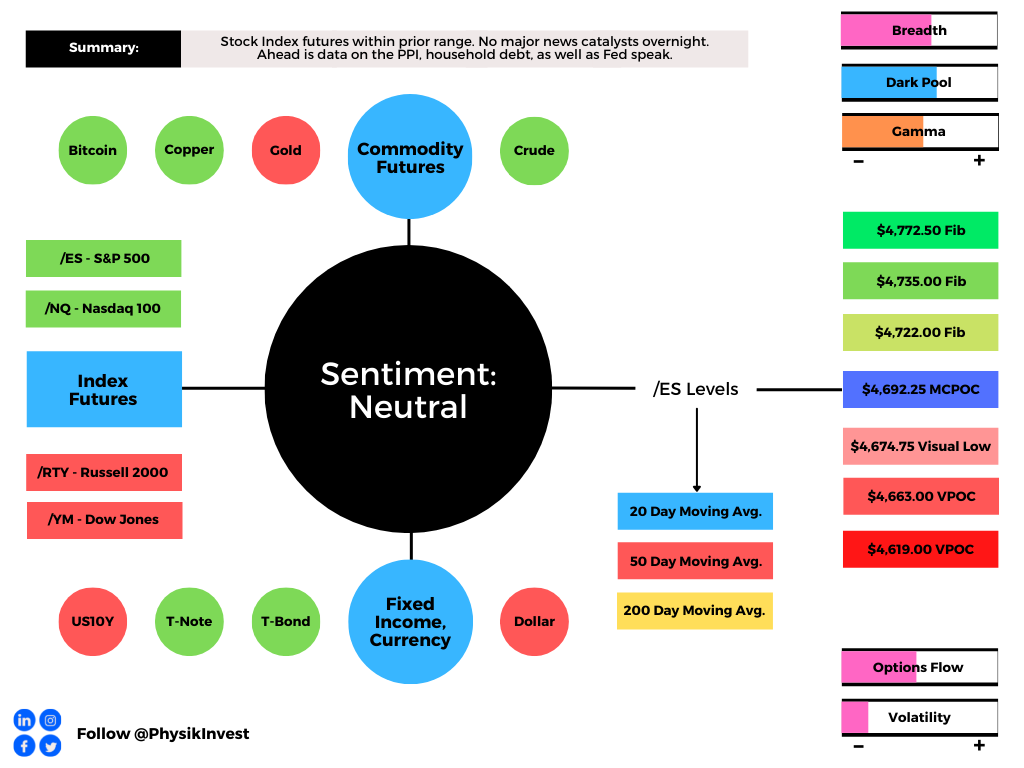
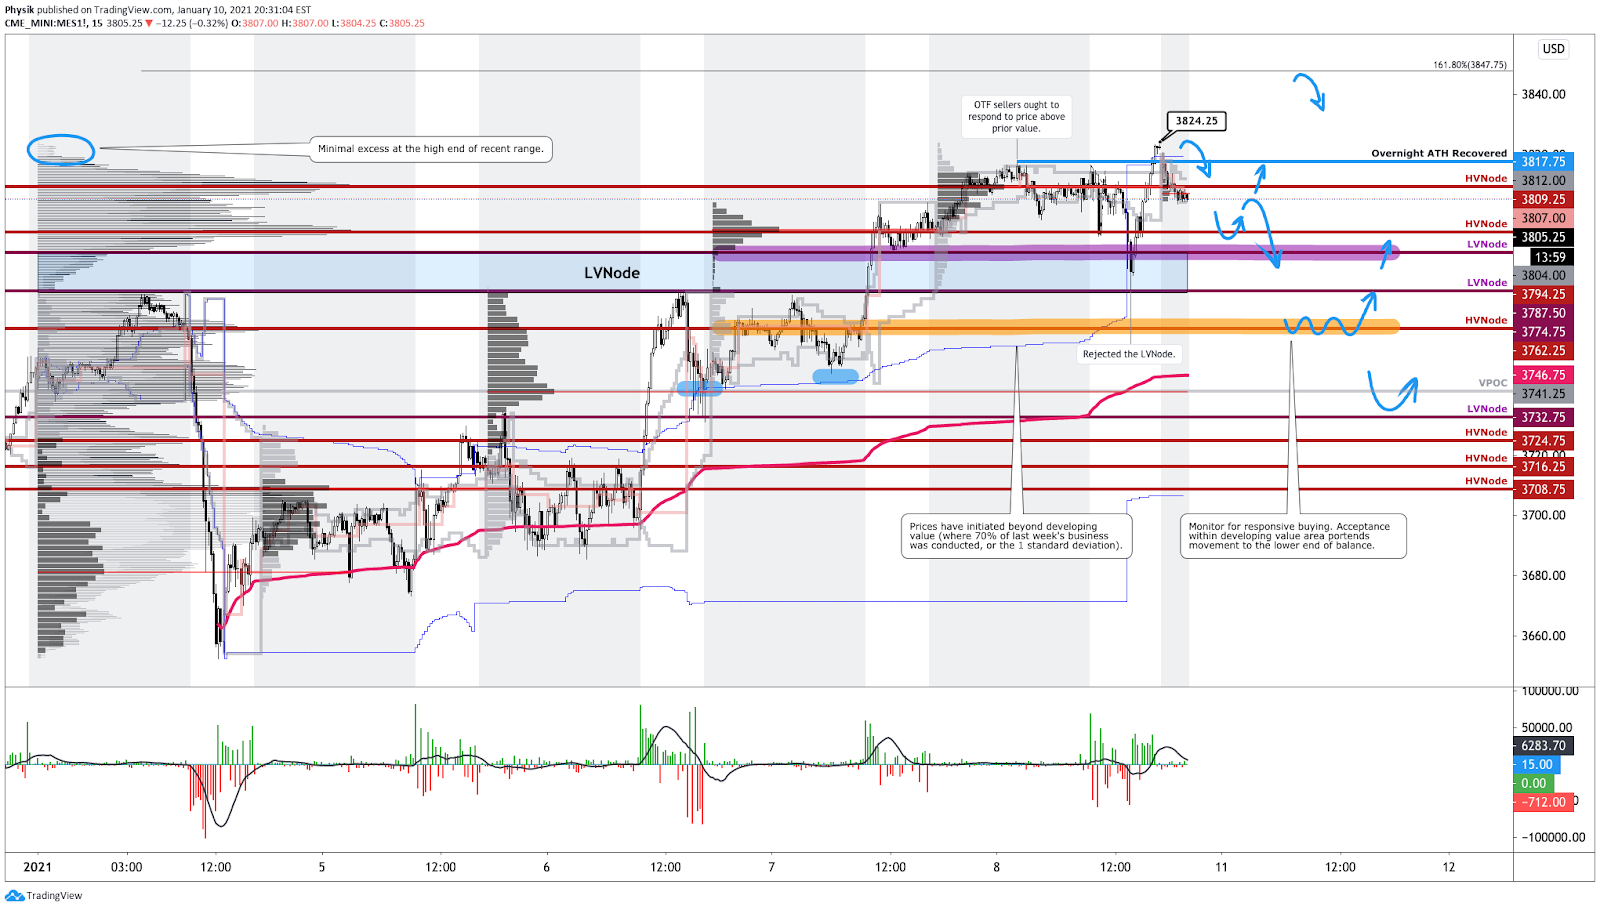
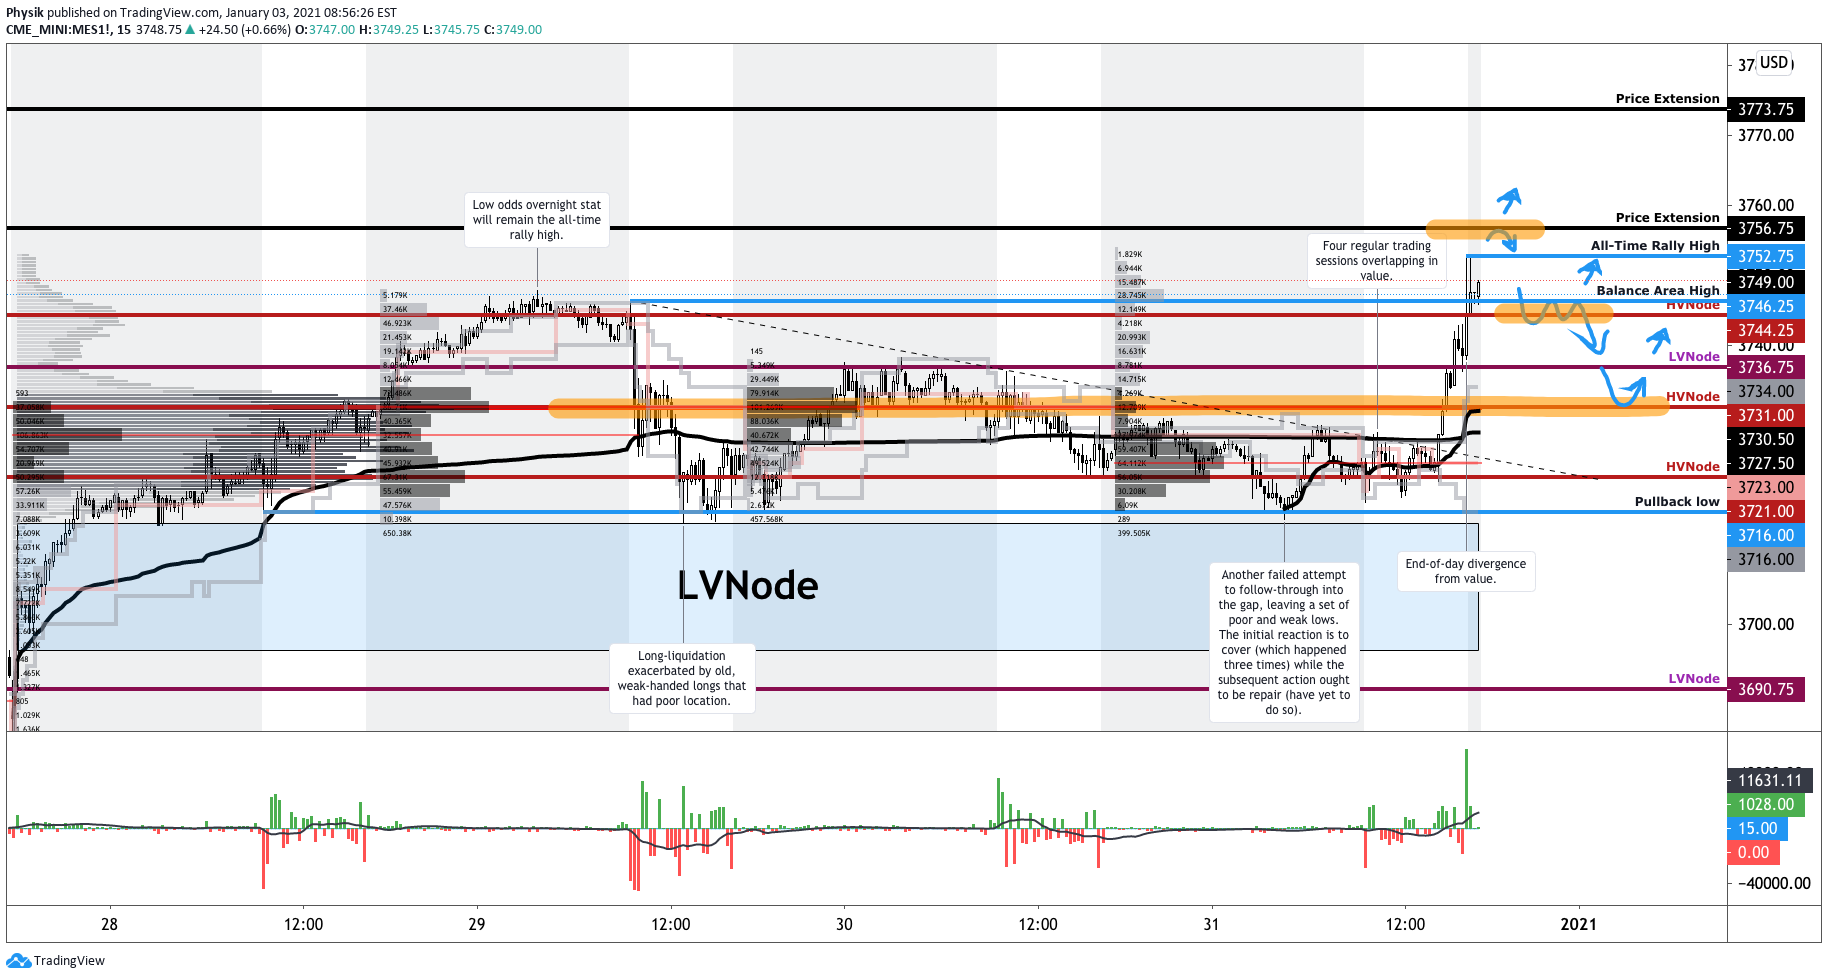
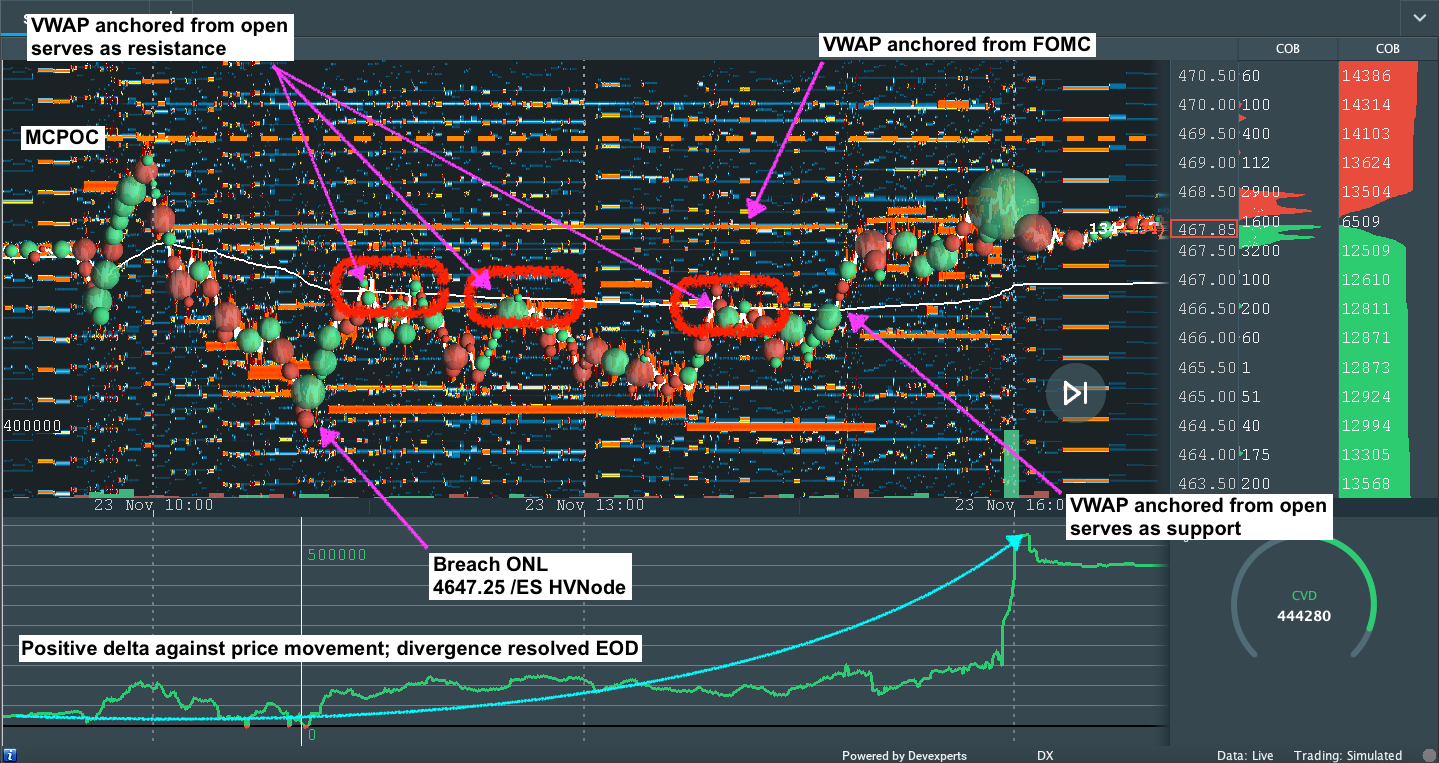
Key levels to trade against are the high volume areas (HVNodes) at $4,691.25 and $4,647.25. The latter level corresponds with the 20-day simple moving average.
These levels are the clearest ways to measure risk, given the mechanical responses in prior trade. Should participants manage to break past either level, then conditions have changed. Follow-through is likely. Reason being? Those visual levels are acted on by short-term, technically-driven market participants who generally are unable to defend retests.
Context: Keeping this section very short.
We saw the CBOE Volatility Index (INDEX: VIX) end higher, yesterday.
However, supply came in across the entire area of the VIX futures term structure. That, with the long-gamma environment (defined below), suggests participants are not reaching for hedges.
For the time being, that’s stabilizing, cognizant of the fact that exuberance in individual stocks, over the past weeks, fed into the stock indices themselves.
Further, the price action we’re seeing is likely the resolve of some of that weak breadth we were seeing, recently, in addition to some of the topics discussed at the beginning of this newsletter.
In short, however, should volatility continue to pick up, those participants (who were once exuberant) may reach for protection forcing dealers to reflexively hedge in a destabilizing manner.
Once that protection rolls off the table (expires and/or is monetized), dealers will reverse and support the market, buying-to-close existing stock/futures hedges to negative gamma positions.
This flow is stabilizing and may support a seasonally-aligned rally into Christmas.
Expectations: As of 6:00 AM ET, Wednesday’s regular session (9:30 AM – 4:00 PM ET), in the S&P 500, will likely open in the middle part of a negatively skewed overnight inventory, inside of prior-range and -value, suggesting a limited potential for immediate directional opportunity.
Spike Scenario In Play: A spike marks the beginning of a break from value. Spikes higher (lower) are validated by trade at or above (below) the spike base (i.e., the origin of the spike).

The spike may also be looked at as a pivot; in today’s case, the spike base is $4,697.50.
In the best case, the S&P 500 trades sideways or higher; activity above the $4,691.25 high volume area (HVNode) puts in play the $4,711.00 untested point of control (VPOC). Initiative trade beyond the VPOC could reach as high as the $4,740.50 minimal excess high and $4,765.25 Fibonacci, or higher.
In the worst case, the S&P 500 trades lower; activity below the $4,691.25 HVNode puts in play the $4,674.25 micro composite point of control (MCPOC). Initiative trade beyond the MCPOC could reach as low as the $4,647.25 HVNode and $4,619.00 VPOC, or lower.
Click here to load today’s updated key levels into the web-based TradingView charting platform. Note that all levels are derived using the 65-minute timeframe. New links are produced, daily.

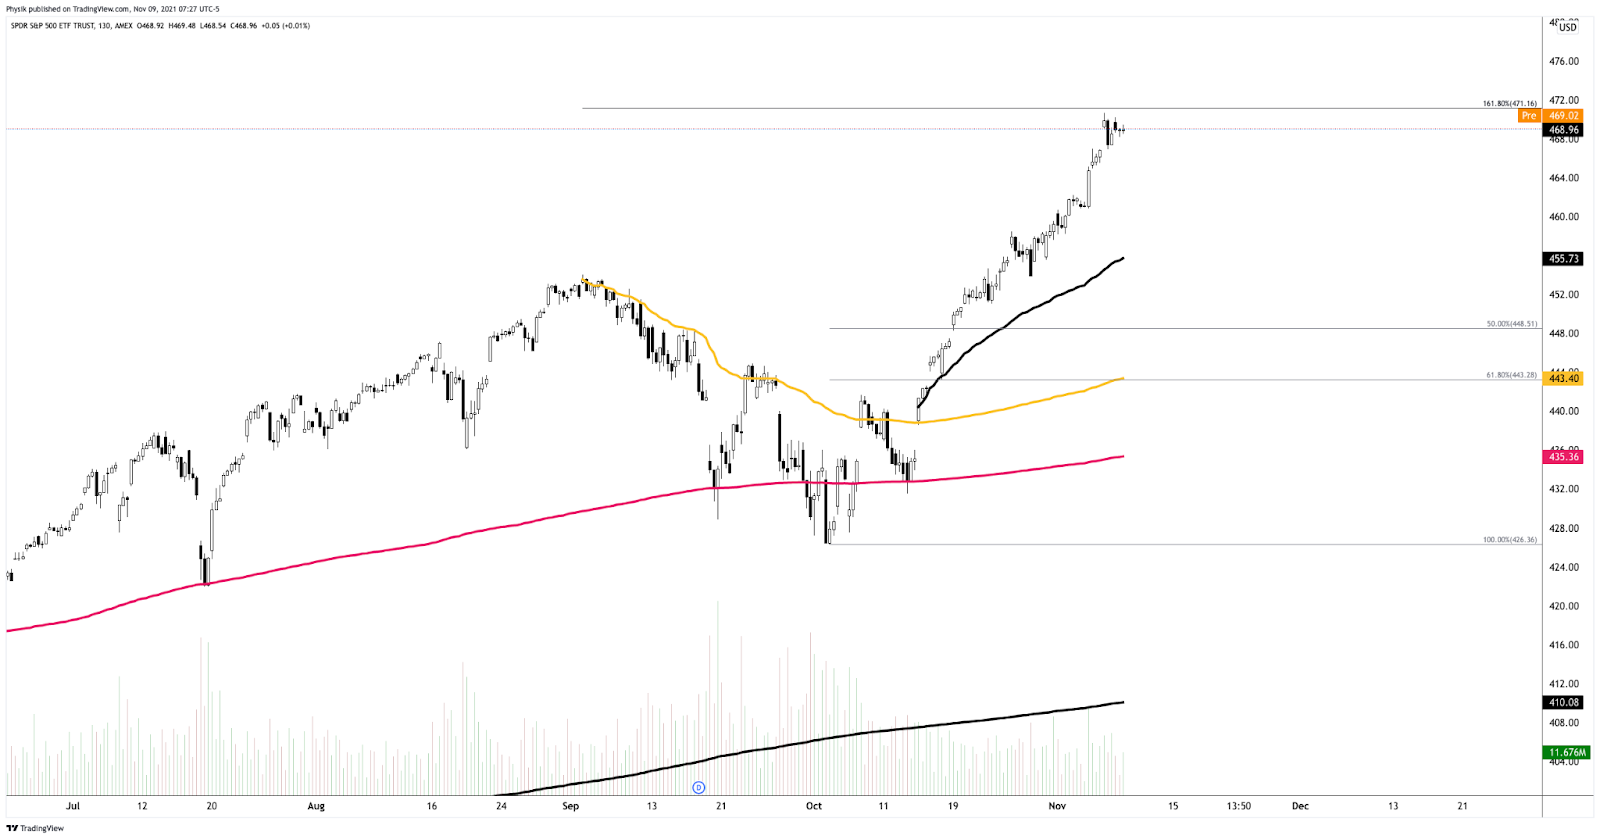
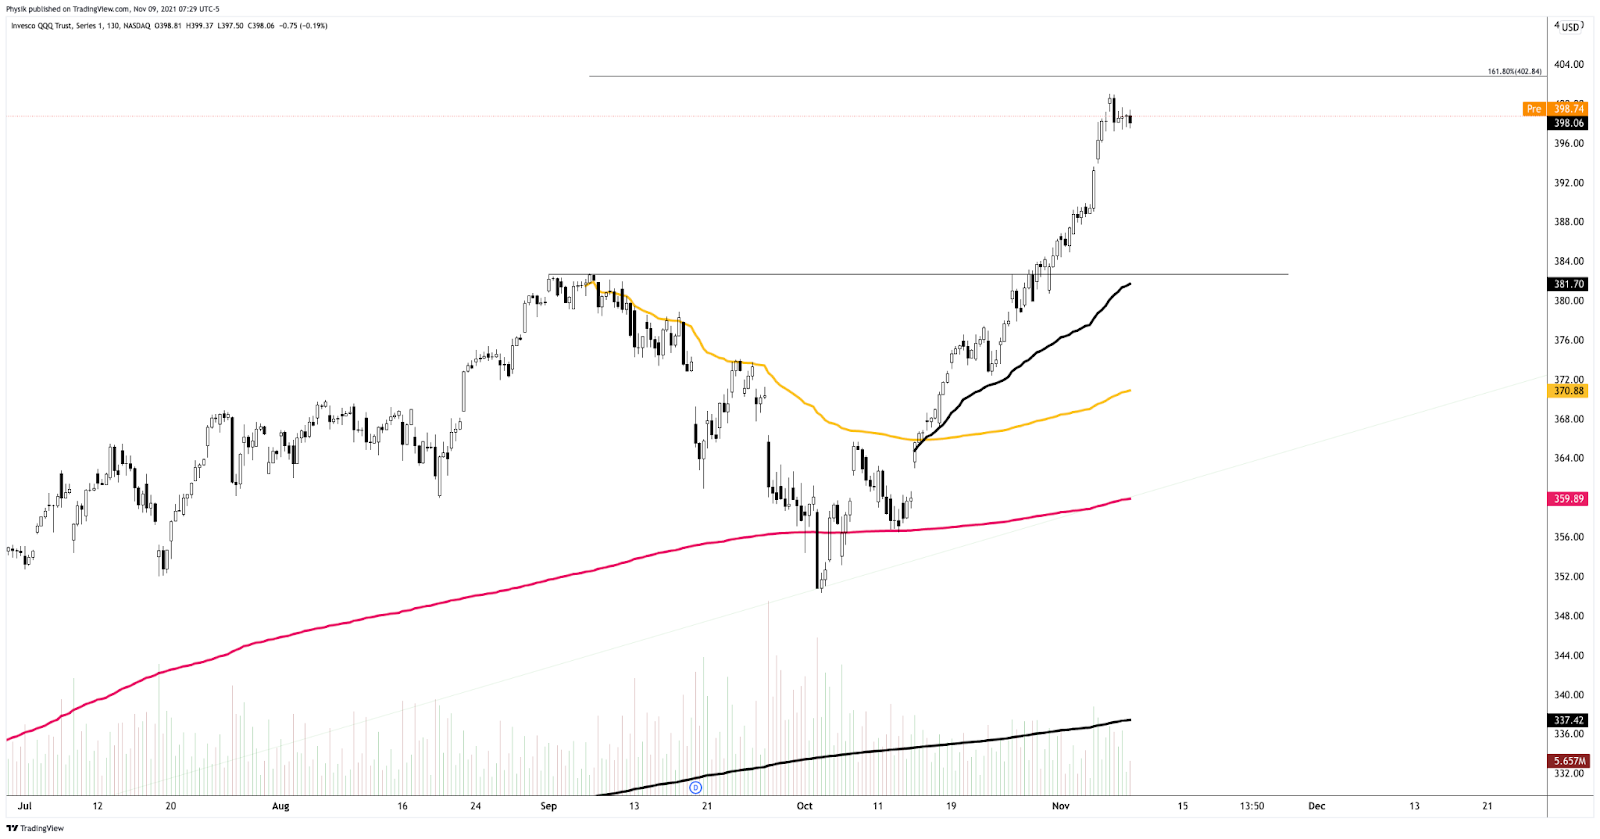
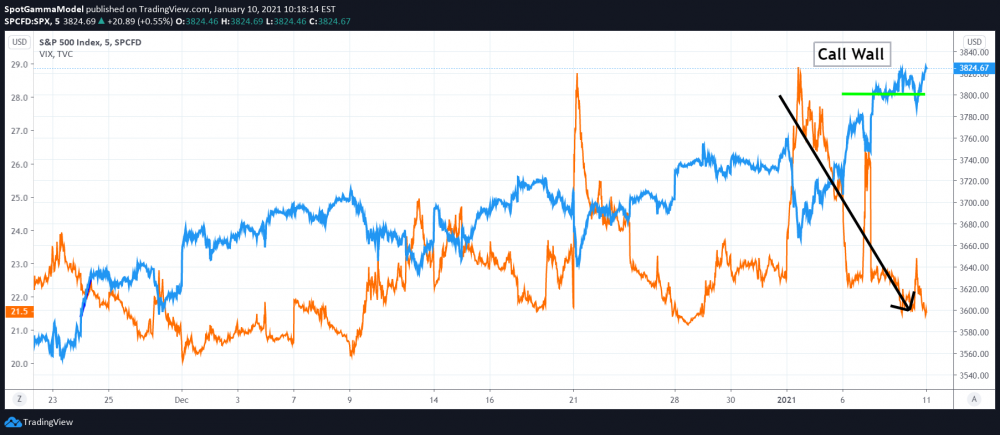
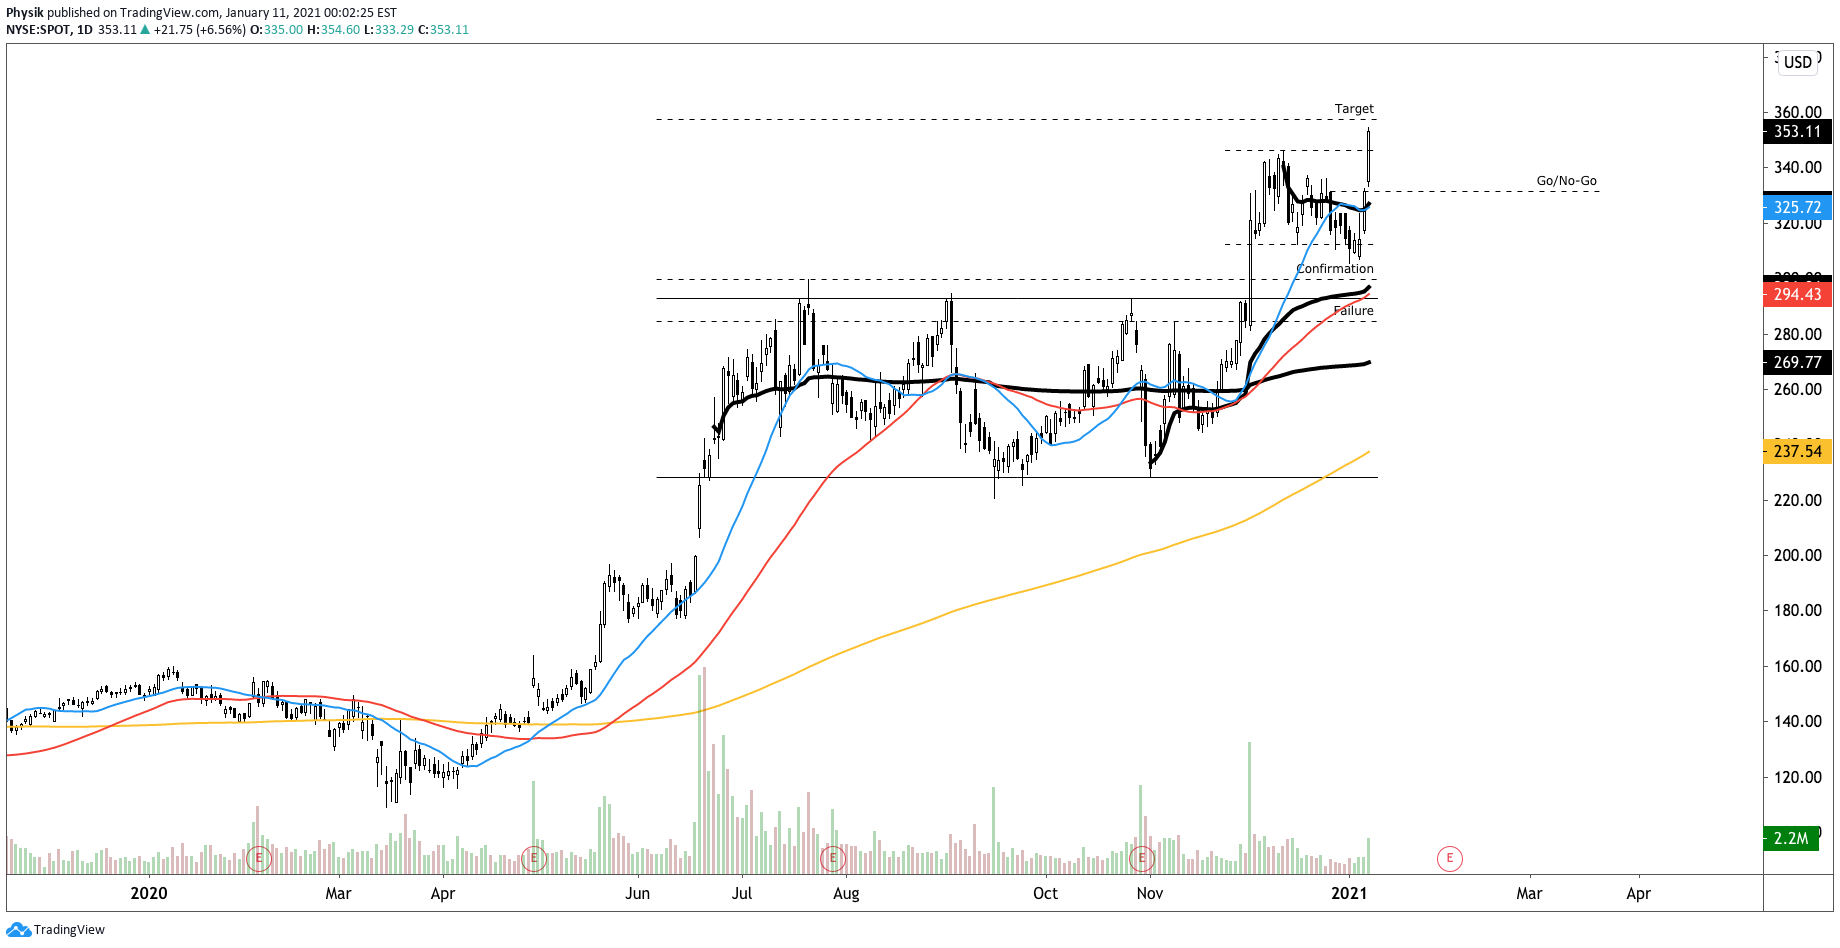
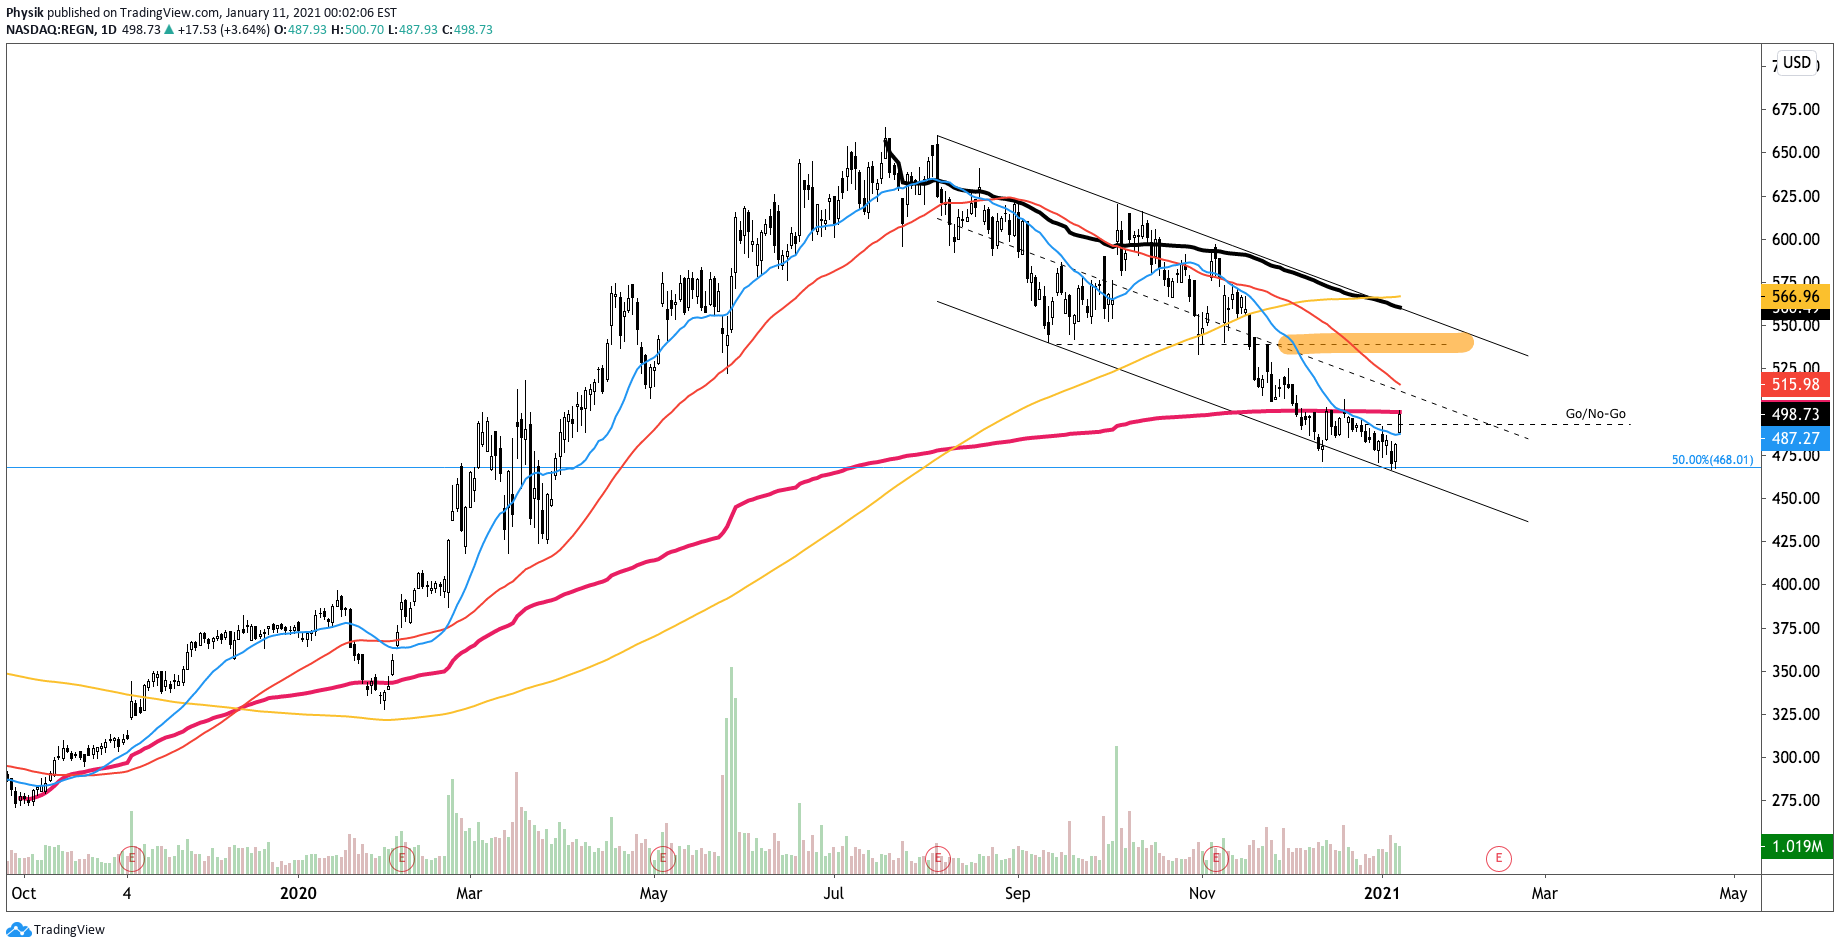
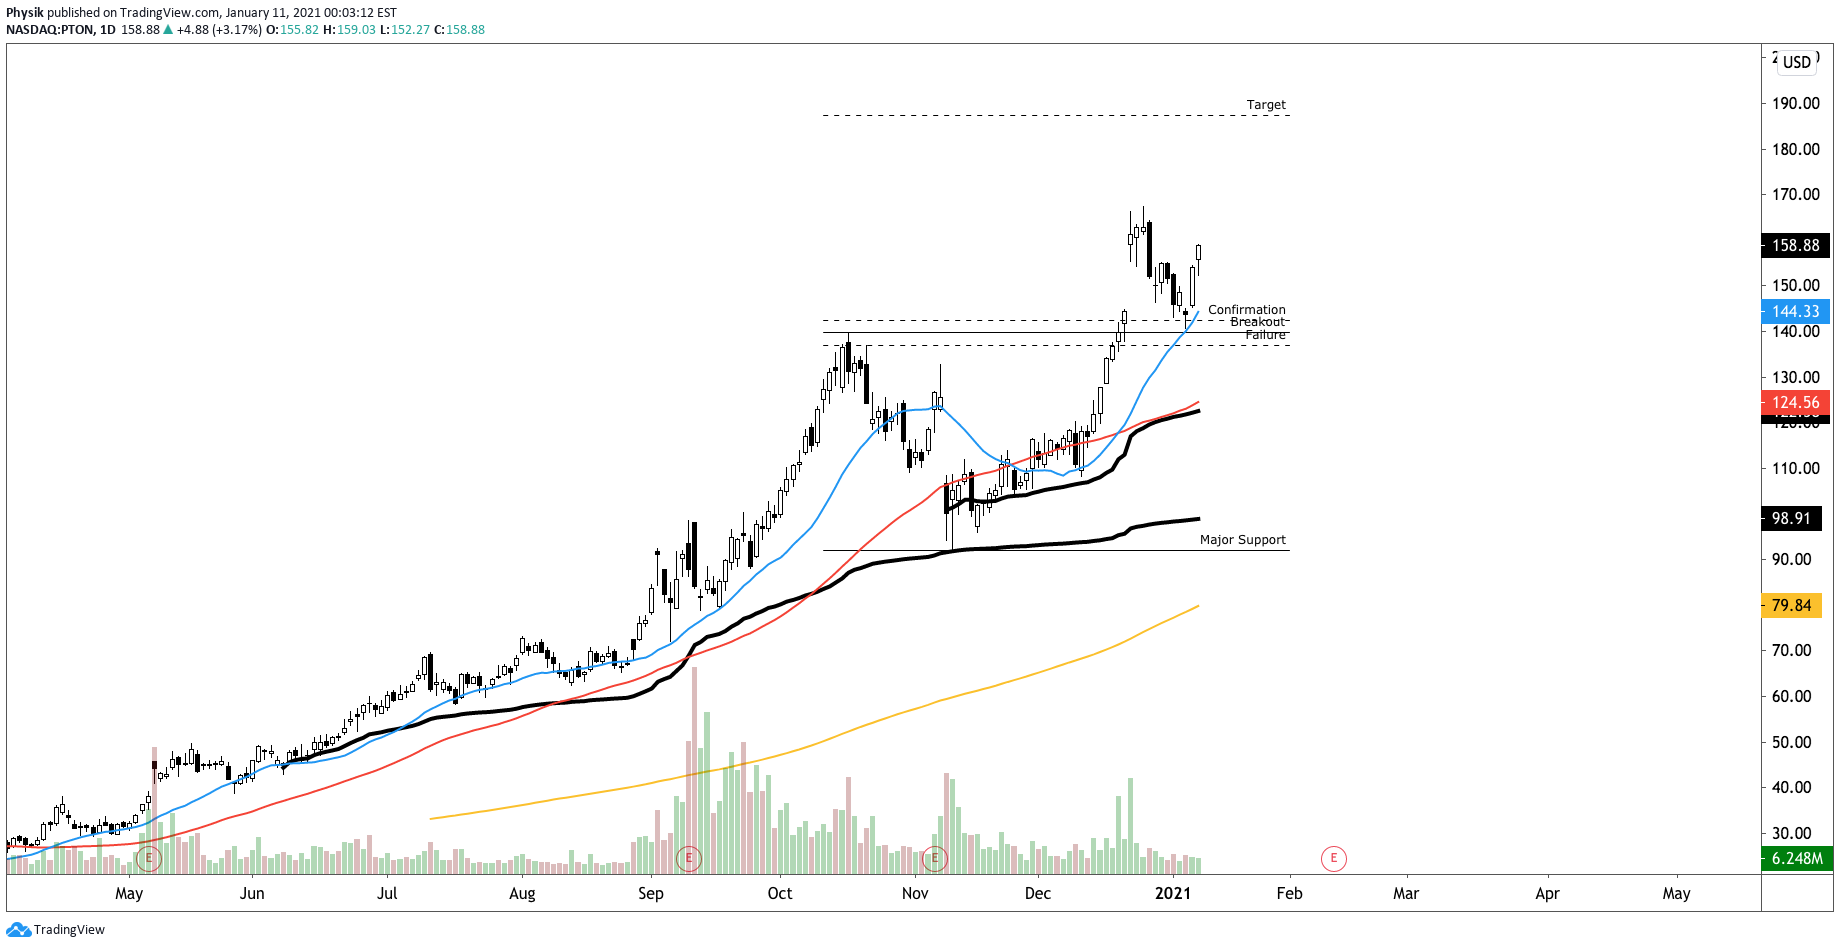
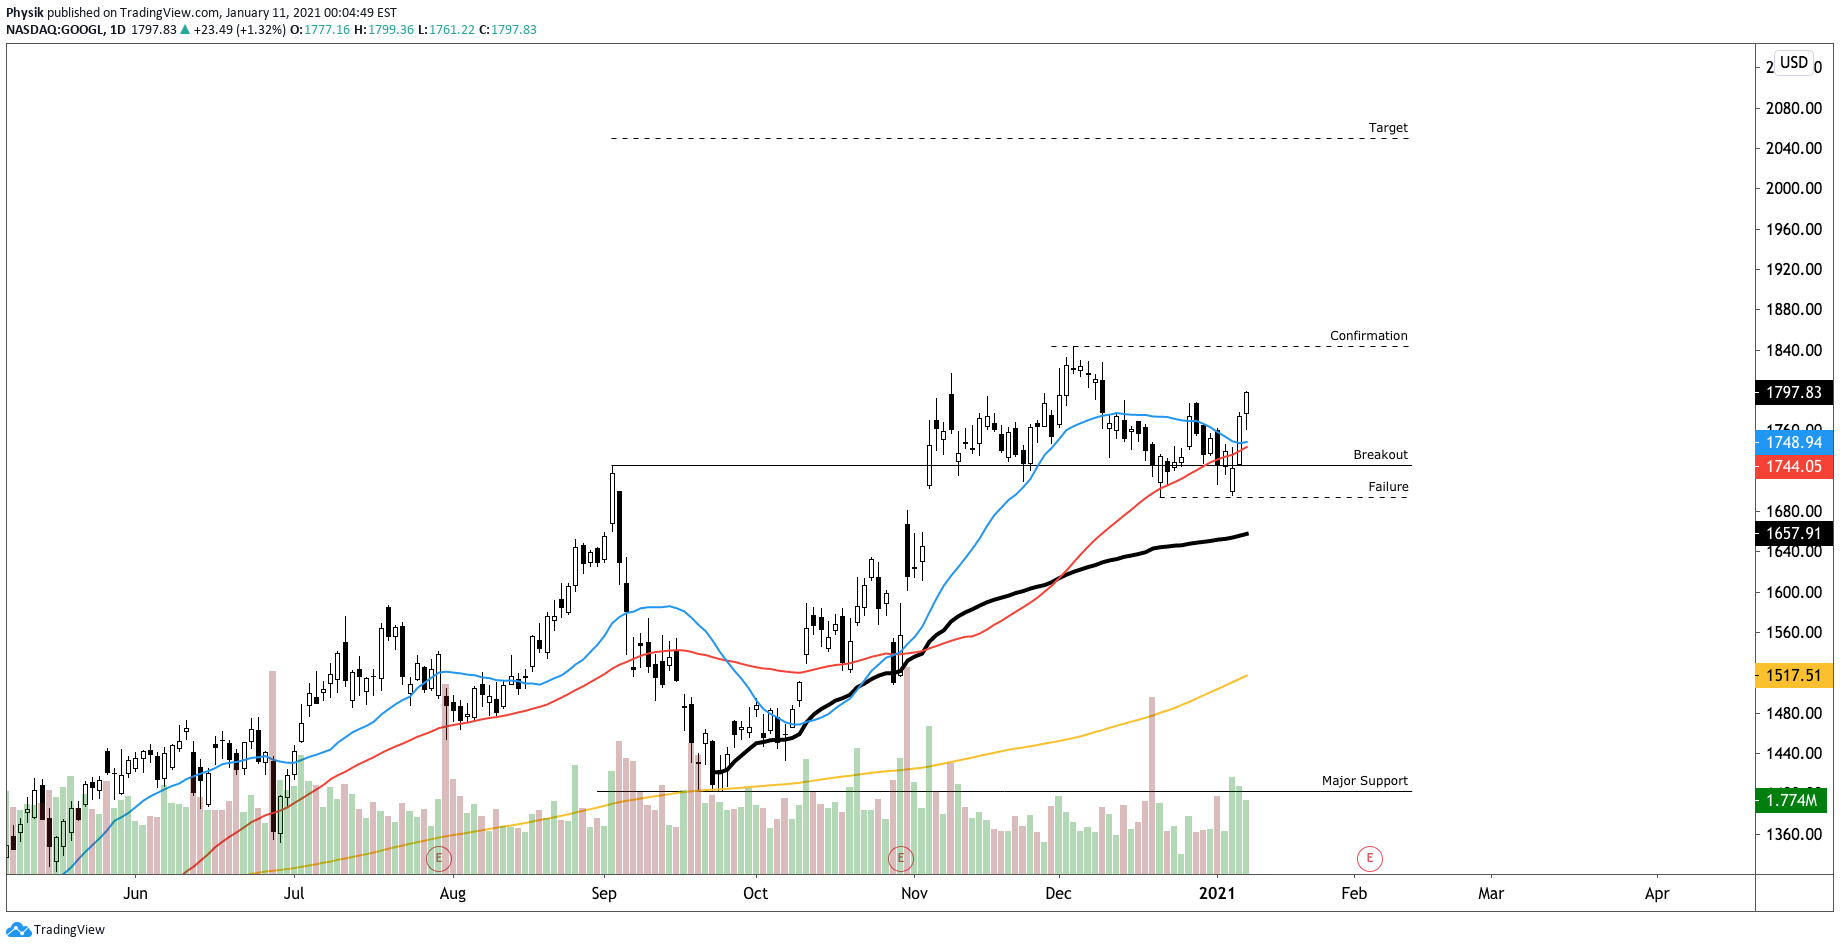
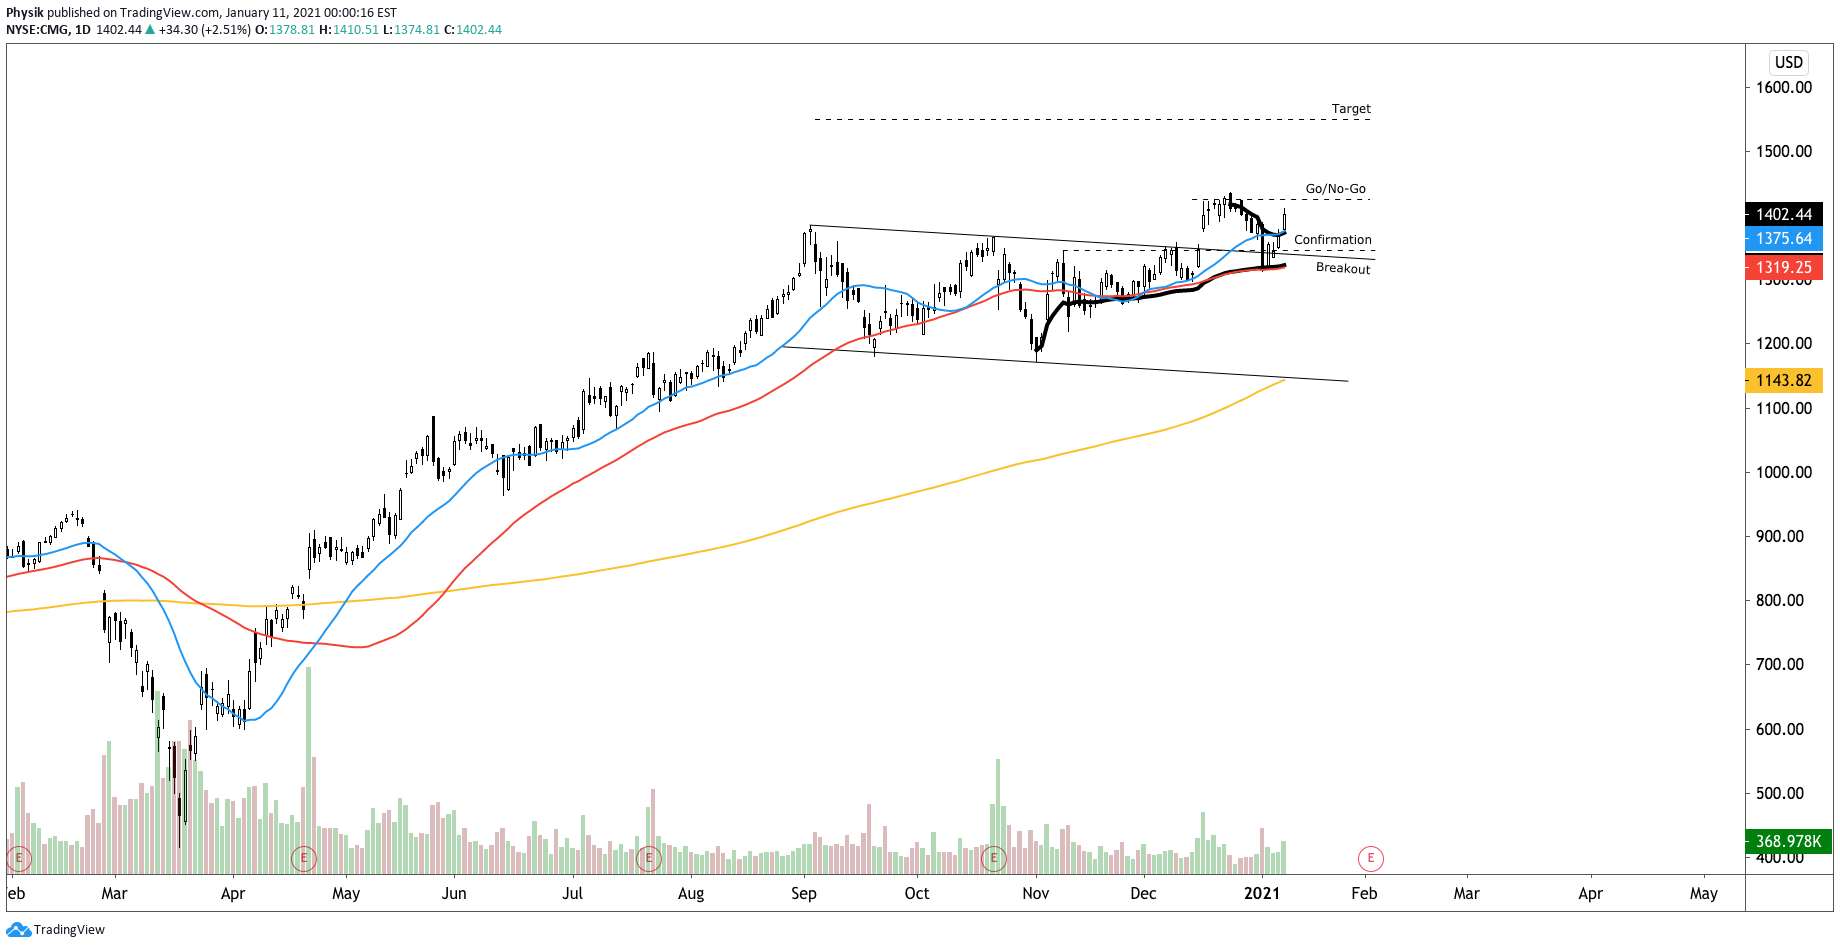
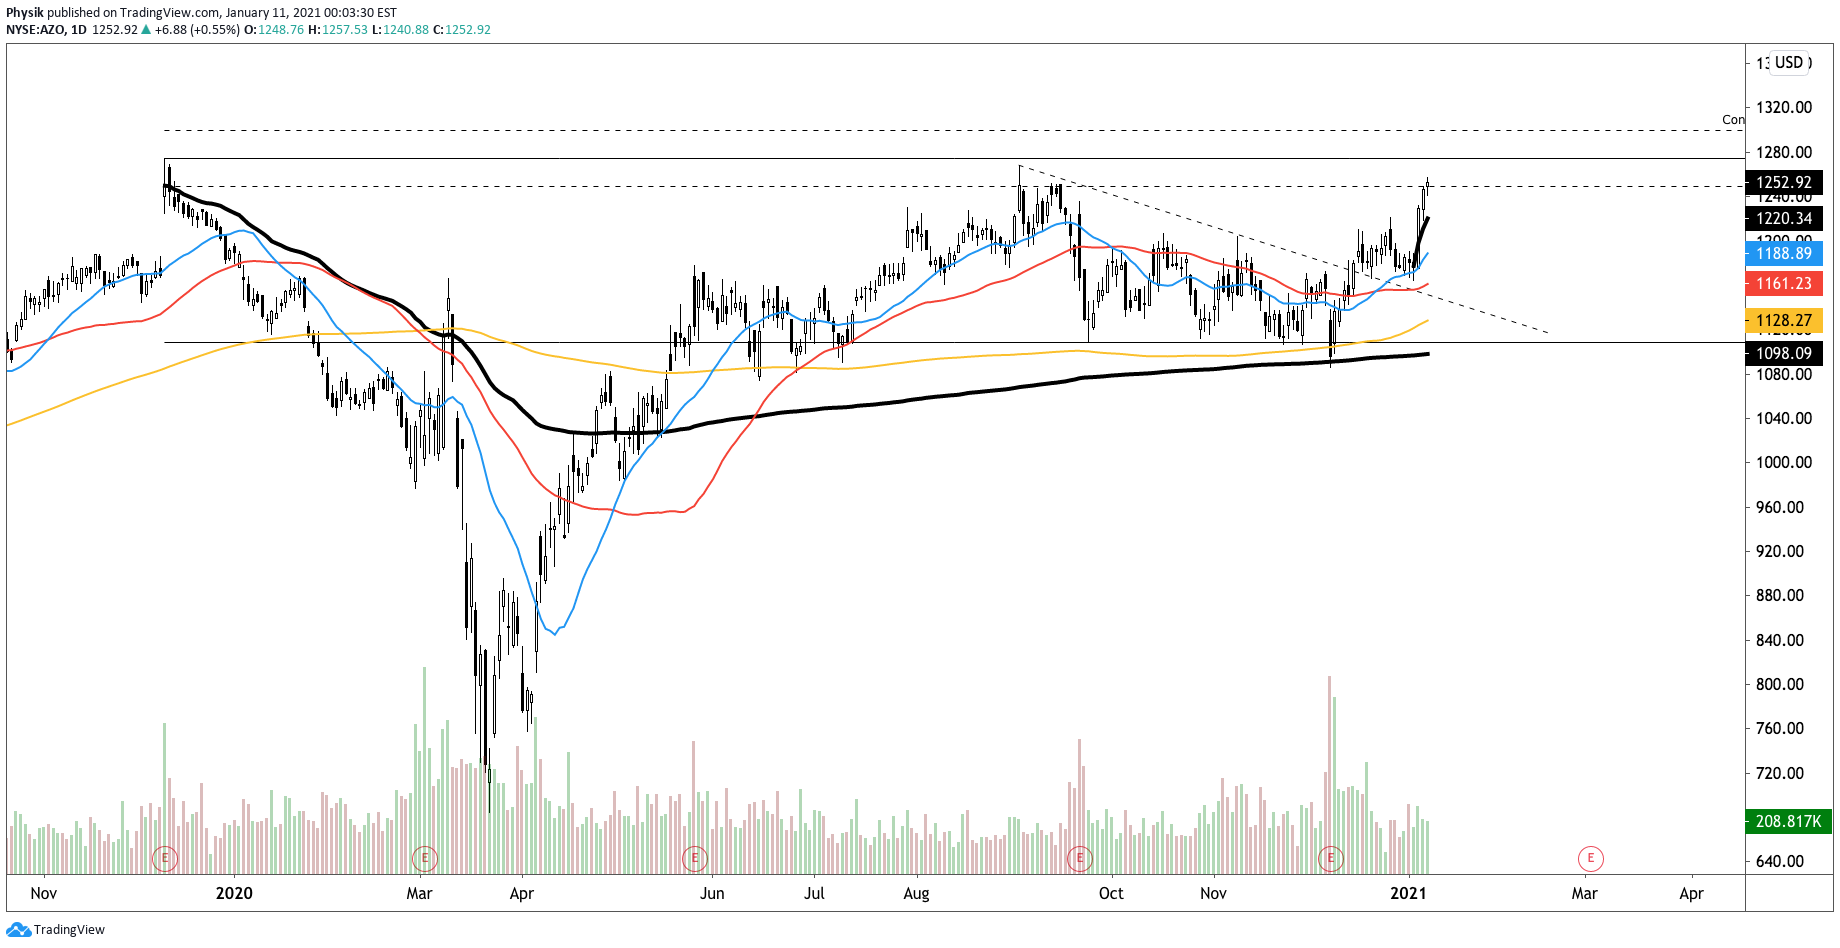
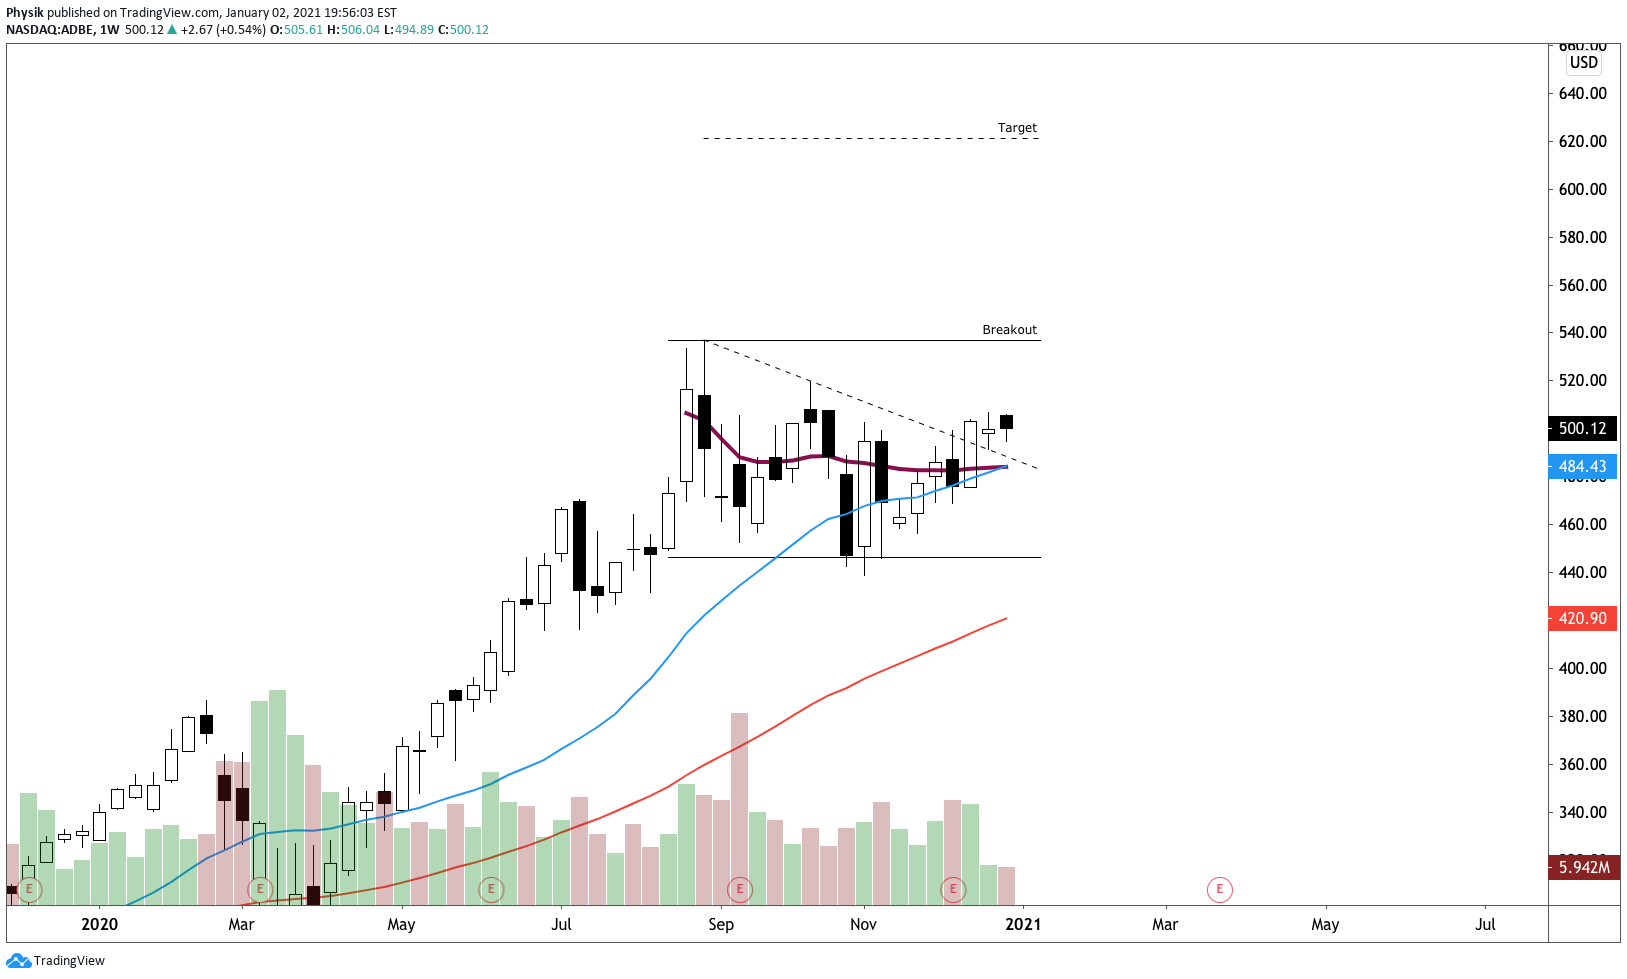
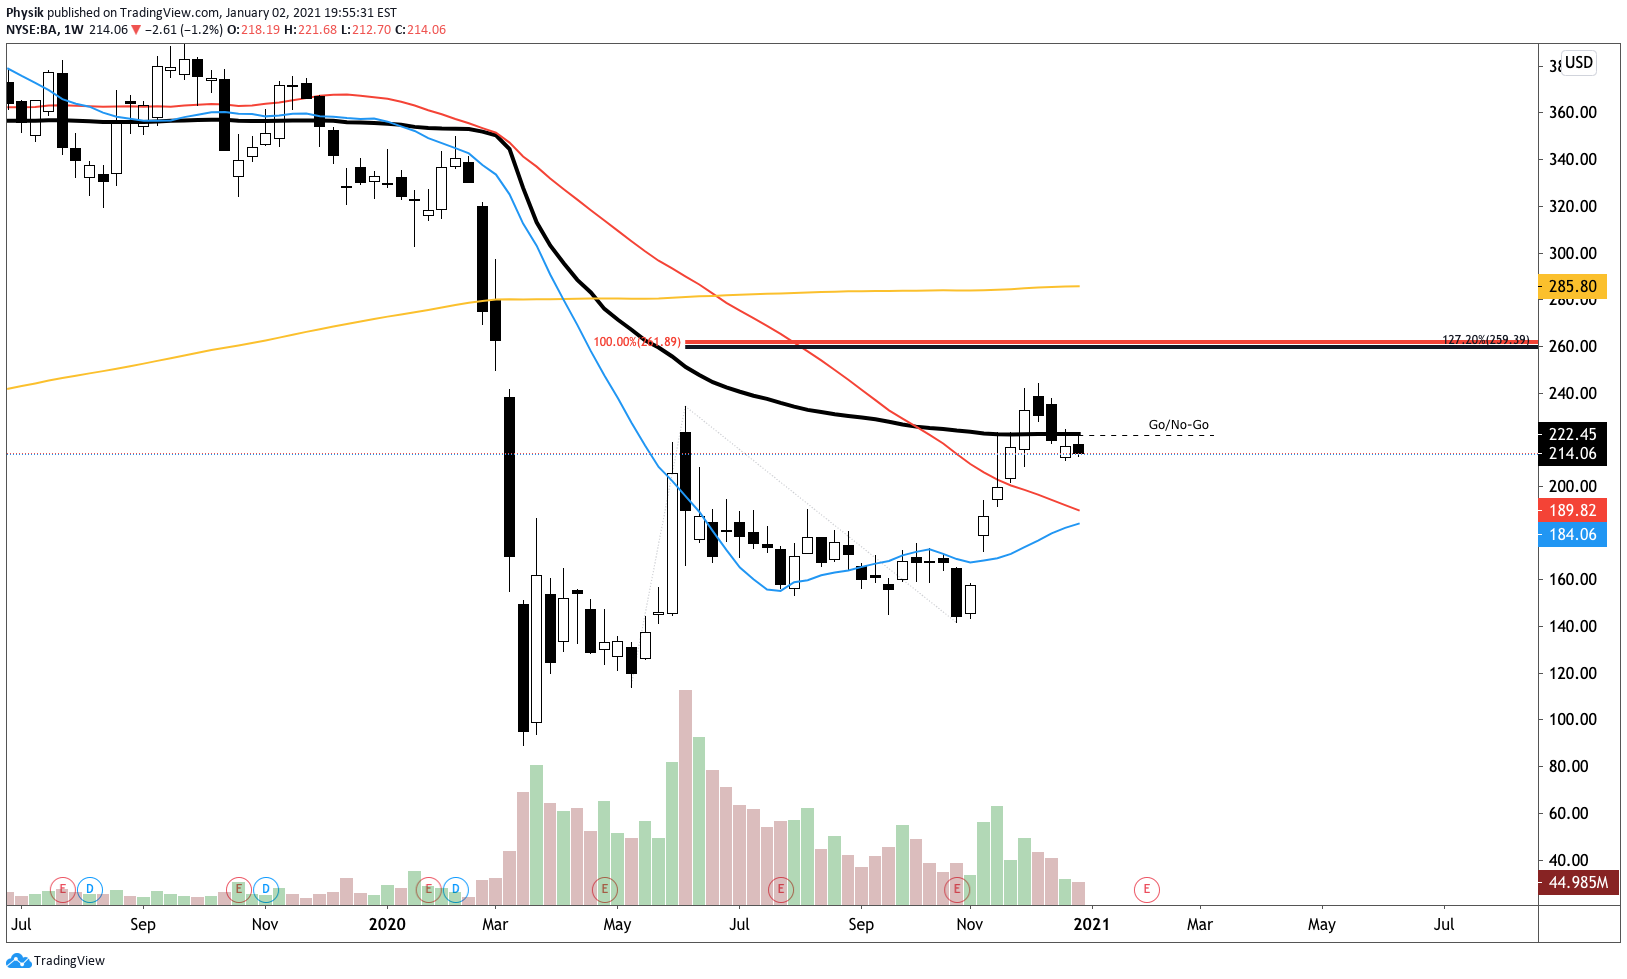
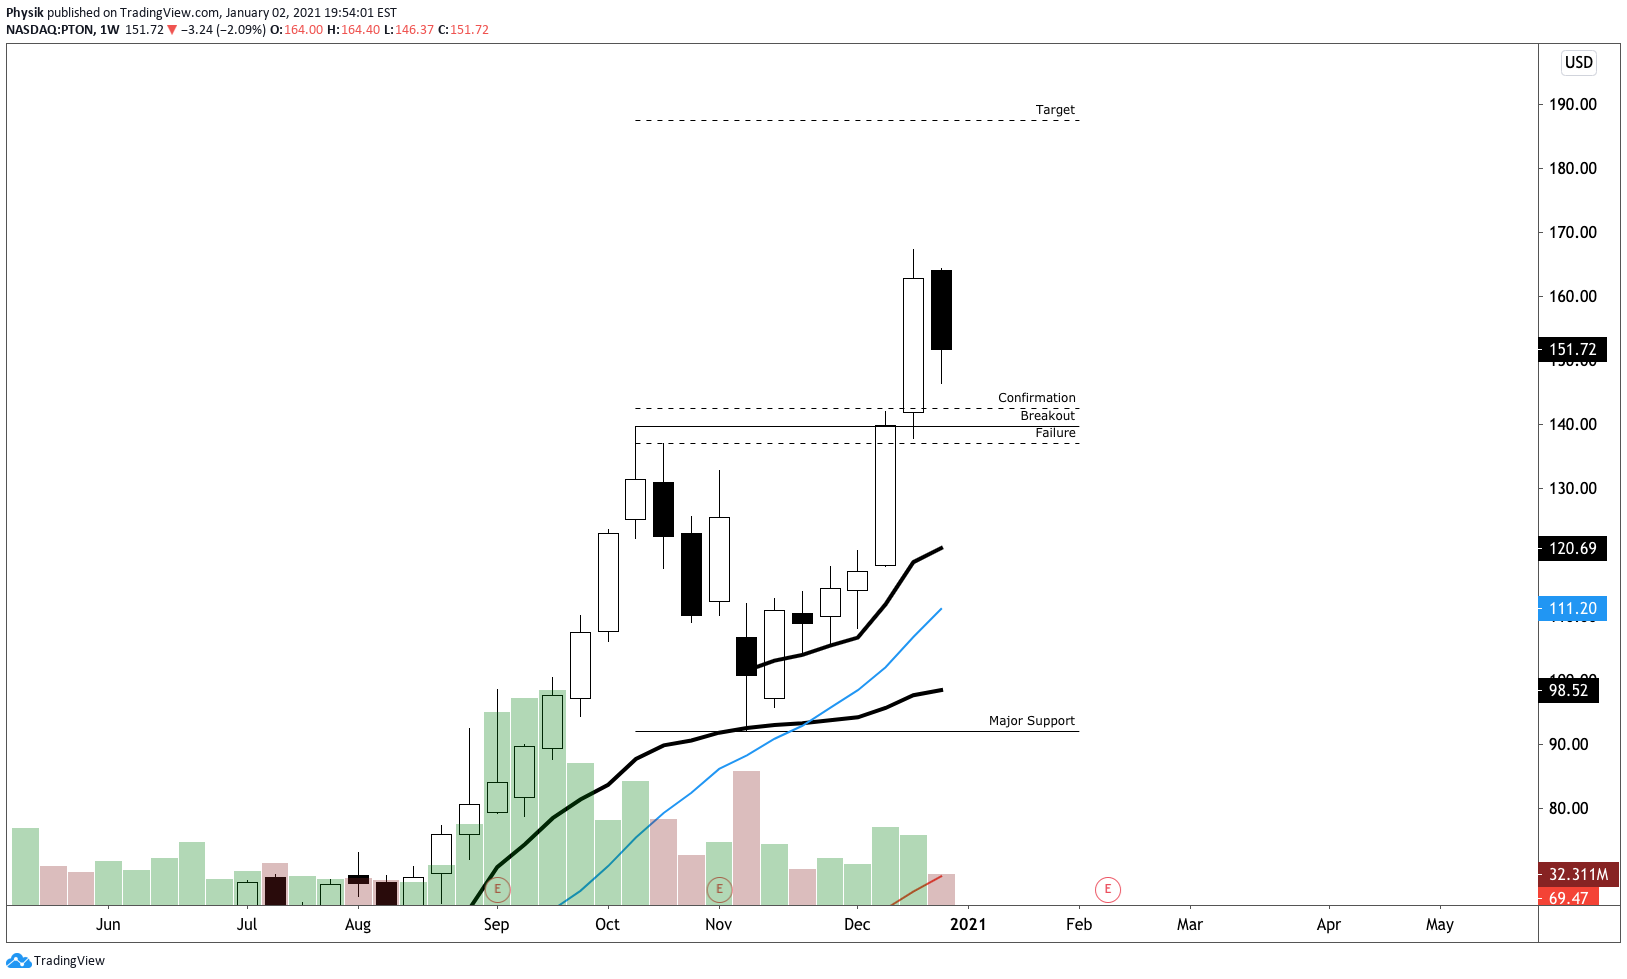
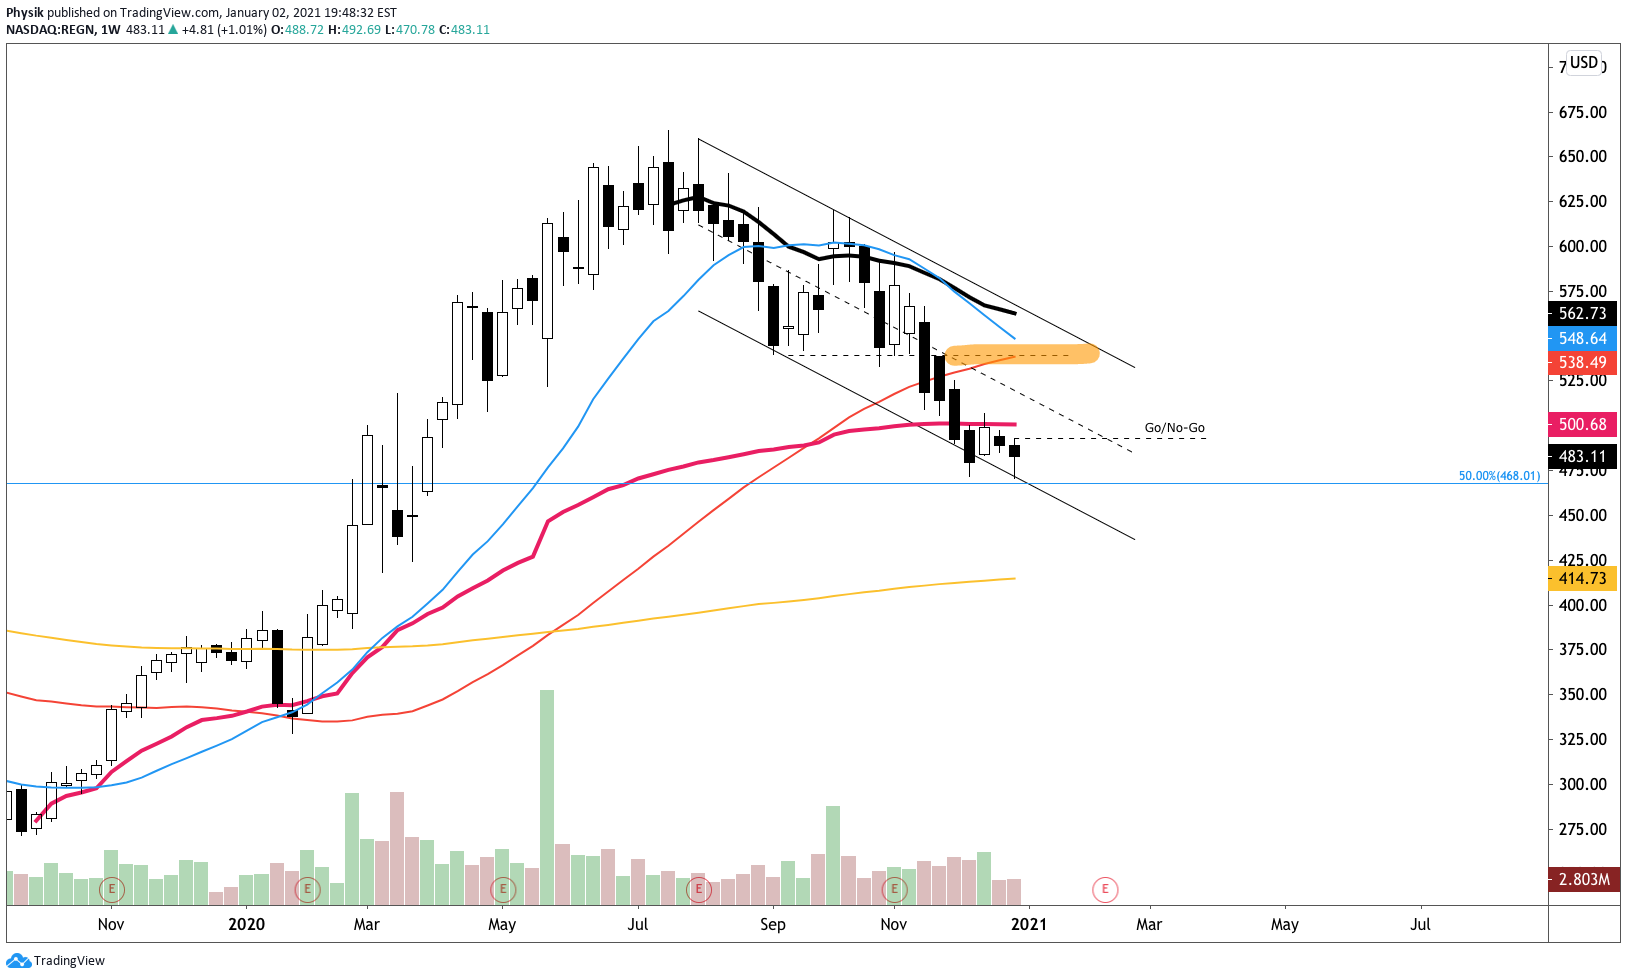
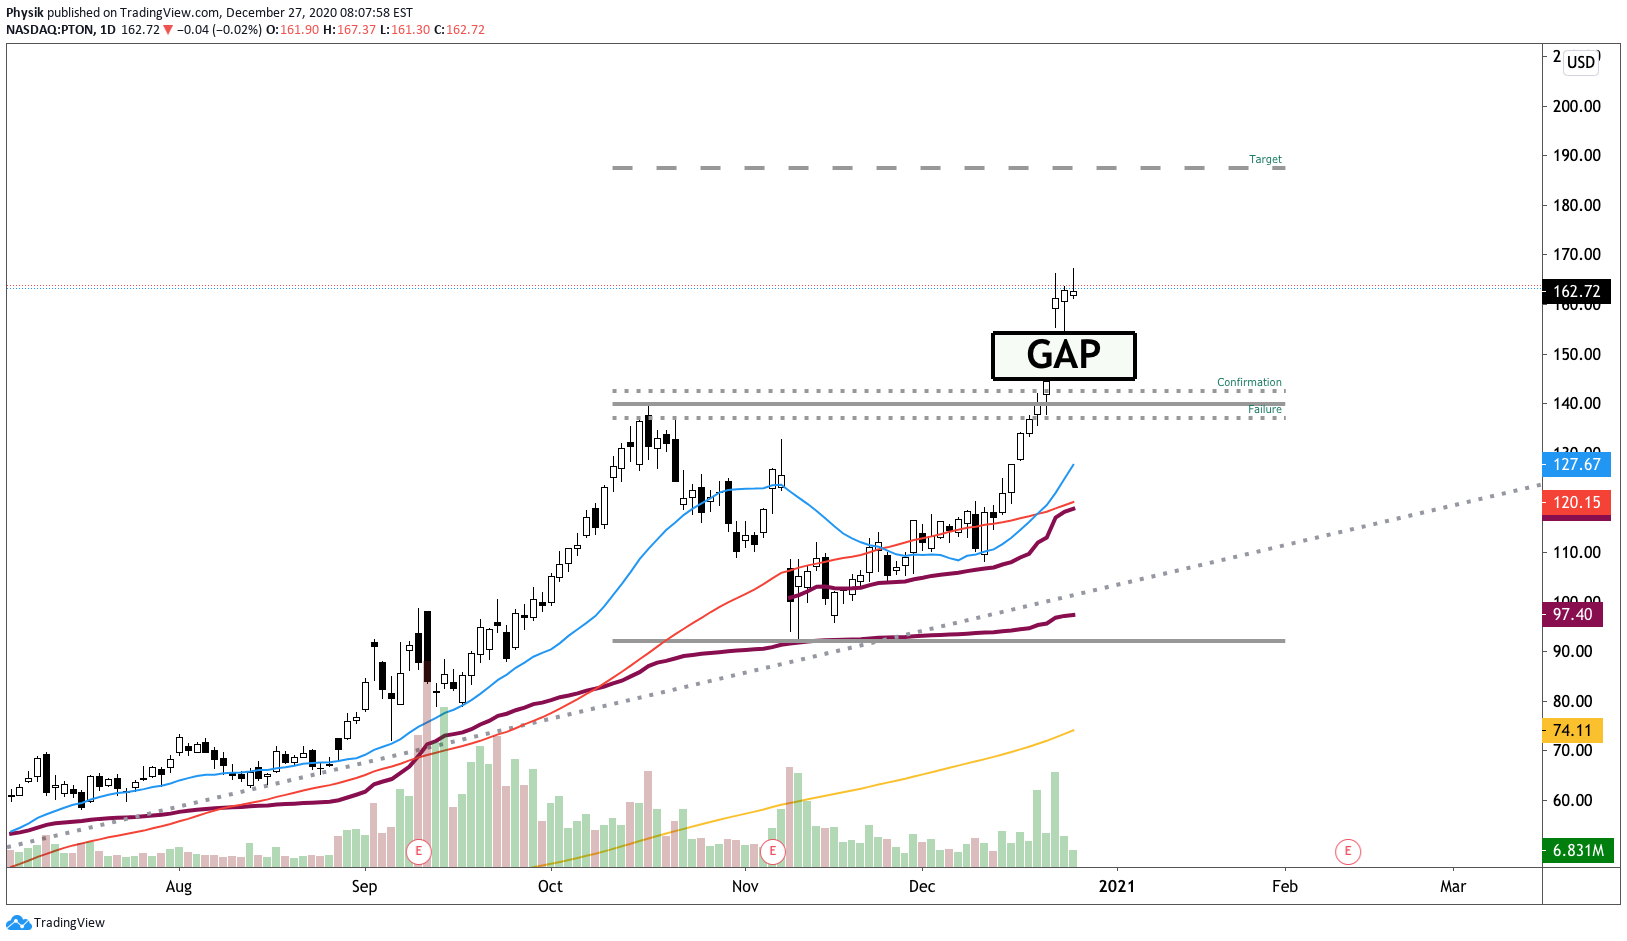
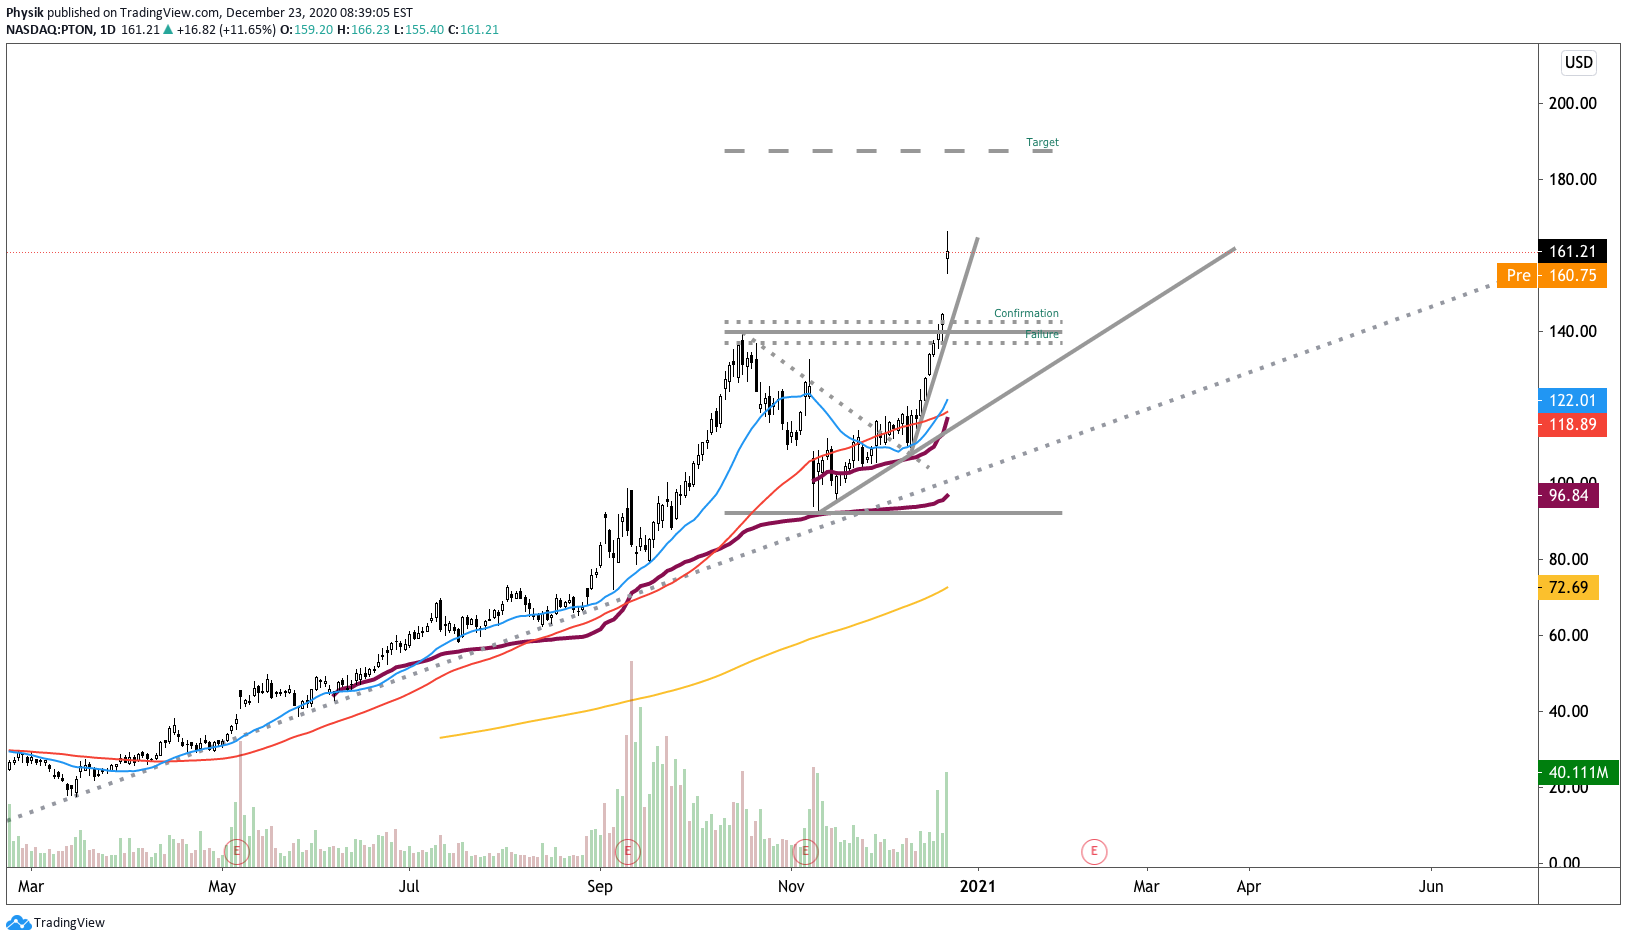
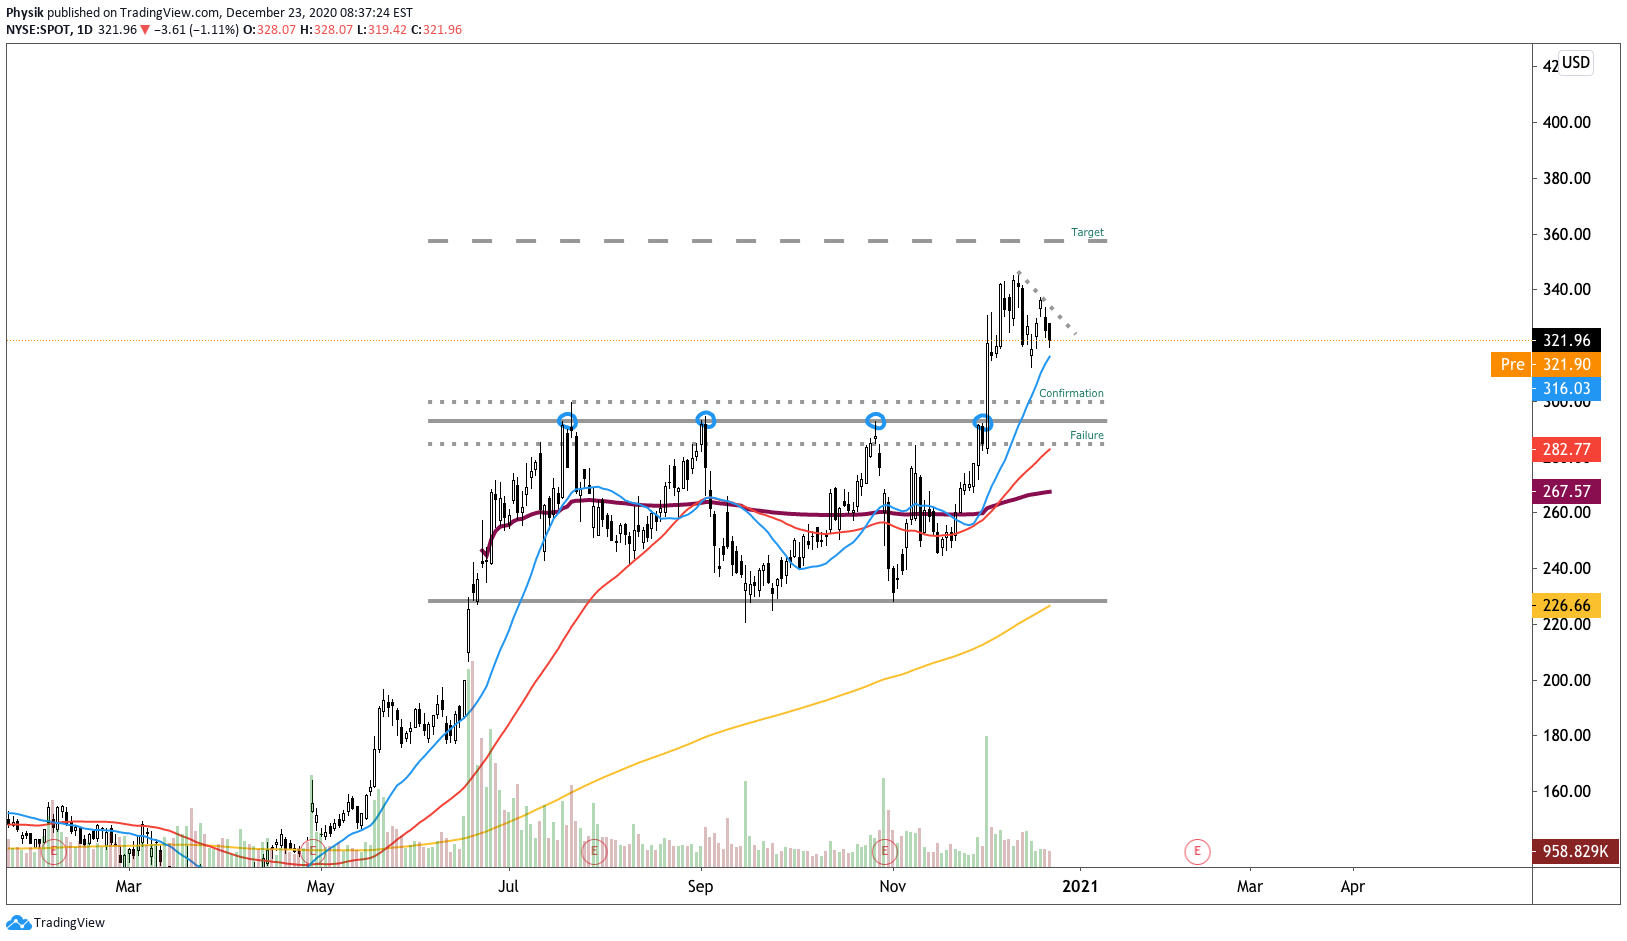
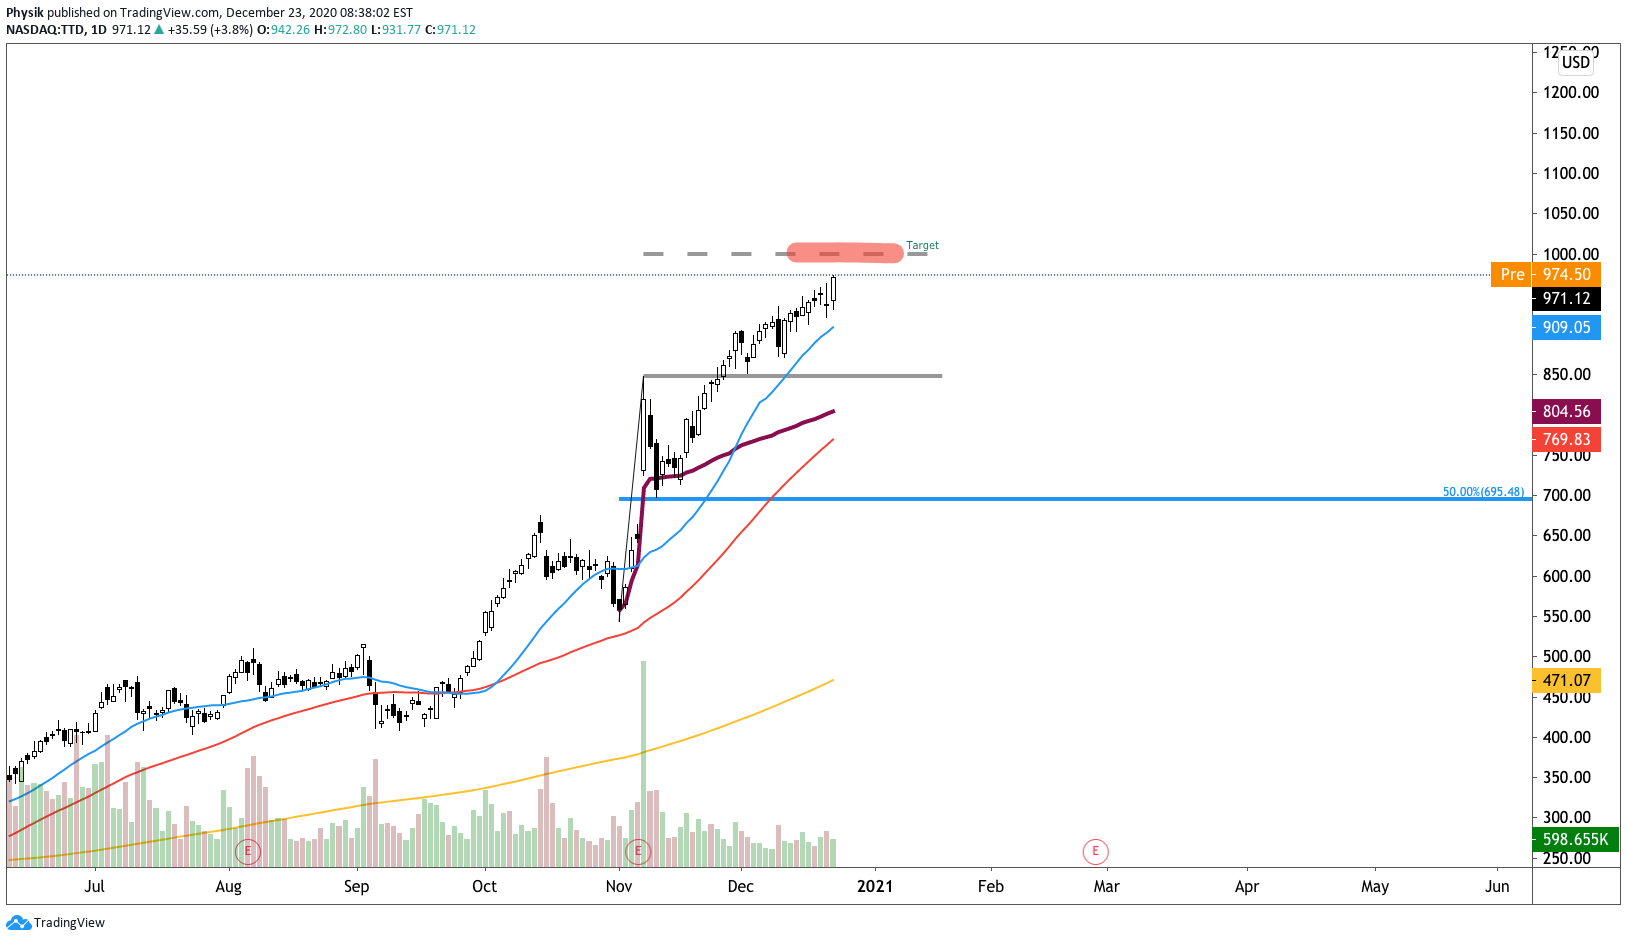
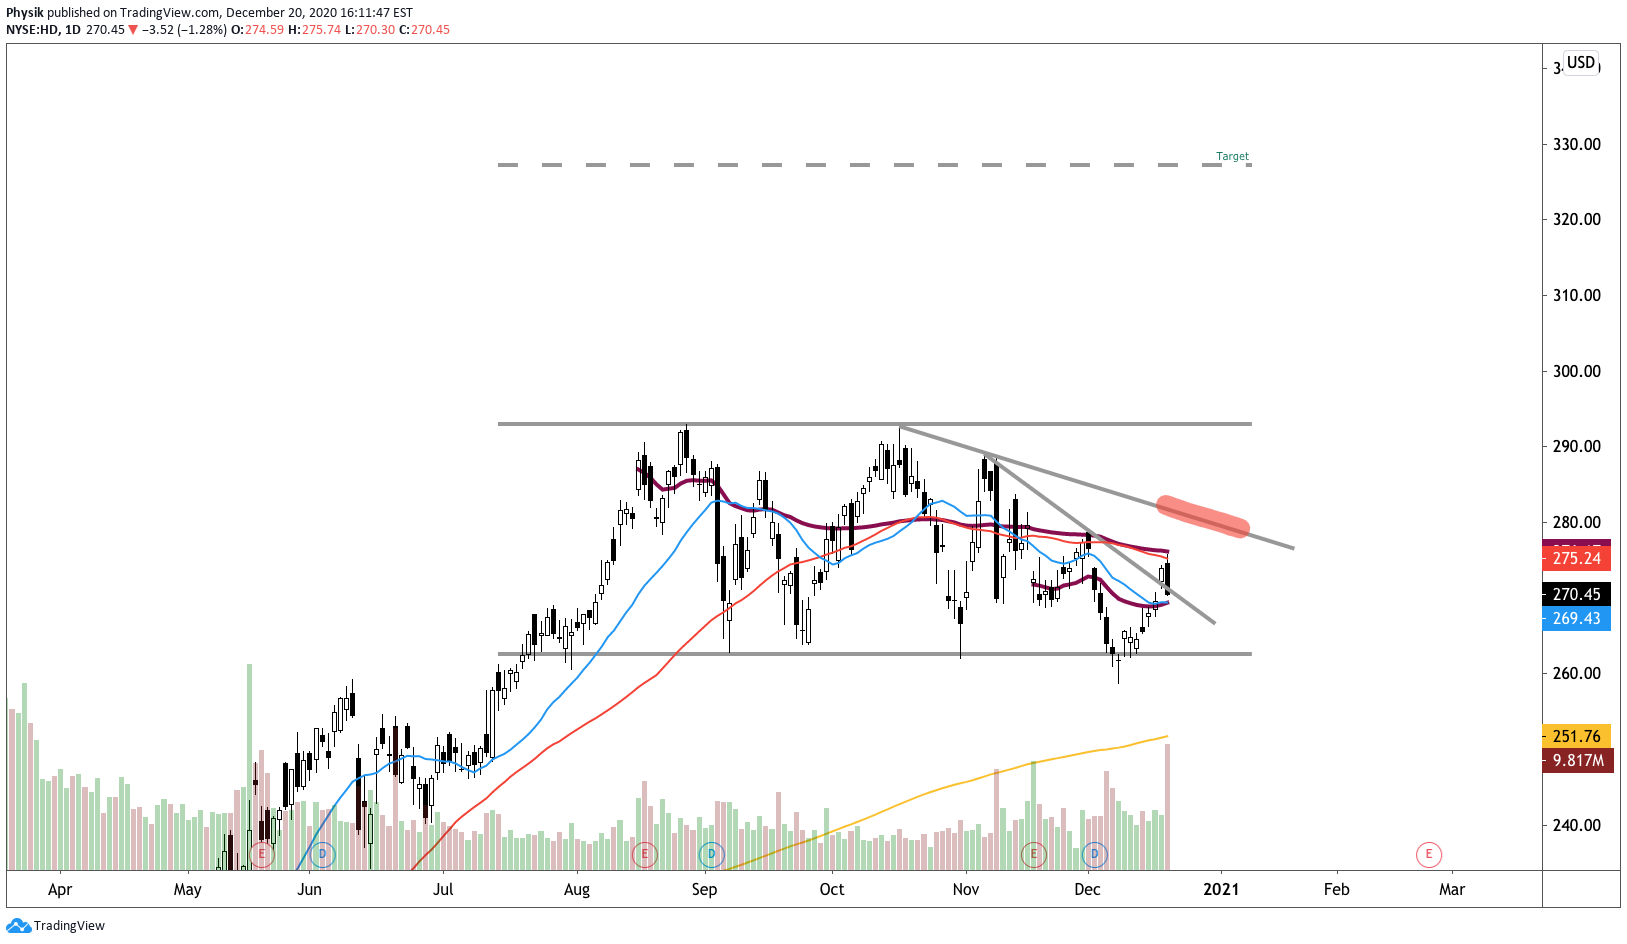
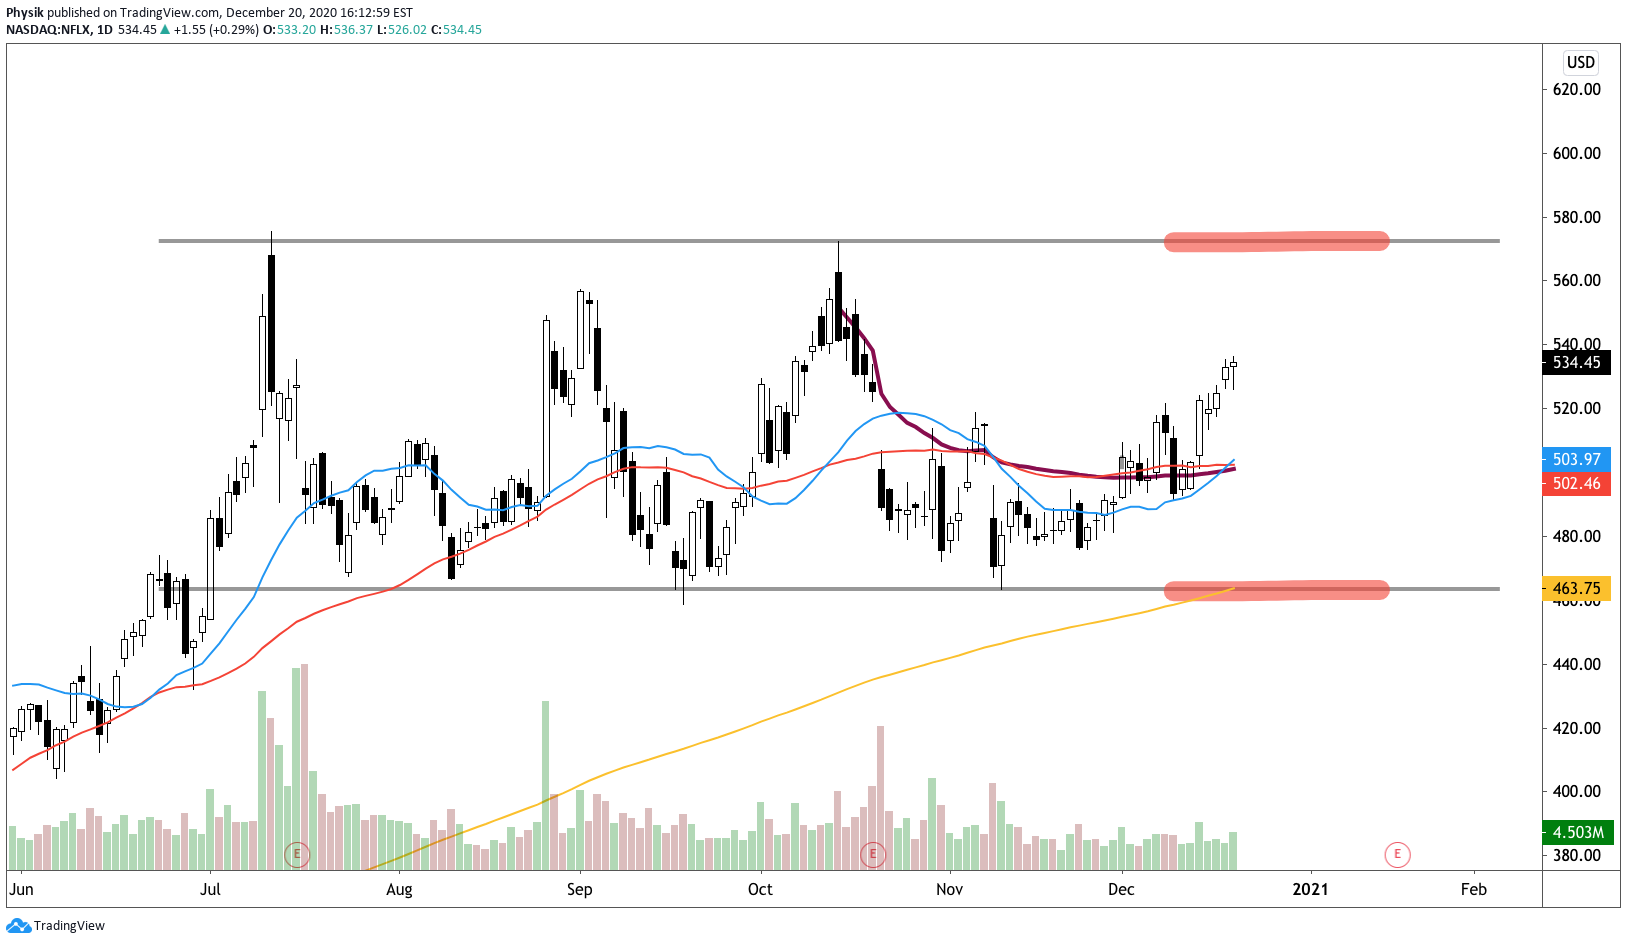
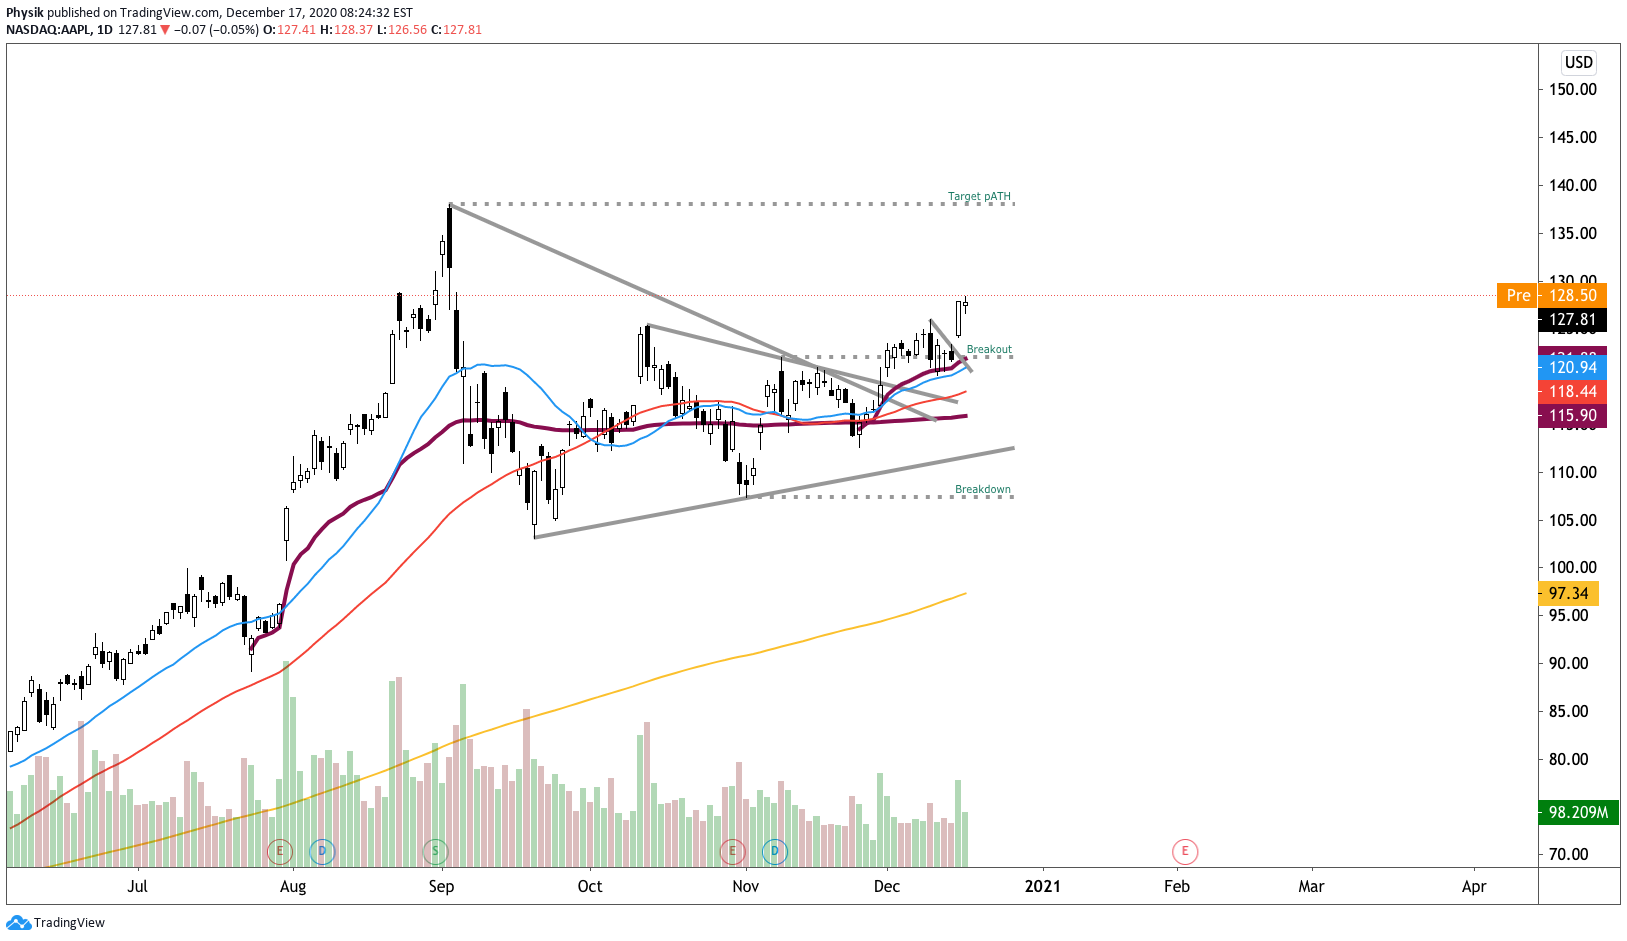
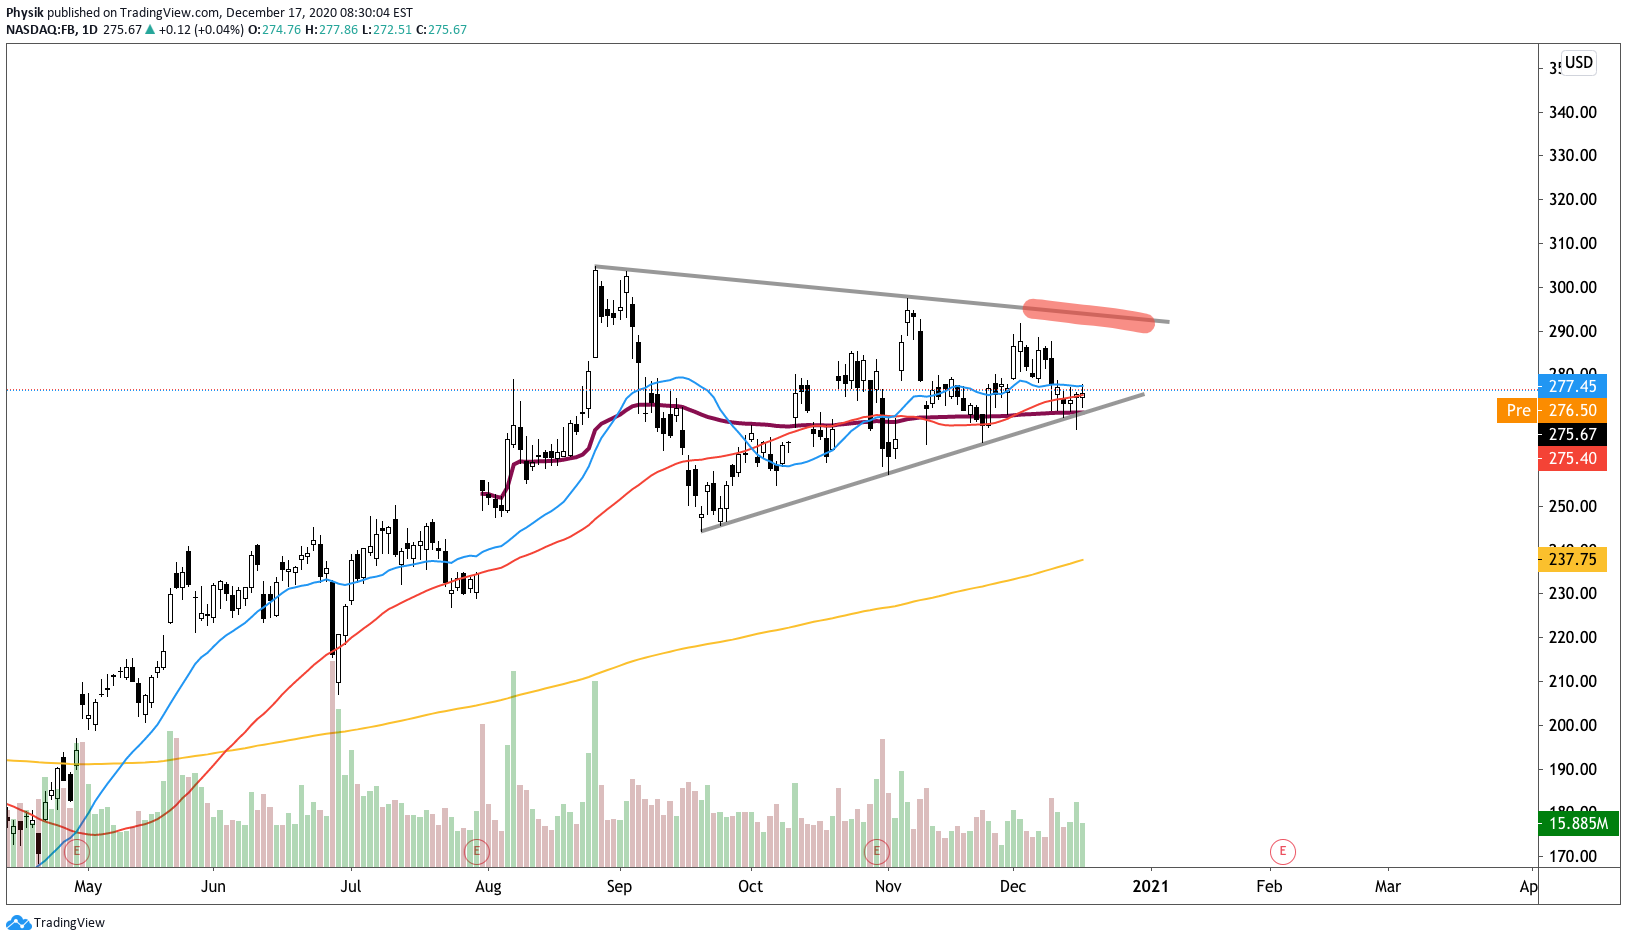
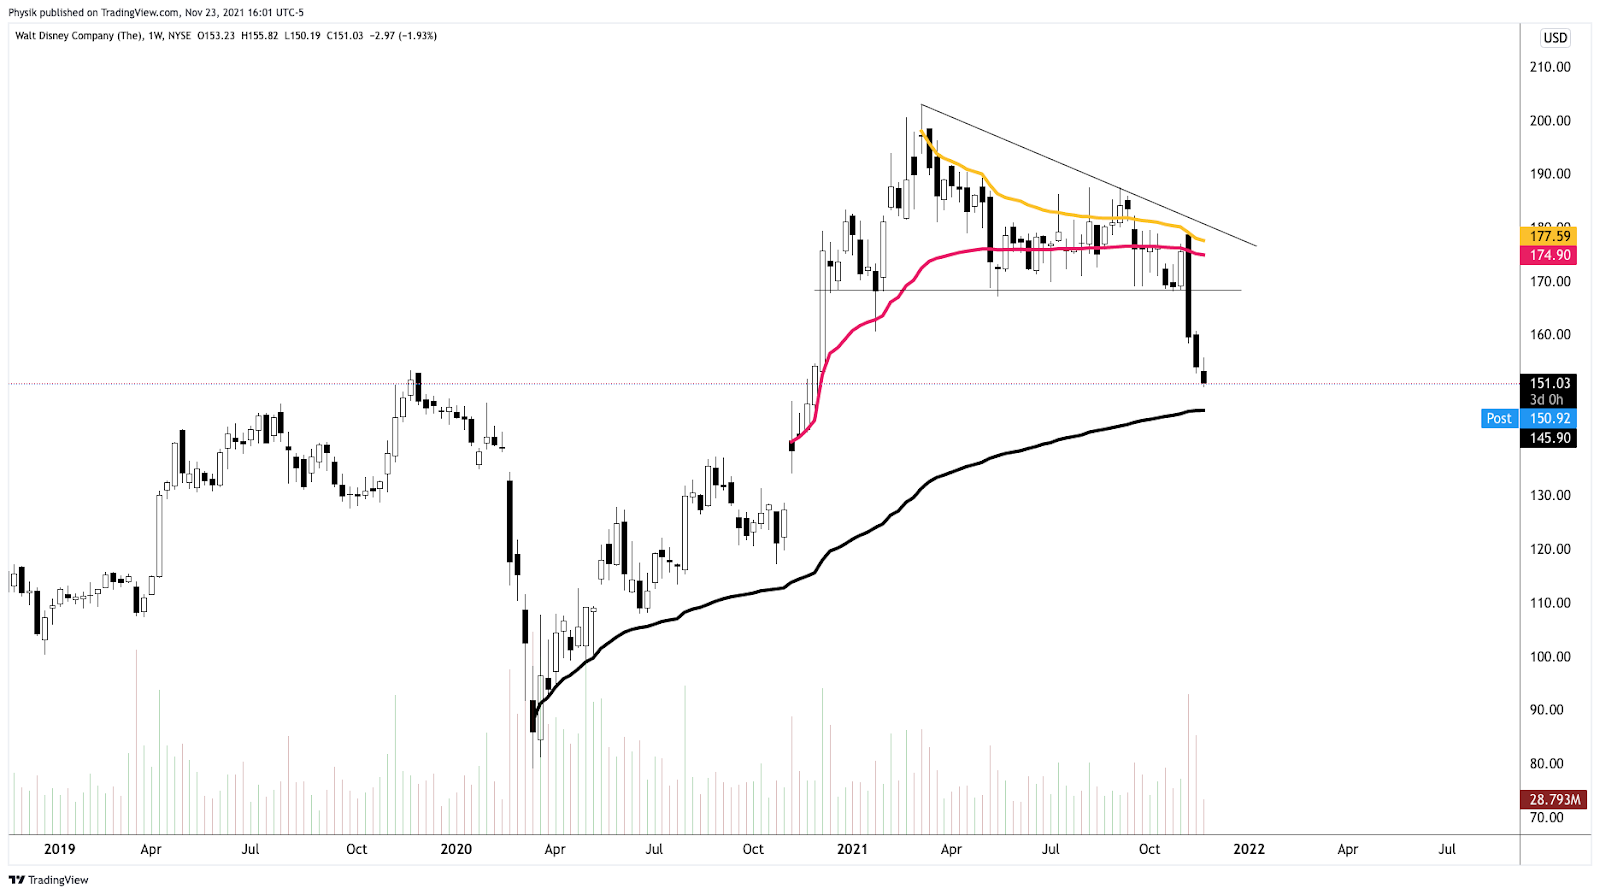
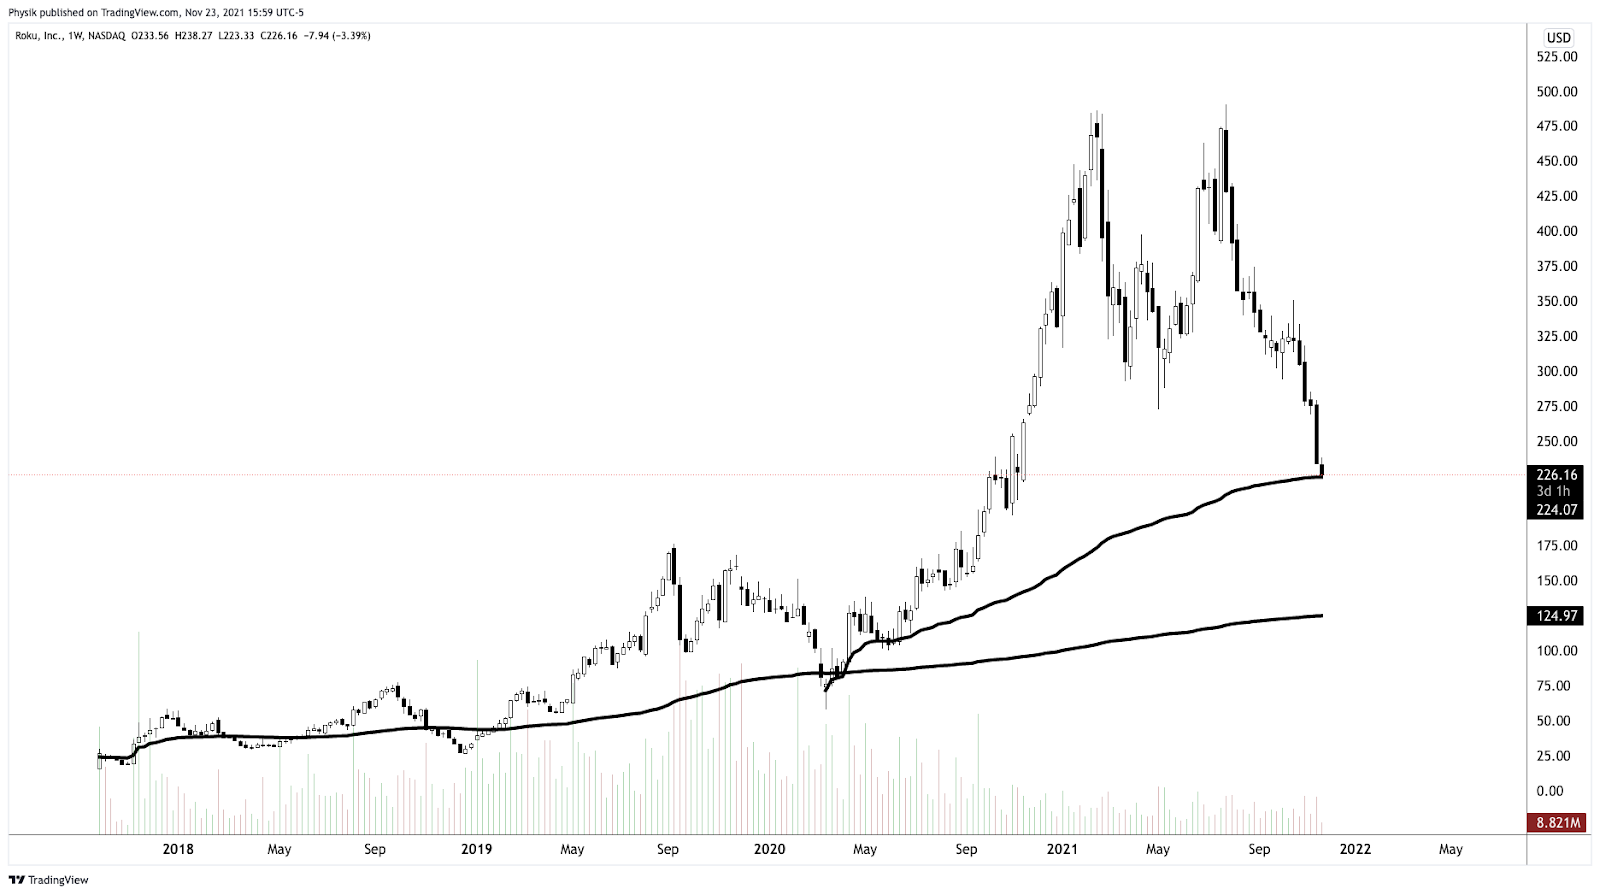
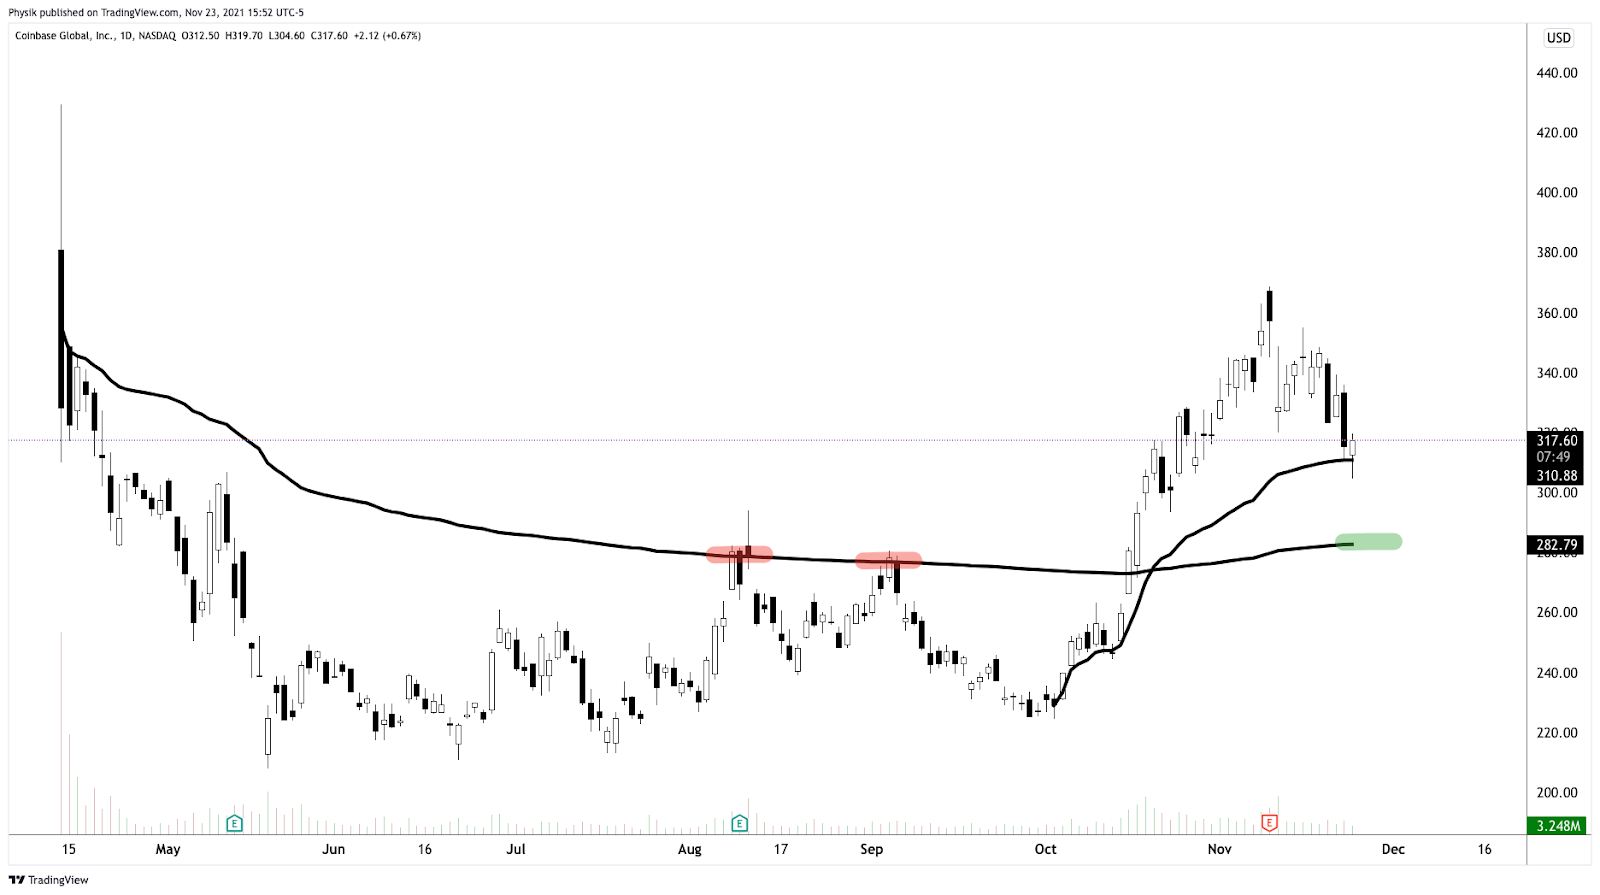
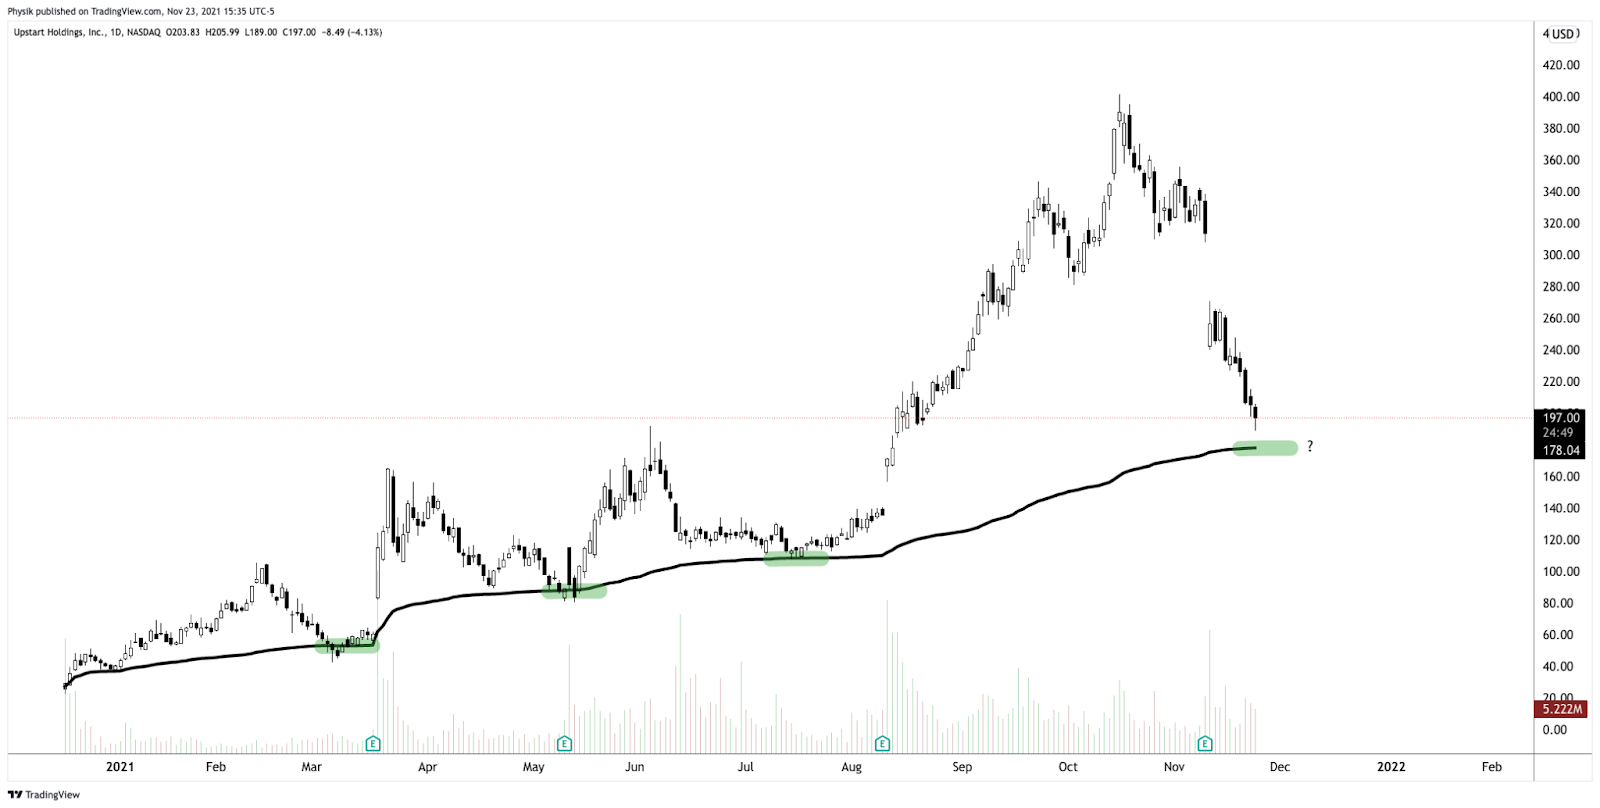
Charts To Watch
What People Are Saying
Definitions
Overnight Rally Highs (Lows): Typically, there is a low historical probability associated with overnight rally-highs (lows) ending the upside (downside) discovery process.
Volume Areas: A structurally sound market will build on areas of high volume (HVNodes). Should the market trend for long periods of time, it will lack sound structure, identified as low volume areas (LVNodes). LVNodes denote directional conviction and ought to offer support on any test.
If participants were to auction and find acceptance into areas of prior low volume (LVNodes), then future discovery ought to be volatile and quick as participants look to HVNodes for favorable entry or exit.
Gamma: Gamma is the sensitivity of an option to changes in the underlying price. Dealers that take the other side of options trades hedge their exposure to risk by buying and selling the underlying. When dealers are short-gamma, they hedge by buying into strength and selling into weakness. When dealers are long-gamma, they hedge by selling into strength and buying into weakness. The former exacerbates volatility. The latter calms volatility.
POCs: POCs are valuable as they denote areas where two-sided trade was most prevalent in a prior day session. Participants will respond to future tests of value as they offer favorable entry and exit.
MCPOCs: POCs are valuable as they denote areas where two-sided trade was most prevalent over numerous day sessions. Participants will respond to future tests of value as they offer favorable entry and exit.
About
After years of self-education, strategy development, and trial-and-error, Renato Leonard Capelj began trading full-time and founded Physik Invest to detail his methods, research, and performance in the markets.
Additionally, Capelj is a Benzinga finance and technology reporter interviewing the likes of Shark Tank’s Kevin O’Leary, JC2 Ventures’ John Chambers, and ARK Invest’s Catherine Wood, as well as a SpotGamma contributor, developing insights around impactful options market dynamics.
Disclaimer
At this time, Physik Invest does not manage outside capital and is not licensed. In no way should the materials herein be construed as advice. Derivatives carry a substantial risk of loss. All content is for informational purposes only.