Categories
Commentary

Daily Brief For January 21, 2022

The Daily Brief is a free glimpse into the prevailing fundamental and technical drivers of U.S. equity market products. Join the 200+ that read this report daily, below!

What Happened

Overnight, equity index futures auctioned sideways, mostly, after a weak close, Thursday.

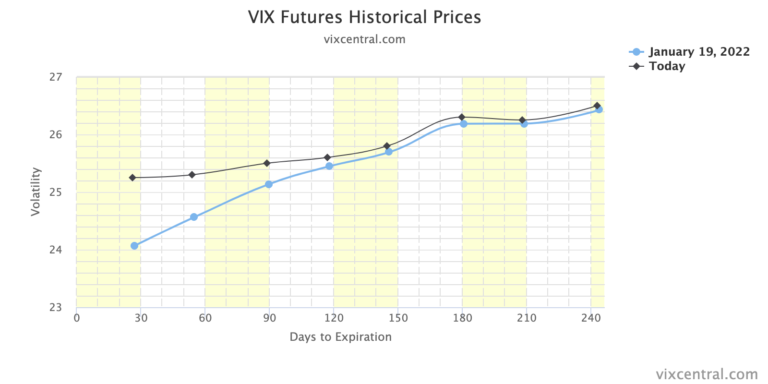
Measures of implied volatility remained bid while bonds rose after yields briefly surpassed 1.9%.

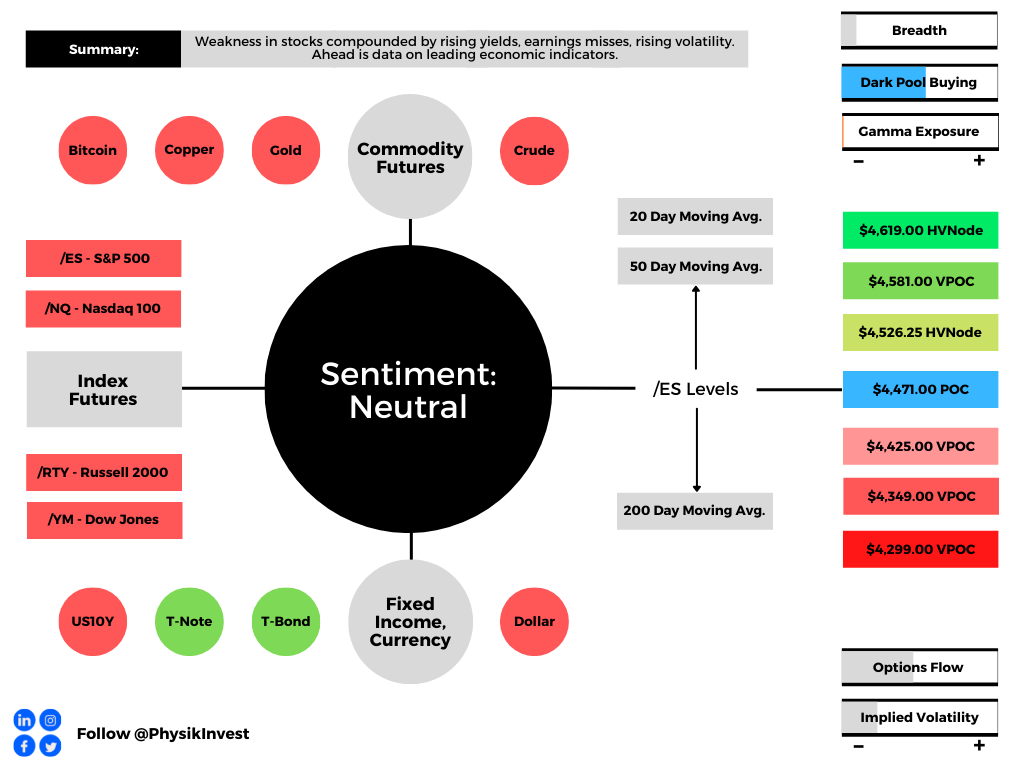
Ahead is data on leading economic indicators (10:00 AM ET).

Graphic updated 6:30 AM ET. Sentiment Neutral if expected /ES open is inside of the prior day’s range. /ES levels are derived from the profile graphic at the bottom of the following section. Levels may have changed since initially quoted; click here for the latest levels. SqueezeMetrics Dark Pool Index (DIX) and Gamma (GEX) calculations are based on where the prior day’s reading falls with respect to the MAX and MIN of all occurrences available. A higher DIX is bullish. At the same time, the lower the GEX, the more (expected) volatility. Learn the implications of volatility, direction, and moneyness. SHIFT data used for S&P 500 (INDEX: SPX) options activity. Note that options flow is sorted by the call premium spent; if more positive, then more was spent on call options. Breadth reflects a reading of the prior day’s NYSE Advance/Decline indicator. VIX reflects a current reading of the CBOE Volatility Index (INDEX: VIX) from 0-100.

What To Expect

Fundamental: The Nasdaq dipped into correction territory as stocks extended lower, Thursday.

Weakness was compounded by geopolitical tensions, the prospects of reduced stimulus to combat high inflation, as well as poor responses to earnings results.

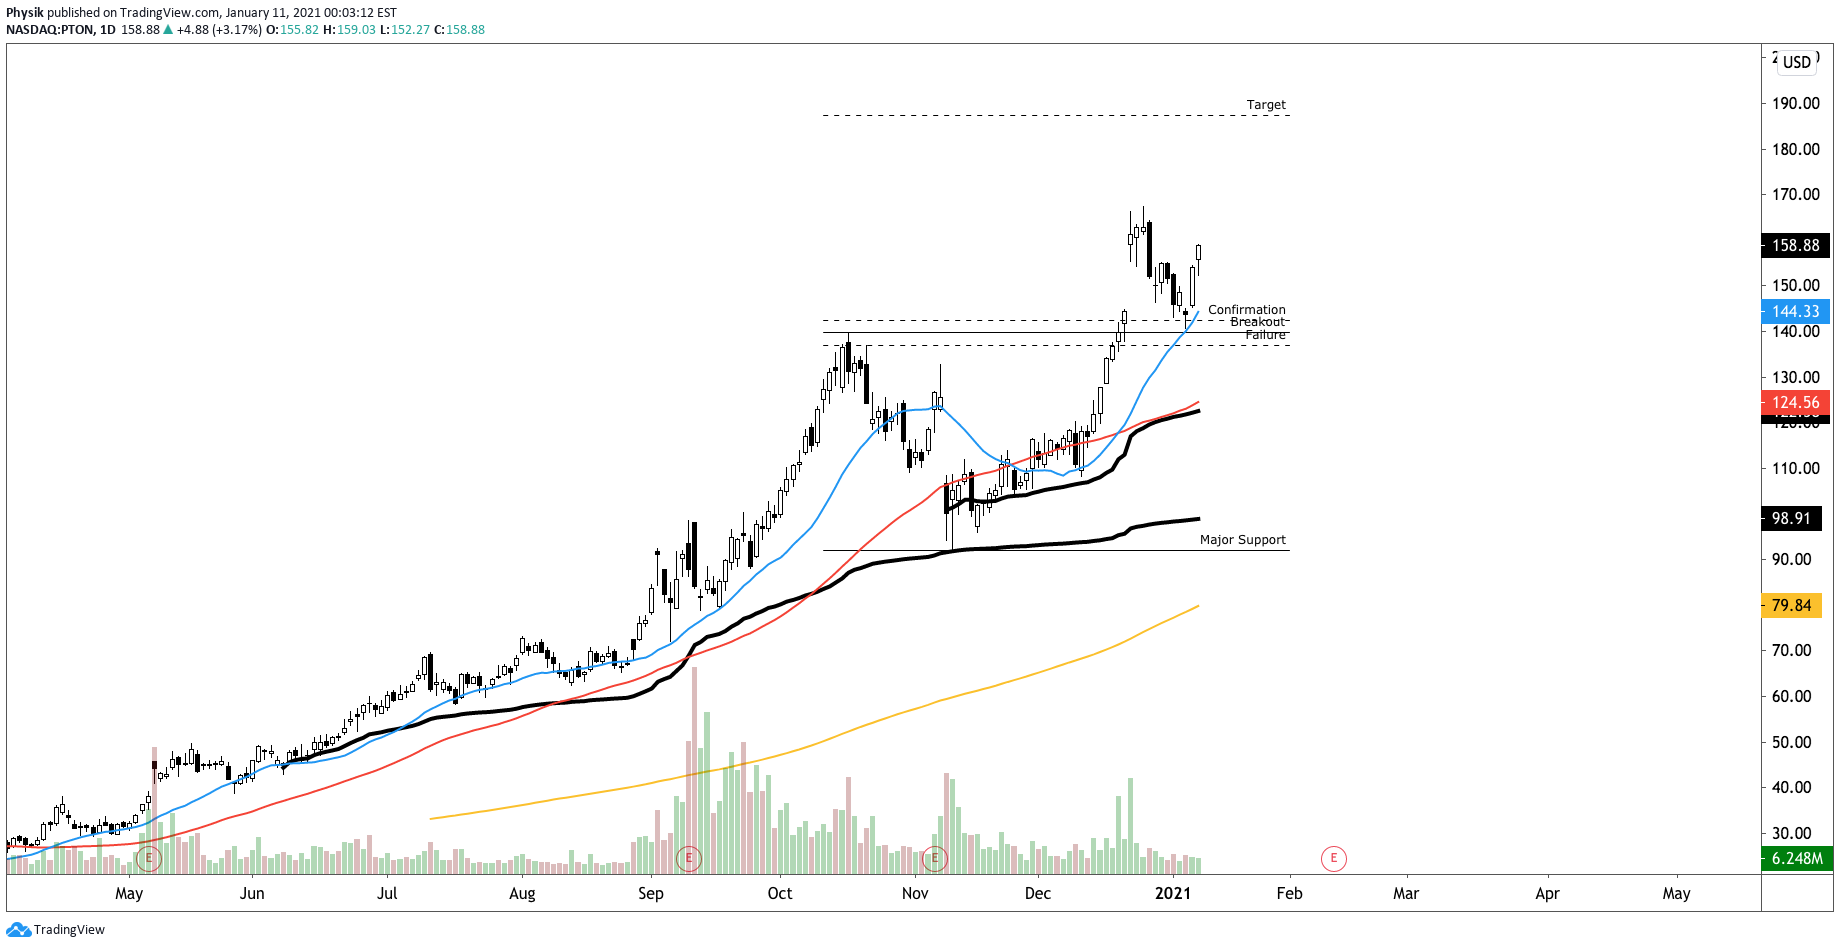
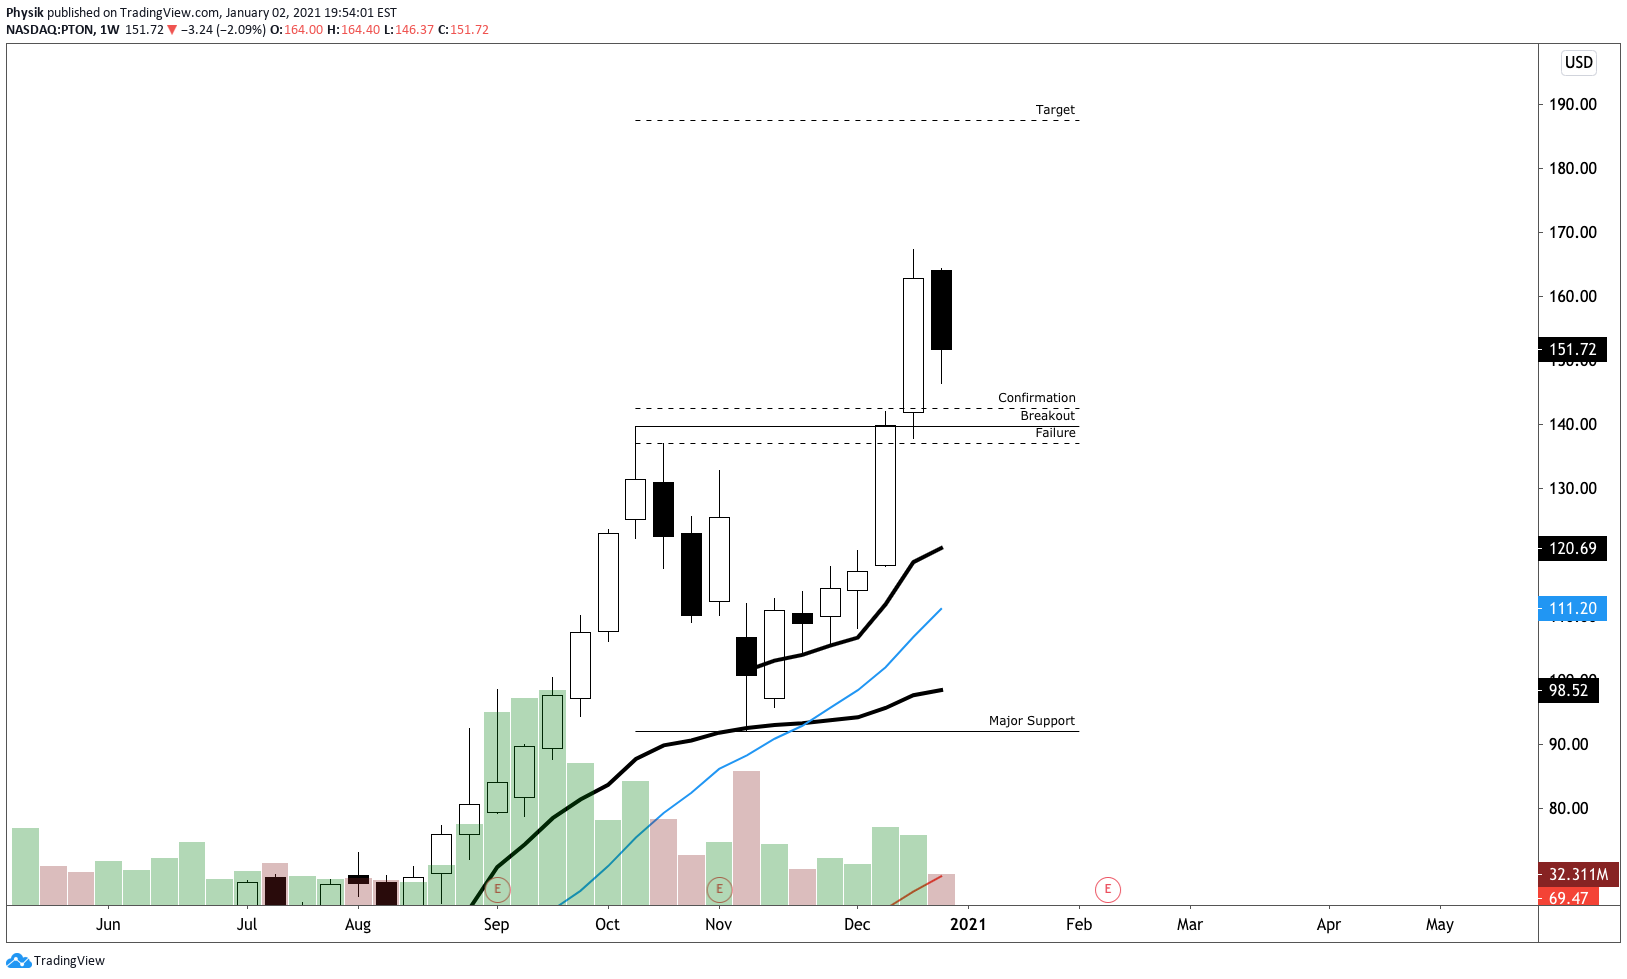
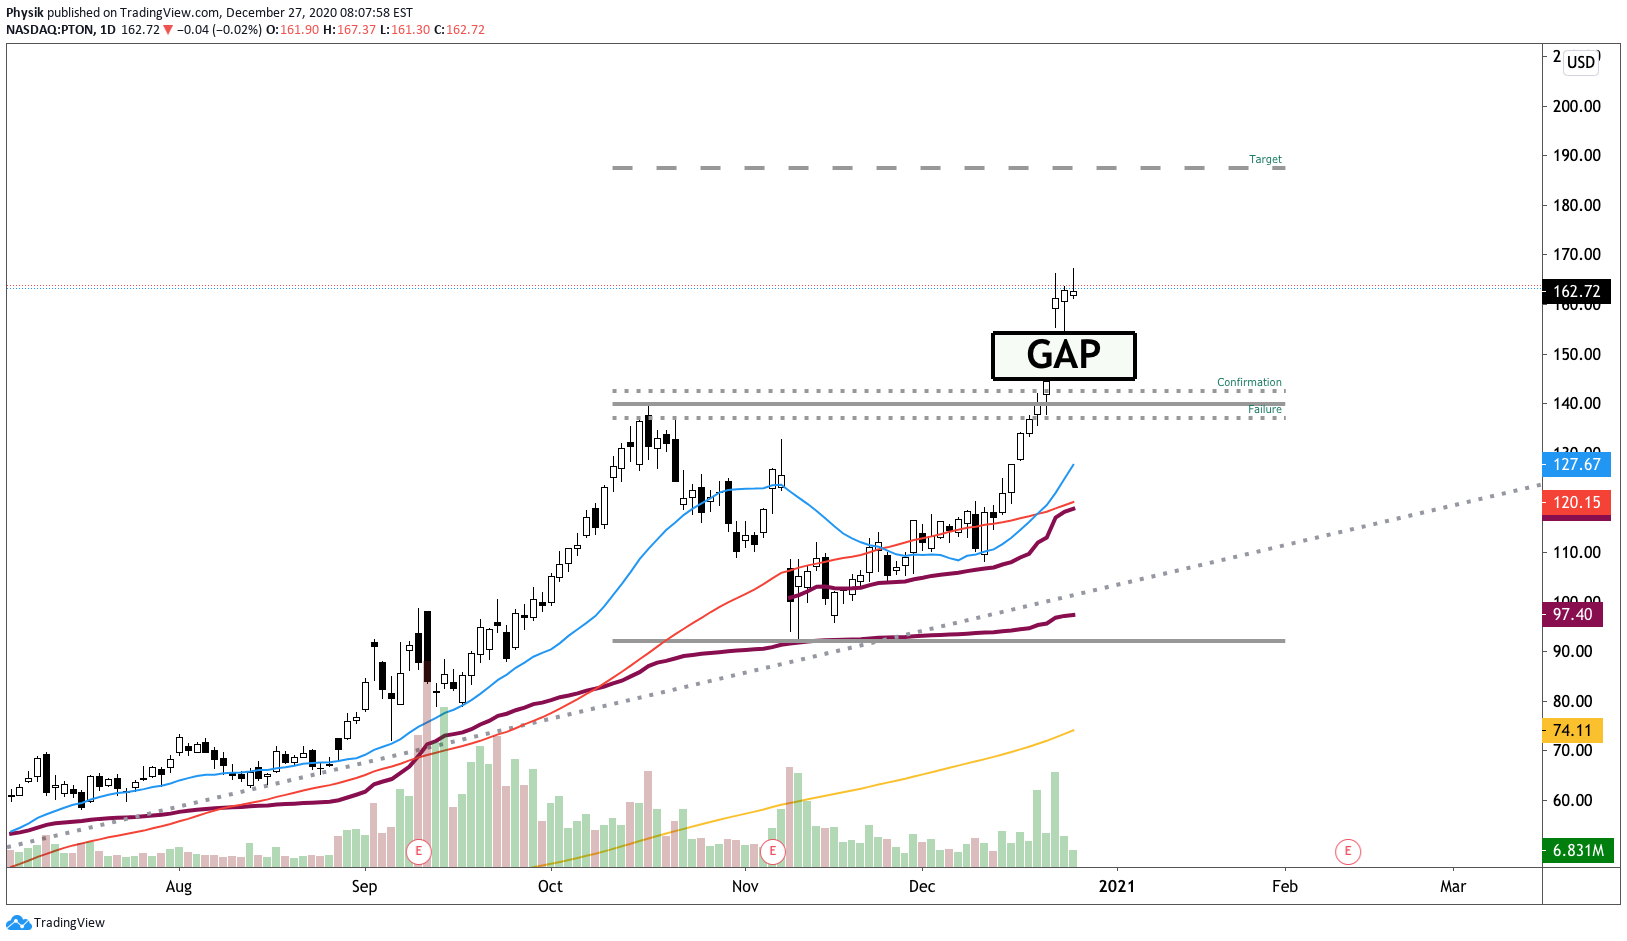
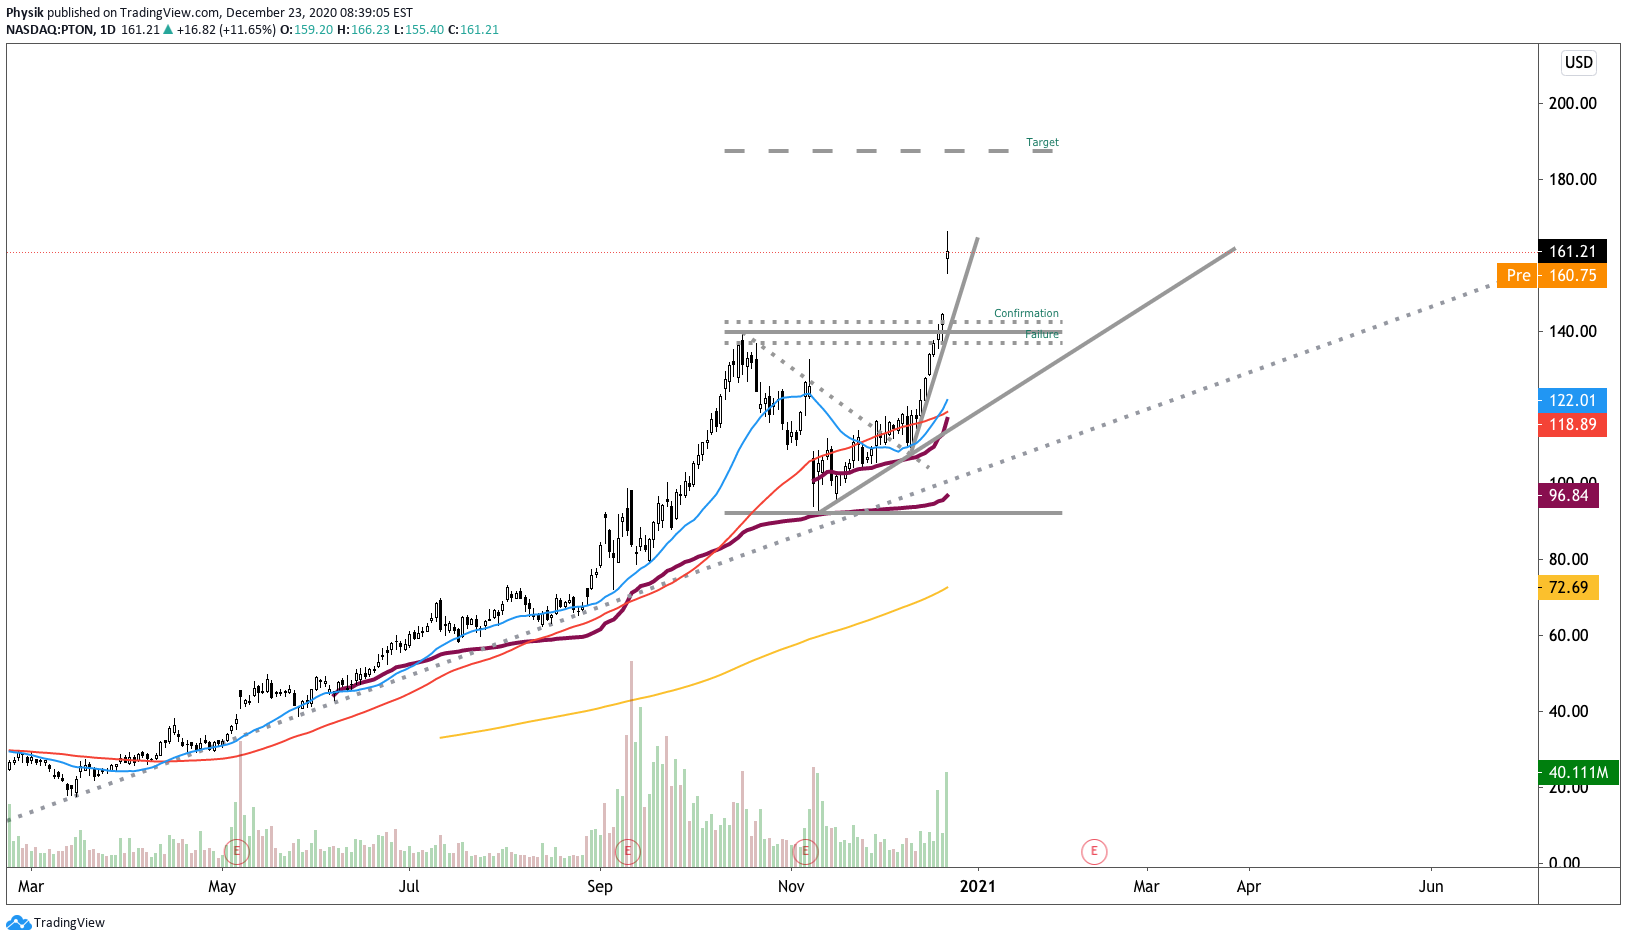
Shares of Amazon Inc (NASDAQ: AMZN) just missed the round $3,000.00 figure and Peloton Interactive Inc (NASDAQ: PTON) fell on waning demand, while Netflix Inc (NASDAQ: NFLX) traded down just over 20.00% on a weak subscriber outlook.

“Thursday’s trading pattern looks exactly like a typical session from the summer of 2007 as the sub-prime crisis was beginning to send the first shock waves through the stock market,” said Bloomberg’s John Authers on wild changes in sentiment exacerbating the volatility. 

“Big changes of direction in the last hour, with no obvious news to trigger them, became a fact of life.”

Moreover, with pandemic-era speculation still embedded in prices, Authers adds, the removal of central bank liquidity opens the door to even lower prices as the “process to correct a lot of excess is now underway.”

Regardless of how aggressive contractions in monetary policy are, the Federal Reserve will spell out its plans well in advance, Fed Governor Christopher Waller explained

“I don’t see a 50 basis point hike in March. We have not prepared markets for anything that dramatic. One of our key themes has been not to surprise market, giving well enough advance, in terms of what we’re trying to do.”

Graphic: Per The Market Ear, “Equities usually deliver lower returns but with lower volatility during faster Fed hiking episodes.”

At present, a full 25 basis point hike is priced by March. 

Graphic: Via Bloomberg, there are four rate hikes priced for the year.

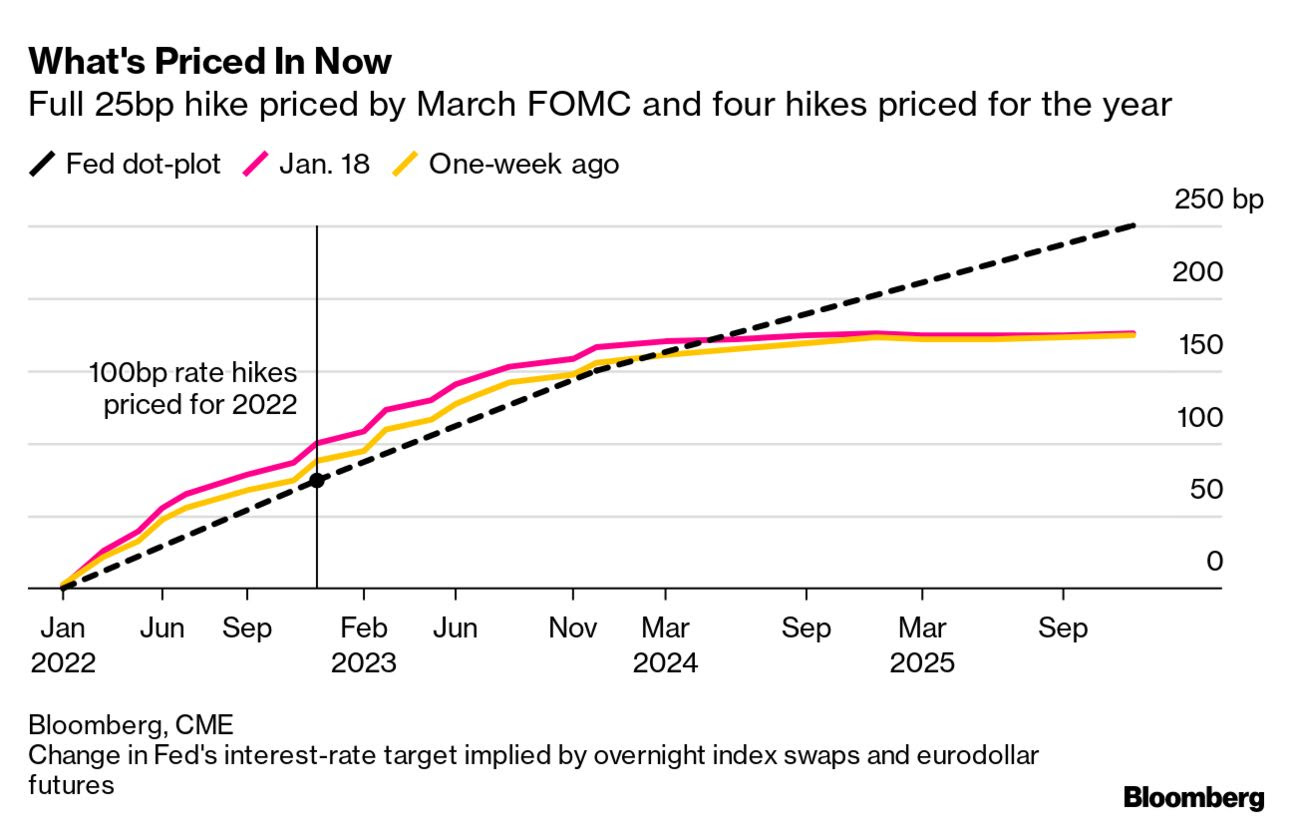
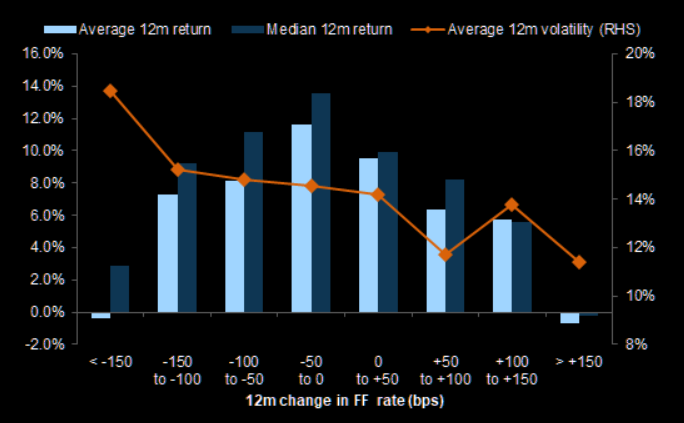
Per S&P Global Inc (NYSE: SPGI) analyses, these hikes are likely to “cause shorter-term rates, such as the 1- and 2-year Treasury yields, to climb more rapidly than longer-term rates,” potentially pressuring consumer credit, and increasing the costs of loans.

“By launching the reduction in the balance sheet, the Fed could match the rise in short-term rates with a similar rise in longer duration rates,” thus reducing the Fed’s need to hike rates, S&P Global explained.

“Given mortgage rates and corporate borrowing costs are more impacted by movements in 10-year yields than 3-month rates, the Fed funds target rate may not need to be increased as aggressively to get inflation under control,” James Knightley, an ING Groep NV (NYSE: ING) economist, added.

Positioning: Per Morgan Stanley’s (NYSE: MS) prime brokerage data, investors are deploying a more defensive tilt to portfolios in the face of a deceleration in sales and margin compression.

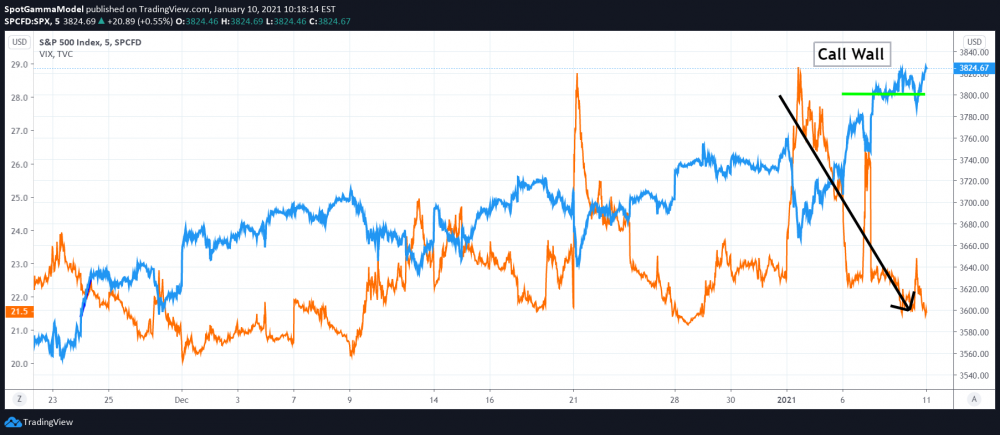
This “stock liquidation played into the large negative gamma position which accelerated selling into the close,” according to options modeling and analysis service SpotGamma.

For context, “when a position’s delta falls (rises) with stock or index price rises (falls), the underlying is in a negative-gamma environment.”

In such an environment, the expansion of volatility as a result of demand for downside (put) protection (a lot of which is short-dated and increasingly sensitive to direction) for instance, leaves dealers compounding weakness. 

Graphic: Implied volatility term structure shifts higher, mostly at the front-end.

Therefore, in the case of heightened demand for downside put protection (a negative-delta trade), higher implied volatility increases dealer exposure positive delta. 

To offset this positive delta exposure, dealers sell more underlying, exacerbating weakness.

The passage of the monthly options expiration (OPEX) ought to clear some of the put-heavy positioning; “removal of this exposure post-OPEX,” coupled with a reduction in embedded event premiums tied to the approaching Federal Open Market Committee (FOMC) event, “will leave dealers with less positive delta exposure to sell against.”

This opens up a window of strength wherein dealers are to take less liquidity (buy strength and sell weakness) and pressure less the market in hedging put-heavy positioning. 

Graphic: Taken from The Market Ear. In a lower liquidity environment, dealer hedging matters more.

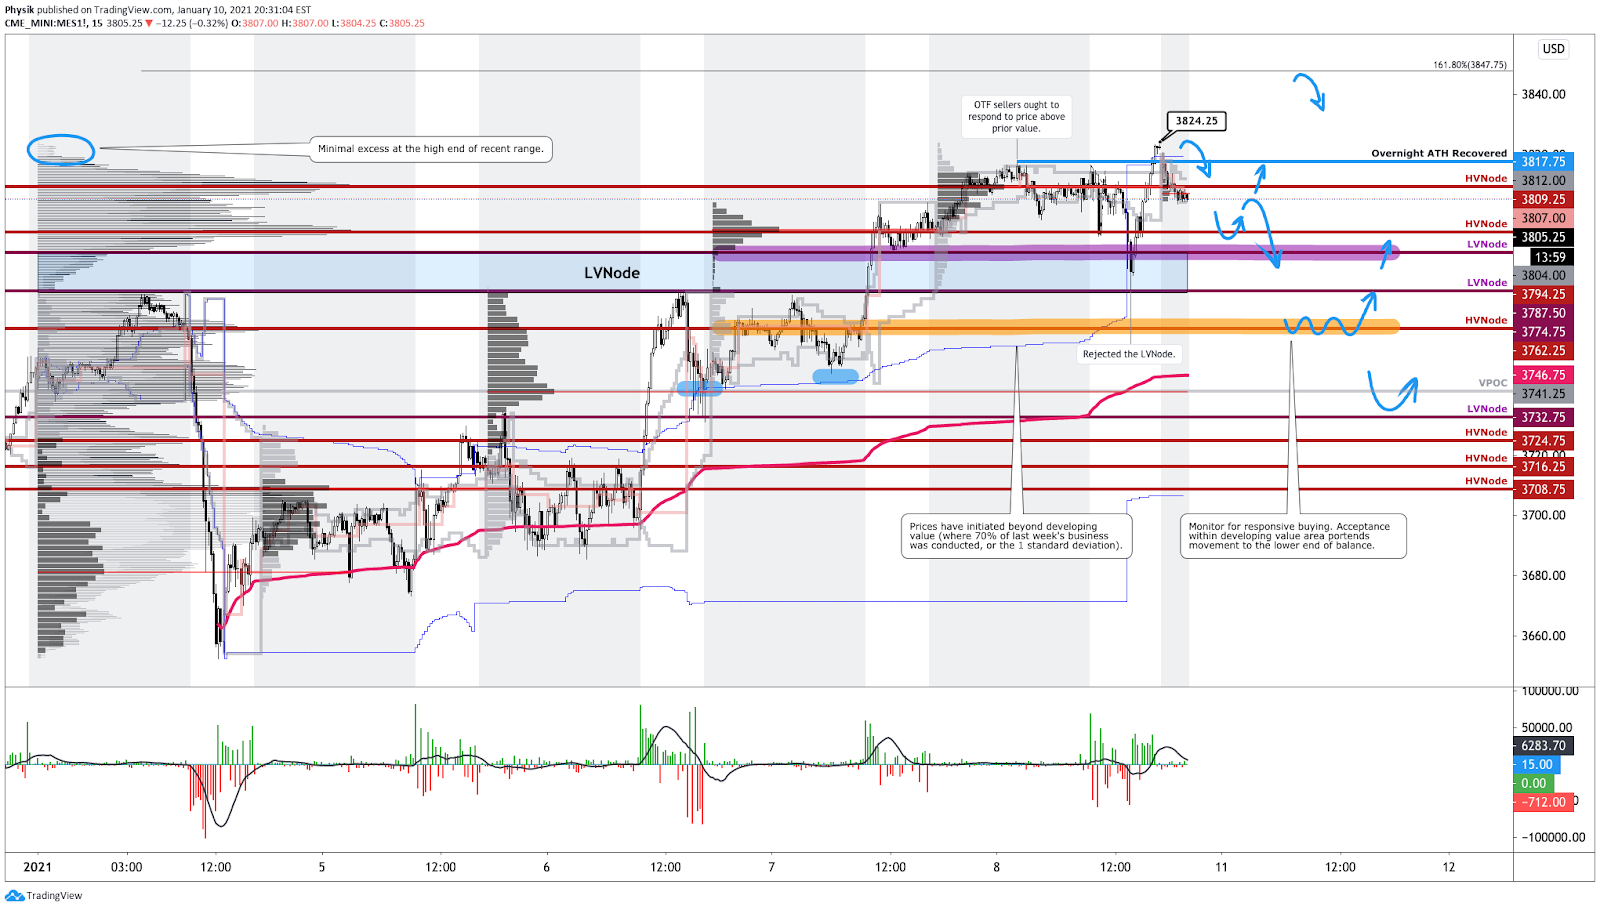
Technical: As of 6:30 AM ET, Friday’s regular session (9:30 AM – 4:00 PM ET), in the S&P 500, will likely open in the middle part of a balanced overnight inventory, inside of prior-range and -value, suggesting a limited potential for immediate directional opportunity.

Spikes: Spike’s mark the beginning of a break from value. Spikes higher (lower) are validated by trade at or above (below) the spike base (i.e., the origin of the spike). The base is $4,549.00.

In the best case, the S&P 500 trades higher; activity above the $4,471.00 point of control (POC) puts in play the $4,526.25 high volume area (HVNode). Initiative trade beyond the HVNode could reach as high as the $4,581.00 untested point of control (VPOC) and $4,619.00 HVNode, or higher.

In the worst case, the S&P 500 trades lower; activity below the $4,471.00 POC puts in play the $4,425.00 VPOC. Initiative trade beyond the $4,425.00 VPOC could reach as low as the $4,349.00 and $4,299.00 VPOCs, or lower.

Click here to load today’s key levels into the web-based TradingView charting platform. Note that all levels are derived using the 65-minute timeframe. New links are produced, daily.
Graphic: 65-minute profile chart of the Micro E-mini S&P 500 Futures.

What People Are Saying

Definitions

Volume Areas: A structurally sound market will build on areas of high volume (HVNodes). Should the market trend for long periods of time, it will lack sound structure, identified as low volume areas (LVNodes). LVNodes denote directional conviction and ought to offer support on any test. 

If participants were to auction and find acceptance into areas of prior low volume (LVNodes), then future discovery ought to be volatile and quick as participants look to HVNodes for favorable entry or exit.

POCs: POCs are valuable as they denote areas where two-sided trade was most prevalent in a prior day session. Participants will respond to future tests of value as they offer favorable entry and exit.

Options Expiration (OPEX): Traditionally, option expiries mark an end to pinning (i.e, the theory that market makers and institutions short options move stocks to the point where the greatest dollar value of contracts will expire) and the reduction dealer gamma exposure.

About

After years of self-education, strategy development, mentorship, and trial-and-error, Renato Leonard Capelj began trading full-time and founded Physik Invest to detail his methods, research, and performance in the markets.

Capelj is also a Benzinga finance and technology reporter interviewing the likes of Shark Tank’s Kevin O’Leary, JC2 Ventures’ John Chambers, FTX’s Sam Bankman-Fried, and ARK Invest’s Catherine Wood, as well as a SpotGamma contributor developing insights around impactful options market dynamics.

Disclaimer

Physik Invest does not carry the right to provide advice.

In no way should the materials herein be construed as advice. Derivatives carry a substantial risk of loss. All content is for informational purposes only.

Categories
Commentary

Market Commentary For The Week Ahead: ‘Euphoria Is The Status Quo’

Key Takeaways:

  • Higher-time frame breakouts remain intact.
  • Volatility rises; markets are a tad euphoric
  • Equity funds went all in at the top, literally
  • Corporate credit outlook enhanced greatly. 
  • Earnings could rise faster than anticipated. 
  • Blue wave implies more stimulus, spending.
  • The bull market broadens as sectors rotate
  • M2 and yields break out; the Fed could act.

What Happened: As investors looked beyond a weak jobs report and political uncertainty, to added economic stimulus and the coming earnings season, U.S. index futures hit new highs.

Graphic 1: Profile overlays on a 15-minute candlestick chart of the Micro E-mini S&P 500 Futures

What To Expect: Friday’s session in the S&P 500 found initiative buying surface after a test of $3,774.75, the lower boundary of the low-volume area left in the wake of Thursday’s opening drive.

The long-liquidation and subsequent recovery left the market with minimal excess (i.e., a proper end to discovery) at the highs, and a strong close, taking out the overnight stat at $3,817.75 (which had low odds of remaining, given that overnight all-time highs rarely end the upside discovery process).

Noting: Excess forms after an auction has traveled too far in a particular direction and portends a sustained reversal. The absence of excess, in the case of a high, suggests not enough conviction; in such case participants will liquidate (i.e., back off the high) and strengthen the market, before following through.

In light of the market’s search for an area to establish balanced, two-sided trade, participants will come into Monday’s session knowing the following: 

  1. The multi-month upside breakout targeting S&P 500 prices as high as $4,000.00 remains intact.
  2. Prices are above all major moving averages, including the year-to-date volume-weighted average price (VWAP). 
  3. After the resolution of last Monday’s long-liquidation, the market shifted into price discovery mode, evidenced by higher prices and value migration.
  4. For numerous sessions, profile structures denoted the presence of short-covering, the result of old, weak-handed business emotionally buying to cover short positions, causing swift movement followed by a stalled advance, or two-sided intraday trade.
  5. The week ending January 8 established a v-pattern recovery, a price sequence that ought to be followed by further price discovery, as high as the 100% price projection, which happens to be near the multi-month upside breakout target at $4,000.
  6. Unsupportive speculative flows and delta (e.g., commitment of buying or selling) in some instances, as can be viewed by order flow graphics 2 and 3 below. 
  7. Alongside the long gamma narrative, in which dealers buy dips and sell rips to hedge their exposure, record options activity, among other dynamics, the S&P 500 closed near $3,800, a high open interest strike. For sustained upside directional resolve, participants would look for this exposure to roll up. 
Pictured: Divergent delta in the iShares Russell 2000 ETF (NYSE: IWM), one of the largest ETFs that track the Russell 2000
Pictured: Order flow in the SPDR S&P 500 ETF Trust (NYSE: SPY), the largest ETF that tracks the S&P 500
Graphic 4: S&P 500 tests the $3,800 high open interest strike, per SpotGamma

Given the above dynamics, the following frameworks apply for next week’s trade.

In the best case, the S&P 500 remains above its $3,762.25 high-volume node (HVNode). Expectations thereafter include continued balance or a response followed by initiative buying to take out the price extension at $3,847.75. 

Noting: Any structure that denotes meaningful buying continuation, not short-covering, would feature elongated, upside range expansion on committed volumes, as well as the migration of value. 

In the worst case, the S&P 500 initiates below its $3,762.25 HVNode. Expectations thereafter include a test of the minimal excess low near $3,732.75 (a LVNode). A break of Monday’s regular session (9:30 AM – 4:00 PM ET) low would jeopardize the bullish thesis. 

Two go, no-go levels exist; trade that finds increased involvement above $3,824.25 and below $3,775.25 would suggest a change in conviction. Anything in-between favors responsive trade.

Conclusions: In a GMO article, Jeremy Grantham expressed his opinion on recent market activity.

I am long retired from the job of portfolio management but I am happy to give my opinion here: it is highly probable that we are in a major bubble event in the U.S. market, of the type we typically have every several decades and last had in the late 1990s. It will very probably end badly, although nothing is certain. I will also tell you my definition of success for a bear market call. It is simply that sooner or later there will come a time when an investor is pleased to have been out of the market. That is to say, he will have saved money by being out, and also have reduced risk or volatility on the round trip. This definition of success absolutely does not include precise timing. (Predicting when a bubble breaks is not about valuation. All prior bubble markets have been extremely overvalued, as is this one. Overvaluation is a necessary but not sufficient condition for their bursting.) Calling the week, month, or quarter of the top is all but impossible.

Continuing, in addition to market participants reckoning with the uneven recovery, stimulus, trade, inflation, among other risks, they must also worry about something that’s arguably more important: price and value.

As of now, all broad-market indices are in an uptrend, evidenced by higher prices and value. A break below $3,600.00 in the S&P 500 would denote a substantial change in tone.

Levels Of Interest: $3,762.25 HVNode, $3,732.75 LVNode, $3,824.25 rally high, as well as the $3,847.75 price extension.

Bonus: Some opportunities unfolding in the week ahead.

Photo by Valdemaras D. from Pexels.

Categories
Commentary

Market Commentary For The Week Ahead: ‘Hello, Goodbye’

Key Takeaways:

What Happened: Coming into the extended holiday weekend, on tapering volumes, U.S. index futures balanced for four regular trading sessions (9:30 AM – 4:00 PM ET), before breaking out.

Pictured: Profile overlays on a 15-minute candlestick chart of the Micro E-mini S&P 500 Futures

What To Expect: Thursday’s session found initiative buying surface above the $3,731.00 high-volume node (HVNode), the market’s most recent perception of value.

Given four-sessions worth of unchanged value, and the failure to fill the gap beneath a weak low (i.e., a visual level that attracts the business of short-term, technically-driven market participants) at $3,714.50, participants will come into Monday’s session knowing the following:

  1. Amid Thursday’s late-day buying, price diverged from value.
  2. The overnight rally high at $3,747.75 was recovered (i.e., based on historical trade, there were low odds that the overnight all-time high would end the upside discovery process).
  3. The multi-month upside breakout targeting S&P 500 prices as high as $4,000.00 remains intact.

In light of the above dynamics, the following frameworks apply for next week’s trade.

In the best case, the S&P 500 remains above its $3,731.00 HVNode. Expectations thereafter include continued balance, or a response followed by initiative buying to take out the price extension at $3,756.75.

In the worst case, the S&P 500 initiates below its $3,731.00 HVNode. Expectations thereafter include a test of the weak, minimal excess low at $3,714.50, and subsequent follow-through as low as the $3,691.00 break-point. 

Noting: Excess forms after an auction has traveled too far in a particular direction and portends a sustained reversal. Absence of excess, in the case of a low, suggests minimal conviction; participants will cover (i.e., back off the low) and weaken the market, before following through.

Two go, no-go levels exist; trade that finds increased involvement above $3,752.75 and below $3,714.50 would suggest a change in conviction. Anything in-between favors responsive trade.

Conclusion: From an uneven recovery, stimulus, elections, trade, and the like, it helps to boil it down to what actually matters: price and value. 

Though risks remain, markets are pricing in the odds of a continued rebound. All broad-market indices are in an uptrend. A break below $3,600.00 in the S&P 500 would denote a substantial change in tone.

Pictured: Retest of the upside breakpoint on a weekly candlestick chart of the cash S&P 500 Index

Levels Of Interest: $3,752.75 rally-high, $3,714.50 weak low, $3,731.00 HVNode, $3,756.75 price extension, $3,691.00 break-point.

Bonus: Here is a look at some of the opportunities unfolding.

Photo by Max Walter from Pexels.

Categories
Commentary

Market Commentary For The Week Ahead: ‘All In At The Top’

Key Takeaways:

  • Analysts extended 2021 S&P 500 targets.
  • Fear and greed are tugging at each other. 
  • Jefferies ups 2021 GDP forecast to 5.25%.
  • Net equity buying the largest in months.
  • Inflation is rising where you don’t want it.
  • Positioning suggests elevation of volatility.
  • The big picture breakouts remain intact.

What Happened: Coming into the extended holiday weekend, on tapering volumes, U.S. index futures balanced within prior range. 

This activity occurred in the context of a larger balance-area forming just beyond the $3,600.00 multi-month break-out point. Given the lack of range expansion, in addition to the aforementioned responsive, back-and-forth trade, participants are signaling a lack of conviction.

Though there is a lot of noise in the markets — an uneven recovery, stimulus, elections, trade, and the like — one key point remains: the multi-month upside breakout targeting S&P 500 prices as high as $4,000.00 remains intact. Add to this the recovery of Monday’s liquidation fueled by weak-handed, short-term buyers, and the fact that the all-time $3,724.25 rally-high was established in an overnight session, it is highly likely that the upside discovery process has yet to end.

Note: Historically, there is a low probability that overnight all-time highs end the upside discovery process. 

Pictured: Profile overlays on a 30-minute candlestick chart of the Micro E-mini S&P 500 Futures

What To Expect: Friday’s session found responsive selling surface near the $3,691.00 profile level. Given that participants had difficulty in sustaining higher prices, alongside shortened holiday trade, the following frameworks apply for next week’s trade.

In the best case, the S&P 500 remains above its $3,667.75 HVNode, and continues to balance. As stated earlier, given the tapering volume and holiday, the odds of directional resolve are quite low. 

Two go, no-go levels exist; trade that finds increased involvement above $3,691.00 and below $3,667.75 would suggest a change in conviction. Anything in-between favors responsive trade.

Conclusion: Bank of America Corp’s (NYSE: BAC) Michael Hartnett summarized it best: “[T]he year of the virus, the lockdown, a crash, a recession, an epic policy panic, the greatest stock market rally of all-time, a V-shape economic recovery, and ending with a vaccine for COVID-19.”

Though risks remain, markets are pricing in the odds of a continued rebound. Unless some exogenous event were to transpire, technically speaking, all broad-market indices are in an uptrend. A move below $3,600.00 in the S&P 500 would denote a change in tone, increasing the likelihood of a failed breakout that would target prices as low as $3,200.00.

Pictured: Retest of the upside breakpoint on a daily candlestick chart of the cash S&P 500 Index

Levels Of Interest: The $3,691.00 boundary and $3,667.75 HVNode.

Bonus: Here is a look at some of the opportunities unfolding.

Photo by Raka Miftah from Pexels.

Categories
Commentary

Market Commentary For 12/23/2020

What Happened: After a day of balance, and a brief overnight liquidation alongside news that President Donald Trump would not sign a coronavirus relief bill until the size of stimulus checks is increased, U.S. index futures rebounded, with the S&P 500 returning to the $3,691.00 ledge, a level that’s repeatedly attracted responsive sellers.

What Does It Mean: During Tuesday’s session, participants accepted the prior day’s recovery, evidenced by the two-sided trade at prices where the most activity occurred during the prior day, or point of control (POC).

Given that participants deem the high end of Monday’s range fair to do business in, participants will come into Wednesday’s session knowing that the $3,691.00 high-volume ledge is a key upside reference. The aforementioned ledge denotes a pause in discovery, likely attributable to the declining participation ahead of the holiday weekend.

That said, below the ledge, responsive buyers continue to resurface at the $3,667.75 high-volume node (HVNode) on long liquidations (i.e., those events that are caused by overly committed short-term participants that trim positions in panic because they lack the wherewithal or conviction to follow-through).

Pictured: Visual of /MES $3,691.00 ledge.

What To Expect: In light of the overnight recovery and trade near the $3,691.00 ledge, the following frameworks apply for today’s trade.

In the best case, buyers hold the the index above its $3,667.75 HVNode. Holding said reference would be indicative of continued balance after Monday’s recovery; in such case, participants would look for signs of follow-through above the $3,691.00 ledge. Once the ledge cracks (i.e., participants initiate and accept, spend more than 15-minutes above the level), it ought to (1) offer support and (2) draw in buyers to continue the upside discovery process up to, at least, the $3,700.00 and $3,707.75 HVNodes.

Anything higher targets the $3,724.25 overnight rally high.

Levels Of Interest: The $3,691.00 ledge, $3,667.75, $3,700.00 and $3,707.75 HVNodes, as well as the $3,724.25 overnight high.

Bonus: Big-picture breakout remains intact. See below for opportunities unfolding.

Pictured: Daily candlestick chart of the cash S&P 500 Index
Categories
Commentary

‘Rising Tide Lifts All Boats’: Market Commentary For The Week Ahead

Key Takeaways:

What Happened: U.S. index futures auctioned to new all-time highs before weakening into Friday’s derivative expiry.

What Does It Mean: After participants established a rally-high in the December 9 overnight session, the S&P 500 liquidated down to the balance-area boundary near $3,625.00.

After the December 14 gap open on COVID-19 coronavirus vaccine and stimulus progress, for the remainder of the week, indices negated prior selling, establishing a new all-time high. Friday’s trade managed to repair some structural deficiencies left in the aforementioned advance.

Pictured: Profile overlays on a 65-minute candlestick chart of the Micro E-mini S&P 500 Futures

What To Expect: Friday’s session found responsive buyers surface at the low-volume node (LVNode) near $3,680.00. Low-volume areas denote directional conviction and ought to resist future auction rotations. Auctioning through the LVNode would foreshadow further rotation and trade as low as the balance-area low.

Given that the higher-time frame breakout remains intact and selling appears non-committal, participants will come into Monday’s session knowing the following:

  1. Both sentiment and positioning are historically stretched, while the recovery remains uneven
  2. Inflation remains cool due to the profound influence of disruptive innovation.
  3. U.S. Congress reaches deal on COVID-19 aid package, plans votes for Monday. 
  4. The decline in realized correlation due to factor and sector rotation, as well as the return of systematic option selling strategies will push the long-gamma narrative in which volatility is suppressed and the market pins or slowly rises in a range-bound fashion.
  5. The S&P 500’s higher-time frame breakout remains intact (see chart below); JPMorgan Chase & Co. (NYSE: JPM) confirms equities will rally short-term with the S&P 500 auctioning as high as $4,000.
  6. Despite high CAPE ratios, stock-market valuations aren’t that absurd.

Therefore, the following frameworks for next week’s trade apply.

In the best case, buyers maintain conviction and hold the index above the $3,680.00 LVNode. Auctioning below said reference denotes a change in conviction. Participants would then look for a response near the $3,667.75 HVNode. Failure to remain above the HVNode would portend rotation, further balancing. 

In the worst case, participants initiate below the $3,625.00 balance-area low, jeopardizing the higher-time frame breakout.

Conclusion: As BlackRock Inc (NYSE: BLK) said, “a rising tide lifts all boats”; though financial markets have largely priced in positive news surrounding vaccines and stimulus, the rally remains intact, bolstered by a drive for yield — technical factors as a result of systemic and hedge fund strategies, among other things.

Pictured: Retest of the upside breakpoint on a daily candlestick chart of the cash S&P 500 Index

Levels Of Interest: $3,740.75 and $3773.75 price extensions, $3,724.25 all-time rally high, the micro-composite HVNode at $3,707.75, $3,691.00, and $3,667.75, as well as the $3,680 LVNode and poor structure near the $3,625.00 balance-area low.

Bonus: Here is a look at some of the opportunities unfolding.

Photo by Fede Roveda from Pexels.

Categories
Commentary

Market Commentary For 12/17/2020

What Happened: After yesterday’s Federal Reserve policy decision, U.S. index futures auctioned higher overnight alongside hopes of added U.S. fiscal and monetary stimulus, as well as vaccine rollouts.

What Does It Mean: During Wednesday’s regular trade, the S&P 500 initiated up to the $3,691.25 high-volume node, a valuable price, before sellers responded, established excess, and extended lower into the close.

Given the response to yesterday’s Federal Reserve decision, as well as overnight activity, the S&P 500 remains in a tactically bullish position, confirming the higher-time frame upside breakout which targets prices as high as $4,000.

What To Expect: In light of the overnight gap higher, the following frameworks apply for today’s trade.

In the best case, buyers maintain conviction and hold the index above the $3,691.25 high-volume node. Thereafter, upside references include the high-volume node near $3,710.00, and then the $3,720.00 price extension.

In the worst case, if the S&P 500 is brought back into range, participants can expect further balancing. The current market environment supports the long-gamma narrative in which volatility is suppressed and the market pins or slowly rises in a range-bound fashion.

Adding, the market has initiated back through $3,680.00, a low-volume area. Such low-volume areas denote directional conviction and ought to offer support on any test. Penetrating the low-volume area would put in play the $3,667.75 high-volume node.

Levels Of Interest:  $3,680.00 low-volume node, the $3,710.00 and $3,667.75 high-volume nodes, as well as the $3,720.00 price extension.

Bonus: Opportunities unfolding.