Key Takeaways:
- Higher-time frame breakouts remain intact.
- Volatility rises; markets are a tad euphoric.
- Equity funds went all in at the top, literally.
- Corporate credit outlook enhanced greatly.
- Earnings could rise faster than anticipated.
- Blue wave implies more stimulus, spending.
- The bull market broadens as sectors rotate.
- M2 and yields break out; the Fed could act.
What Happened: As investors looked beyond a weak jobs report and political uncertainty, to added economic stimulus and the coming earnings season, U.S. index futures hit new highs.
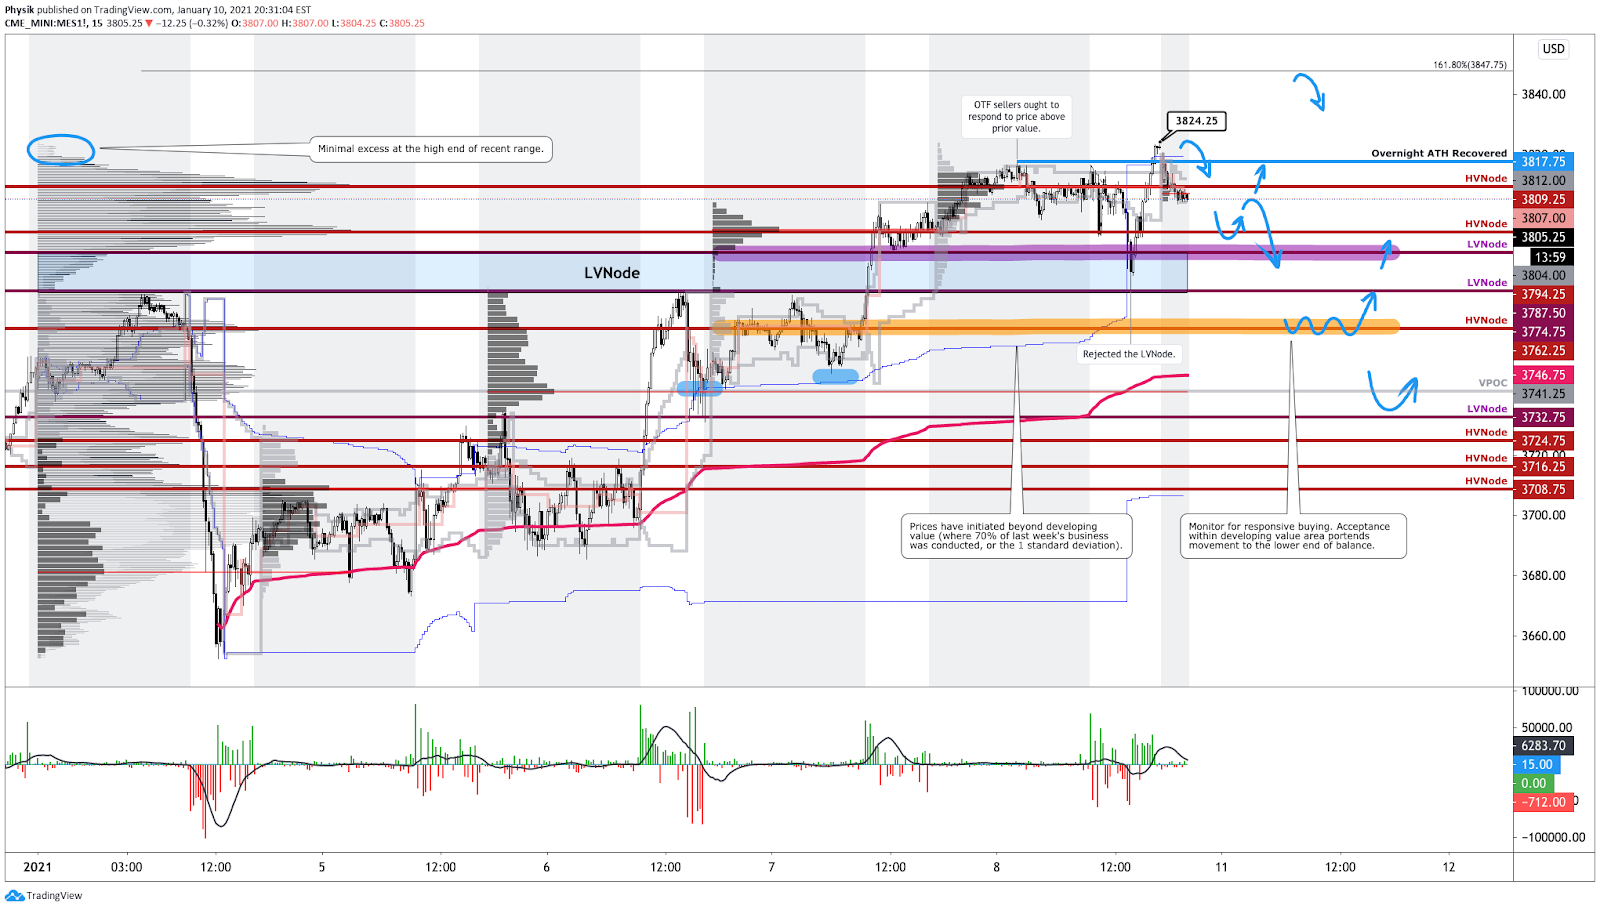
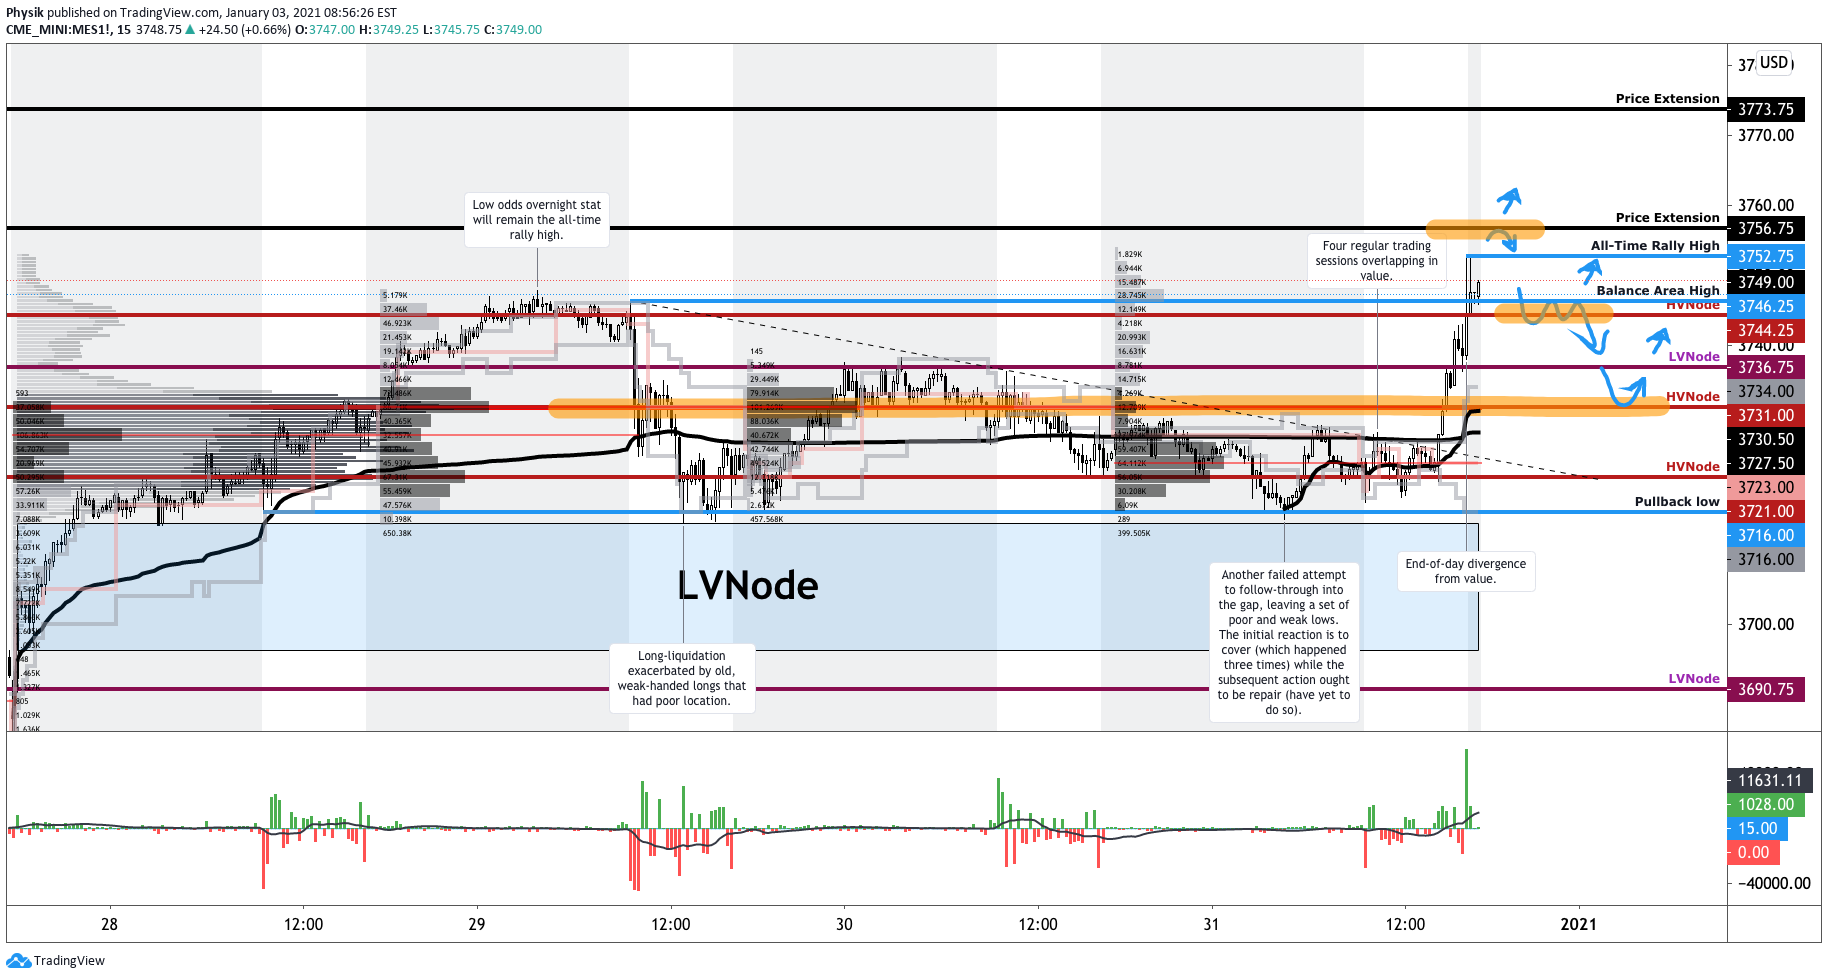
What To Expect: Friday’s session in the S&P 500 found initiative buying surface after a test of $3,774.75, the lower boundary of the low-volume area left in the wake of Thursday’s opening drive.
The long-liquidation and subsequent recovery left the market with minimal excess (i.e., a proper end to discovery) at the highs, and a strong close, taking out the overnight stat at $3,817.75 (which had low odds of remaining, given that overnight all-time highs rarely end the upside discovery process).
Noting: Excess forms after an auction has traveled too far in a particular direction and portends a sustained reversal. The absence of excess, in the case of a high, suggests not enough conviction; in such case participants will liquidate (i.e., back off the high) and strengthen the market, before following through.
In light of the market’s search for an area to establish balanced, two-sided trade, participants will come into Monday’s session knowing the following:
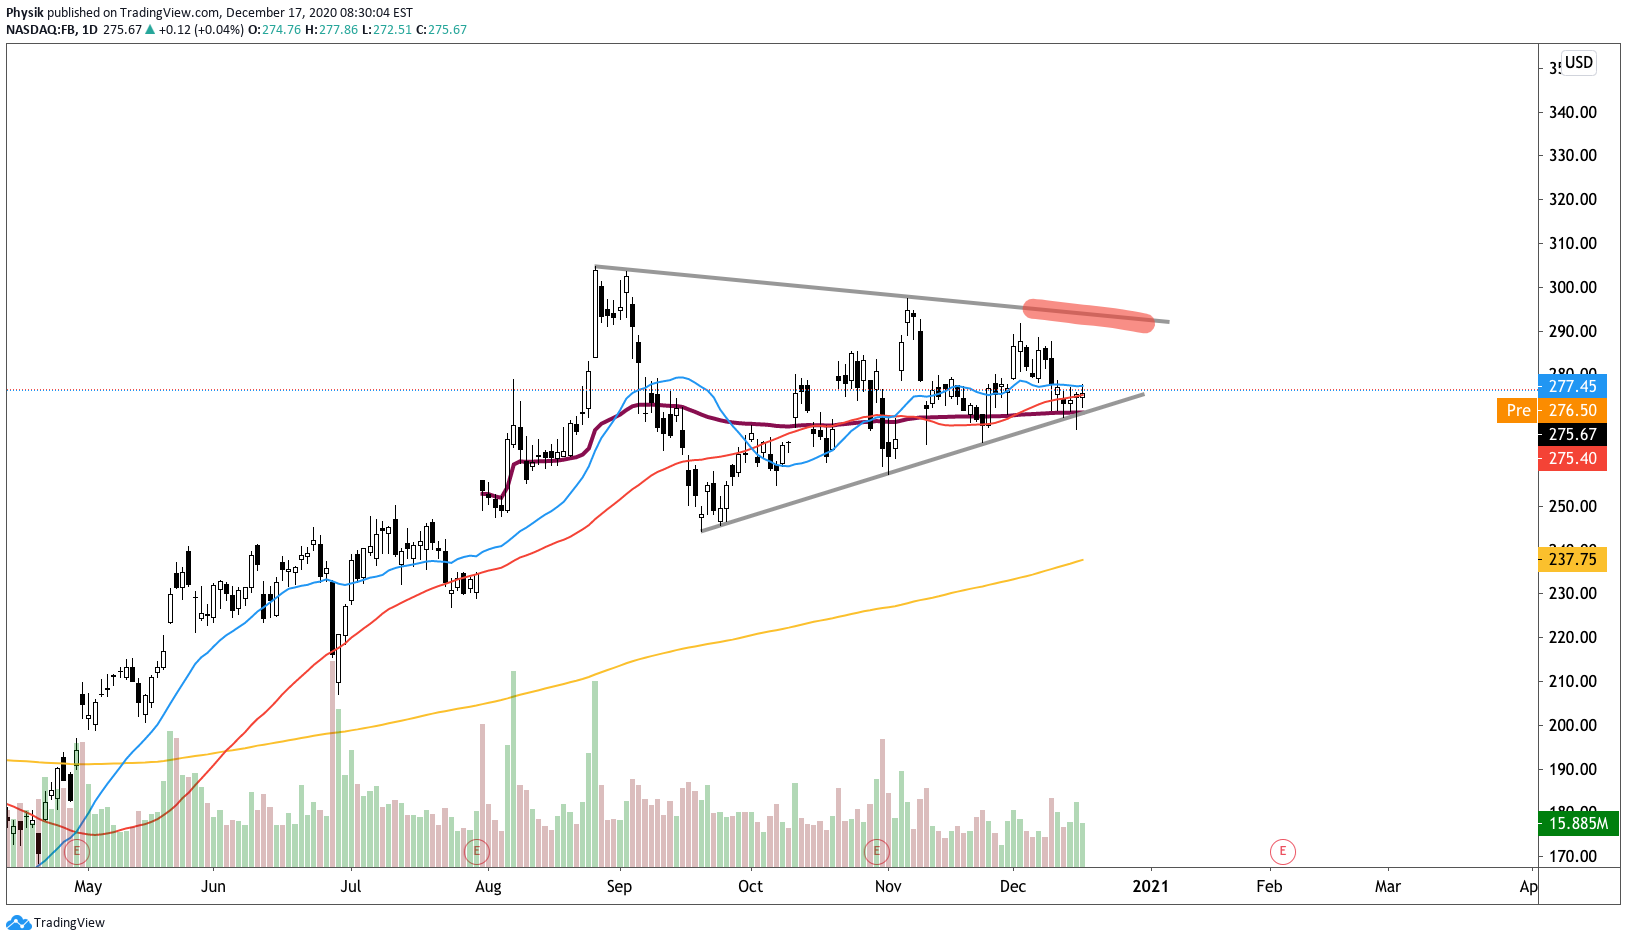
- The multi-month upside breakout targeting S&P 500 prices as high as $4,000.00 remains intact.
- Prices are above all major moving averages, including the year-to-date volume-weighted average price (VWAP).
- After the resolution of last Monday’s long-liquidation, the market shifted into price discovery mode, evidenced by higher prices and value migration.
- For numerous sessions, profile structures denoted the presence of short-covering, the result of old, weak-handed business emotionally buying to cover short positions, causing swift movement followed by a stalled advance, or two-sided intraday trade.
- The week ending January 8 established a v-pattern recovery, a price sequence that ought to be followed by further price discovery, as high as the 100% price projection, which happens to be near the multi-month upside breakout target at $4,000.
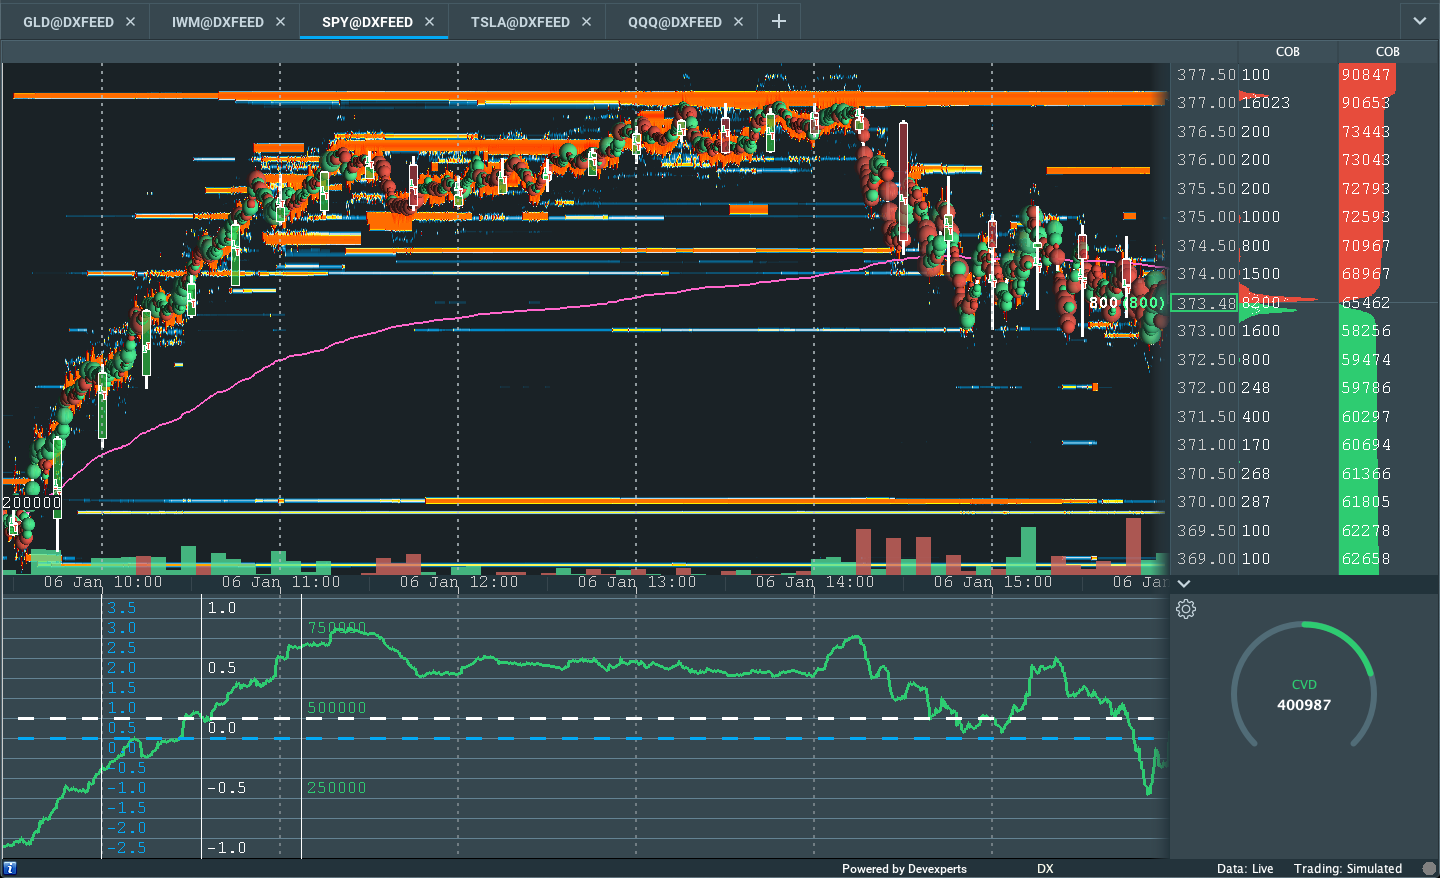
- Unsupportive speculative flows and delta (e.g., commitment of buying or selling) in some instances, as can be viewed by order flow graphics 2 and 3 below.
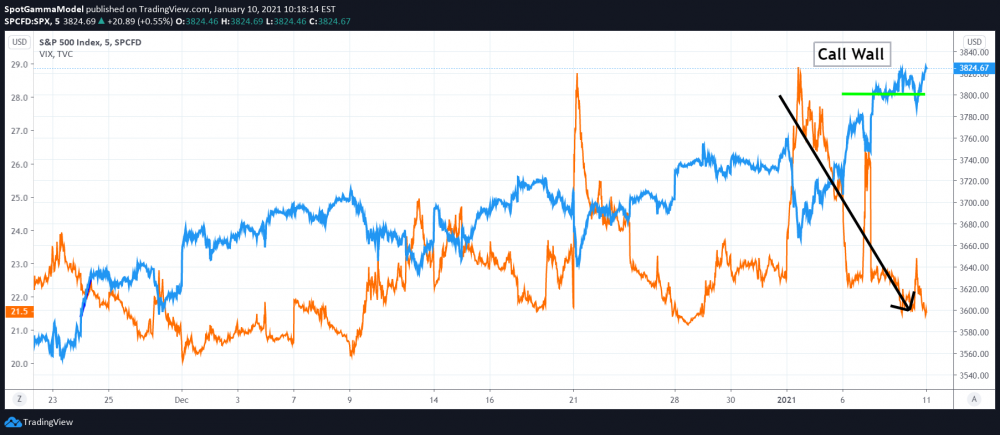
- Alongside the long gamma narrative, in which dealers buy dips and sell rips to hedge their exposure, record options activity, among other dynamics, the S&P 500 closed near $3,800, a high open interest strike. For sustained upside directional resolve, participants would look for this exposure to roll up.

Given the above dynamics, the following frameworks apply for next week’s trade.
In the best case, the S&P 500 remains above its $3,762.25 high-volume node (HVNode). Expectations thereafter include continued balance or a response followed by initiative buying to take out the price extension at $3,847.75.
Noting: Any structure that denotes meaningful buying continuation, not short-covering, would feature elongated, upside range expansion on committed volumes, as well as the migration of value.
In the worst case, the S&P 500 initiates below its $3,762.25 HVNode. Expectations thereafter include a test of the minimal excess low near $3,732.75 (a LVNode). A break of Monday’s regular session (9:30 AM – 4:00 PM ET) low would jeopardize the bullish thesis.
Two go, no-go levels exist; trade that finds increased involvement above $3,824.25 and below $3,775.25 would suggest a change in conviction. Anything in-between favors responsive trade.
Conclusions: In a GMO article, Jeremy Grantham expressed his opinion on recent market activity.
I am long retired from the job of portfolio management but I am happy to give my opinion here: it is highly probable that we are in a major bubble event in the U.S. market, of the type we typically have every several decades and last had in the late 1990s. It will very probably end badly, although nothing is certain. I will also tell you my definition of success for a bear market call. It is simply that sooner or later there will come a time when an investor is pleased to have been out of the market. That is to say, he will have saved money by being out, and also have reduced risk or volatility on the round trip. This definition of success absolutely does not include precise timing. (Predicting when a bubble breaks is not about valuation. All prior bubble markets have been extremely overvalued, as is this one. Overvaluation is a necessary but not sufficient condition for their bursting.) Calling the week, month, or quarter of the top is all but impossible.
Continuing, in addition to market participants reckoning with the uneven recovery, stimulus, trade, inflation, among other risks, they must also worry about something that’s arguably more important: price and value.
As of now, all broad-market indices are in an uptrend, evidenced by higher prices and value. A break below $3,600.00 in the S&P 500 would denote a substantial change in tone.
Levels Of Interest: $3,762.25 HVNode, $3,732.75 LVNode, $3,824.25 rally high, as well as the $3,847.75 price extension.
Bonus: Some opportunities unfolding in the week ahead.

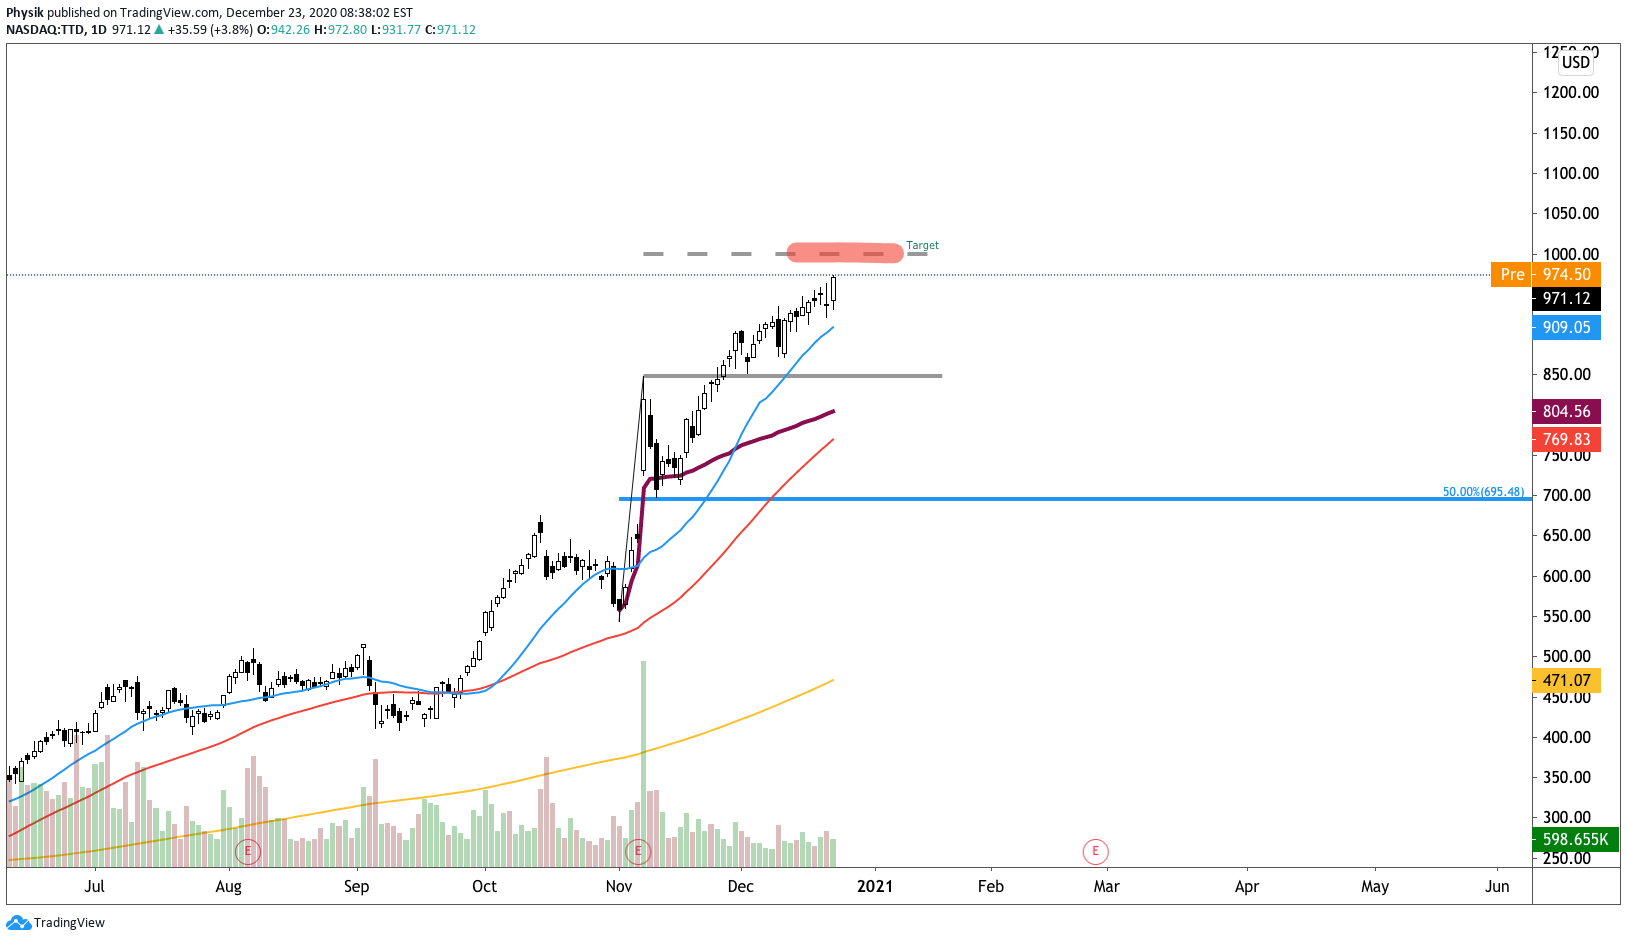
TTD 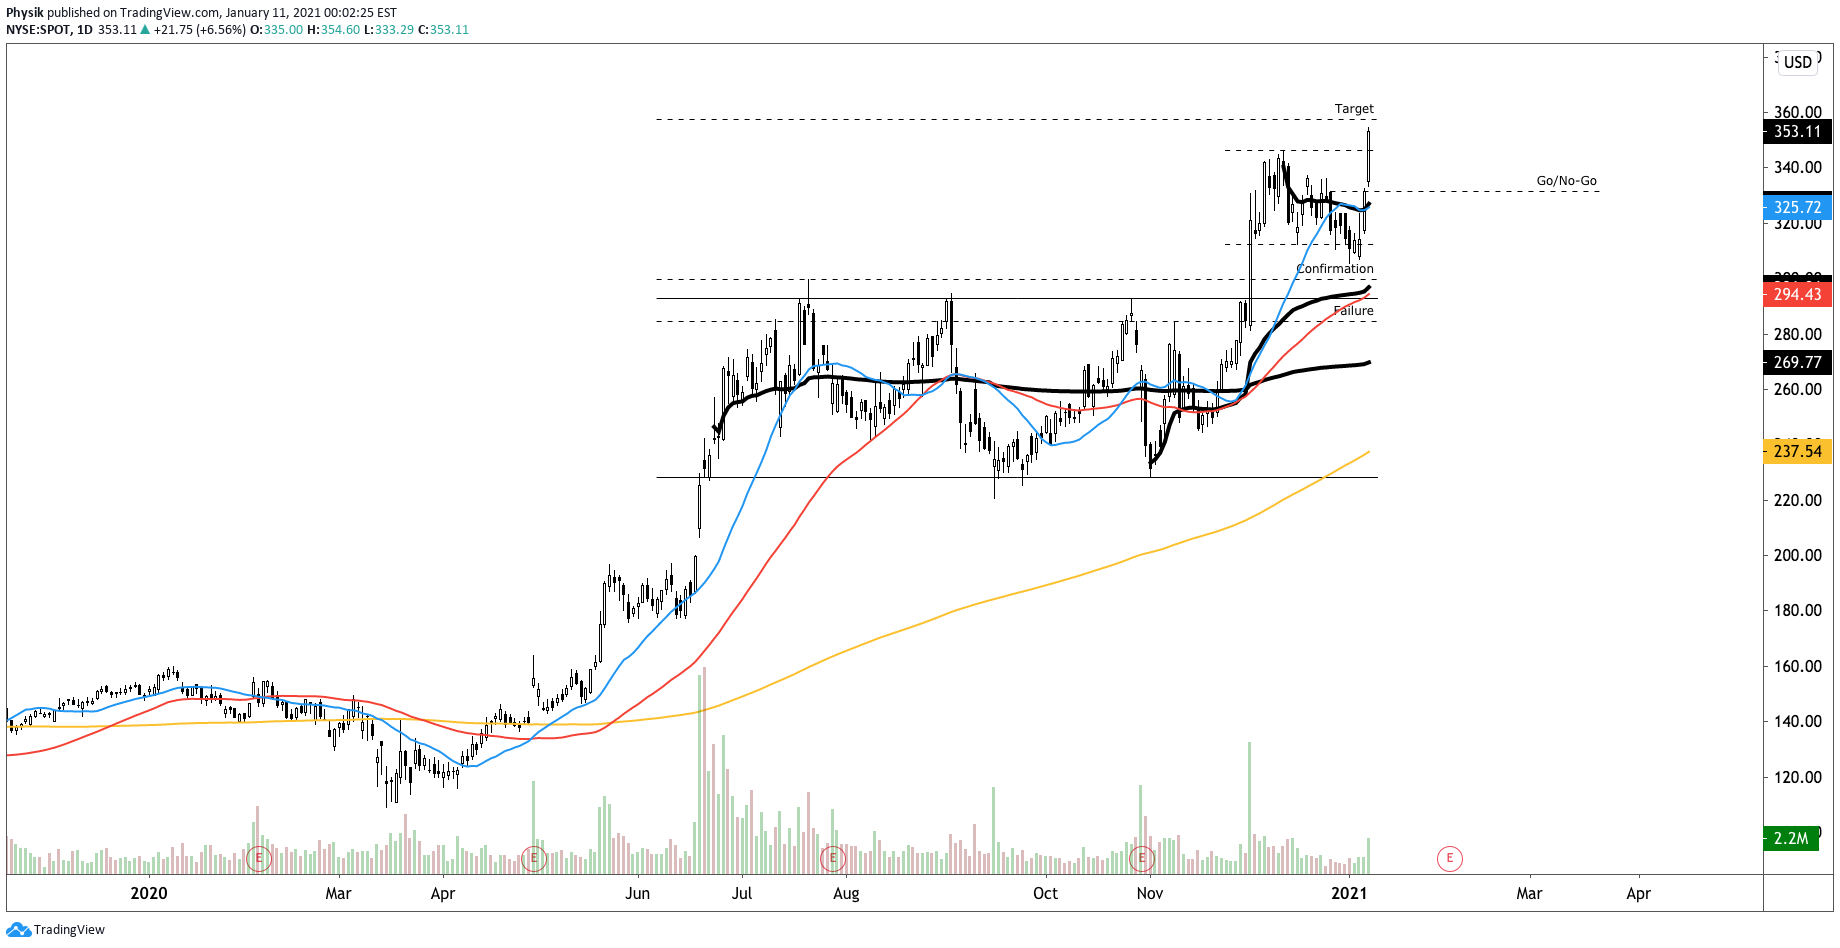
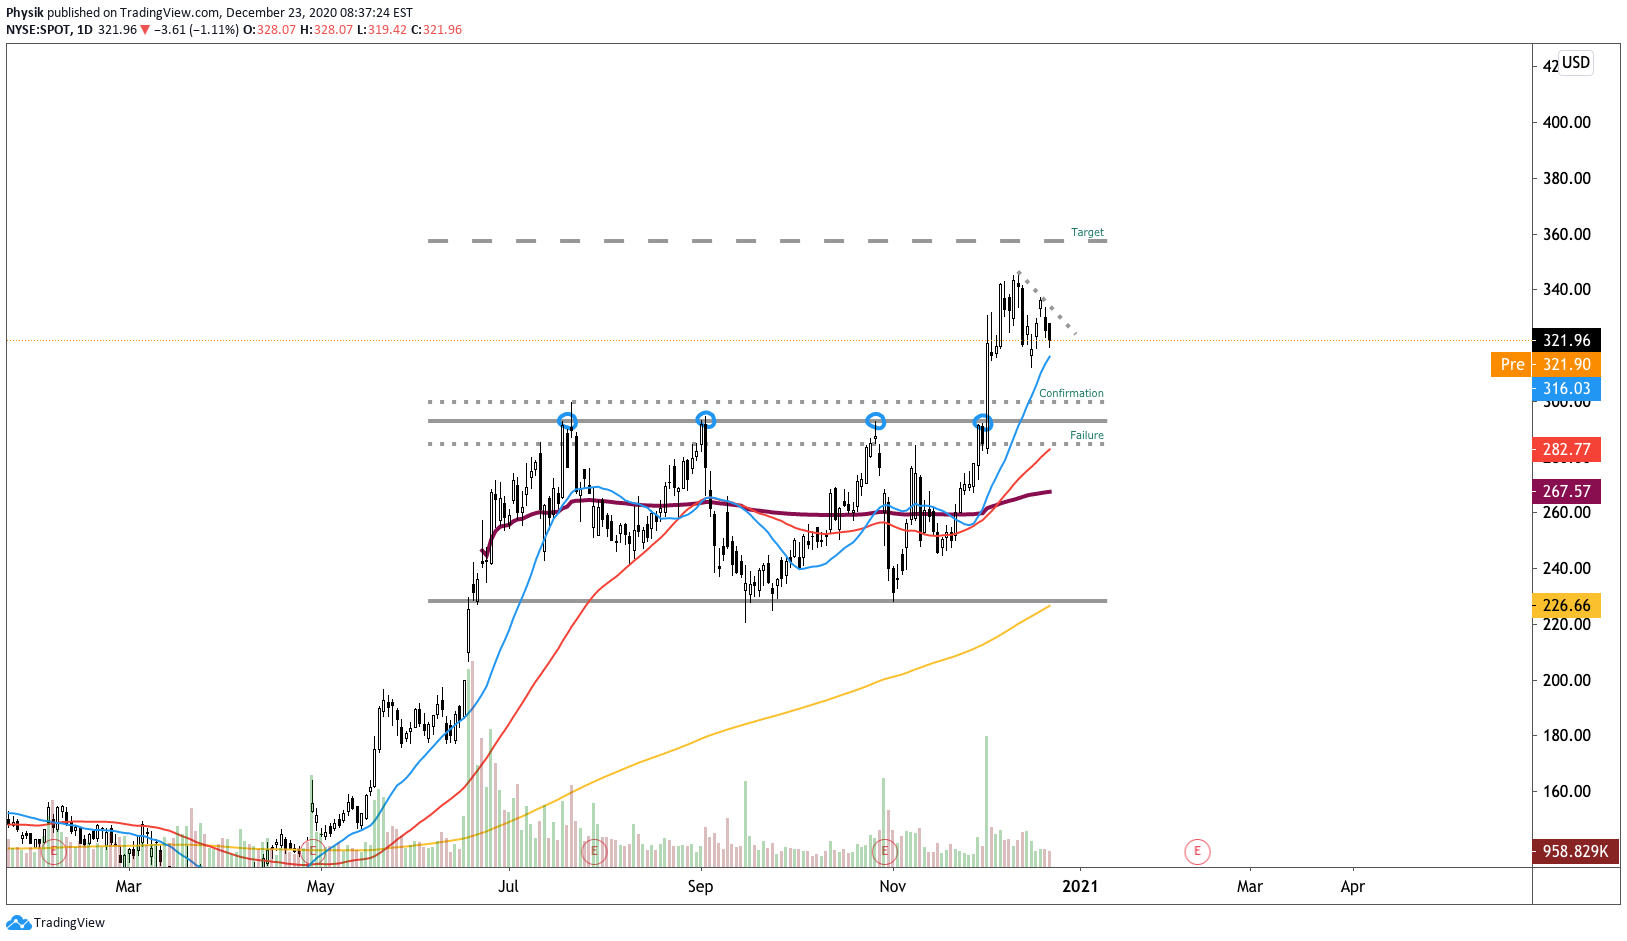
SPOT 
SHOP 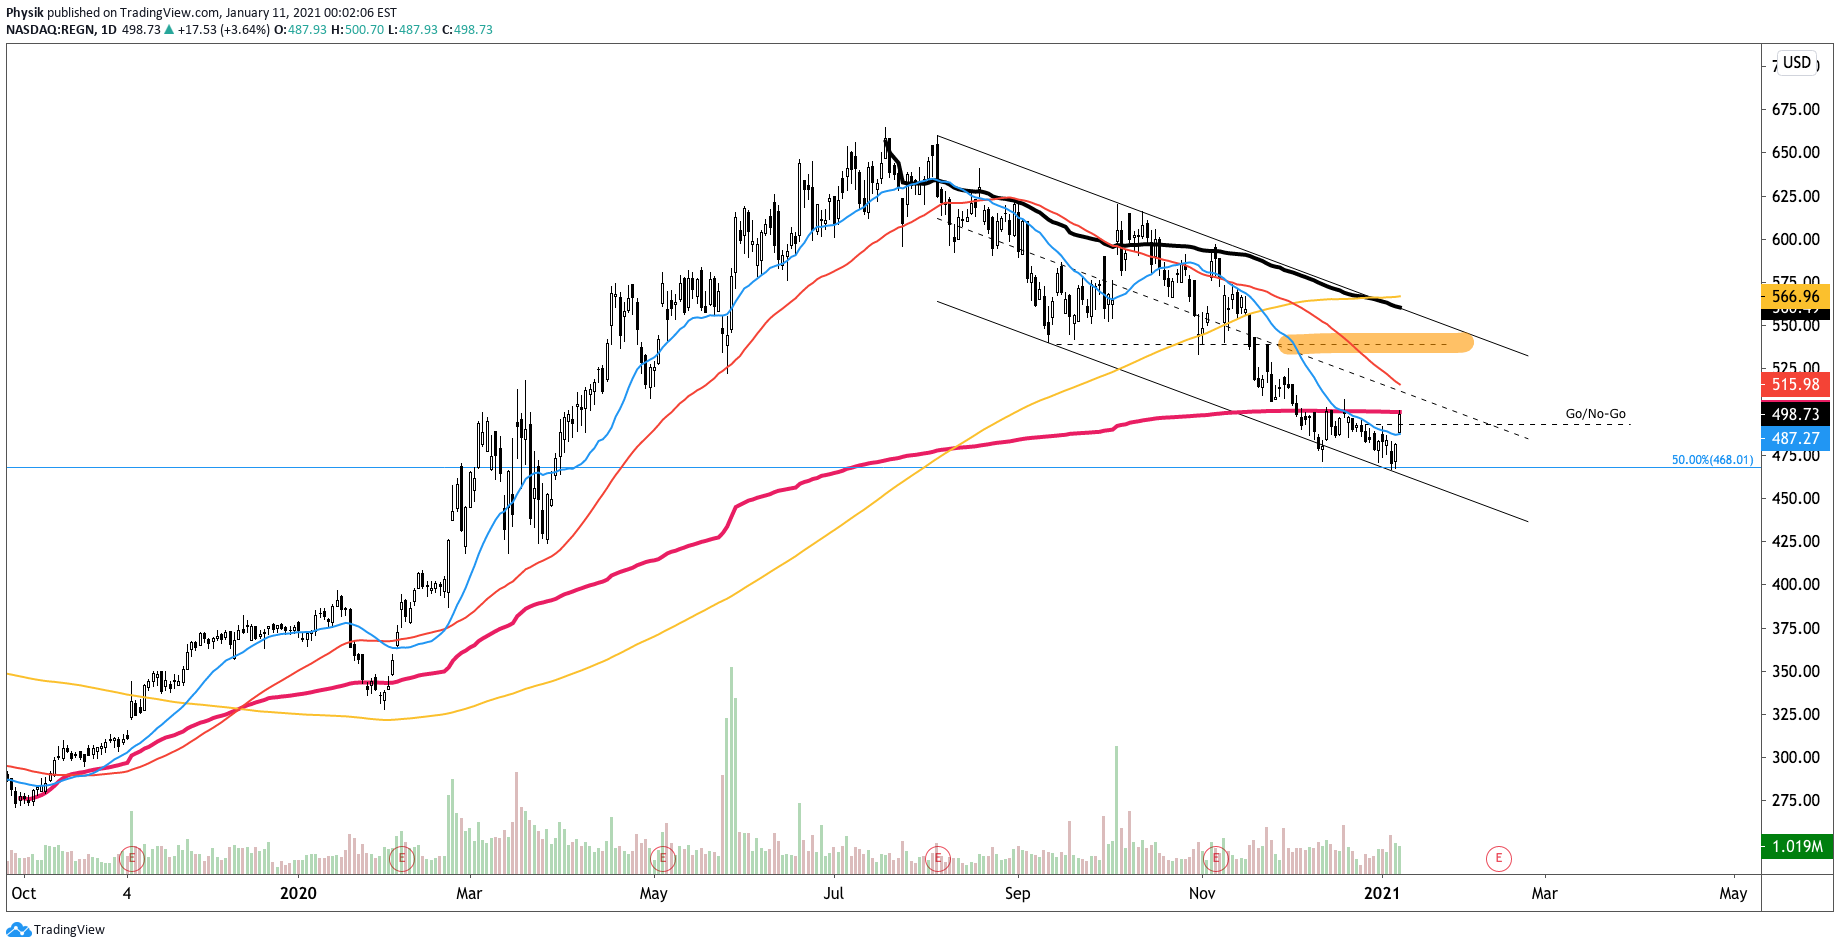
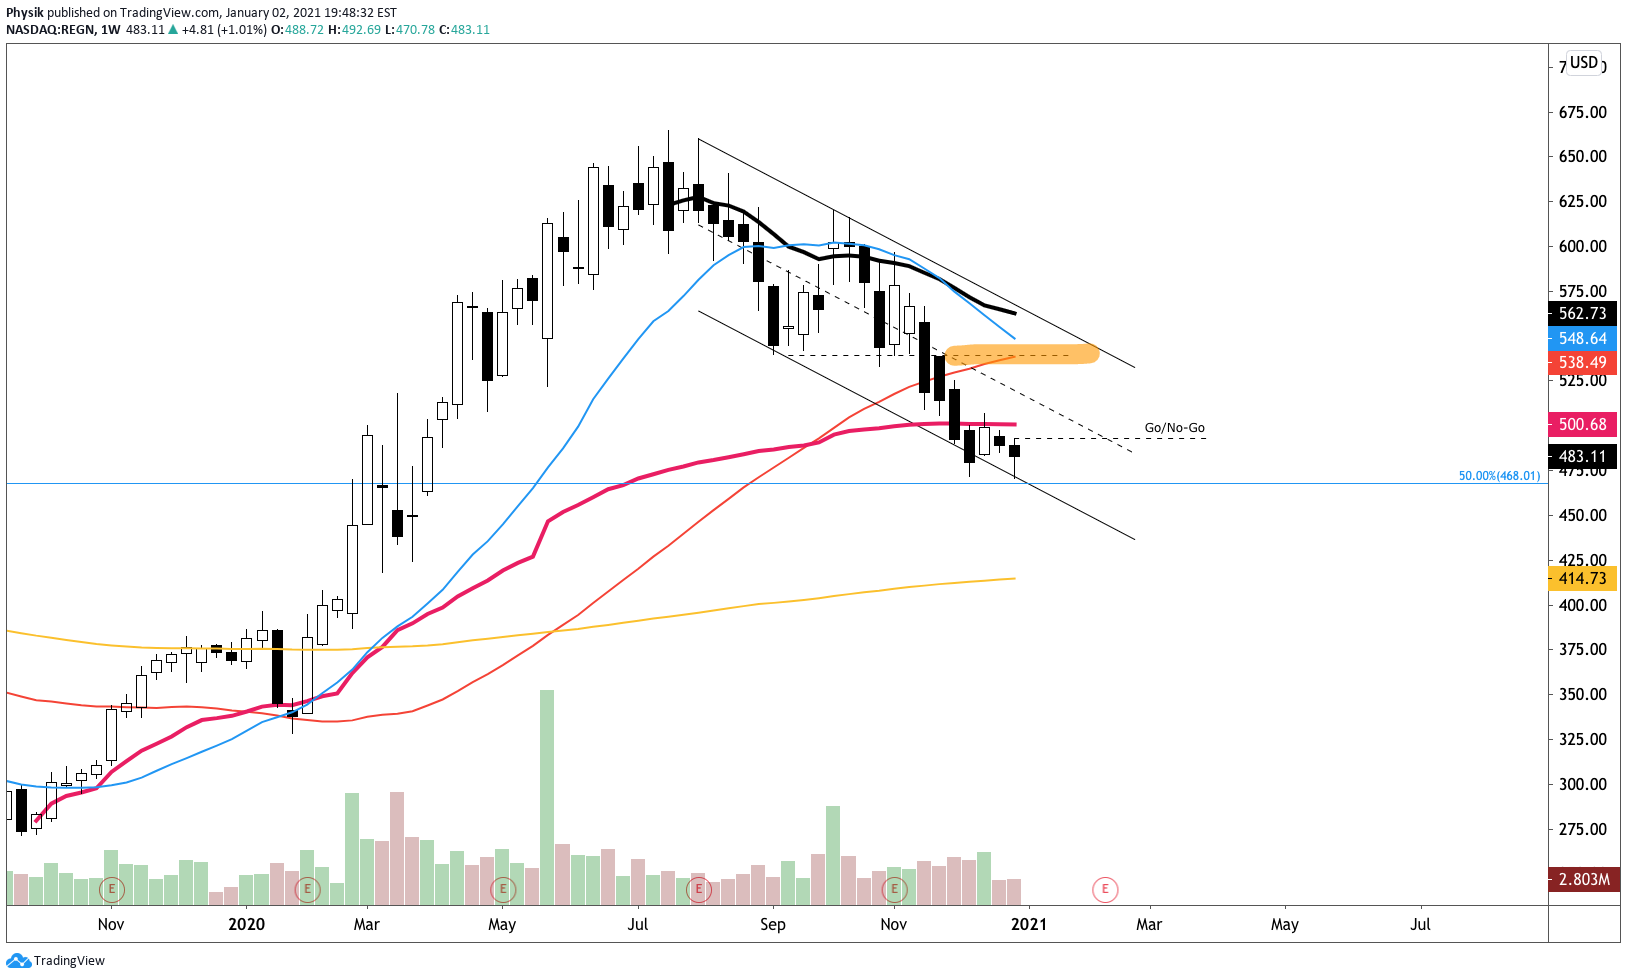
REGN 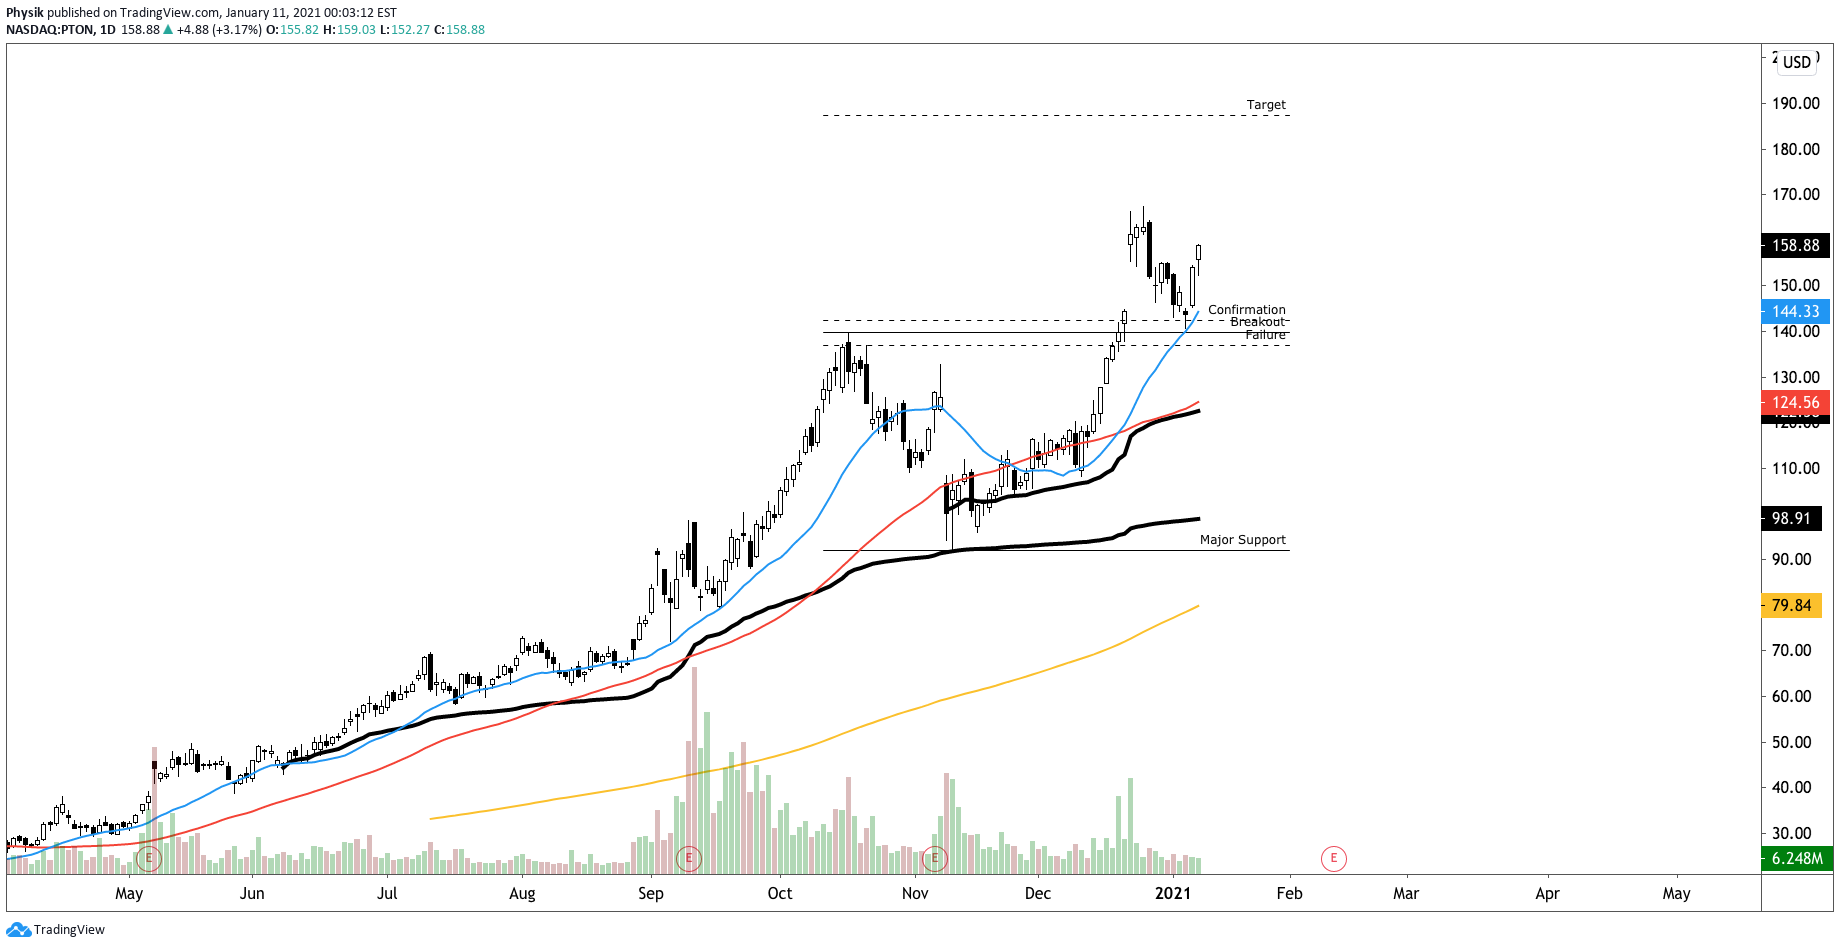
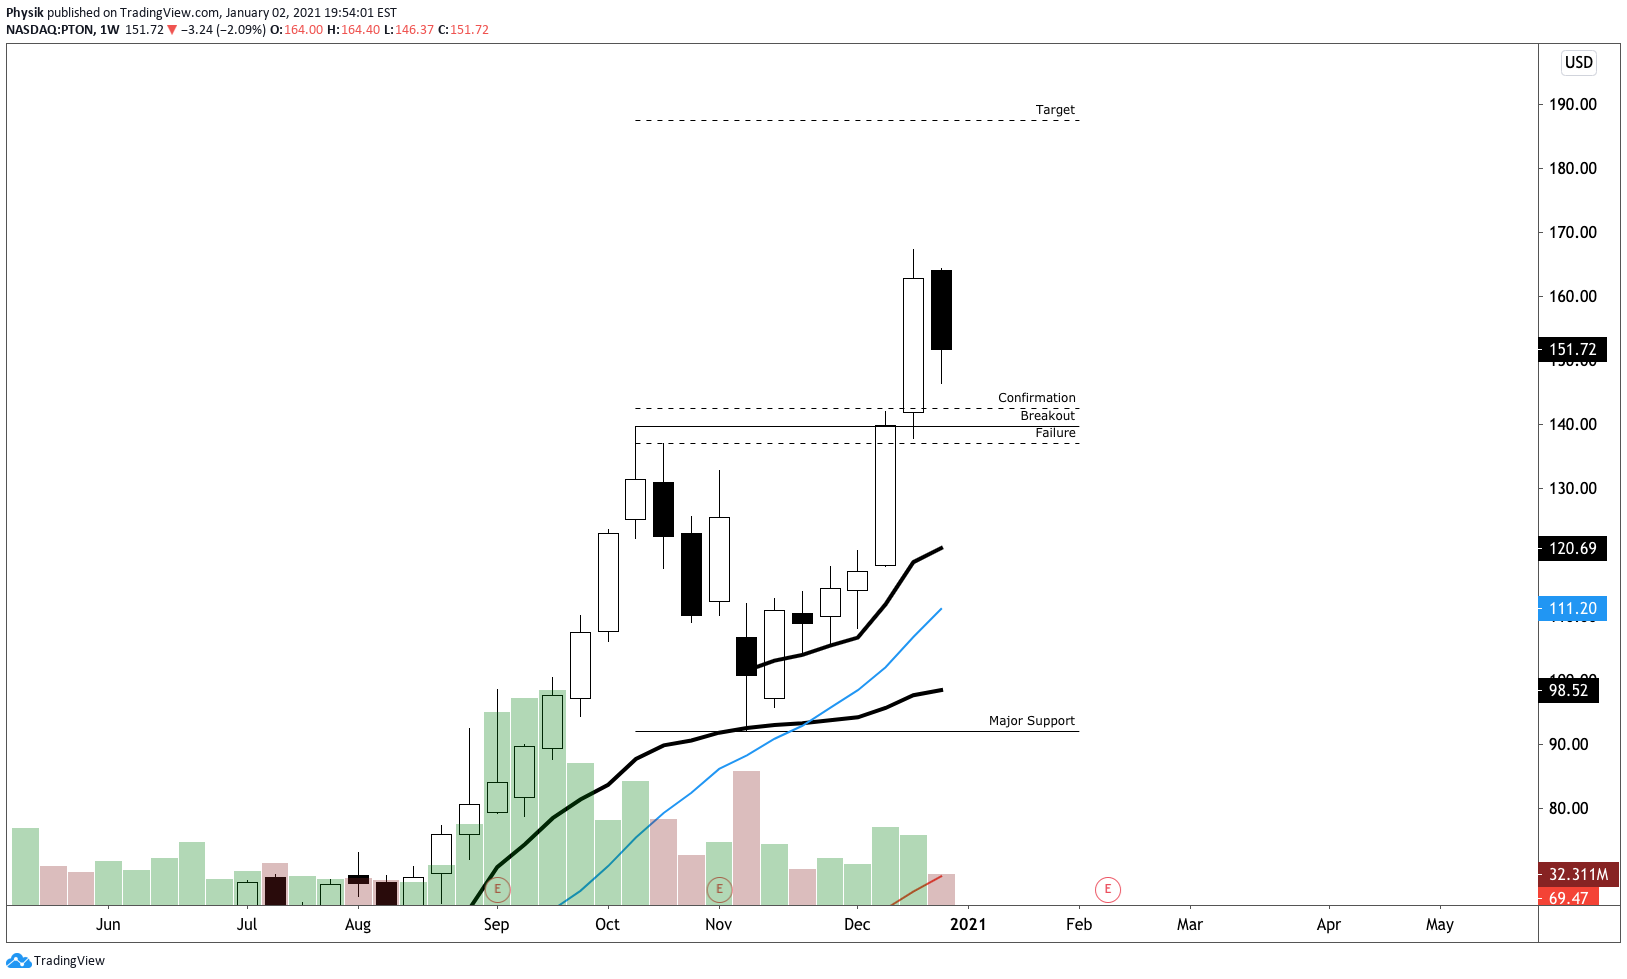
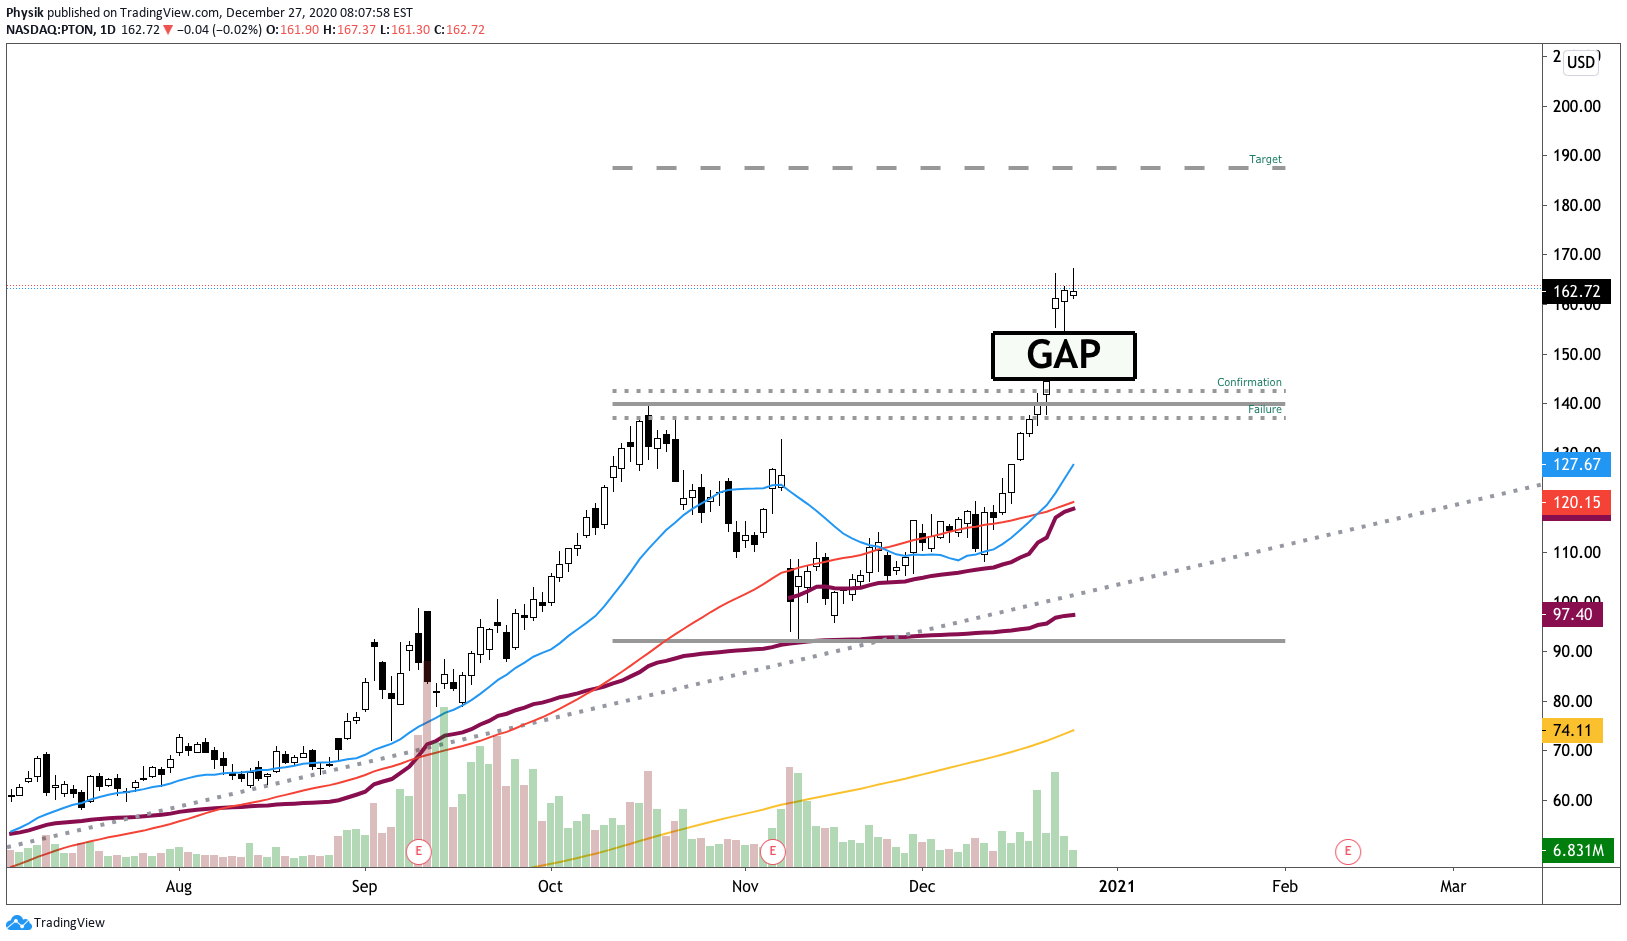
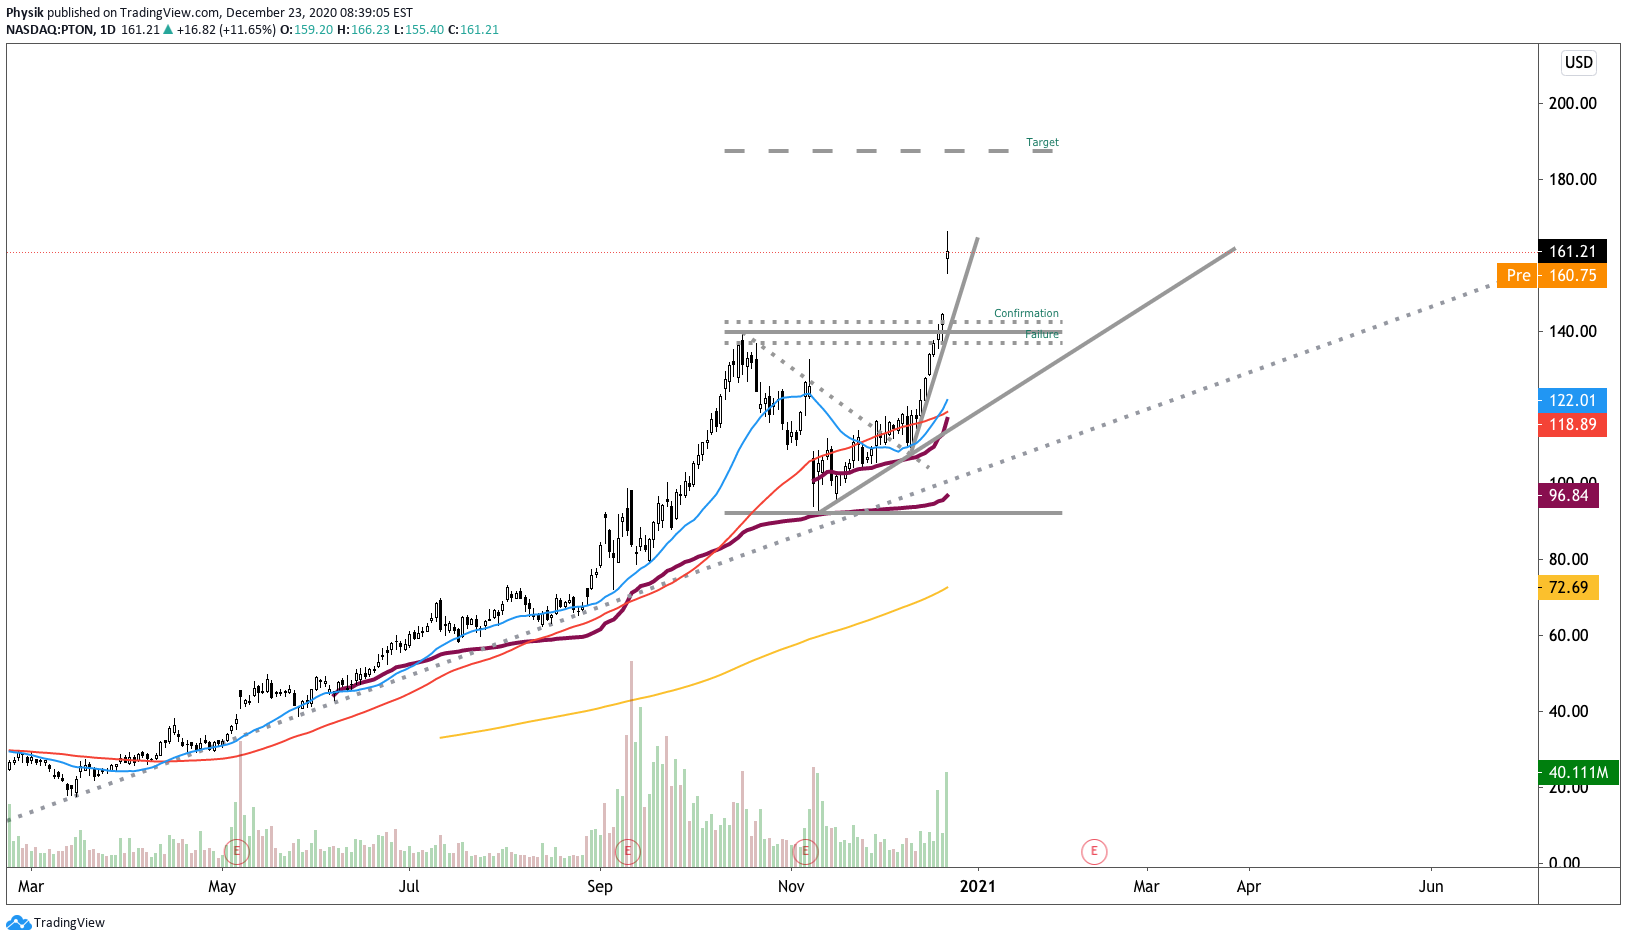
PTON 
PLTR 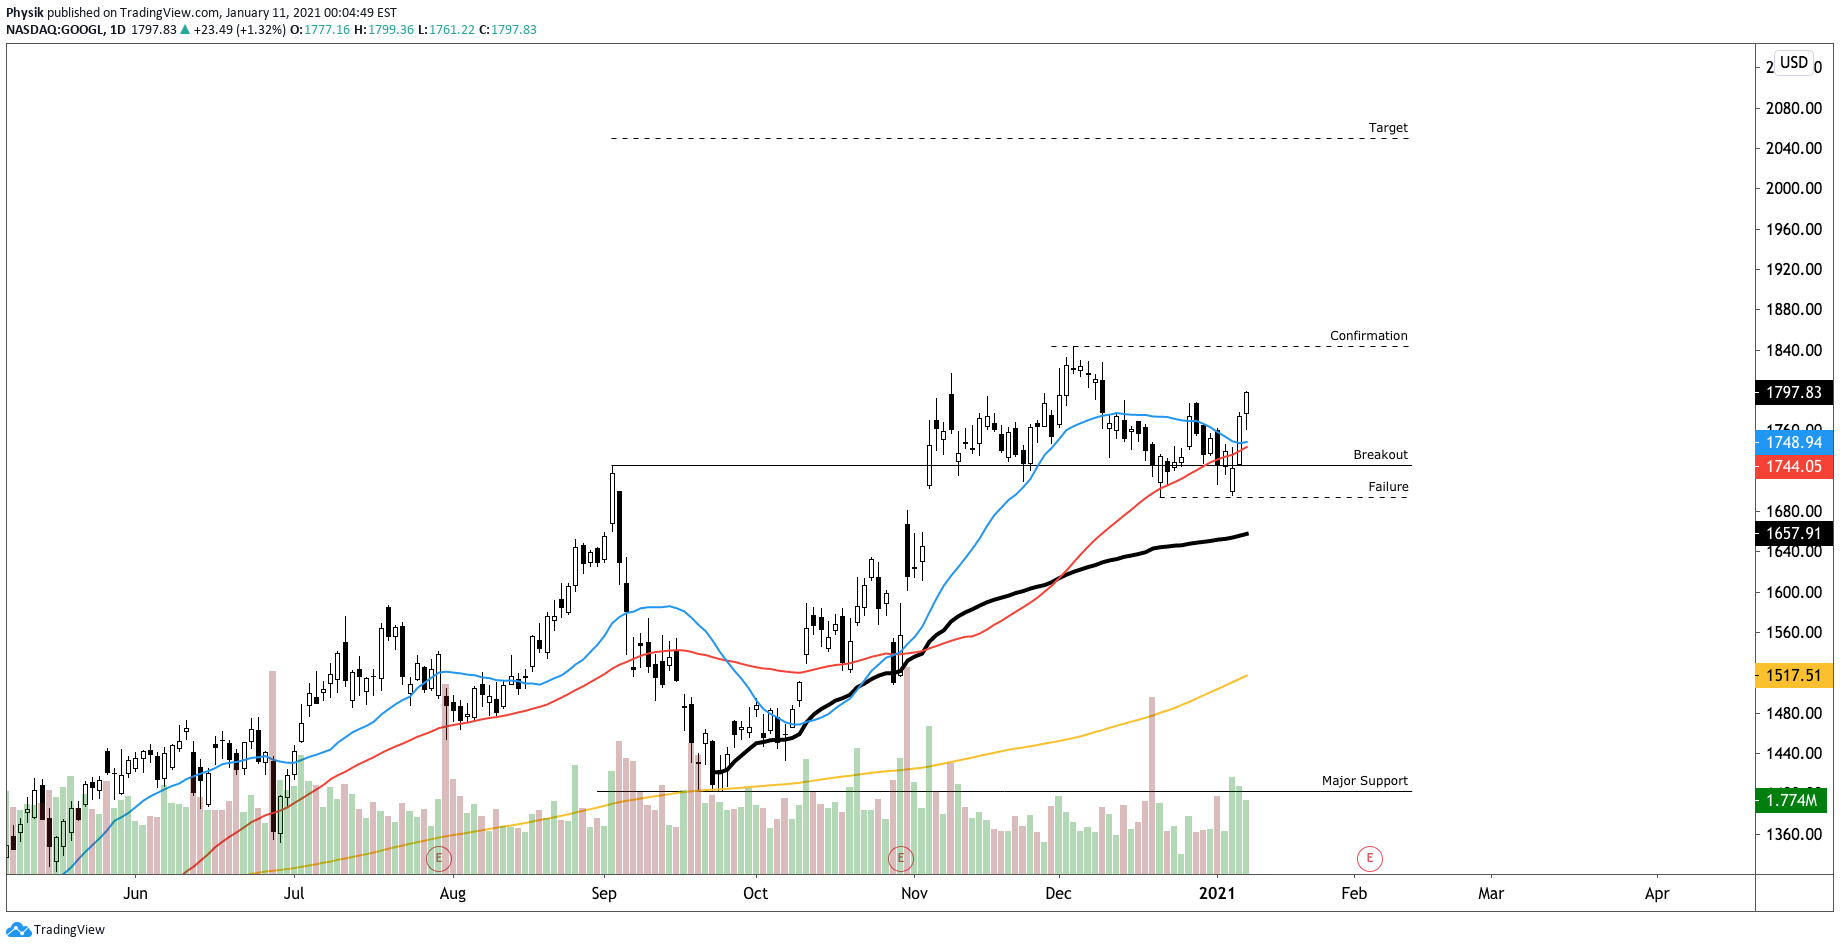
GOOGL 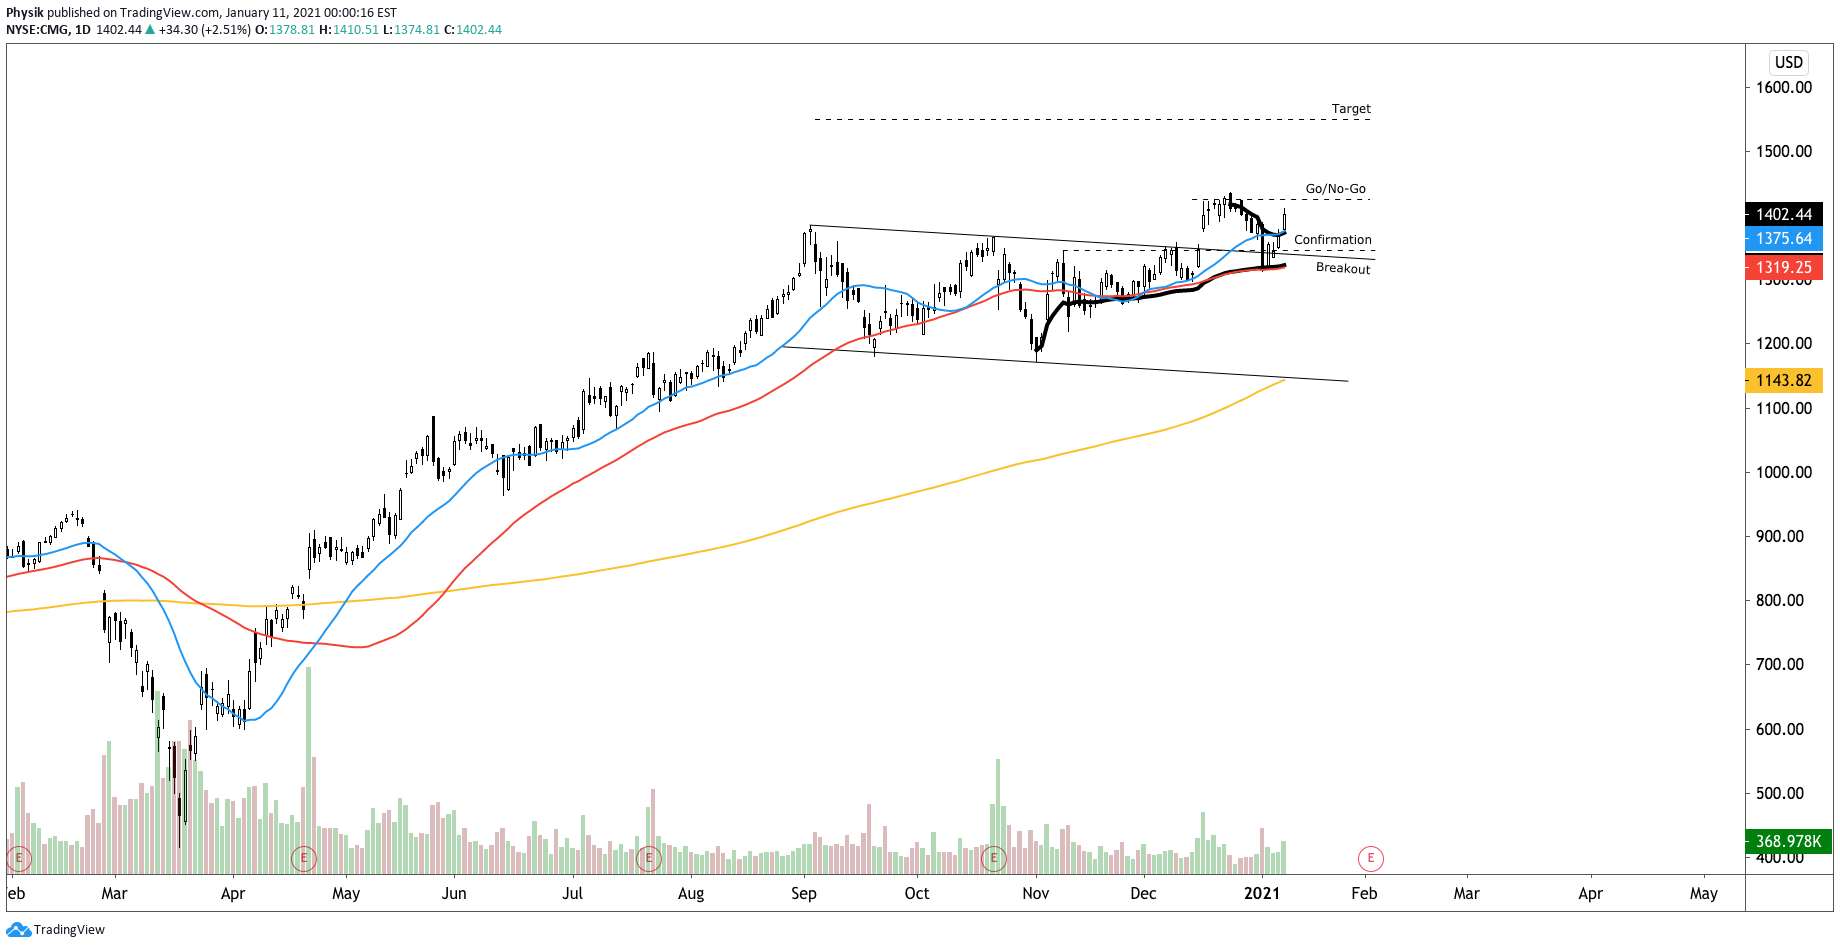
CMG 
BRK.B 
BKNG 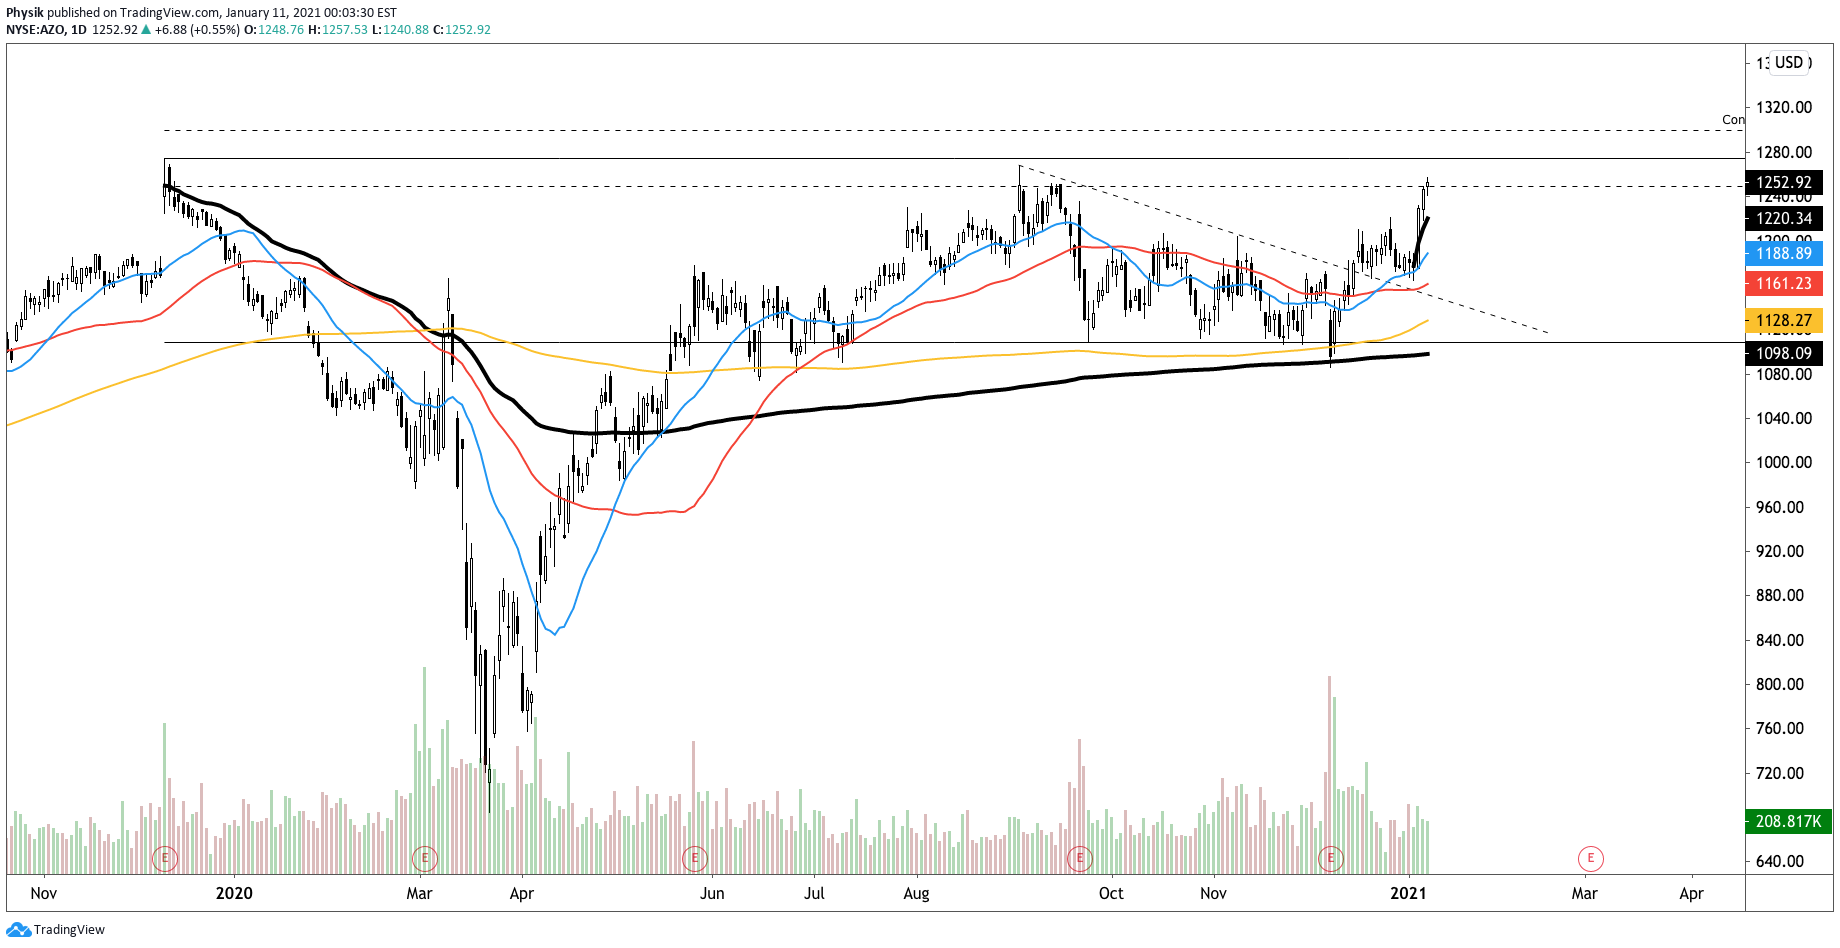
AZO 
AMD
Photo by Valdemaras D. from Pexels.