Categories
Commentary

Daily Brief For September 12, 2022

The daily brief is a free glimpse into the prevailing fundamental and technical drivers of U.S. equity market products. Join the 900+ that read this report daily, below!

Graphic updated 7:30 AM ET. Sentiment Risk-On if expected /ES open is above the prior day’s range. /ES levels are derived from the profile graphic at the bottom of the following section. Levels may have changed since initially quoted; click here for the latest levels. SqueezeMetrics Dark Pool Index (DIX) and Gamma (GEX) calculations are based on where the prior day’s reading falls with respect to the MAX and MIN of all occurrences available. A higher DIX is bullish. At the same time, the lower the GEX, the more (expected) volatility. Learn the implications of volatility, direction, and moneyness. Breadth reflects a reading of the prior day’s NYSE Advance/Decline indicator. VIX reflects a current reading of the CBOE Volatility Index (INDEX: VIX) from 0-100.

Administrative

Hey team, before we get started, let’s address the mismatch some observed last week with this letter’s levels and S&P quotes, versus what they saw at home. 

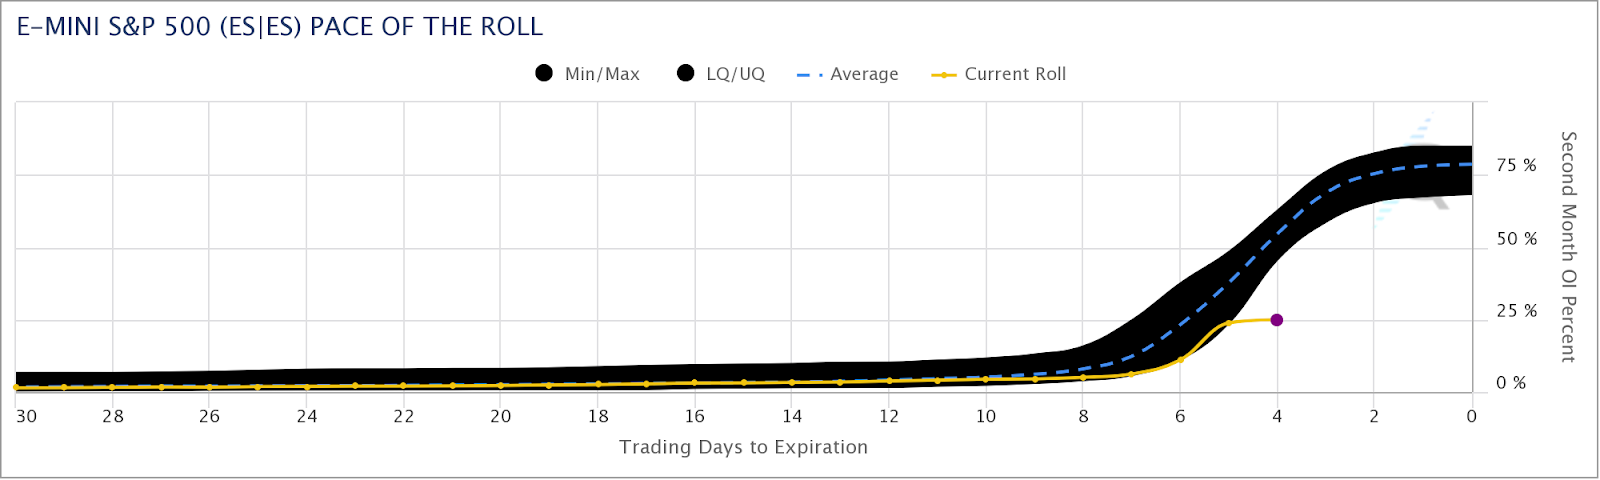
It is basically the case that our charting platform rolled over to the December S&P 500 Index futures contract on September 9, 2022. This was about 1-week ahead of the expiry of the old contract on September 16, 2022.

Going forward, unless otherwise noted, 6-days prior to the expiration of a quoted contract, the levels and prices in this letter may reflect that of the new, father-dated contract.

As an aside, based on CME Group Inc’s (NASDAQ: CME) Equity Quarterly Roll Analyzer Tool, the pace of the E-mini S&P 500 (FUTURE: /ES) roll is far off of what it has historically been at this stage of the roll period. 

This roll, too, caught your letter’s writer by surprise. Sorry!

Graphic: Retrieved from CME Group Inc (NASDAQ: CME).

Moving on, coverage this week may be sporadic due to some uncertain travel commitments. It is seeming very likely that there may not be a letter published on September 13 and 14, 2022.

Fundamental

Let’s get into it.

At its core, there’s a lot of stuff happening on the monetary and fiscal front. Guiding some of this action, on those fronts, are (geo)political happenings, the rising tide of populism, and beyond.

On the political fronts, Ukrainians “broke through weakened Russian lines, seizing the strategic railway hub of Kupiansk and the key staging area of Izyum,” Noah Smith explained in his letter.

Recent happenings illustrate “some important principles about the broader conflict unfolding across our world between liberalism and illiberalism,” as well as what a “successful defense of Ukraine” would do to hurt “the dawn of a new age of imperial expansionism,” something we’ve talked a lot about in past letters, alongside the growing deglobalization pulse.

The go-to on the implications of these conflicts, as well as the “burgeoning monetary order,” dubbed Bretton Woods III, has been Credit Suisse Group AG’s (NYSE: CS) Zoltan Pozsar who thinks the dollar “is entering a new and rockier phase” and what “matters more than access to dollars is access to commodities and actual things.”

From hereon, Pozsar thinks “commodity prices can go much higher, … and a dollar can get devalued in terms of commodities.”

In the face of geopolitical and supply chokepoints (further bolstered by such things as railroad strikes), as well as the fragmentation of “the physical world,” it’s no “longer appropriate to think about the world as a unified whole,” Pozsar explains.

Potentially at hand is a “self-reinforcing ‘dollar doom loop,’” Jon Turek of JST Advisors adds in the earlier quoted article. That’s big since, as we once explained, the dollar is the dominant currency for carry due to the easy monetary policies that removed the risk of a strong dollar. 

“Non-US entities make dollar-based loans and transactions … because it’s considered more trustworthy than native fiat,” Bankless explained. “When there’s a disruption in global cash flows, there’s effectively a short squeeze on the dollar.” 

Therefore, while efforts to stem inflation bolstered by supply chokepoints continue, “the stronger the dollar gets in comparison, the less tenable it becomes as a global reserve.”

That is pressure on the long-term trajectory of the dollar.

Ultimately, through the earlier mentioned developments, “breaking the dollar’s dominance could arguably help some countries avoid a tightening of financial conditions,” Bloomberg explains.

Accordingly, with “the dollar’s peak [] already in the rearview mirror,” concerns are amped in regard to how this impacts U.S. markets. It’s the case that U.S. market liquidity, as well as the dollar’s strong role as a reserve, put the S&P 500 at the center of the global carry regime. 

Thus, an unwinding of carry may compound a market drop affecting nearly all risk assets, even housing, and prompting recession, something we shall unpack further in coming letters.

Graphic: Retrieved from The Market Ear. Via Morgan Stanley (NYSE: MS). “MS Research thinks the lows for this bear market will likely arrive in the fourth quarter with 3,400 the minimum downside and 3,000 the low if a recession arrives.”

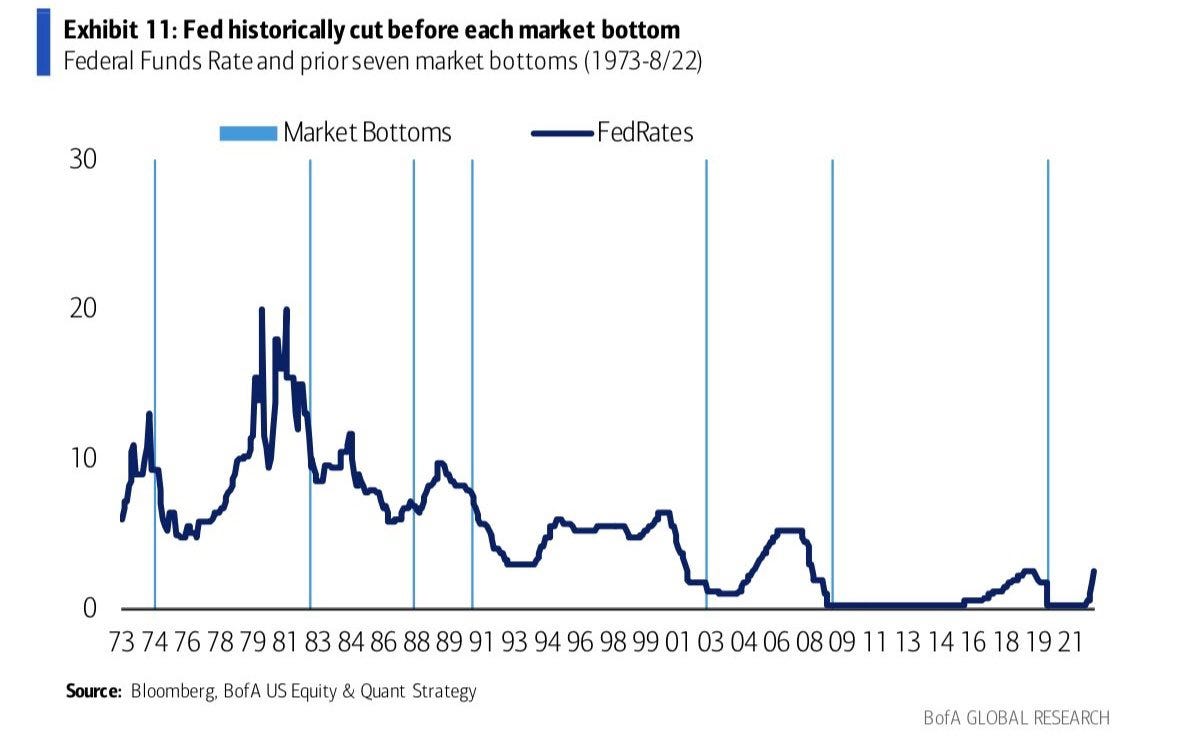
To round out this section, a bull case is likely characterized by less outsized interest rate hikes here, in the US, with quantitative tightening (QT) ramping “to its maximal caps” with no increase in “vol or yields,” said JPMorgan Chase & Co (NYSE: JPM) market intelligence.

Graphic: Retrieved from Bloomberg.

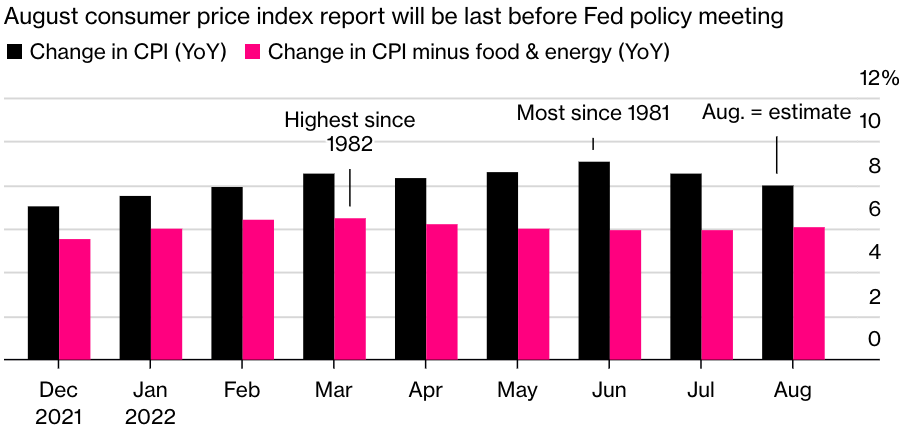
However, if inflation remains hot – 8% and 9% – and supply disruptions remain sticky, the Fed may continue on its path of higher for longer. That means an “outsized rate hike cadence in Nov/Dec, bringing Fed Funds above 4.0% … and QT put[ting] upward pressure on yields.”

Graphic: Retrieved from Callum Thomas. Via Bank of America Corporation (NYSE: BAC). Market bottoms often appear when the Federal Reserve (Fed) begins cutting interest rates.

Positioning

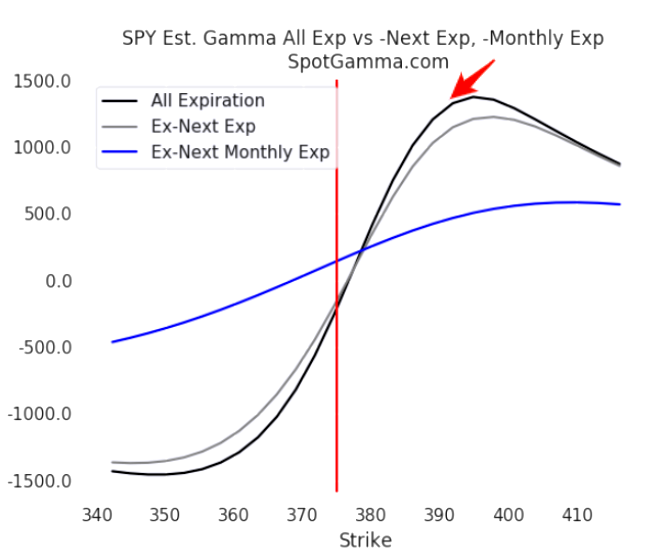
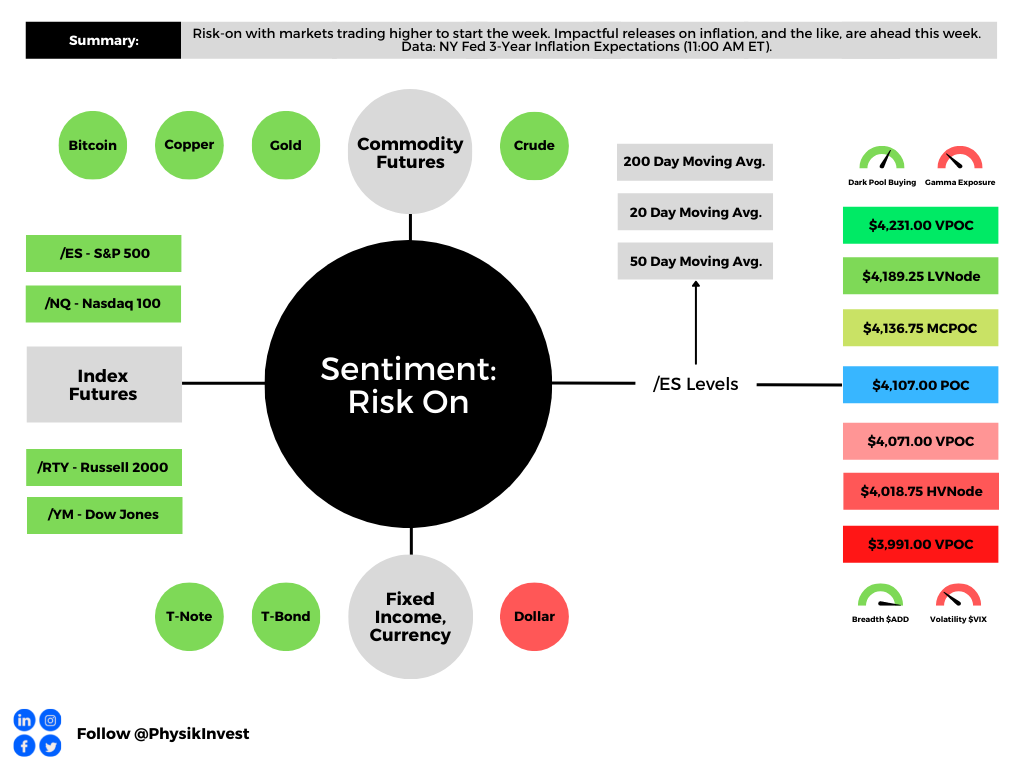
Demand for protection and re-entry into shorts was the context for selling that culminated in an S&P 500 (INDEX: SPX) low at $3,900.00 last week. 

It’s at this level, “where the demand for put options was concentrated,” analysis providers like SpotGamma saw “support” and, “absent an exogenous catalyst,” S&P 500 stability.

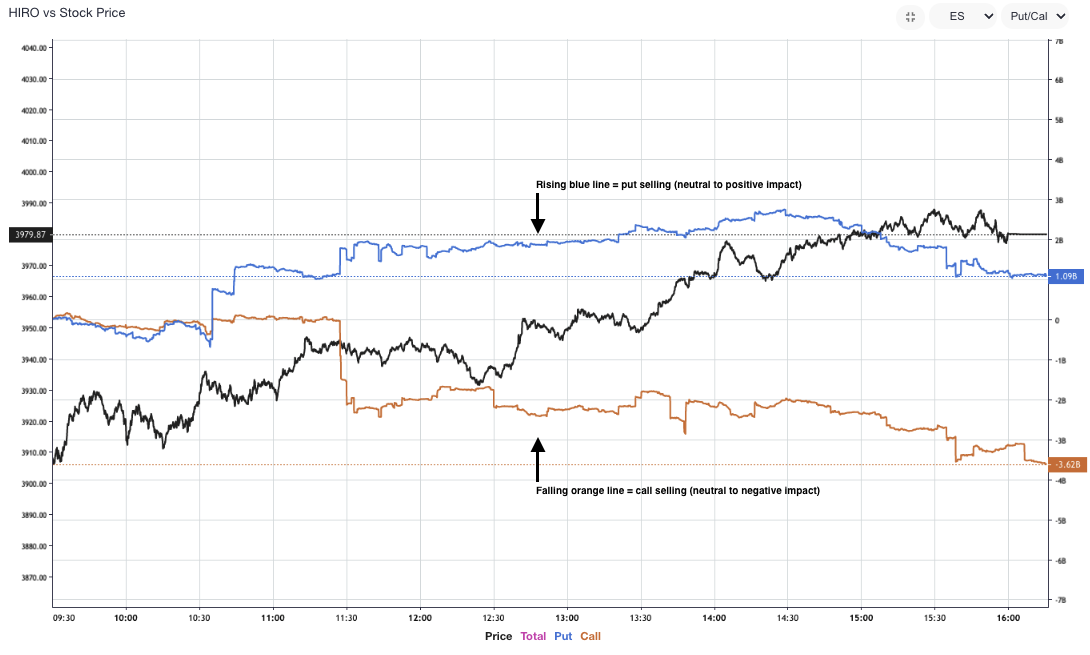
From thereon, into the end of the week, SpotGamma adds that “positive delta hedging flows” bolstered a “market move away from the $3,900.00 support.” Tools like SpotGamma’s HIRO showed volatility selling and this validated a SpotGamma call for “follow-on bullishness.”

Graphic: Retrieved from SpotGamma. Updated September 7, 2022.

Nonetheless, in light of the above fundamental and positioning contexts, after derivatives expiries this month, the stage is likely set for larger two-way ranges.

Technical

As of 7:20 AM ET, Monday’s regular session (9:30 AM – 4:00 PM ET), in the S&P 500, is likely to open in the upper part of a balanced overnight inventory, outside of prior-range and -value, suggesting a potential for immediate directional opportunity.

In the best case, the S&P 500 trades higher.

Any activity above the $4,107.00 POC puts into play the $4,136.75 MCPOC. Initiative trade beyond the MCPOC could reach as high as the $4,189.25 LVNode and $4,231.00 VPOC, or higher.

In the worst case, the S&P 500 trades lower.

Any activity below the $4,107.00 POC puts into play the $4,071.00 VPOC. Initiative trade beyond the VPOC could reach as low as the $4,018.75 HVNode and $3,991.00 VPOC, or lower.

Click here to load today’s key levels into the web-based TradingView charting platform. Note that all levels are derived using the 65-minute timeframe. New links are produced, daily.
Graphic: 65-minute profile chart of the Micro E-mini S&P 500 Futures.

Definitions

Volume Areas: A structurally sound market will build on areas of high volume (HVNodes). Should the market trend for long periods of time, it will lack sound structure, identified as low volume areas (LVNodes). LVNodes denote directional conviction and ought to offer support on any test. 

If participants were to auction and find acceptance into areas of prior low volume (LVNodes), then future discovery ought to be volatile and quick as participants look to HVNodes for favorable entry or exit.

POCs: POCs are valuable as they denote areas where two-sided trade was most prevalent in a prior day session. Participants will respond to future tests of value as they offer favorable entry and exit.

MCPOCs: POCs are valuable as they denote areas where two-sided trade was most prevalent over numerous day sessions. Participants will respond to future tests of value as they offer favorable entry and exit.

About

After years of self-education, strategy development, mentorship, and trial-and-error, Renato Leonard Capelj began trading full-time and founded Physik Invest to detail his methods, research, and performance in the markets.

Capelj also develops insights around impactful options market dynamics at SpotGamma and is a Benzinga reporter.

Some of his works include conversations with ARK Invest’s Catherine Wood, investors Kevin O’Leary and John Chambers, FTX’s Sam Bankman-Fried, ex-Bridgewater Associate Andy Constan, Kai Volatility’s Cem Karsan, The Ambrus Group’s Kris Sidial, among many others.

Disclaimer

In no way should the materials herein be construed as advice. Derivatives carry a substantial risk of loss. All content is for informational purposes only.

Categories
Commentary

Daily Brief For April 23, 2021

Market Commentary

Index futures base. Position for directional resolve.

  • Tax hike news causes a liquidation.
  • Home sales. Biden climate summit.
  • Indices are correcting through time.

What Happened: U.S. stock index futures auctioned sideways, overnight, after liquidating alongside reports that President Biden wants to nearly double the capital gains tax paid by top earners.

Liquidation Breaks: The profile shape suggests participants were “too” long and had poor location. The news event helped resolve this dynamic.
Updated: 8:45 AM EST

What To Expect: Friday’s regular session in the S&P 500 (9:30 AM – 4:00 PM EST) will likely open inside of prior-range and -value, suggesting a limited potential for immediate directional opportunity. 

Adding, during the prior day’s regular trade, the worst-case outcome failed to occur. 

In the interest of objectivity, despite the $4,117.75 regular trade low (RTH Low) being taken out, responsive buyers stepped in aggressively, causing the S&P 500 to halt short of the $4,110.50 poor, minimal excess low. This action is noteworthy — had the poor low been taken out, conditions would have been markedly different. Instead, given technical nuances, it is obvious the market is correcting in time (i.e., balancing), rather than price.

Responsive Buying: Buying in response to prices below area of recent price acceptance.

Excess: A proper end to price discovery; the market travels too far while advertising prices. Responsive, other-timeframe (OTF) participants aggressively enter the market, leaving tails or gaps which denote unfair prices.

Balance (Two-Timeframe Or Bracket): Rotational trade that denotes current prices offer favorable entry and exit. Balance-areas make it easy to spot change in the market (i.e., the transition from two-time frame trade, or balance, to one-time frame trade, or trend).

Simply put, markets are basing, pricing in new information, ahead of any directional resolve.

Important to add into the narrative, too, are historical responses to capital gains tax increases.

Bloomberg’s John Authers notes: “The way the market handled the last major CGT increase, at the end of 2012, is instructive. As it grew clear that higher capital gains taxes were coming, the S&P 500 languished and went sideways for the last few months of the year, closing roughly where it had been in March. Then 2013 turned out to be a great year; stocks started their rally at the beginning of January and never really stopped.”

Graphic: Bloomberg unpacks implications of a capital gains tax hike. 

“Stocks do indeed tend to fall in the run-up to the change, but more than make up for it thereafter. Earnings multiples increased slightly before those rises, but did better in the six months afterwards. And households sold a little before the hikes, but more than made up for it.”

The highest returning, momentum stocks, however, stand to lose the most. Given that “[m]omentum stocks have had something of a correction in recent months, … it is unlikely that the tax change will have a major effect on them.”

For today, moreover, participants can trade from the following frameworks. 

In the best case, the S&P 500 trades sideways or higher; activity above the $4,137.25 high-volume area (HVNode) targets the $4,162.50 VPOC. Initiative trade beyond the VPOC could reach as high as the $4,183.50 regular trade high (RTH High). In the worst case, the S&P 500 trades lower; activity below $4,115.25 targets the $4,110.50 poor, minimal excess low. 

Volume Areas: A structurally sound market will build on past areas of high-volume. Should the market trend for long periods of time, it will lack sound structure (identified as a low-volume area which denotes directional conviction and ought to offer support on any test). 

If participants were to auction and find acceptance into areas of prior low-volume, then future discovery ought to be volatile and quick as participants look to areas of high-volume for favorable entry or exit.

Initiative Buying: Buying within or above the previous day’s value area.

POCs: POCs (like HVNodes described above) are valuable as they denote areas where two-sided trade was most prevalent. Participants will respond to future tests of value as they offer favorable entry and exit.

Thereafter, if lower, participants can look for responses at (1) the $4,093.00 VPOC, (2) $4,082.75 HVNode, and (3) the $4,069.25 HVNode.

Graphic: 4-hour profile chart of the Micro E-mini S&P 500 Futures.
Graphic: Physik Invest maps out the purchase of call and put options in the SPDR S&P 500 ETF Trust (NYSE: SPY), for April 22. Activity in the options market was primarily concentrated in short-dated tenors, in strikes as low as $400.00, which corresponds with $4,000.00 in the cash-settled S&P 500 Index (INDEX: SPX).
Graphic: Increase in put-side interest on the cash-settled S&P 500 Index (INDEX: SPX). Such activity suggests participants are interested in hedging their downside. Visual via SHIFT.
Graphic: Price and volume delta, or buying and selling power as calculated by the difference in volume traded at the bid and offer, diverge into the close in the SPDR S&P 500 ETF Trust (NYSE: SPY).

News And Analysis

Economy | Senate Republicans rolled out a $568B infrastructure proposal. (Axios)

Economy | The Fed’s monthly bond purchases endure as goals fall short. (S&P)

Wellness | Studies show the coronavirus can kill months after infection. (BBG)

Economy | EU economy ‘on crutches,’ warns ECB chief Christine Lagarde. (DW)

Markets | High-yield corporate bond issuance, prospects for a recovery. (Moody’s)

Politics | Russia is planning to end a massive troop buildup near Ukraine. (Axios)

Economy | $12.3T in stimulus killed off the U.S. credit default cycle. (BBG)

Banking | Two blowups have Credit Suisse paying the price for riskiness. (BBG)

Economy | March mortgage delinquency drop exaggerated by events. (MND)

Markets | Mortgage rates improve on 7-week lows, bond market stable. (MND)

Markets | GS: Congress is likely to cap Biden’s CGT hike at around 28%. (MI)

Markets | Scale of T-Bill drought hinges on Biden rescue, income-tax haul. (BBG)

What People Are Saying

Innovation And Emerging Trends

Transportation | Newer planes providing airlines trove of useful data. (NYT)

FinTech | Public.com app connects users with public company leaders. (BZ)

FinTech | From breakthroughs to copycats, here’s what to consider. (Fortune)

FinTech | Signal Advisors adds Series A for financial advising tech. (BZ)

Education | MasterClass co-founder secures funding for new ed-tech. (BZ)

About

Renato founded Physik Invest after going through years of self-education, strategy development, and trial-and-error. His work reporting in the finance and technology space, interviewing leaders such as John Chambers, founder, and CEO, JC2 Ventures, Kevin O’Leary, Canadian businessman and Shark Tank host, Catherine Wood, CEO and CIO, ARK Invest, among others, afforded him the perspective and know-how very few come by.

Having worked in engineering and majored in economics, Renato is very detailed and analytical. His approach to the markets isn’t built on hope or guessing. Instead, he leverages the unique dynamics of time and volatility to efficiently act on opportunity.

 Disclaimer

At this time, Physik Invest does not manage outside capital and is not licensed. In no way should the materials herein be construed as advice. Derivatives carry a substantial risk of loss. All content is for informational purposes only.

Categories
Commentary

Market Commentary For 2/12/2021

Notice: To view this week’s big picture outlook, click here.

What Happened: As the new administration pushes approval of a $1.9 trillion coronavirus relief plan, alongside the approval of another $14 billion for pandemic-hit airlines and signs of improve in the labor market, U.S. stock index futures traded sideways, in prior-balance and -range.

What Does It Mean: Market’s were range-bound after a rapid de-risking event associated with the GameStop Corporation (NYSE: GME) crisis, and subsequent v-pattern recovery.

Pictured: 4-hour profile chart of the Micro E-mini S&P 500 Futures

The tight trading range is most attributable to the large February monthly options expiration (OPEX), after which, the interest at the $3,900.00 S&P 500 option strike will roll-off. Why’s this? Most funds are committed to holding long positions. In the interest of lower volatility returns, these funds will collar off their positions, selling calls to finance the purchase of downside put protection.

As a result of this activity, option dealers are long upside and short downside protection.

The exposure must be hedged: dealers sell into strength as their call (put) positions gain (lose) value and buy into weakness as their call (put) positions lose (gain) value.

Now, unlike theory suggests, dealers will hedge call losses (gains) quicker (slower). This leads to “long-gamma,” a dynamic that crushes volatility and promotes momentum, observed by lengthy sprints, followed by rapid de-risking events as the market transitions into “short-gamma.”

If the interest near $3,900.00 S&P 500 is not rolled up in price and out in time, then option hedging requirements will change.

The absence of strong fundamentally-driven buying (as we’ve seen with such things as DIX), can have serious implications on price action.

More On DIX: For every buyer is a seller (usually a market maker). Using DIX — which is derived from short sales (i.e., liquidity provision on the market making side) — we can measure buying pressure.
Pictured: DIX by Squeeze Metrics

However, it is important to note that, in recent days, some exposure has been rolled up in price and out in time.

One such example can be seen below.

Pictured: Purchase of call positions higher in price and farther out in time in the cash-settled S&P 500 Index

What To Expect: Friday’s regular session (9:30 AM – 4:00 PM ET) will likely open inside of prior-balance and -range, suggesting limited potential for immediate directional opportunity.

Given dynamics discussed in the prior section, the odds of substantial change are low, so long as broad market indices, like the S&P 500, remain in balance (i.e., range-bound).

Also, trading in a prominent area of high-volume ($3,900.00) will likely make for a volatile session as such areas denote the market’s most recent perception of value and offer favorable entry and exit, hence the two-sided trade.

More On Volume Areas: A structurally sound market will build on past areas of high-volume. Should the market trend for long periods of time, it will lack sound structure (identified as a low-volume area which denotes directional conviction and ought to offer support on any test). 

If participants were to auction and find acceptance into areas of prior low-volume, then future discovery ought to be volatile and quick as participants look to areas of high-volume for favorable entry or exit.

Going forward, participants will look to the overnight rally-high at $3,928.25, and low-volume structure beneath the $3,880.00 HVNode, which offered responsive buyers favorable entry during Wednesday’s intraday liquidation break.

More On Overnight Rally Highs: Typically, there is a low historical probability associated with overnight rally-highs ending the upside discovery process.

More On Liquidation Breaks: The profile shape in the S&P 500 suggests participants were “too” long and had poor location.

That said, the following frameworks apply.

In the best case, the S&P 500 remains rotational, at or above the $3,900.00 HVNode. In the worst case, any break that finds increased involvement (i.e., supportive flows and delta) below the $3,880.00 HVNode, would favor continuation as low as the $3,830.75 HVNode.

As stated yesterday, major change will be identified with trade above the $3,928.25 overnight rally-high, and below the $3,878.50 regular-trade low.

Levels Of Interest: $3,928.25 overnight rally-high, $3,900.00 HVNode, $3,878.50 regular-trade low.

Categories
Commentary

Market Commentary For 2/11/2021

Notice: To view this week’s big picture outlook, click here.

What Happened: After a volatile Wednesday, U.S. stock index futures rose alongside fiscal stimulus and vaccine optimism, ahead of releases that would shine light on the labor market recovery.

What Does It Mean: After a gap open, participants sold stock indexes into prior value, yesterday.

This comes ahead of the large February monthly options expiration (OPEX), after which, the interest at the $3,900.00 S&P 500 option strike will roll-off. As a result, stickiness near the $3,900.00 high-volume area (HVNode) will likely cease in the absence of option hedging requirements.

More On Volume Areas: A structurally sound market will build on past areas of high-volume. Should the market trend for long periods of time, it will lack sound structure (identified as a low-volume area which denotes directional conviction and ought to offer support on any test).

If participants were to auction and find acceptance into areas of prior low-volume, then future discovery ought to be volatile and quick as participants look to areas of high-volume for favorable entry or exit. 
Pictured: Micro E-mini S&P 500 Future.

Further, we have numerous pieces of context to unpack prior to getting into today’s outlook on trade.

First, the v-pattern recovery after the recent de-risking event suggests room for higher. Second, the market is stuck in a long-gamma environment that favors less volatility (as witnessed during Wednesday’s muted intra-day sell-off and recovery). Third, the S&P 500 is trading just shy of $3,940.00, a primary upside target based on a multi-month balance-area projection.

More On The V-Pattern: A pattern that forms after a market establishes a high, retests some support, and then breaks above said high. In most cases, this pattern portends continuation. 

More On Gamma: Gamma is the sensitivity of an option to changes in underlying price. Dealers that take the other side of option trades hedge their exposure to risk by buying and selling the underlying. 

When dealers are short-gamma, they hedge by buying into strength and selling into weakness. When dealers are long-gamma, they hedge by selling into strength and buying into weakness. The former exacerbates volatility. The latter calms volatility.
Graphic 1: SpotGamma data suggests S&P 500 at or above “Long-Gamma” juncture.

What To Expect: Thursday’s regular session (9:30 AM – 4:00 PM ET) will likely open inside of prior-range, suggesting limited potential for immediate directional opportunity.

Adding, given dynamics discussed in the prior section, the odds of substantial change are low, so long as broad market indices, like the S&P 500, remain range bound. Also, trading in a prominent area of high-volume ($3,900.00) will likely make for a volatile session as such areas denote the market’s most recent perception of value and offer favorable entry and exit, hence the two-sided trade.

Going forward, participants will look to the overnight rally-high at $3,928.25, and low-volume structure beneath the $3,880.00 HVNode, which offered responsive buyers favorable entry during Wednesday’s intraday liquidation break.

More On Overnight Rally Highs: Typically, there is a low historical probability associated with overnight rally-highs ending the upside discovery process.

More On Liquidation Breaks: The profile shape in the S&P 500 suggests participants were “too” long and had poor location.

Knowing participants are doing a good job of defending their ~7% advance, a non-typical weekly trading range, after taking out the 127.20% price extension, a typical recovery target, and leaving minimal excess (i.e., a proper end to price discovery) at the high, odds point to the increased potential for higher trade or balance in the coming session(s).

That said, the following frameworks apply.

In the best case, the S&P 500 remains rotational, at or above the $3,900.00 HVNode. In the worst case, any break that finds increased involvement (i.e., supportive flows and delta) below the $3,880.00 HVNode, would favor continuation as low as the $3,830.75 HVNode.

Major change will be identified with trade above the $3,928.25 overnight rally-high, and below the $3,878.50 regular-trade low.

Levels Of Interest: $3,928.25 overnight rally-high, $3,900.00 HVNode, $3,878.50 regular-trade low.

Categories
Commentary

Market Commentary For 2/10/2021

Notice: To view this week’s big picture outlook, click here.

What Happened: Alongside optimism around an economic rebound, U.S. stock index futures established record all-time highs, overnight, before trading back into range.

What Does It Mean: On the heels of a de-risking event and v-pattern recovery, indices, like the S&P 500, maintained higher prices.

This price action occurred in the face of bearish undercurrents, highlighted in past commentary.

Important to note, however, is a pick up in call-side activity in the SPDR S&P 500 ETF Trust (NYSE: SPY), the largest ETF that tracks the S&P 500. This comes alongside the S&P 500’s re-entry into long-gamma (Graphic 1) and rotation near the $3,900 high-open interest strike.

Further, the addition of derivative exposure at higher strikes (Graphic 2), farther out in time, suggests an inclination by participants to maintain long exposure through February’s monthly options expiration (OPEX), a day that often marks an end to pinning (which we’ve seen over the past week).

More On The V-Pattern: A pattern that forms after a market establishes a high, retests some support, and then breaks above said high. In most cases, this pattern portends continuation. 

More On Gamma: Gamma is the sensitivity of an option to changes in underlying price. Dealers that take the other side of option trades hedge their exposure to risk by buying and selling the underlying. 

When dealers are short-gamma, they hedge by buying into strength and selling into weakness. When dealers are long-gamma, they hedge by selling into strength and buying into weakness. The former exacerbates volatility. The latter calms volatility.
Graphic 1: SpotGamma data suggests S&P 500 at or above “Long-Gamma” juncture.
Graphic 2: Option Order Flow.

What To Expect: Wednesday’s regular session (9:30 AM – 4:00 PM ET) will likely open outside of prior-balance and -range, suggesting the potential for immediate directional opportunity.

This comes after participants traversed over 7%, a non-typical weekly trading range, taking out the 127.20% price extension, a typical recovery target.

Given how far the discovery process has come, attention is drawn to the overnight high. Typically, there is a low historical probability associated with overnight rally-highs ending the upside discovery process. Add on the fact that Tuesday’s regular trade left minimal excess (i.e., a proper end to price discovery) at the high, odds point to the increased potential for higher trade or balance in the coming session(s).

Given that reference, the following frameworks apply.

In the best case, the S&P 500 does some backfilling to repair poor structures left in the wake of strong initiative buying overnight. In such a case, participants would look for responsive buying to surface at or above the $3,912.25 regular-trade high.

In the worst case, any break that finds increased involvement (i.e., supportive flows and delta) below the $3,908.75 high-volume area (HVNode), would favor continuation as low as the $3,900.00 and $3,880.00 HVNodes.

More On Volume Areas: A structurally sound market will build on past areas of high-volume. Should the market trend for long periods of time, it will lack sound structure (identified as a low-volume area which denotes directional conviction and ought to offer support on any test). 

If participants were to auction and find acceptance into areas of prior low-volume, then future discovery ought to be volatile and quick as participants look to areas of high-volume for favorable entry or exit.

Levels Of Interest: $3,908.75 HVNode.

Categories
Commentary

Market Commentary For 2/9/2021

Notice: To view this week’s big picture outlook, click here.

What Happened: U.S. stock index futures established record all-time highs Monday before trading back into range.

What Does It Mean: On an end-of-day spike, U.S. stock index futures established new all-time highs.

This price action occurred on the heels of a quick de-risking event and v-pattern recovery, alongside non-participatory speculative flows, a divergence in the DIX, and the market’s re-entry into long-gamma.

More On The V-Pattern: A pattern that forms after a market establishes a high, retests some support, and then breaks above said high. In most cases, this pattern portends continuation. 

More On Speculative Flows: Participants looking to capitalize on either upside or downside through the purchase and sale of options, the right to buy or sell an asset at a later date and agreed upon price.

More On DIX: For every buyer is a seller (usually a market maker). Using DIX — which is derived from short sales (i.e., liquidity provision on the market making side) — we can measure buying pressure.

More On Gamma: Gamma is the sensitivity of an option to changes in underlying price. Dealers that take the other side of option trades hedge their exposure to risk by buying and selling the underlying. 

When dealers are short-gamma, they hedge by buying into strength and selling into weakness. When dealers are long-gamma, they hedge by selling into strength and buying into weakness. The former exacerbates volatility. The latter calms volatility.
Graphic 1: SpotGamma data suggests S&P 500 at or above “Long-Gamma” juncture.

Important to note: unlike in prior sessions, participants saw some change in the undercurrents. A divergence between price (lower) and cumulative volume delta (higher). This divergence resolved itself in the last hour of trade on Monday.

More On Volume Delta: Buying and selling power as calculated by the difference in volume traded at the bid and offer.

What To Expect: Tuesday’s regular session (9:30 AM – 4:00 PM ET) will likely open inside a spike, within prior-balance and -range, suggesting minimal directional opportunity. This comes after participants traversed nearly 7%, a non-typical weekly trading range.

More On Spikes: Spike’s mark the beginning of a break from value. Spikes higher (lower) are validated by trade at or above (below) the spike base (i.e., the origin of the spike).

Further, given how far the discovery process has come, attention is drawn to a few key references.

The first is the end-of-day spike. Trade below the $3,899.00 spike base would be the most negative outcome and may trigger a new wave of downside discovery that would repair some of the poor structures left in the wake of the aforementioned advance.

The second key reference is the overnight high. Typically, there is a low historical probability associated with overnight rally-highs ending the upside discovery process. Add on the fact that Monday’s regular trade left minimal excess (i.e., a proper end to price discovery) at the high, odds point to the potential to trade higher in the coming session(s).

Given those key references, the following frameworks apply.

In the best case, the S&P 500 does some backfilling to repair poor structures left in the wake of strong initiative buying. In such a case, participants would look for responsive buying to surface at or above the $3,880.00 high-volume area (HVNode). 

In the worst case, any break that finds increased involvement (i.e., supportive flows and delta) below the $3,880.00 HVNode, would favor continuation as low as the $3,794.75 and $3,727.75 HVNodes.

More On Volume Areas: A structurally sound market will build on past areas of high-volume. Should the market trend for long periods of time, it will lack sound structure (identified as a low-volume area which denotes directional conviction and ought to offer support on any test). 

If participants were to auction and find acceptance into areas of prior low-volume, then future discovery ought to be volatile and quick as participants look to areas of high-volume for favorable entry or exit.

Today’s go/no-go level is the $3,899.00 spike base. Below, would portend downside discovery and structural repair. At or above denotes balance or continued upside discovery.

Levels Of Interest: $3,899.00 spike base.

Categories
Commentary

Market Commentary For 2/8/2021

Notice: To view this week’s big picture outlook, click here.

What Happened: U.S. stock index futures established record all-time highs overnight, alongside hopes of a speedy economic recovery, as a result of pandemic relief efforts.

What Does It Mean: After a quick de-risking event and v-pattern recovery, U.S. stock indexes are positioned for further upside, as high as the 100% price projection, which happens to be above $4,000.00, a primary target in the S&P 500. According to The Market Ear, similar risk rallies have happened after hedge fund de-grossing events; now, “Equities are rising along higher yields, dollar and [volatility], and the magic word here is discounting inflation.”

Important to note also is the persistent presence of bearish undercurrents, as evidenced by non-participatory speculative flows and delta, as well as a divergence in the DIX.

More On The V-Pattern: A pattern that forms after a market establishes a high, retests some support, and then breaks above said high. In most cases, this pattern portends continuation. 

More On Volume Delta: Buying and selling power as calculated by the difference in volume traded at the bid and offer.

More On DIX: For every buyer is a seller (usually a market maker). Using DIX — which is derived from short sales (i.e., liquidity provision on the market making side) — we can measure buying pressure.

More On Speculative Flows: Participants looking to capitalize on either upside or downside through the purchase and sale of options, the right to buy or sell an asset at a later date and agreed upon price.

What To Expect: Monday’s regular session (9:30 AM – 4:00 PM ET) will likely open on a gap, outside of prior-balance and -range, which — in normal circumstances — suggests the potential for immediate directional opportunity. However, market participants must not discount how far the discovery process has come.

Over 11 sessions (overnight and regular-trade), participants traversed nearly 7%, a non-typical weekly trading range. Adding, the S&P 500 took out its $3,900.00 price extension (i.e., a typical recovery price target) overnight, before leaving minimal excess at the high (i.e., a proper end to price discovery).

Now, in light of the low historical probability associated with overnight rally-highs ending the upside discovery process, the odds favor (1) backfilling or (2) balance before a participants restart the upside discovery process.

So, in the best case, the S&P 500 does some backfilling to repair poor structures left in the wake of strong initiative buying. In such a case, participants would look for responsive buying to surface at or above the $3,840.00 high-volume area (HVNode). In the worst case, any break that finds increased involvement (i.e., supportive flows and delta) below the $3,840.00 HVNode, would favor continuation as low as the $3,794.75 and $3,727.75 HVNodes.

More On Volume Areas: A structurally sound market will build on past areas of high-volume. Should the market trend for long periods of time, it will lack sound structure (identified as a low-volume area which denotes directional conviction and ought to offer support on any test). 

If participants were to auction and find acceptance into areas of prior low-volume, then future discovery ought to be volatile and quick as participants look to areas of high-volume for favorable entry or exit.

Today’s go/no-go level is the $3,880.00 HVNode. Below, would portend downside discovery and structural repair. At or above denotes balance, a sign that the market is awaiting new information to make its next move.

Levels Of Interest: $3,880.00 HVNode.

Bonus: It’s very tough to read the market at this juncture.

Buying has run out (as evidenced by the aforementioned bearish undercurrents) and it’s as if market risks are not being priced in correctly, an opinion shared by Nomura’s Charlie McElligott.

According to McElligott, crash and tail risk is holding back dealers from supplying volatility amid “a near-endless need for skew/forward vol/convexity from hedgers.” In an environment in which true fundamental buying is absent, flows as a result of activity in the derivatives market become increasingly impactful.

Adding, as the Heisenberg Report states, “markets are increasingly susceptible to the self-referential, flows-volatility-liquidity feedback loop (colloquially: the ‘doom loop’) and other manifestations of VaR shocks. Long periods of apparent calm hide an underlying fragility in true ‘stability breeds instability’ fashion.”

As a result of this new regime, as stated in the “What To Expect” section above, dealers have a difficult time taking the other side. Due to this, market participants see a persistent bid in volatility, a factor preventing many systematic and hedge fund strategies from going “all-in” on the long-side.

Categories
Commentary

Market Commentary For 2/5/2021

Notice: To view this week’s big picture outlook, click here.

What Happened: Ahead of data on employment, alongside the passage of a budget plan to advance $1.9 trillion in COVID aid, U.S. stock index futures rose overnight.

What Does It Mean: Given a v-pattern recovery, U.S. stock indexes are positioned for further upside, as high as the 100% price projection, which happens to be near $4,000.00 in the S&P 500.

This positive price action is happening in the context of bearish undercurrents as evidenced by non-participatory speculative flows, delta (i.e., non-committed buying as measured by volume delta), and a divergence in DIX, a proxy for buying derived from short sales (i.e., liquidity provision on the market making side).

Since price pays, participants ought to discount these undertones and position themselves for further upside discovery.

What To Expect: Friday’s regular session (9:30 AM – 4:00 PM ET) will likely open outside of prior-balance and -range, suggesting the potential for immediate directional opportunity.

Currently, the S&P 500 is rotating below the $3,884.75 projection, a typical target on a break from balance. Below current price lies Thursday’s $3,855.00 Virgin Point Of Control, or VPOC (i.e., the fairest price to do business in a prior session).

Noting: POCs (like HVNodes described below) are valuable as they denote areas where two-sided trade was most prevalent. Participants will respond to future tests of value as they offer favorable entry and exit.

Further below is a the $3,840.25 HVNode. As stated in prior sessions, HVNodes can be thought of as building blocks — they also denote areas of supply and demand. The primary strategy is to respond to probes into these supply (i.e., selling responsively) and demand (i.e., buying responsively) areas as they offer favorable entry and exit.

In the coming session, participants will want to pay attention to Thursday’s end-of-day spike and overnight all-time high (ONH).

Spike’s mark the beginning of a break from value and, in this case, would support the bullish thesis as long as participants, during regular trade, spend time above the spike base ($3,857.75). Adding, there is a low historical probability that overnight rally-highs end the upside discovery process.

For today, the following frameworks ought to be applied.

In the best case, the market will remain above, or find acceptance at (in the form of rotational trade) the $3,857.75 spike base. In the worst case, responsive sellers appear and restart the downside discovery process.

A break above the $3,886.25 ONH, participants may see discovery as high as $3,900.00, a balance-area extension (i.e., another balance-break target). A break below the prior RTH Low ($3,830.25), participants may see prices as low as the $3,799.00 balance-area low.

Levels Of Interest: $3,886.25 ONH, $3,857.75 spike base, $3,830.25 RTH Low.

Categories
Commentary

Market Commentary For 2/4/2021

Notice: To view this week’s big picture outlook, click here.

What Happened: U.S. stock index futures balanced in prior-range, as evidenced by a lack of directional resolve.

What Does It Mean: After a rapid de-grossing and v-pattern recovery, stock indexes are nearing an important hurdle.

In particular, the S&P 500 has to contend with a transition into long-gamma.

Gamma is the sensitivity of an option to changes in underlying price. Dealers that take the other side of option trades hedge their exposure to risk by buying and selling the underlying.

When dealers are short-gamma, they hedge by buying into strength and selling into weakness. When dealers are long-gamma, they hedge by selling into strength and buying into weakness. The former exacerbates volatility. The latter calms volatility.

Adding: Here’s a good explanation I wrote regarding the derivative market’s impact on the equity market.

Graphic 1: SpotGamma suggests S&P 500 nearing “Long-Gamma” territory.

Further, given the aforementioned v-pattern recovery, a price sequence that ought to be followed by further price discovery, as high as the 100% price projection, which happens to be near $4,000.00 in the S&P 500, market participants ought to also pay attention to divergences popping up across different indices.

To be more specific, Wednesday’s regular trade in the Nasdaq-100 showed weakness relative to the S&P 500. In the end, participants established a neutral-center day on S&P 500 and neutral-extreme down day in the Nasdaq-100.

On a neutral-center day, participants test both extremes before closing an index in range, suggesting minimal confidence and balance. On a neutral-extreme day, participants test both extremes before closing at on extreme, suggesting increased confidence and imbalance.

The profile shape in the S&P 500 confirms balance while in the Nasdaq-100 it’s likely that participants were “too” long and had poor location.

What To Expect: Thursday’s regular session (9:30 AM – 4:00 PM ET) will likely open inside of prior-balance and -range, suggesting limited directional opportunity and high volatility.

Currently, the S&P 500 is rotating at the $3,842.00 high-volume area (HVNode).

As stated, HVNodes can be thought of as building blocks — they also denote areas of supply and demand. In this case, $3,842.00 can be thought of as an area of supply. The primary strategy is to respond to probes into these supply (i.e., selling responsively) and demand (i.e., buying responsively) areas as they offer favorable entry and exit.

In the coming session, participants will want to pay attention to Tuesday’s overnight high ($3,483.50) and Monday’s regular-trade low ($3,799.00). The reason being, between those two references is a developing balance area. Balance-areas make it easy to spot change in the market (i.e., the transition from two-time frame trade, or balance, to one-time frame trade, or trend).

Added Note: There is a low historical probability that overnight rally-highs end the upside discovery process.

From an order flow perspective, the absence of aggressive buying suggests more of the same — balance or downside to repair poor structures left in the wake of short-covering and initiative buying in the day’s prior.

In the simplest way, high-volume areas can be thought of as building blocks. A structurally sound market will build on past areas of high-volume. Should the market trend for long periods of time, it will lack sound structure. If participants were to auction and find acceptance into areas of prior low-volume, then future discovery ought to be volatile and quick as participants look to areas of value for favorable entry or exit.

For today, the following frameworks ought to be applied.

In the best case, the market will initiate above, or find acceptance at (in the form of rotational trade) the $3,842.00 HVNode. In the worst case, responsive sellers appear and restart the downside discovery process. Any break that finds increased involvement below the $3,799.00 regular-trade low, would favor continuation as low as the $3,727.75 HVNode.

The go/no-go for upside is the $3,843.50 overnight-trade high (ONH). The go/no-go for downside is $3,799.00 regular-trade low (RTH Low). Anything in-between portends responsive, non-directional trade.

A break above the ONH, participants may see discovery as high as $3,880.00, a balance-area projection (i.e., typical balance-break target). A break below the RTH Low, participants may see prices as low as $3,750.00, another balance-area projection.

Levels Of Interest: $3,843.50 ONH, $3,799.00 RTH Low.

Categories
Commentary

Market Commentary For 2/3/2021

Notice: To view this week’s big picture outlook, click here.

What Happened: After strong earnings from Amazon.com Inc (NASDAQ: AMZN) and Alphabet Inc (NASDAQ: GOOGL), alongside stimulus optimism, market participants traded responsively in Tuesday’s regular trading range, suggesting an acceptance of higher prices.

What Does It Mean: Late last week, market’s were in a good position for downside discovery. Since then however, conditions have changed markedly.

Further, given the retracement, the S&P 500, in particular, is in a position to digest the recent advance. In other words, two-sided trade that repairs some of the poor structures (as evidenced by low-volume areas) left in the wake of initiative buying would be the most positive outcome.

In the simplest way, high-volume areas can be thought of as building blocks. A structurally sound market will build on past areas of high-volume. Should the market trend for long periods of time, it will lack sound structure. If participants were to auction and find acceptance into areas of prior low-volume, then future discovery ought to be volatile and quick as participants look to areas of value for favorable entry or exit.

What To Expect: Wednesday’s regular session (9:30 AM – 4:00 PM ET) will likely open inside of prior-balance and -range, suggesting limited potential for directional opportunity and high volatility.

Currently, the S&P 500 is rotating at the $3,842.00 high-volume area (HVNode).

As stated, HVNodes can be thought of as building blocks — they also denote areas of supply and demand. In this case, $3,842.00 can be thought of as an area of supply. The primary strategy is to respond to probes into these supply (i.e., selling responsively) and demand (i.e., buying responsively) areas as they offer favorable entry and exit.

Important to add is the presence of divergent speculative flows (Graphic 1) and the decline in a proxy for buying derived from short sales (i.e., liquidity provision on the market making side), per Graphic 2.

Graphic 1: Speculative derivatives activity for February 2, 2021.
Graphic 2: DIX by SqueezeMetrics suggests divergence between price and buying intact.

Given that the market will likely open in-range, participants should look to whether the advance holds (i.e., a market will transition from up and down, to sideways trade). Holding the gap would suggest initiative buyers are in control, near-term. Auctioning below Tuesday’s regular-trade low ($3,799.00) would be the most negative outcome.

In the best case, the market will initiate above, or find acceptance at (in the form of rotational trade) the $3,842.00 HVNode. In the worst case, responsive sellers appear and restart the downside discovery process. Any break that finds increased involvement below the $3,799.00 regular-trade low, would favor continuation as low as the $3,727.75 HVNode.

The go/no-go for upside is the $3,843.50 overnight-trade high. The go/no-go for downside is $3,799.00 regular-trade low. Anything in-between portends responsive, non-directional trade.

Levels Of Interest: $3,843.50 ONH, $3,799.00 regular-trade low.