The daily brief is a free glimpse into the prevailing fundamental and technical drivers of U.S. equity market products. Join the 300+ that read this report daily, below!
What Happened
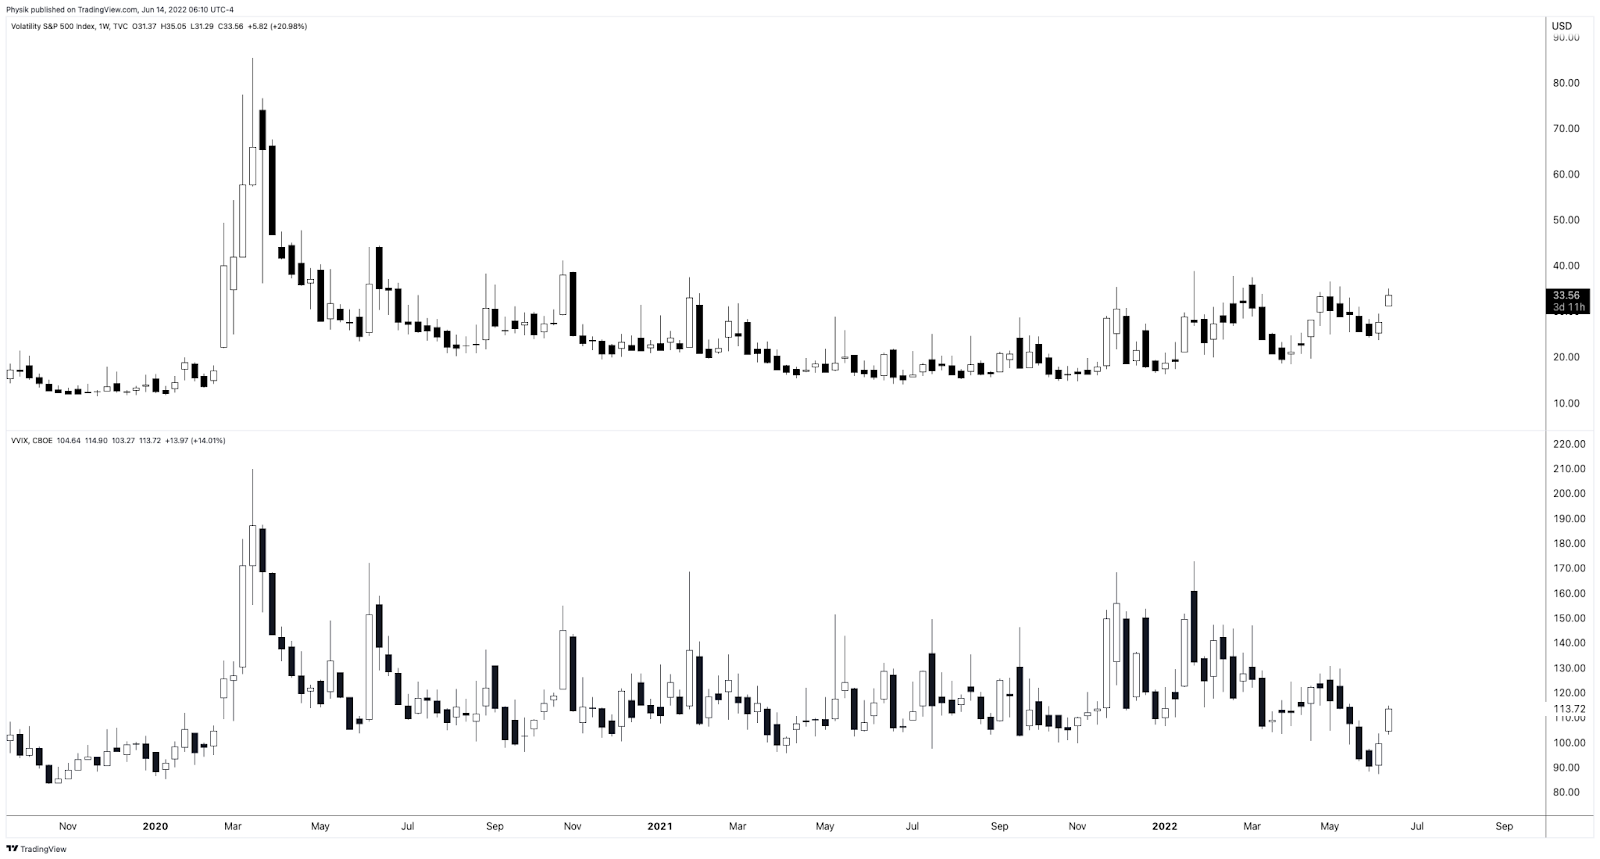
Overnight, equity index and commodity futures were sideways to lower all the while bonds and volatility were bid.
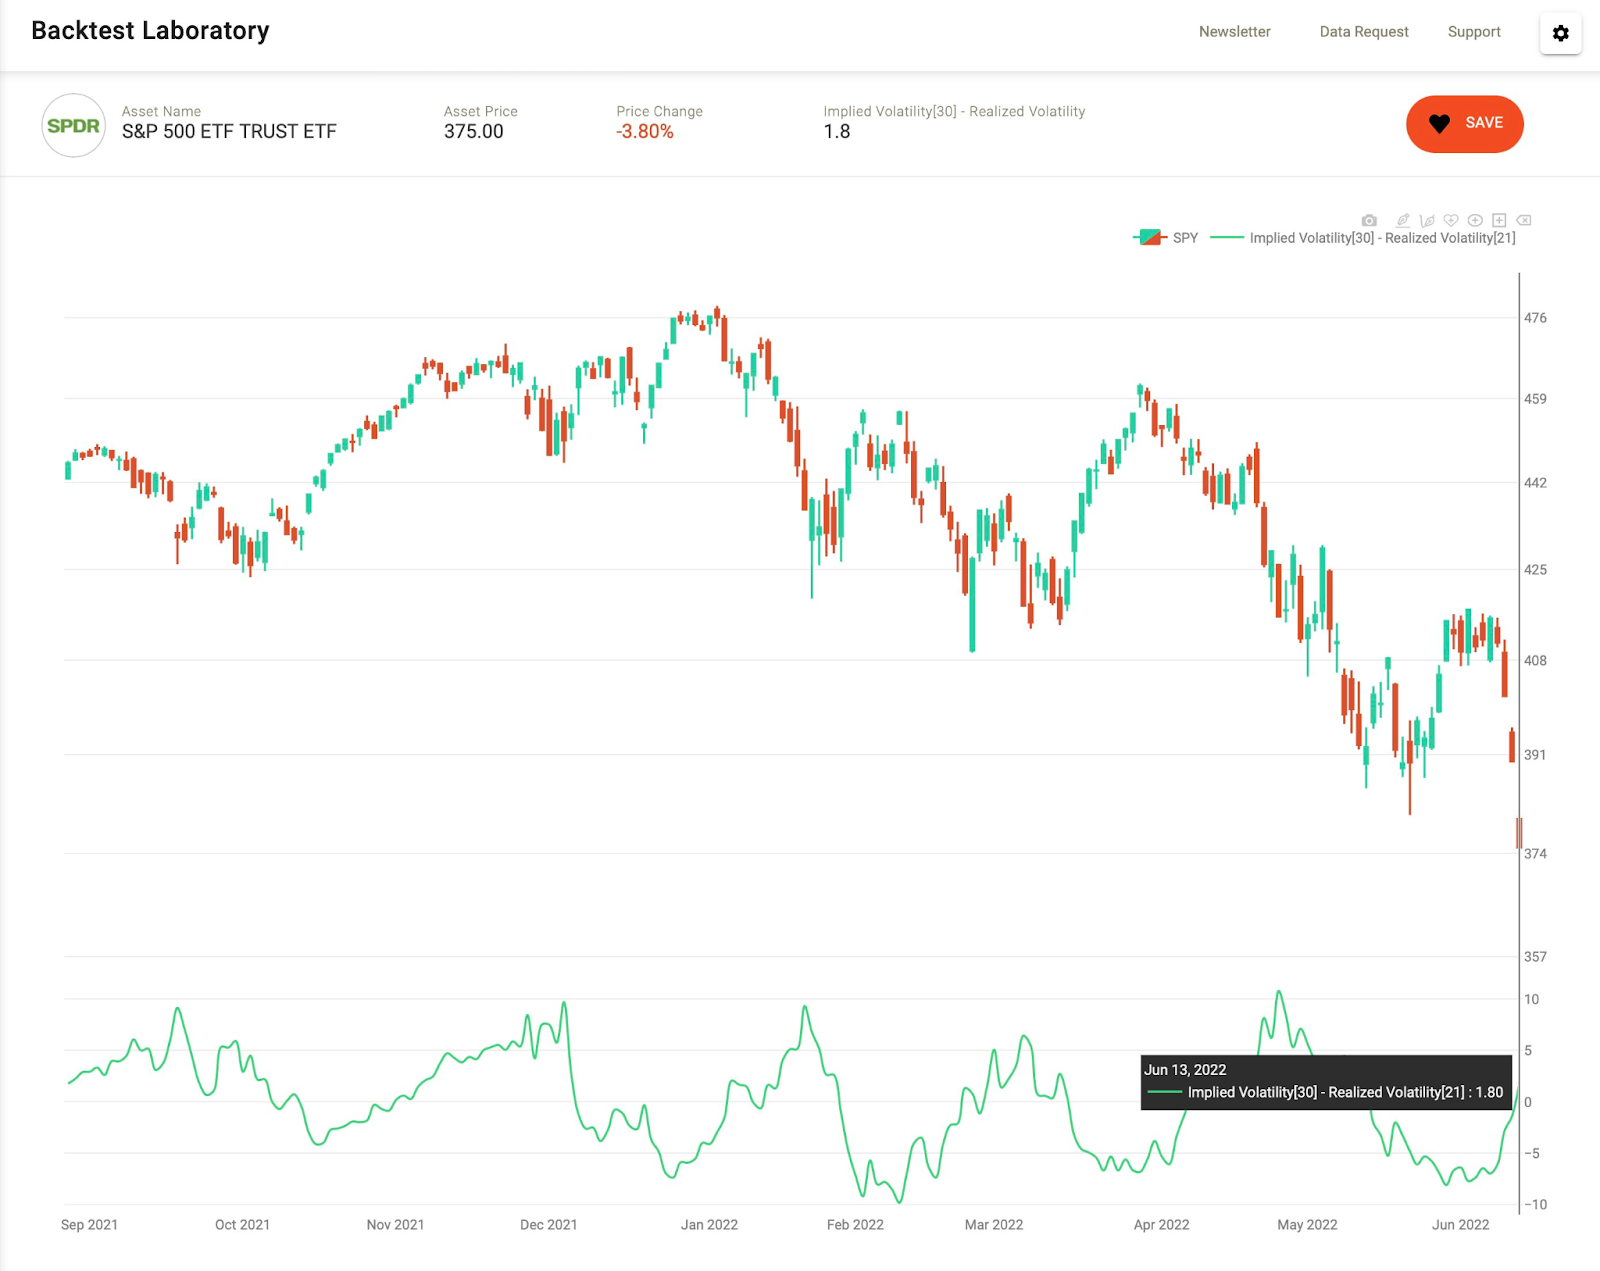
This is after participants, based on metrics included later in the letter, took the advance as an opportunity to sell at higher prices. Demanded was protection, and this bid implied volatility.
Big headlines include China sending warplanes near Taiwan after the U.S. rejected its strait claims. The Taiwanese Foreign Minister Joseph Wu wrote that the threat was “more serious than ever.” This is, also, ahead of Taiwan and U.S. officials talking about arms sales.
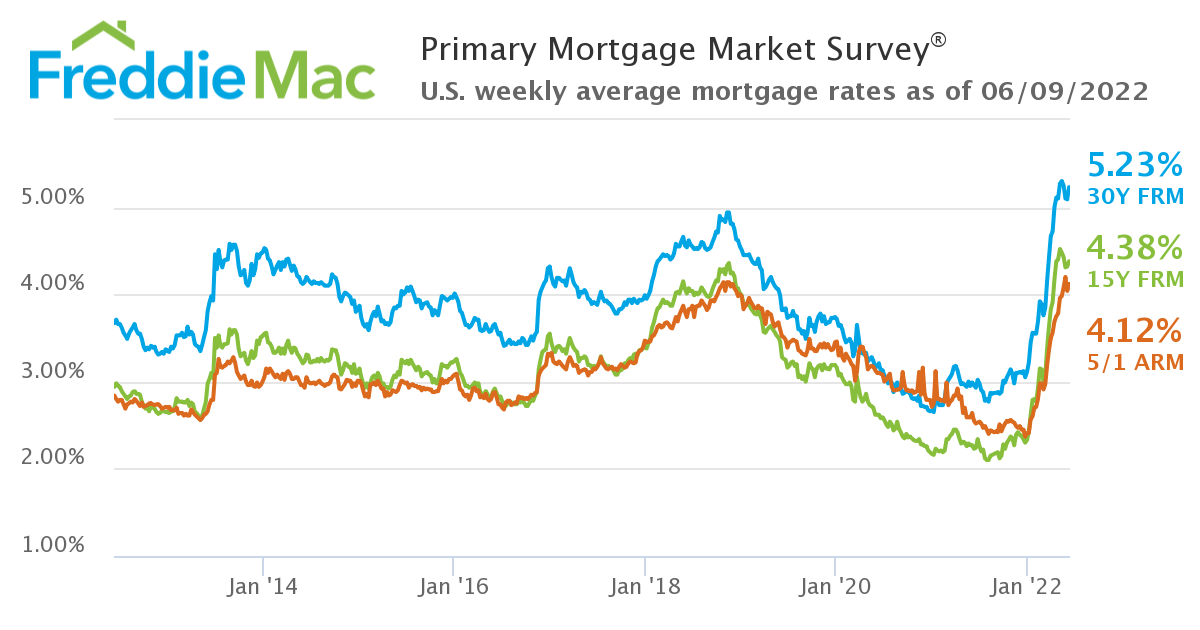
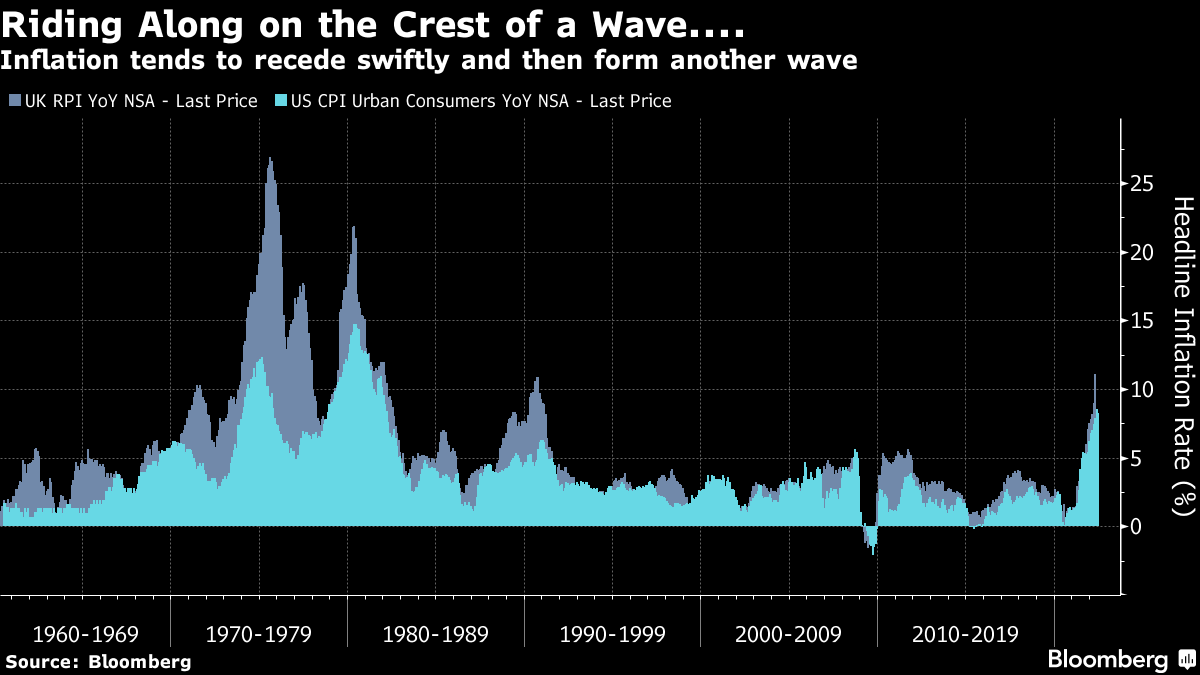
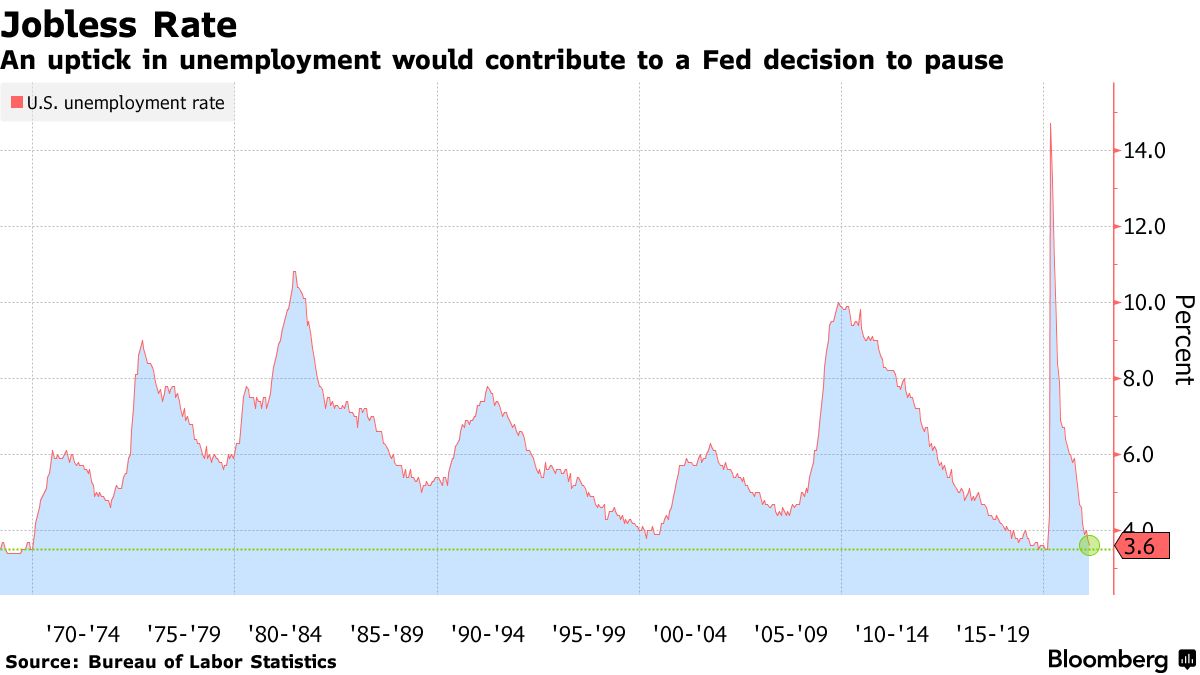
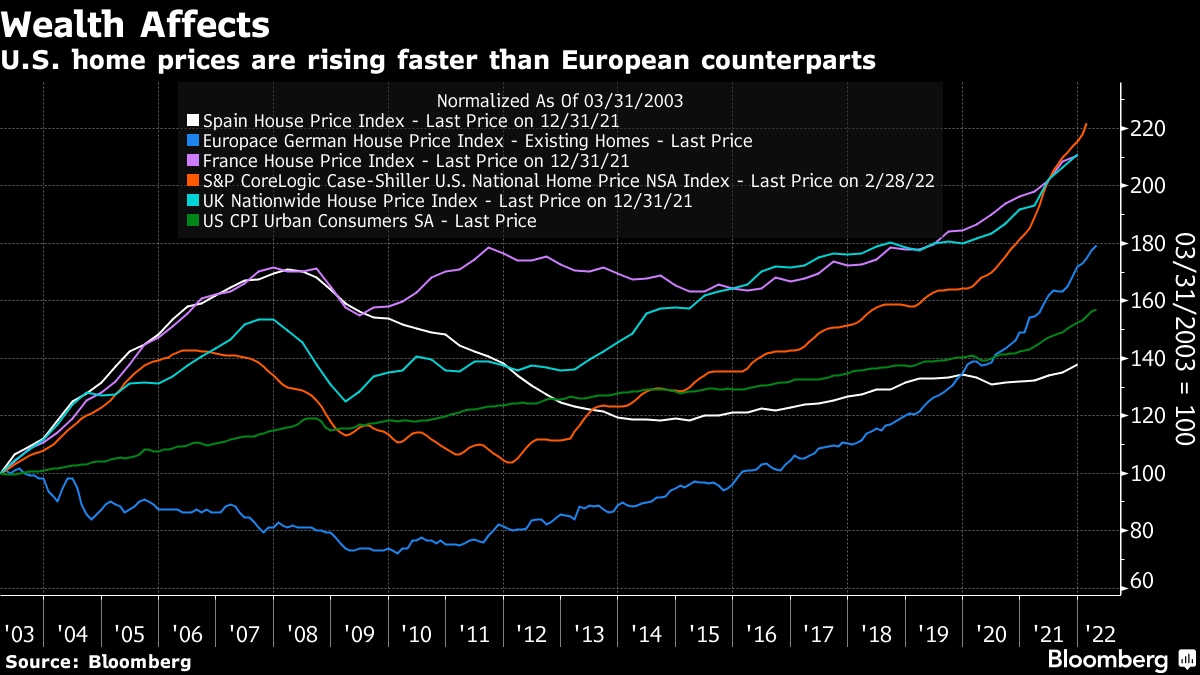
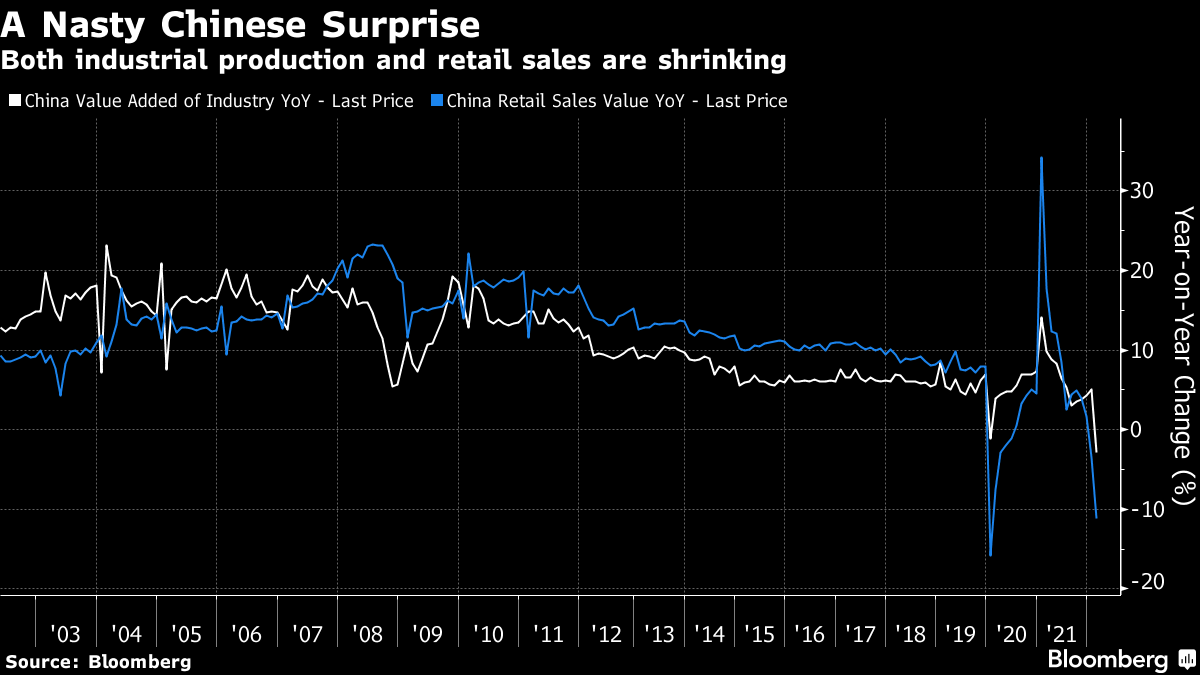
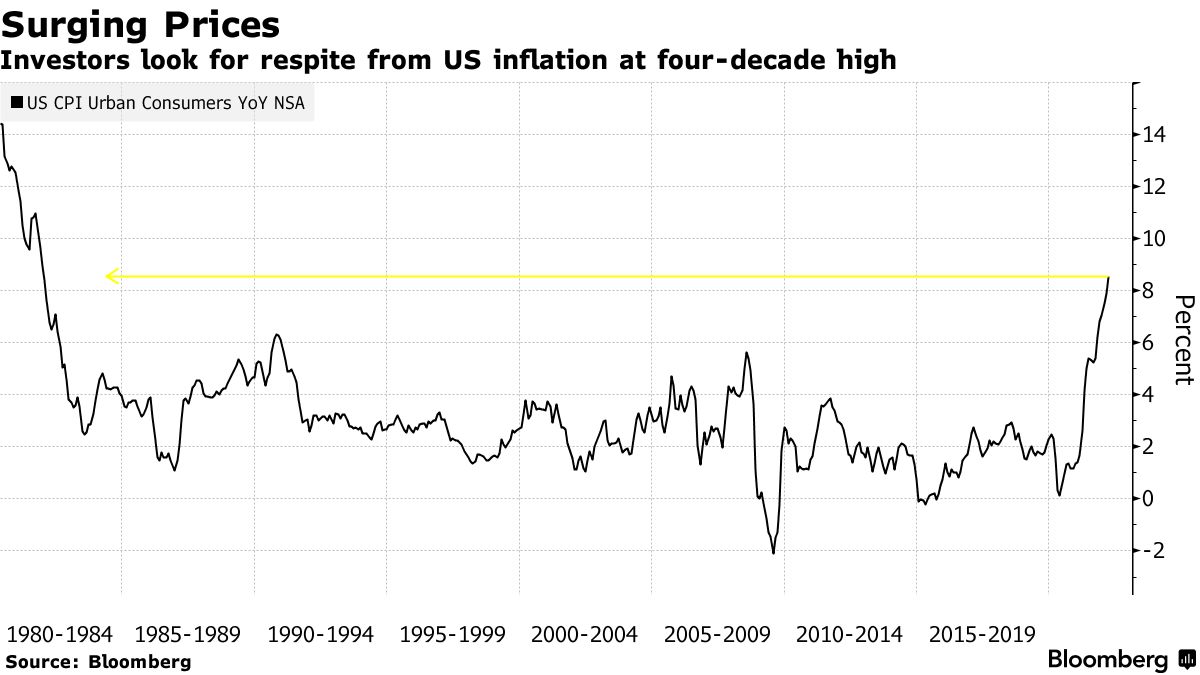
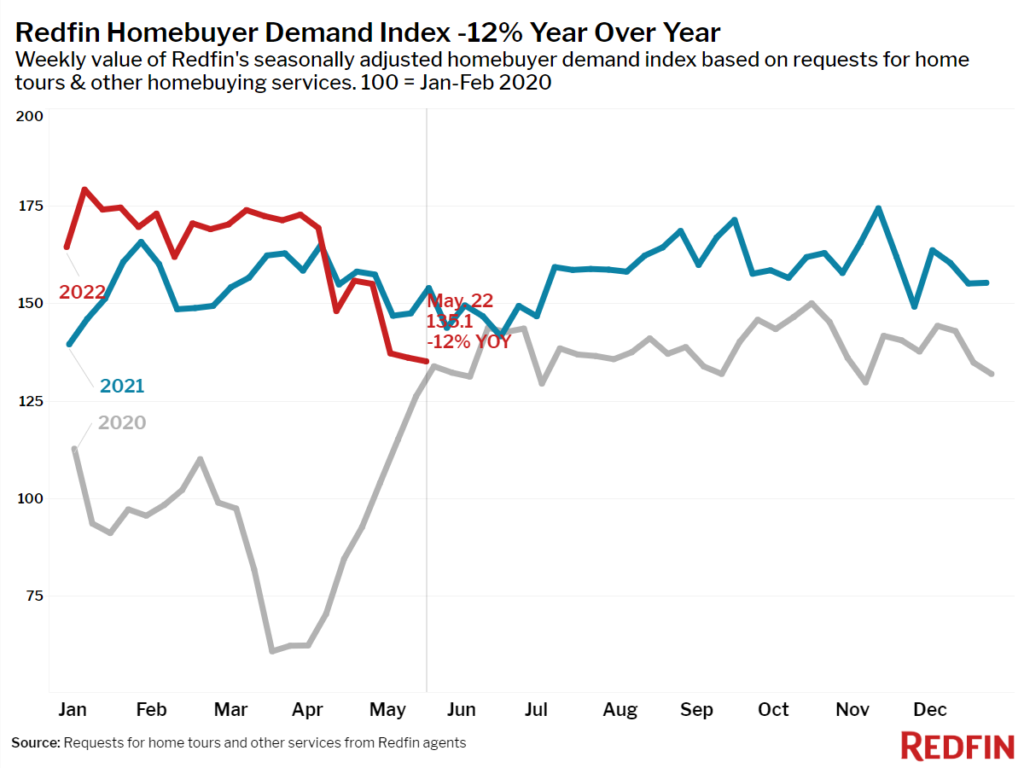
In other news, Congress was called on to pass a $0.184 per gallon gasoline tax holiday. Growth in job postings slowed as Q2 GDP forecasts have been revised lower, Chinese manufacturing orders declined by 20-30%, U.K. inflation hit a 40-year record, and sellers of homes are cutting prices in some of the hottest markets while the demand for adjustable-rate mortgages surges.
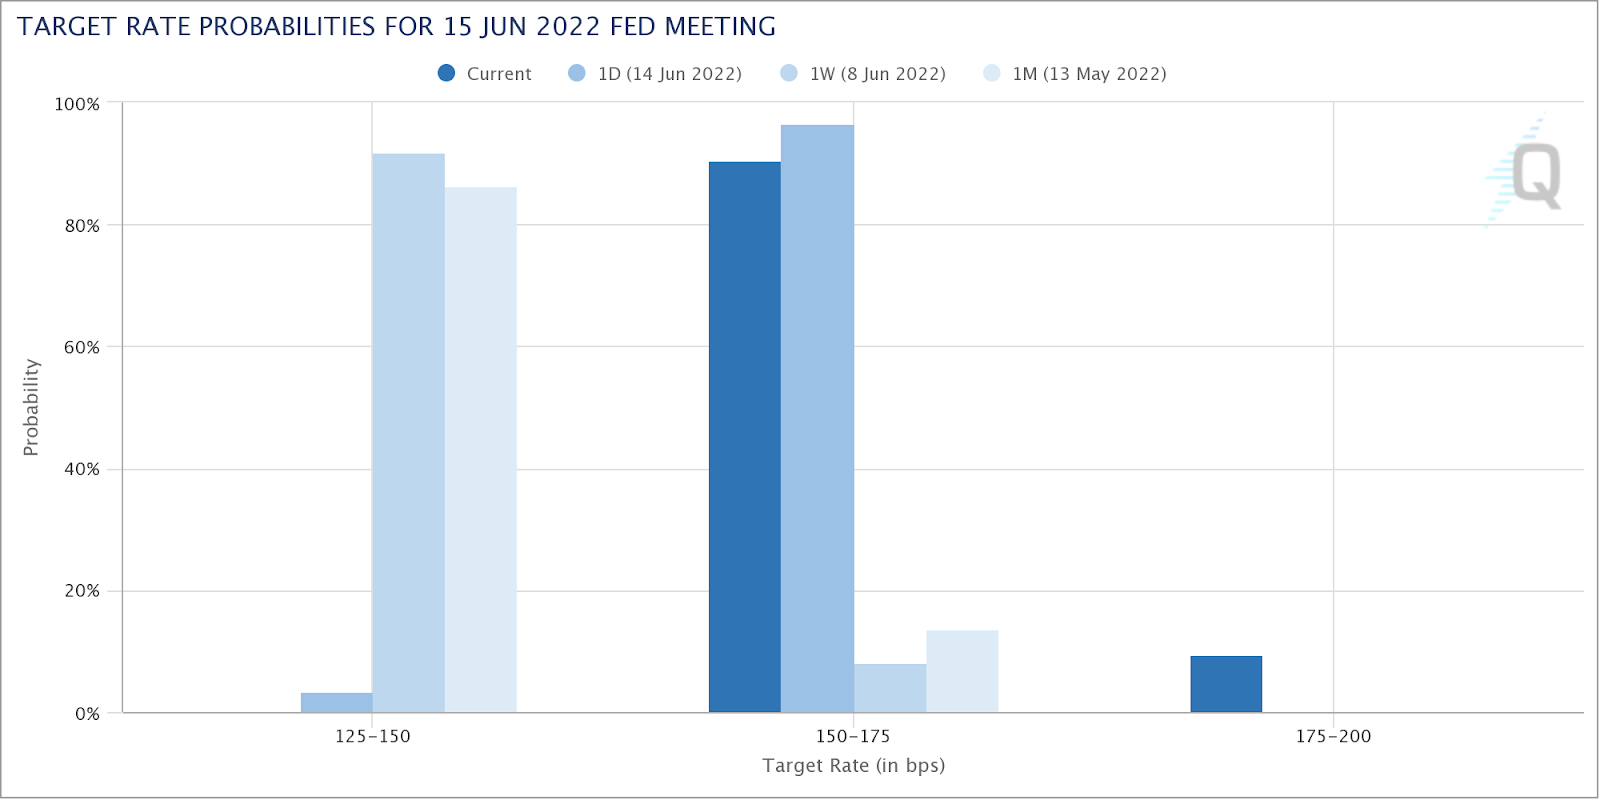
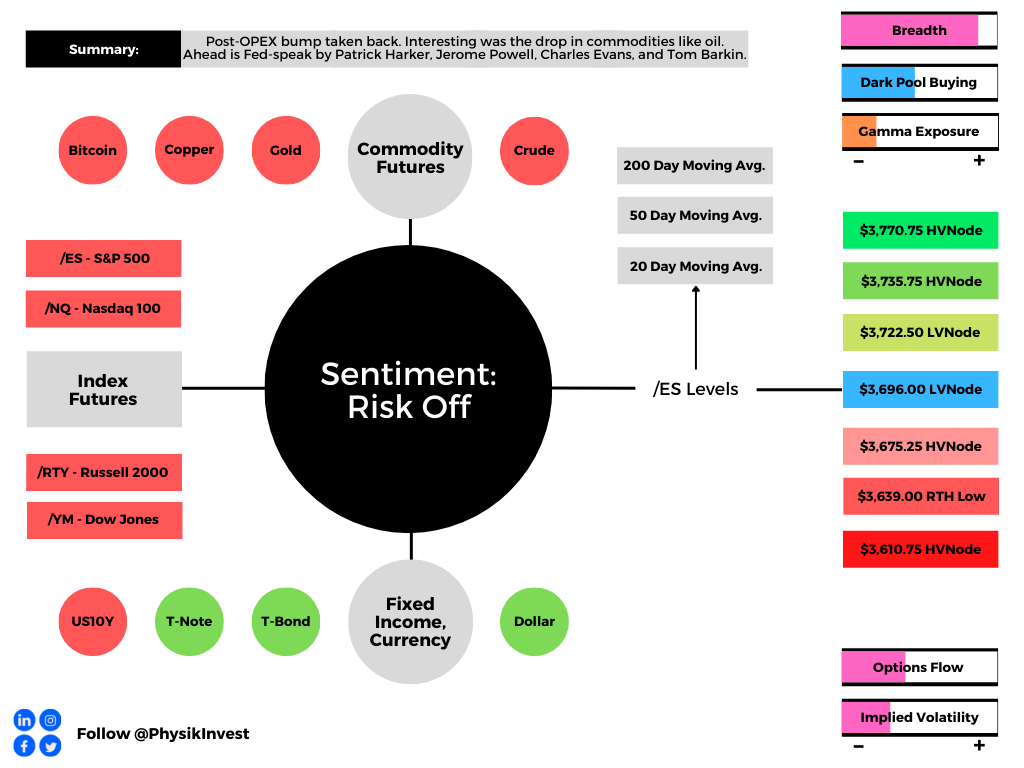
Ahead, the Federal Reserve’s (Fed) Patrick Harker speaks at 9:00 AM ET. Then, Jerome Powell testifies to the Senate Banking Committee at 9:30 AM ET. Later, Charles Evans speaks at 12:50 PM ET, followed by Harker and Barkin, again, at 1:30 PM ET.
What To Expect
Fundamental: For what it is worth when it comes to talking of theory and the economy, ARK Invest’s Cathie Wood has been spot on, in many ways.
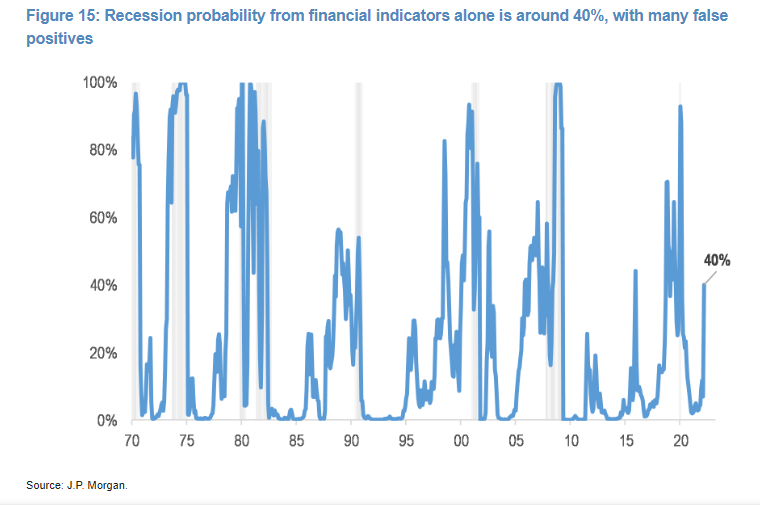
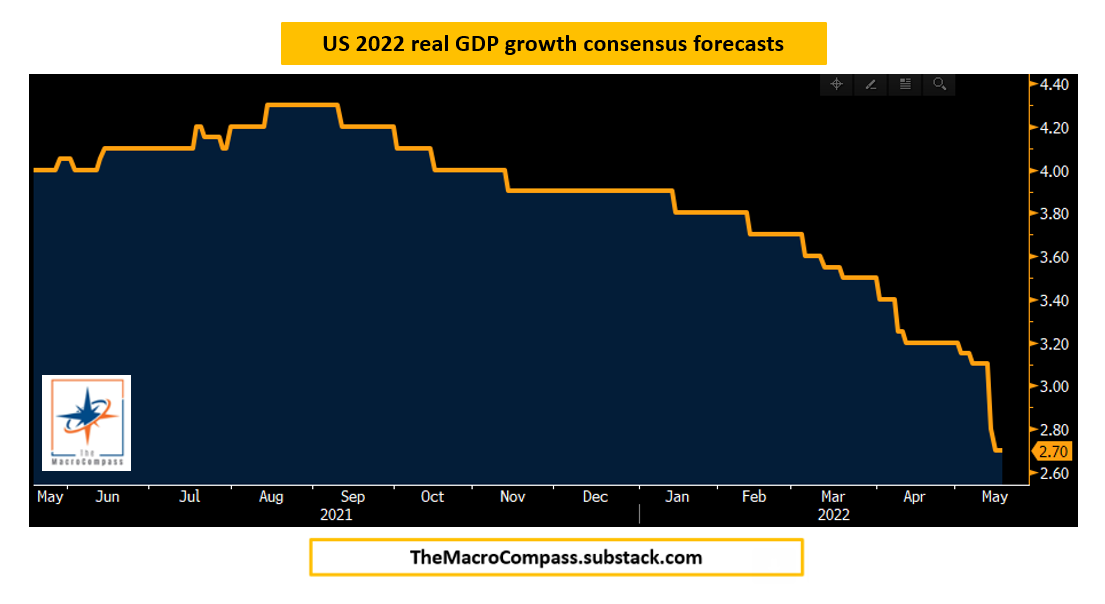
Somewhat pursuant to our detailed analysis on May 18, 2022, which talked about the impact of reduced liquidity and credit on the real economy and asset prices, Wood explained that the U.S. fell into a recession during the first quarter.
Read: Daily brief for May 18, 2022.
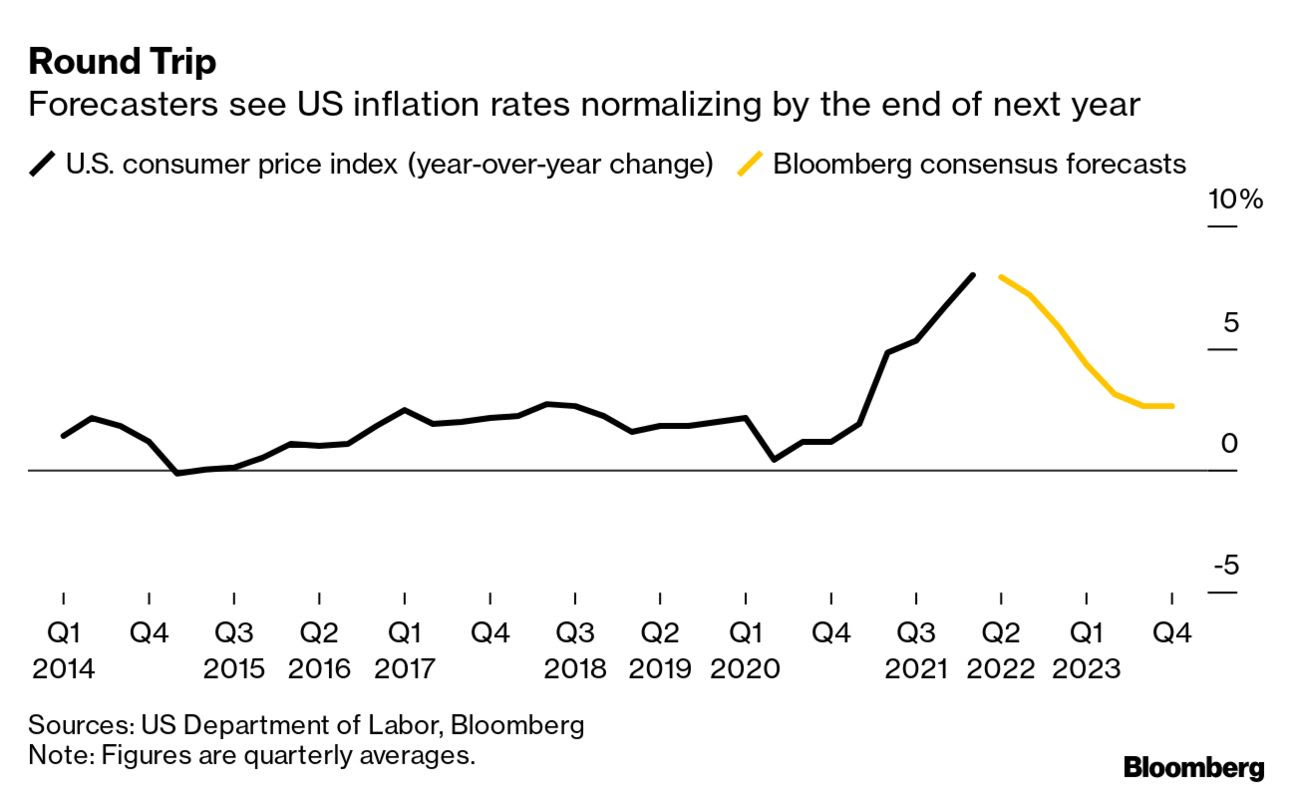
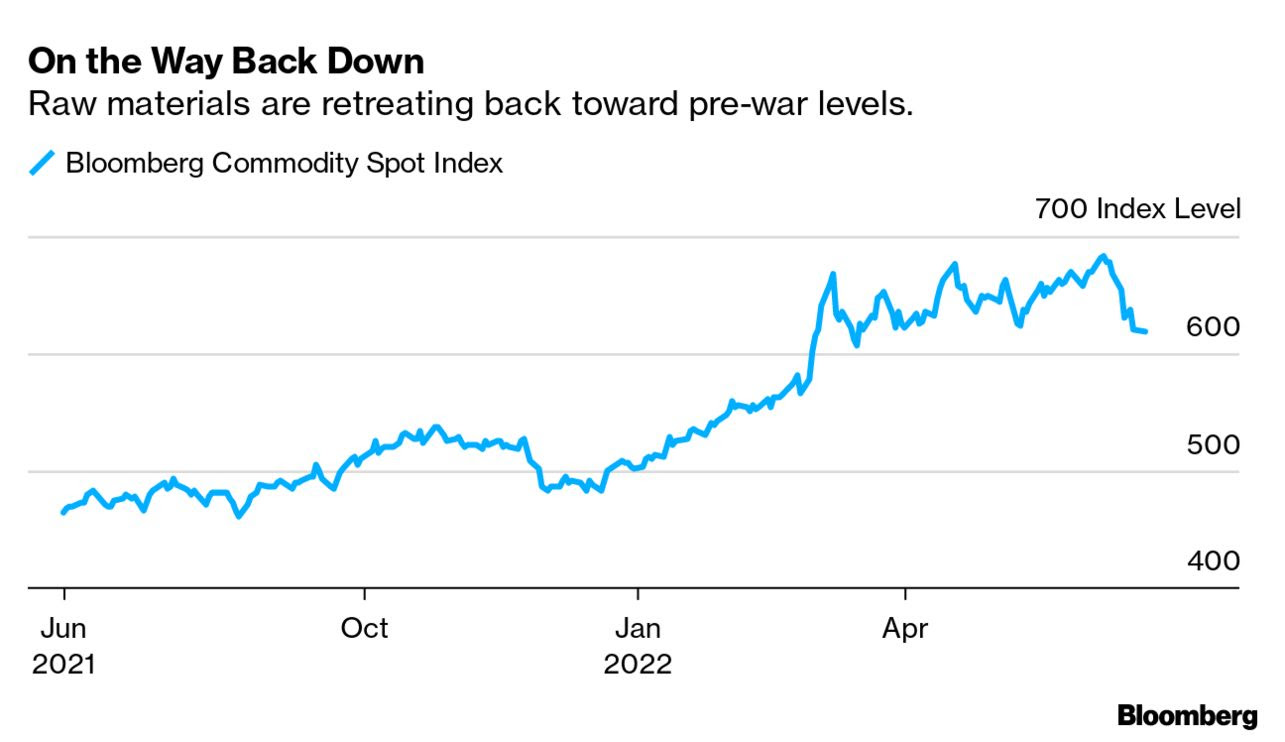
“If massive inventor[ies] bloat real GDP in the second quarter, they will unwind and hurt growth for the rest of the year,” she said. Last year, though badly timed, Wood said that inflation would be on its way out due in part to excess inventory which would be reflected in commodity prices.
Read: Walmart Inc’s (NYSE: WMT) inventory glut to reduce in a “couple of quarters” and how Target Corporation’s (NYSE: TGT) oversupply problem should scare all retailers.
“If inventories and stock prices are leading indicators for employment and wages, … then fears of cost-push inflation a la 1970’s should disappear during the next six months.”
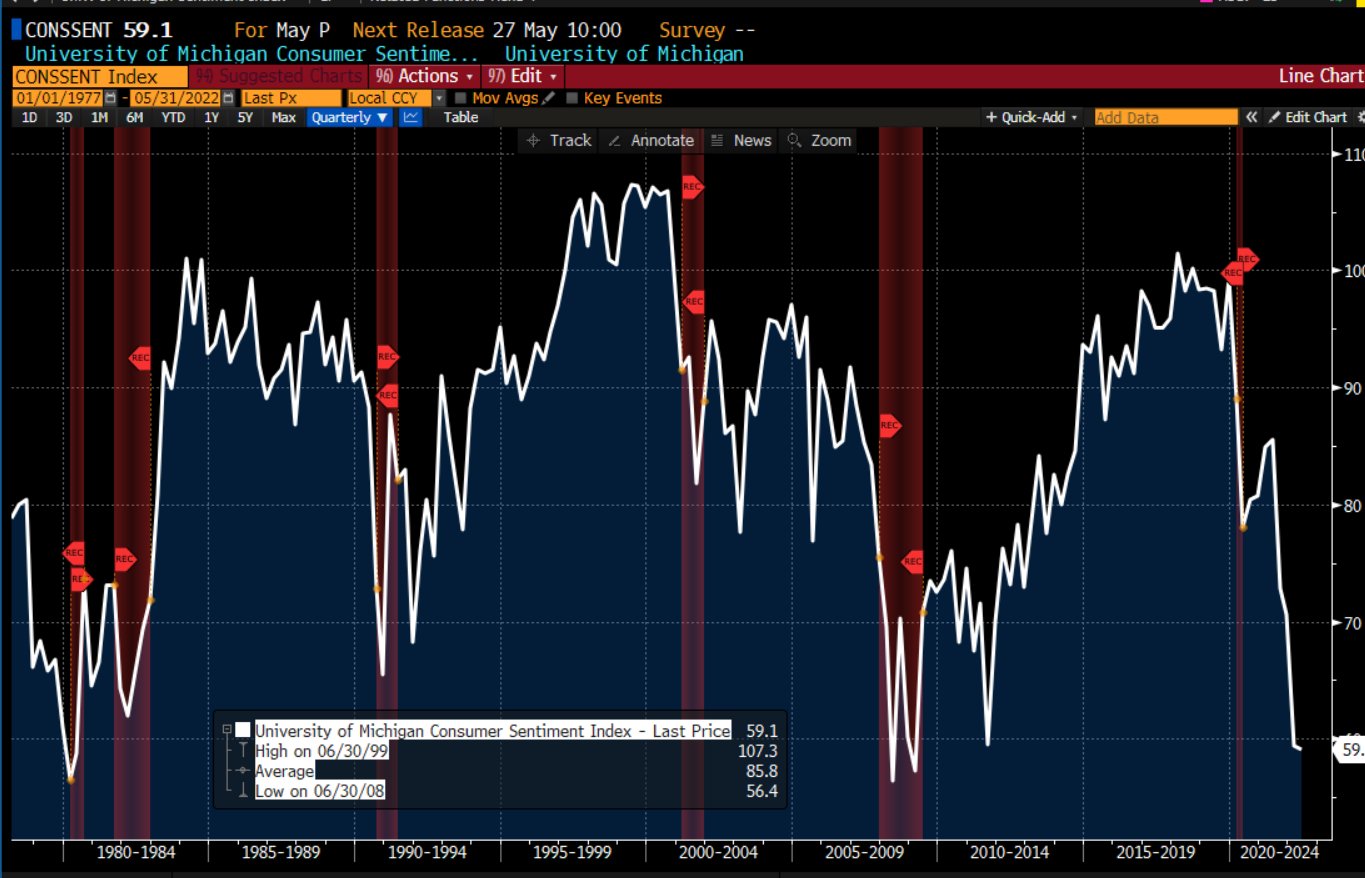
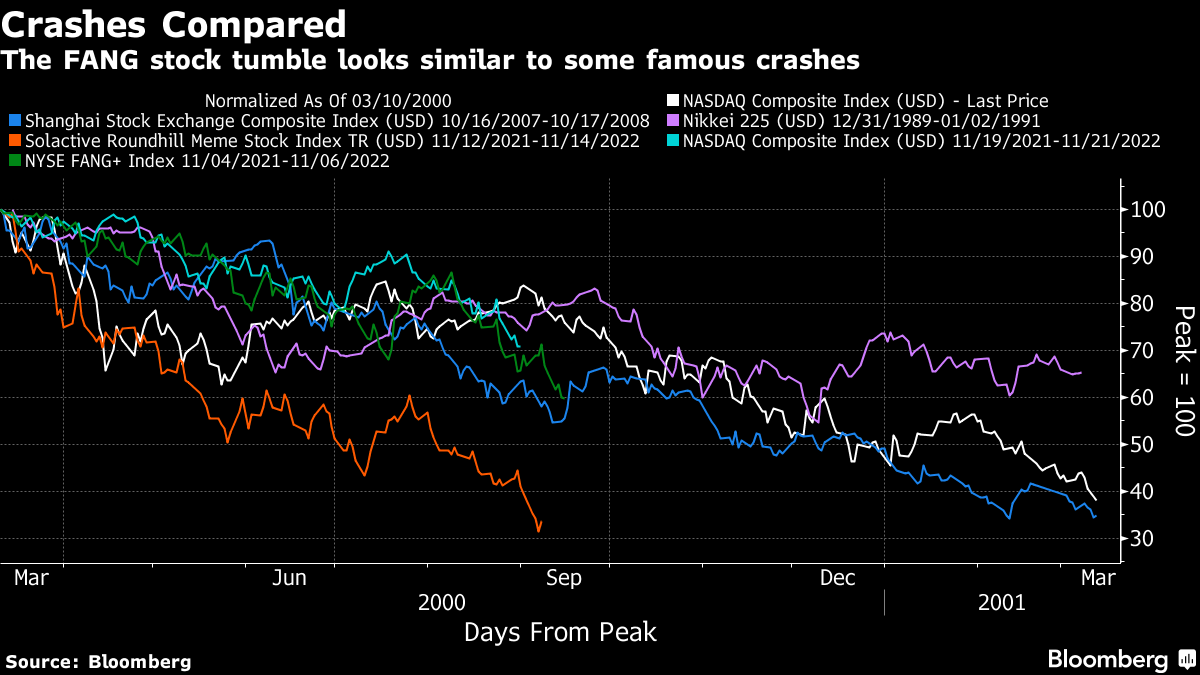
To put it briefly, as we’ve talked about in the past, the recent market rout is a recession and the direct reflection of the unwind of carry. It is the manifestation of a deflationary shock, and today’s sentiment and reducing demand for goods, among other things, reflect this.
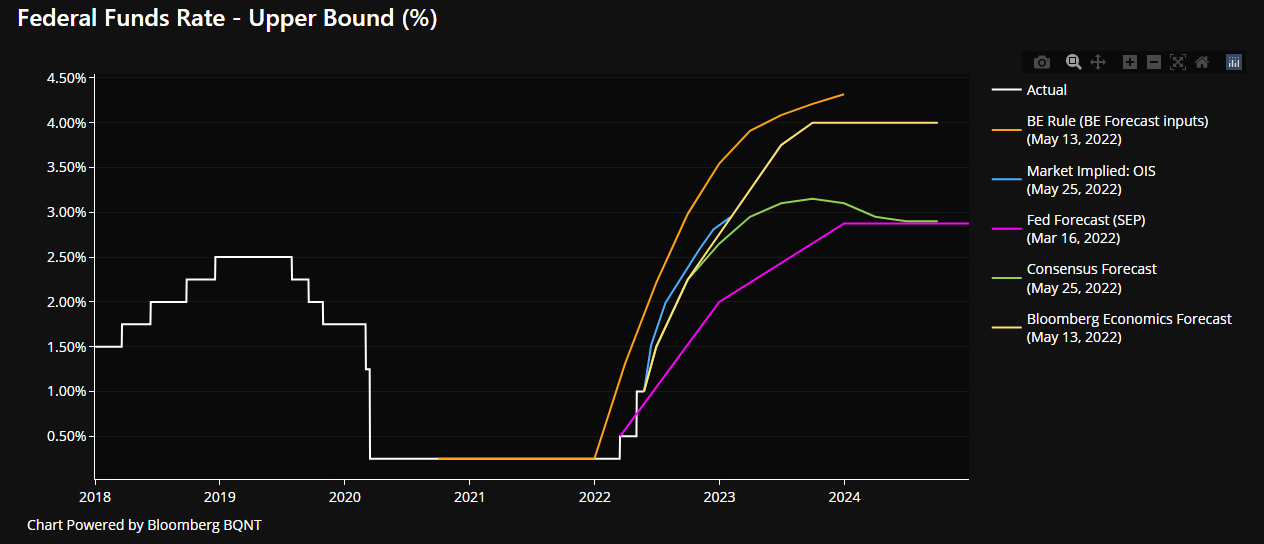
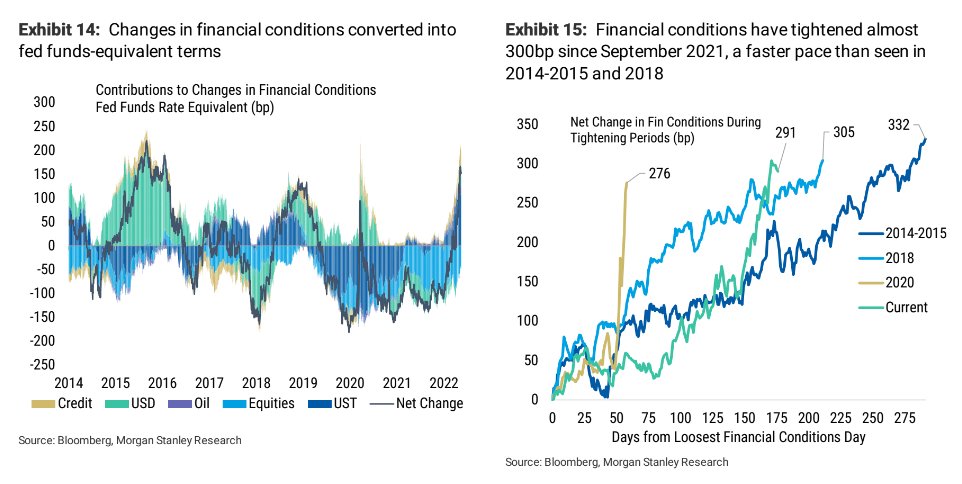
And, with that, after a period during which capital was misallocated, the Fed is not in a position to control price stability “without bringing down the markets,” per Kai Volatility’s Cem Karsan.
Read: Kris Abdelmessih’s Moontower #148 on prevailing macroeconomic perspectives.
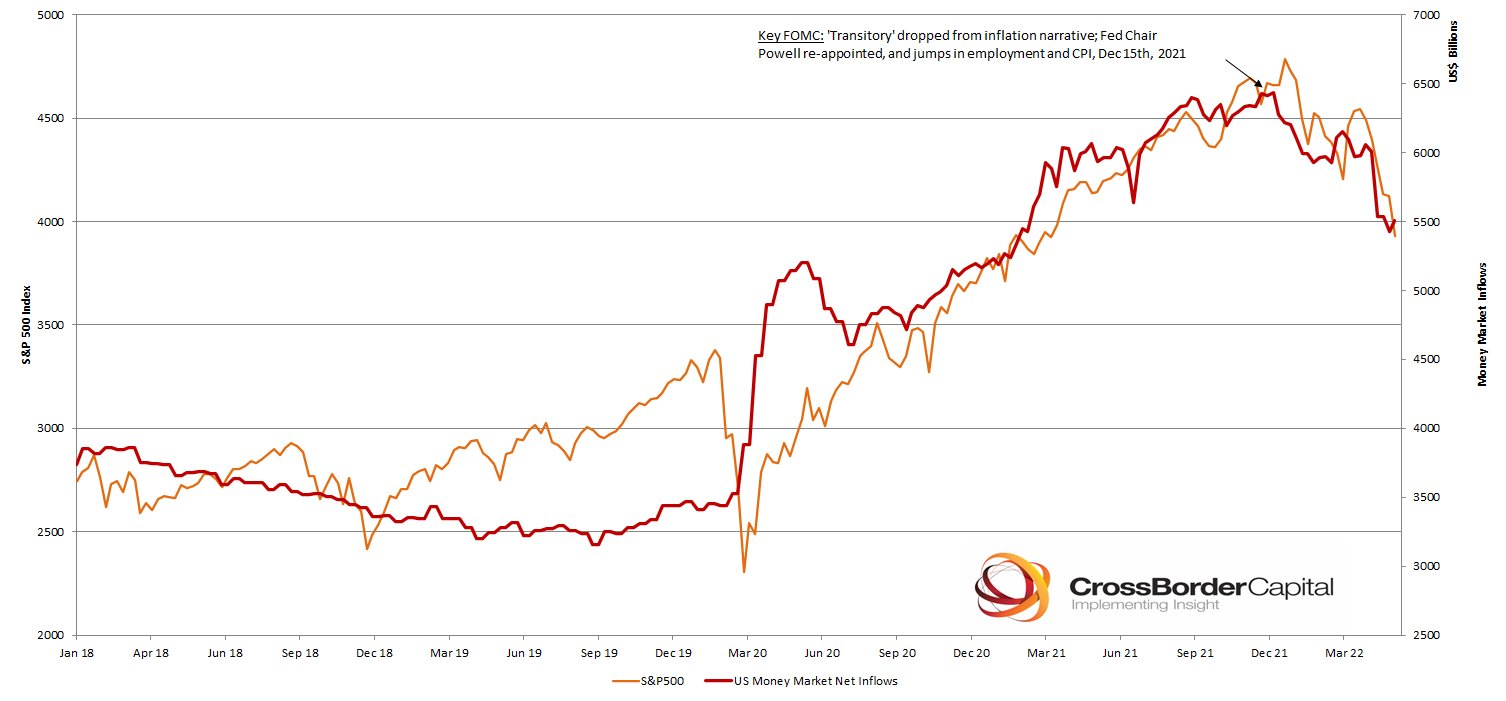
In light of these efforts to control price stability, to remain is a continued reach for cash (or bank deposits) and the sale of non-cash assets.
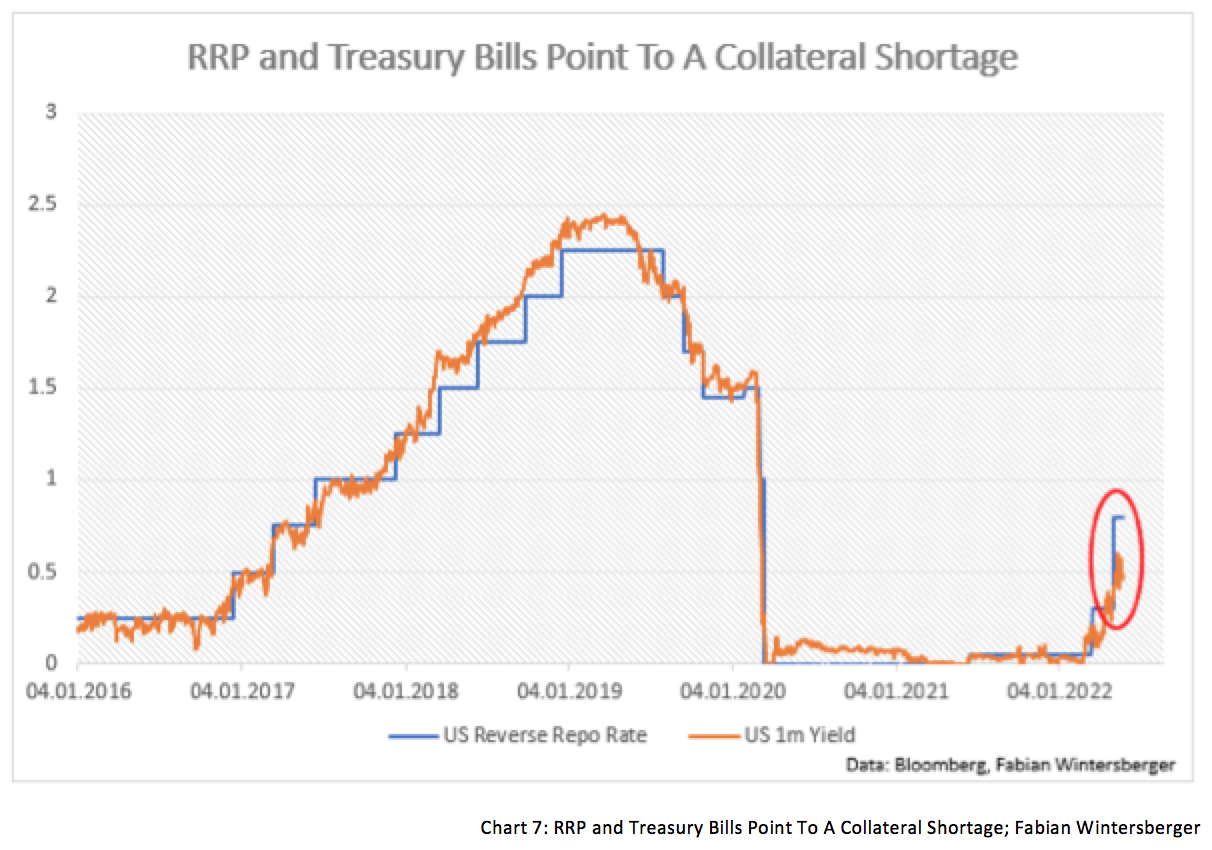
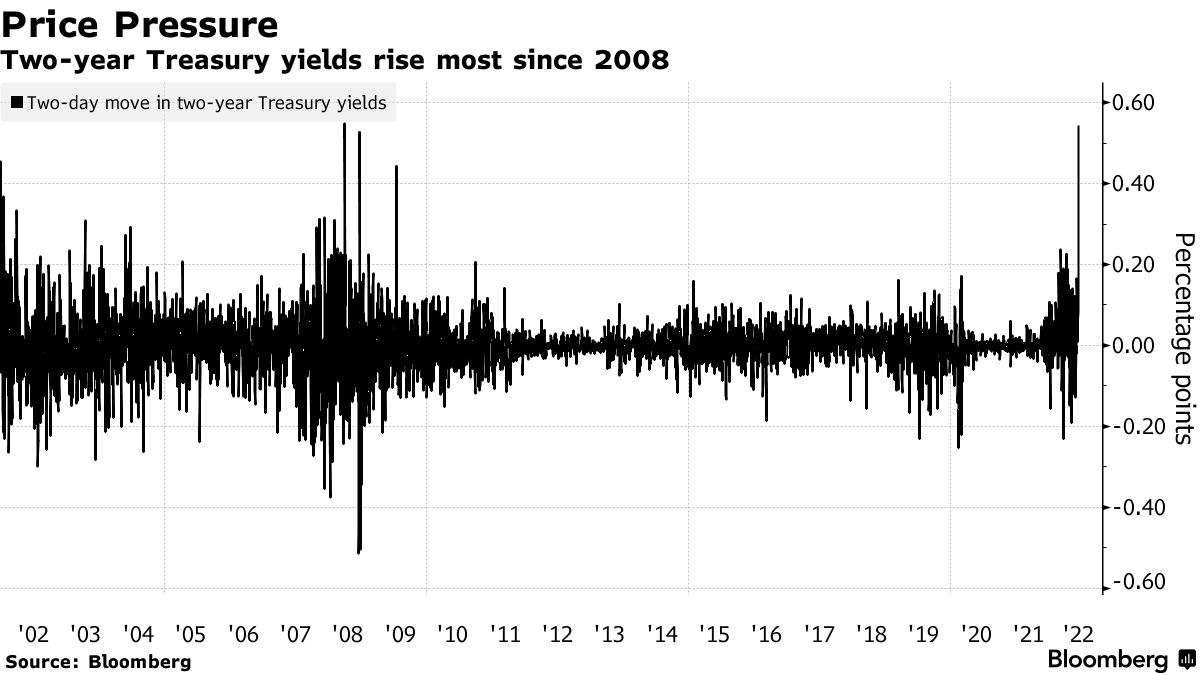
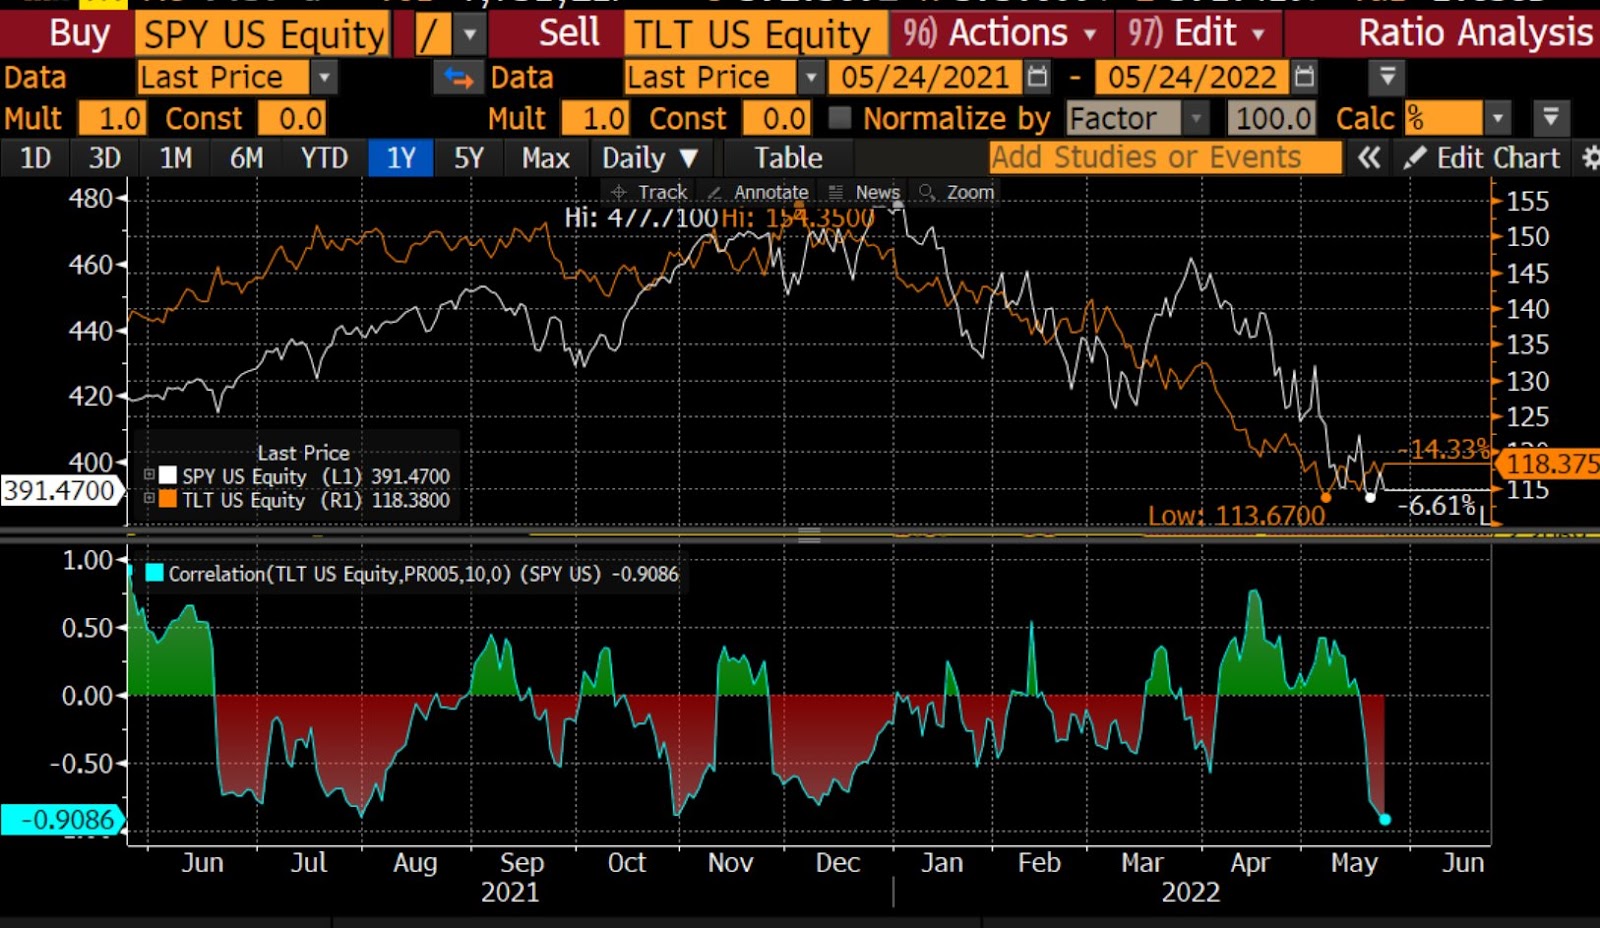
“Bonds are not acting as a hedge and appear to be becoming less ‘money’ like due persistent declines in price and elevated rate vol,” as Joseph Wang, who was a trader at the Fed, puts it.
Bank deposits are to drain about $1 trillion or so by year-end, prompting investors to “continue to lower their selling prices to compete for the cash they want.”
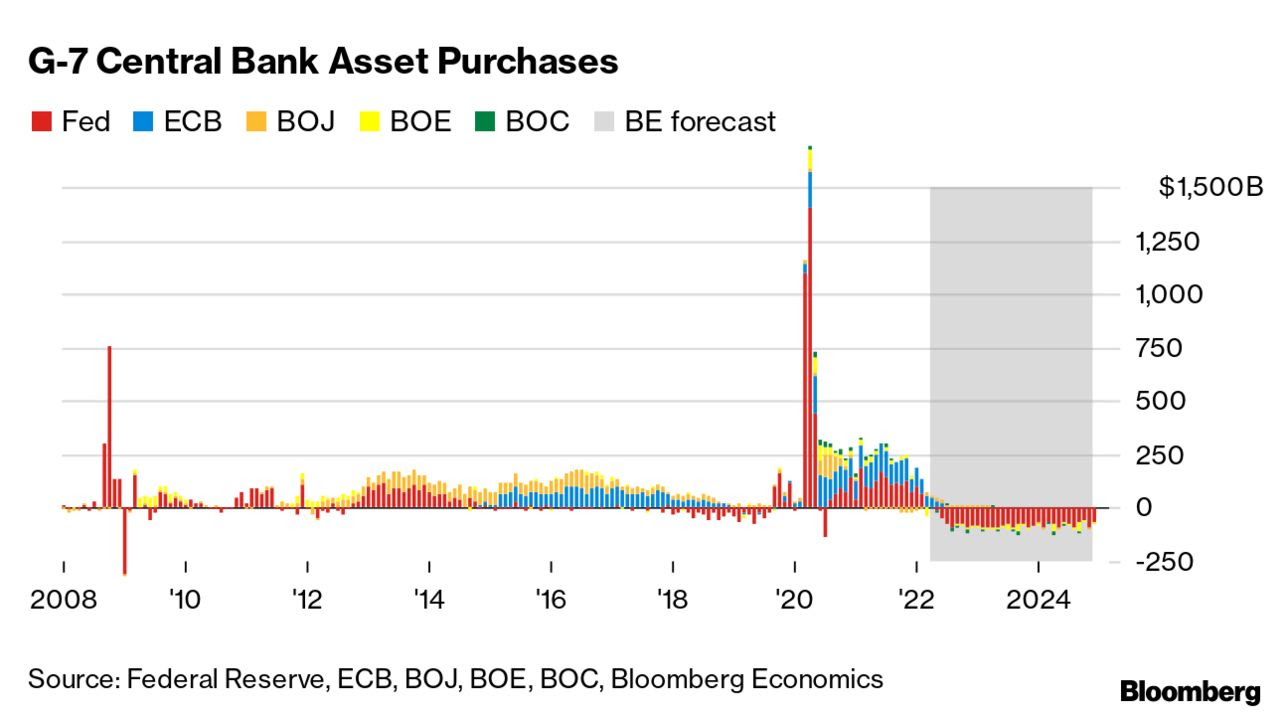
If it provides any solace, per comments by Credit Suisse Group AG’s (NYSE: CS) Zoltan Pozsar, the Fed, which “can only deal with nominal [and] not real chokepoints,” is likely to change course.
This is as “nominal balance sheet and liquidity trends will, at some point, clash with the realities of a garden variety of supply chain issues.”
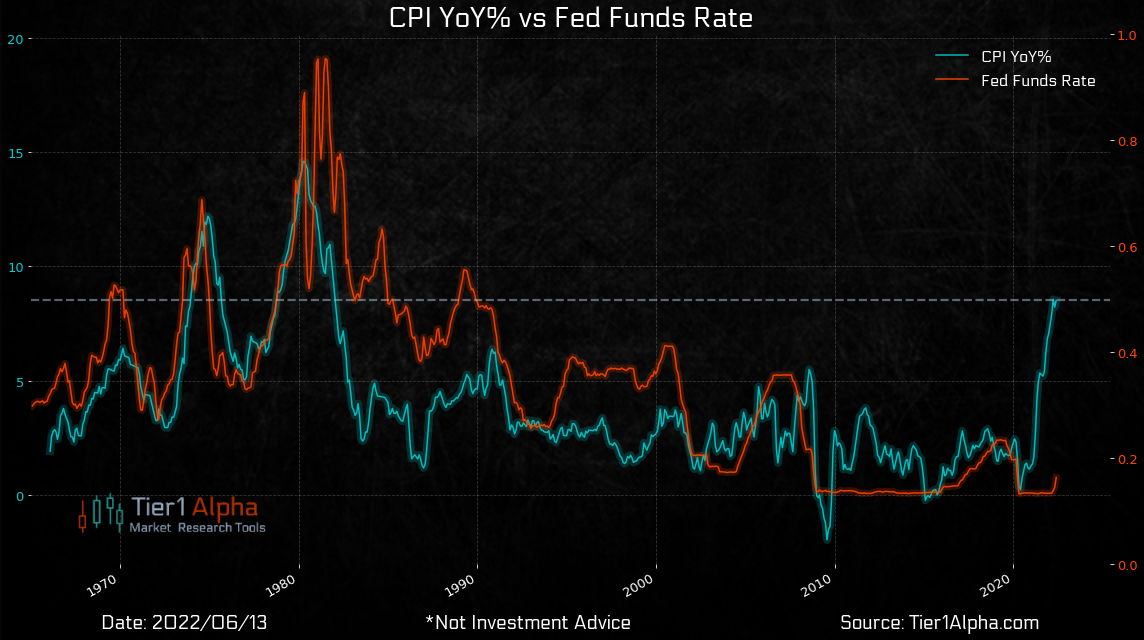
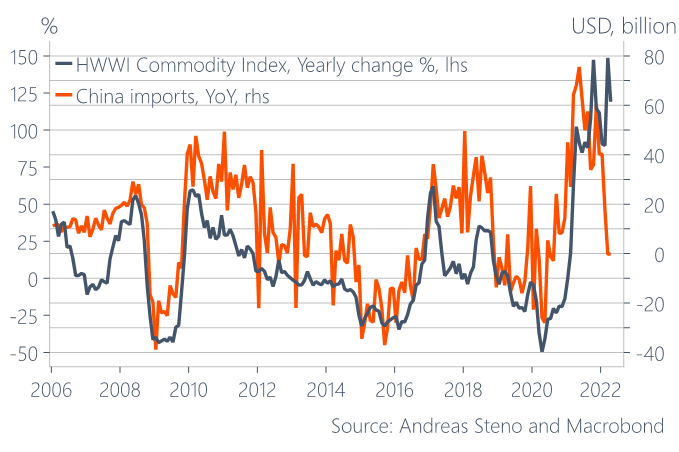
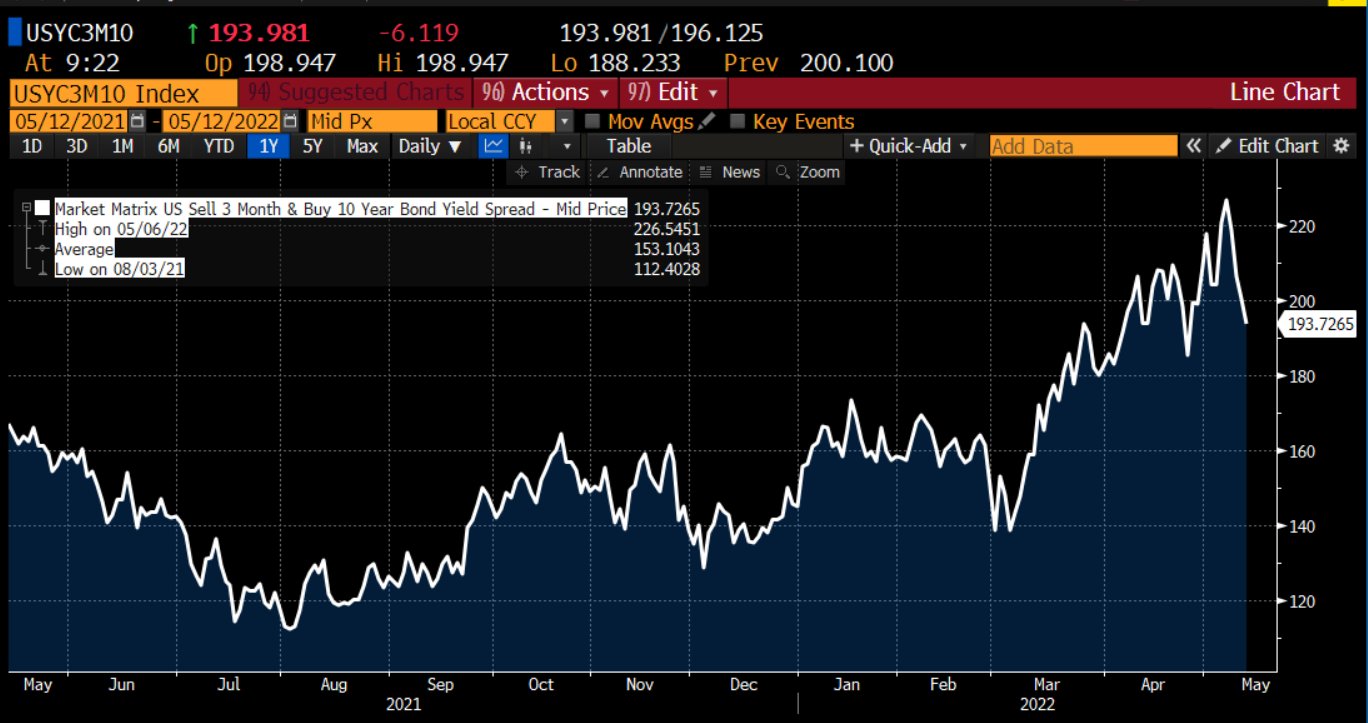
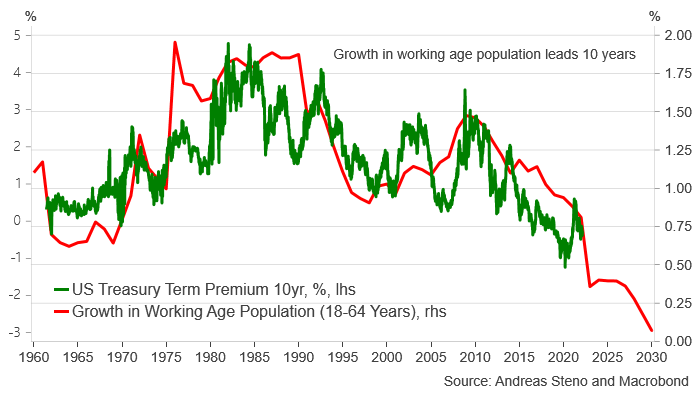
Likewise, Andreas Steno Larsen explains that bond yields remain governed by demographics, and this is good news for stocks, in general.
“Just look at the growth rate of the working-age population (10 years forward) versus the term premium of US Treasury bonds. The current bond bear market is not standing on structural pillars.”
Positioning: To preface, I encourage everyone to check out the Daily Brief for June 17, 2022.
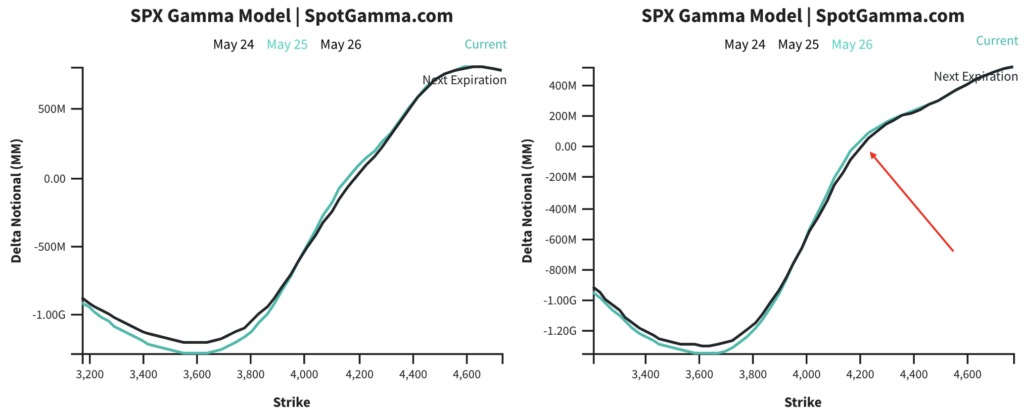
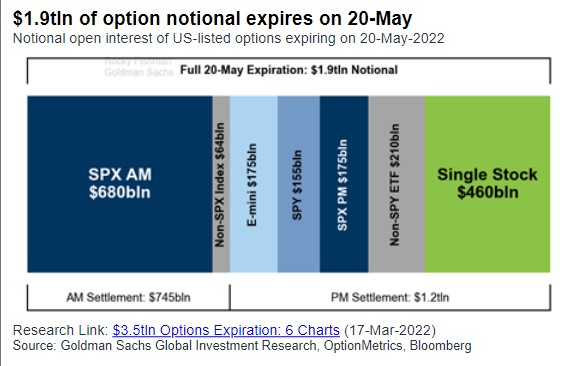
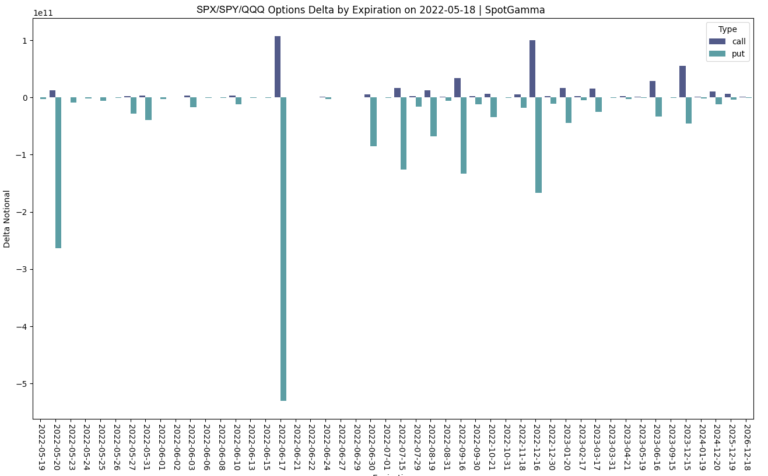
Moving on. So, last week, we had a large monthly options expiration (OPEX). After this, liquidity providers’ re-hedging flows supported the market.
Over the weekend, into Tuesday’s U.S. close, equities, then, traded higher. The rally, however, was not confidence-inspiring and was indicative of short-covering.
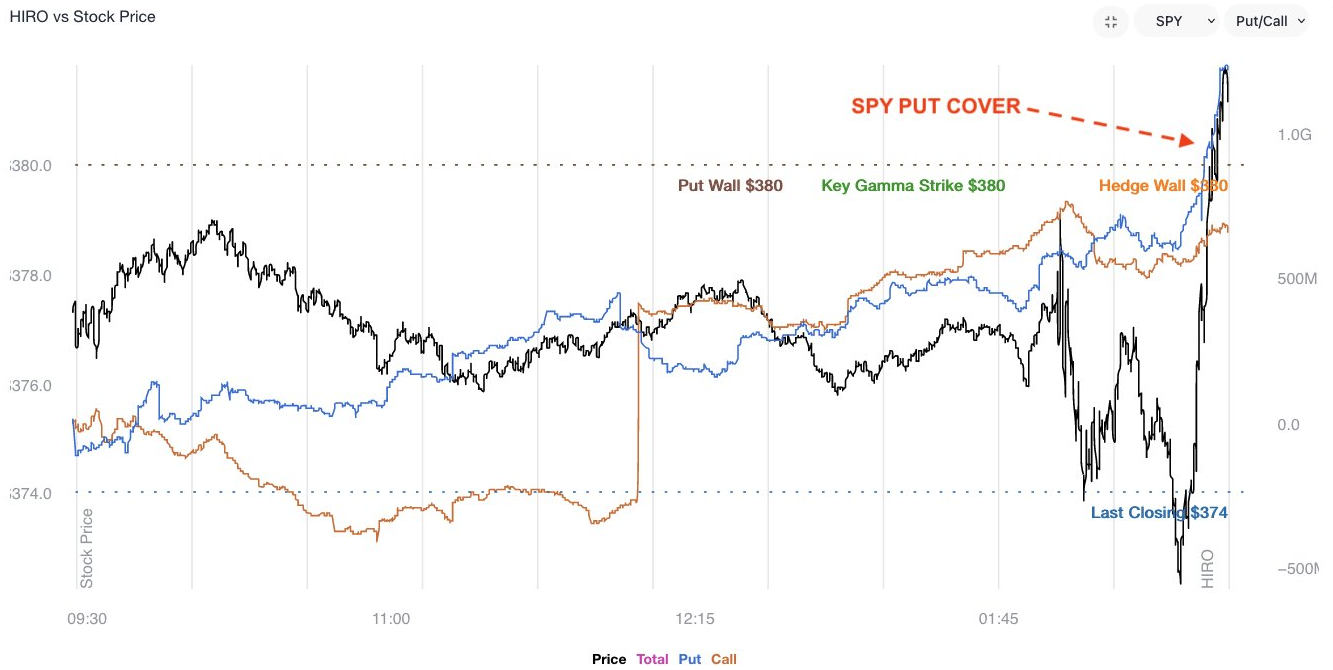
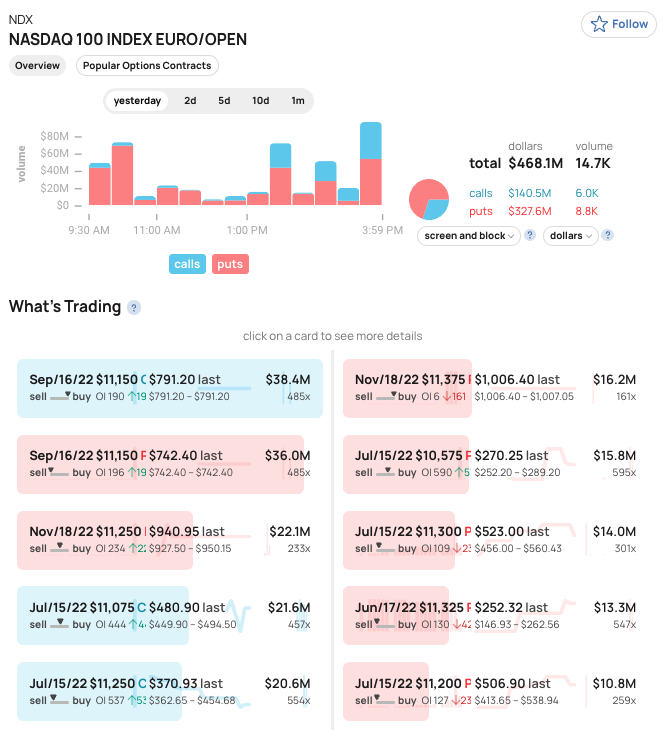
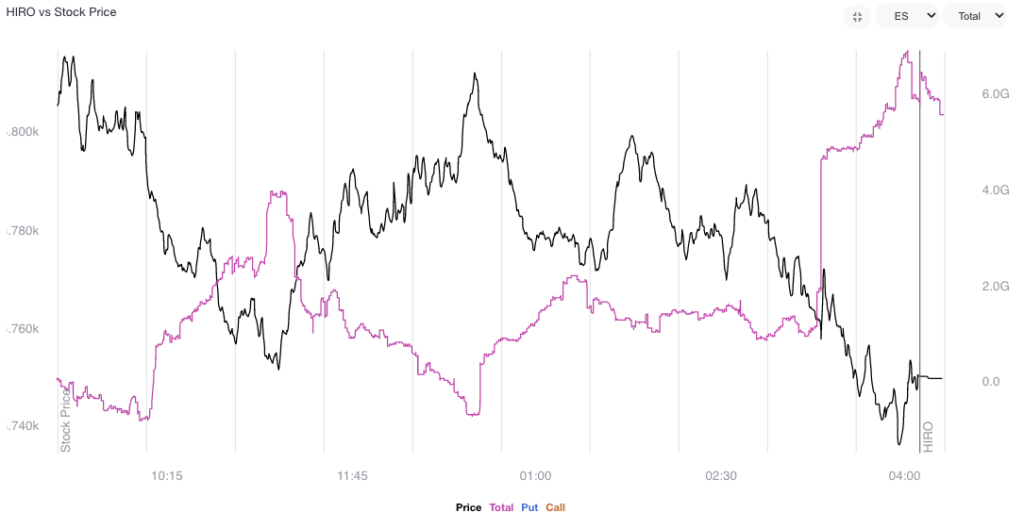
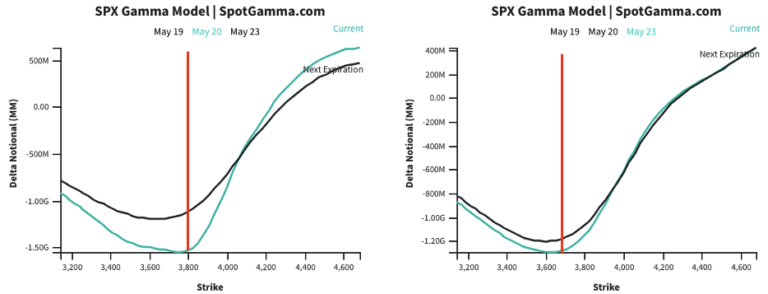
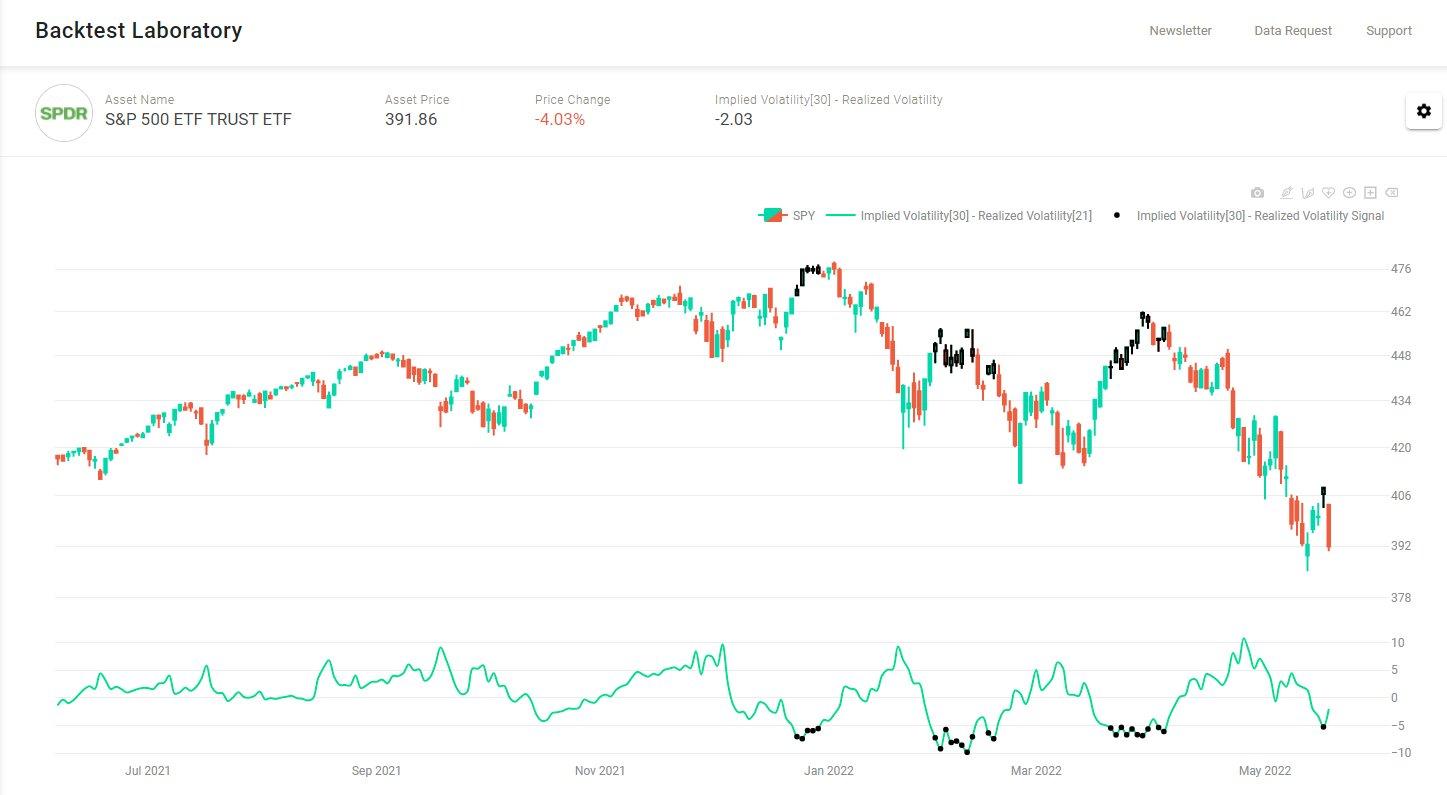
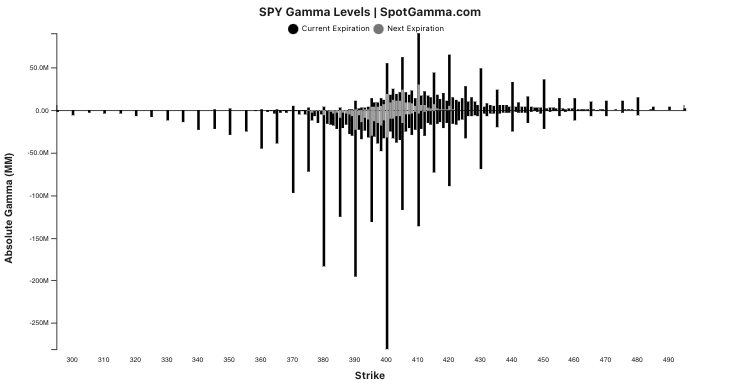
Per SpotGamma’s Hedging Impact of Real-Time Options (HIRO) indicator, participants took the relief rally “as an opportunity to hedge/sell,” as I wrote for SpotGamma, yesterday.
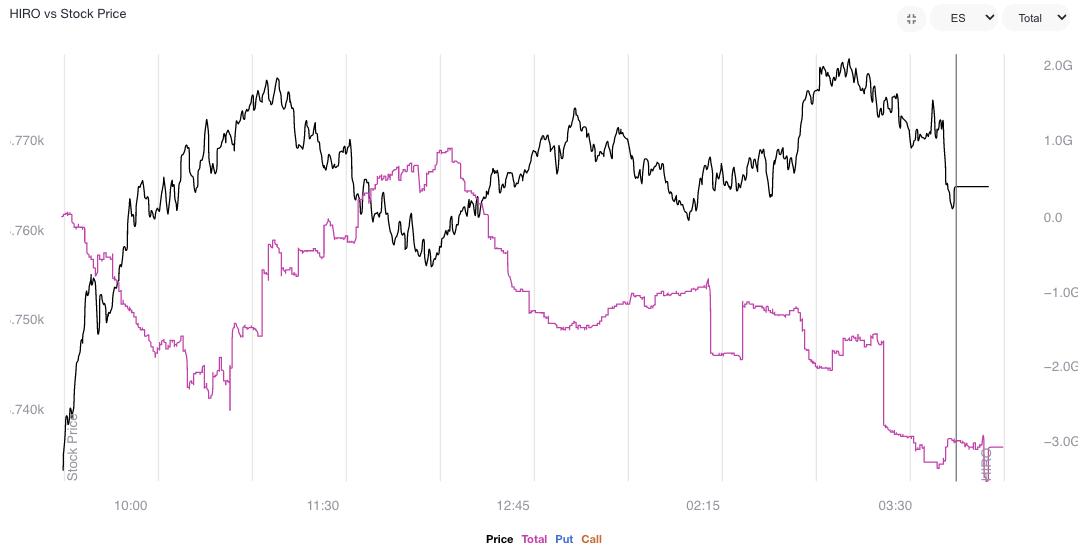
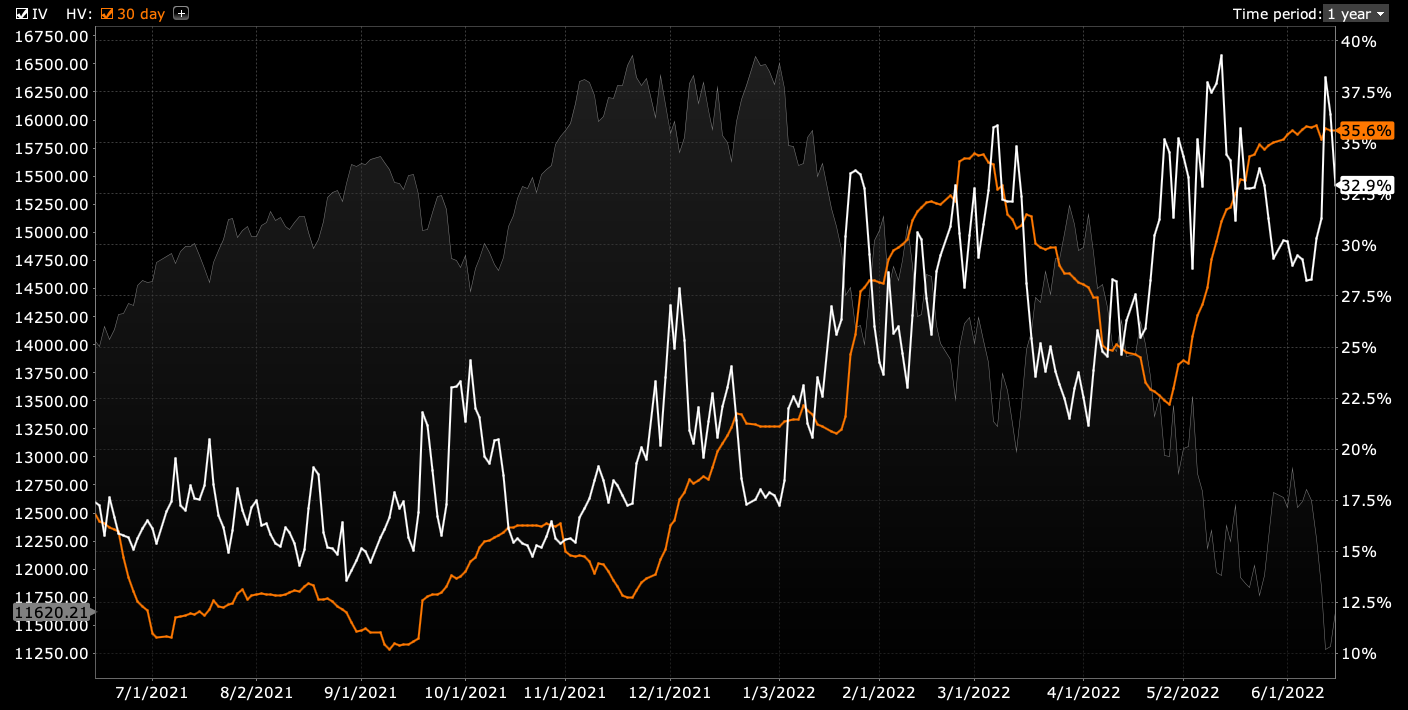
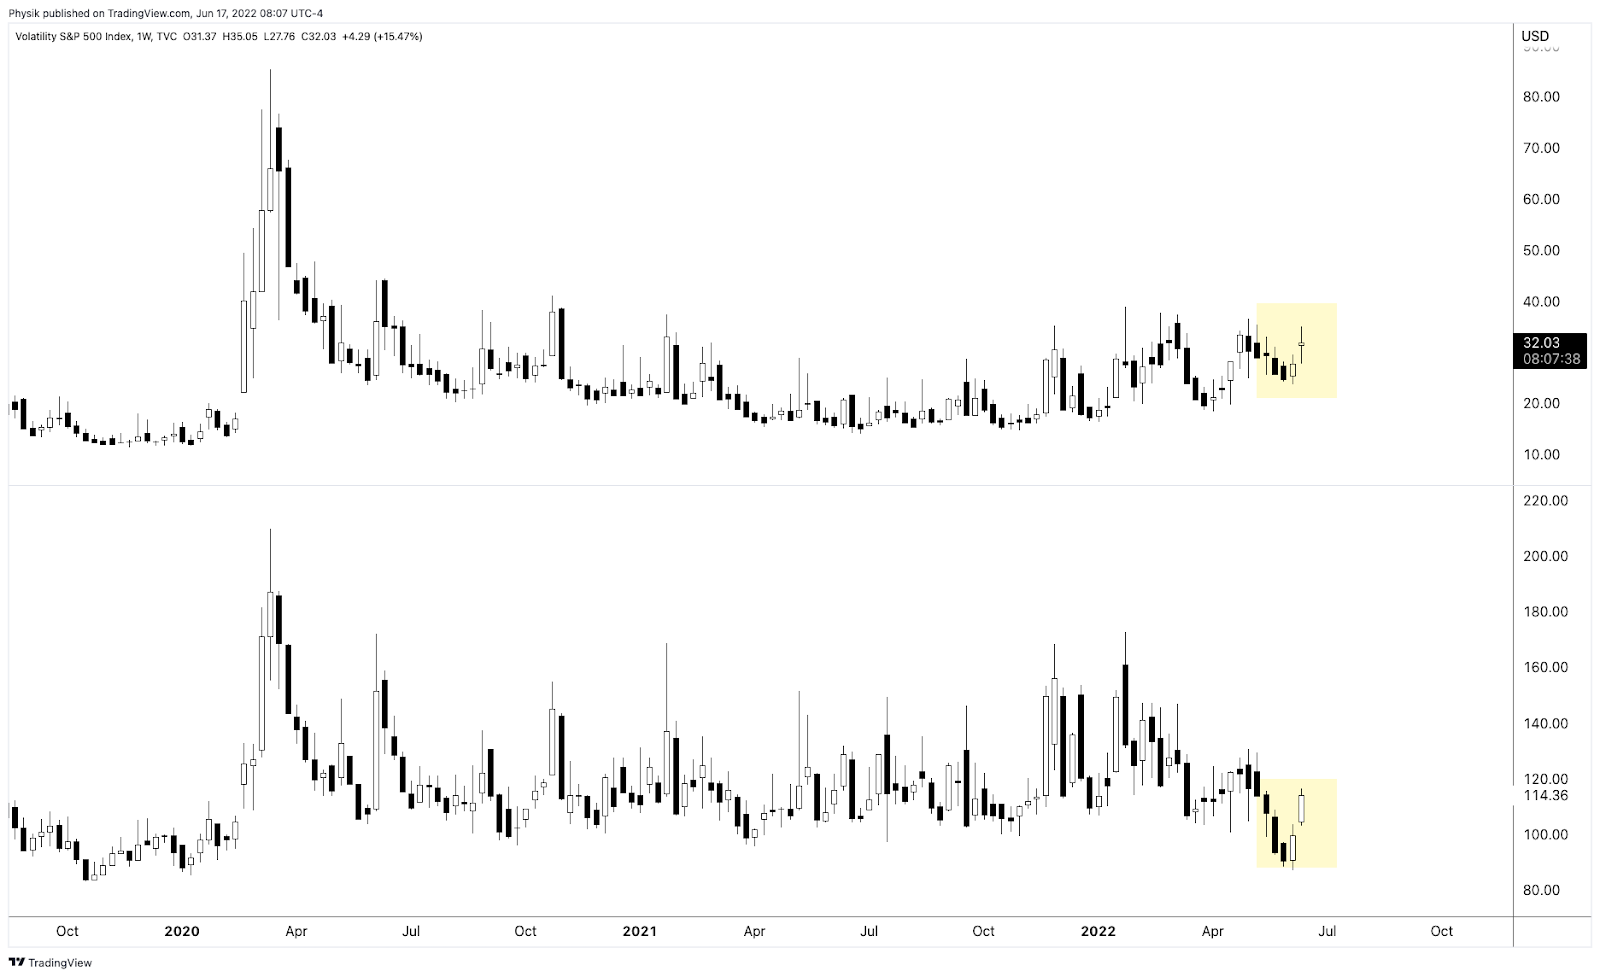
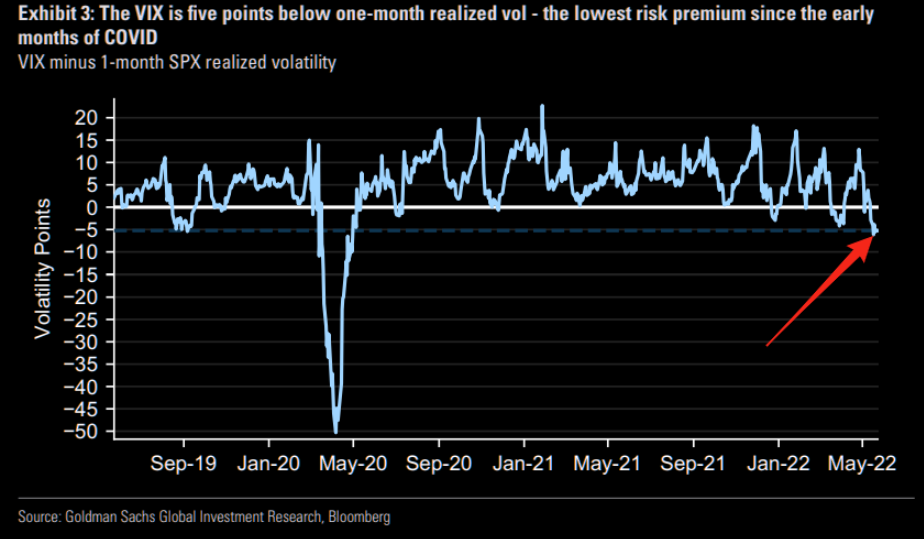
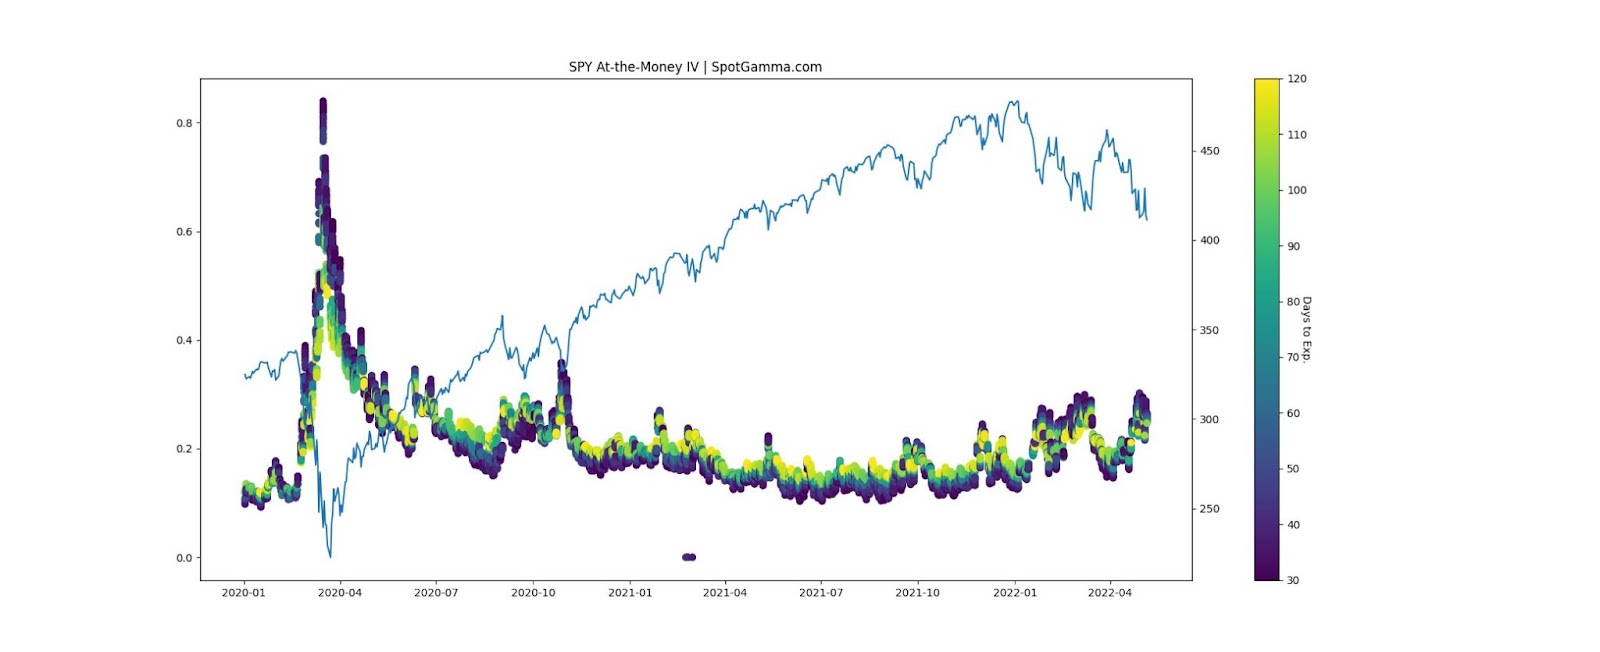
This ultimately showed up in broad measures of implied volatility. As The Ambrus Group’s Kris Sidial said: “[I]n the final hour, spot [and] vol up.”
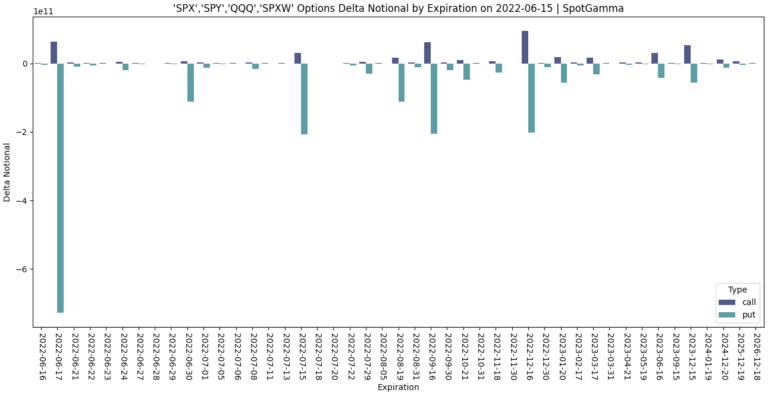
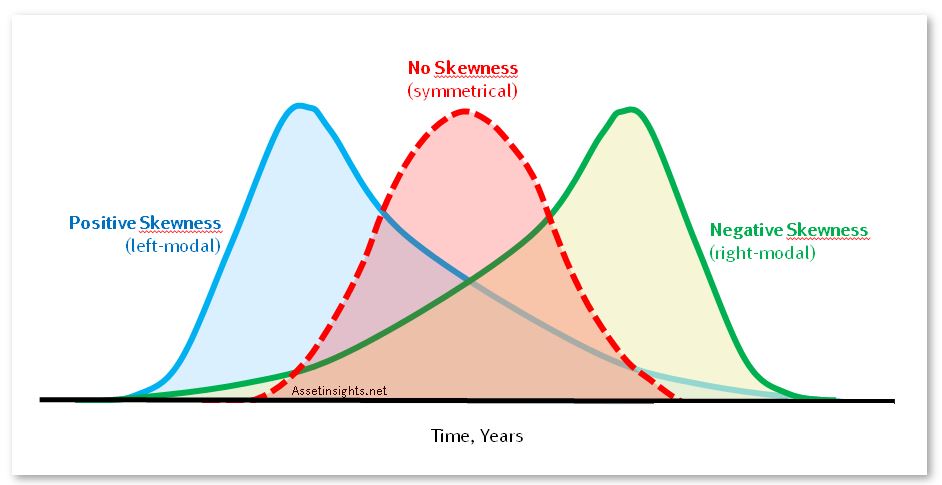
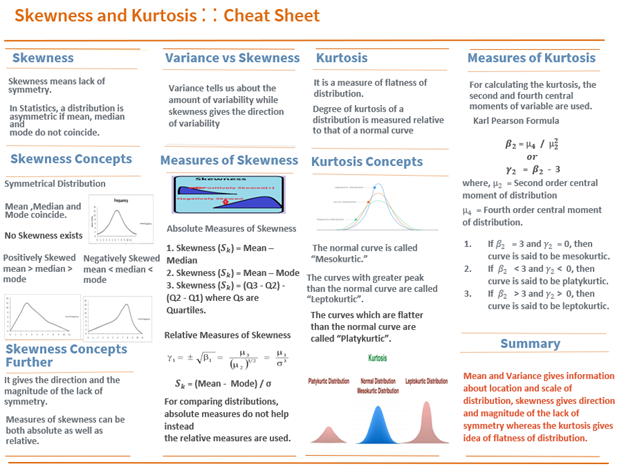
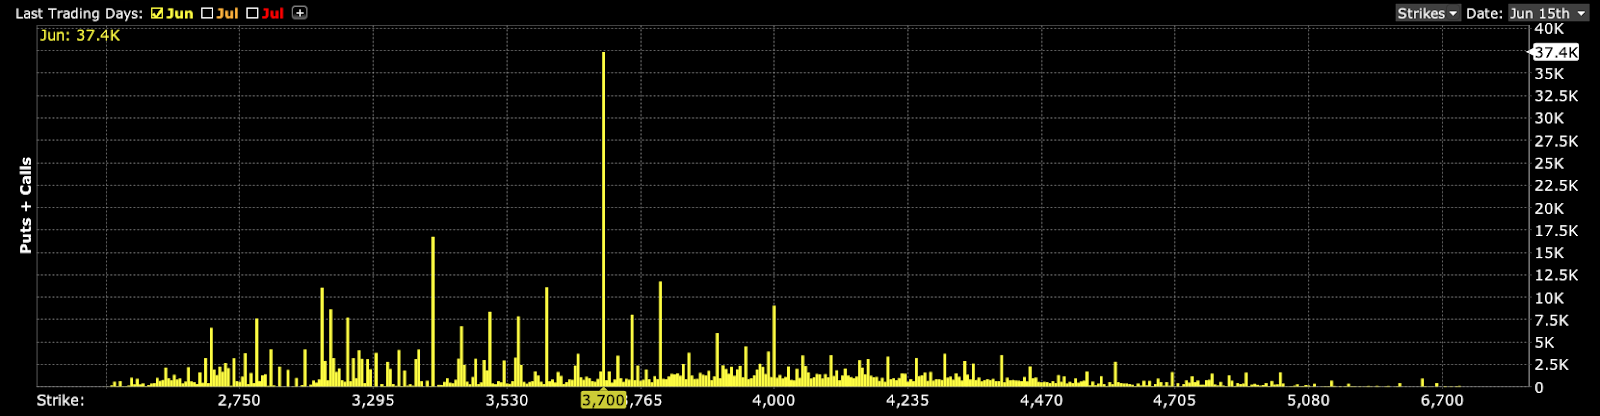
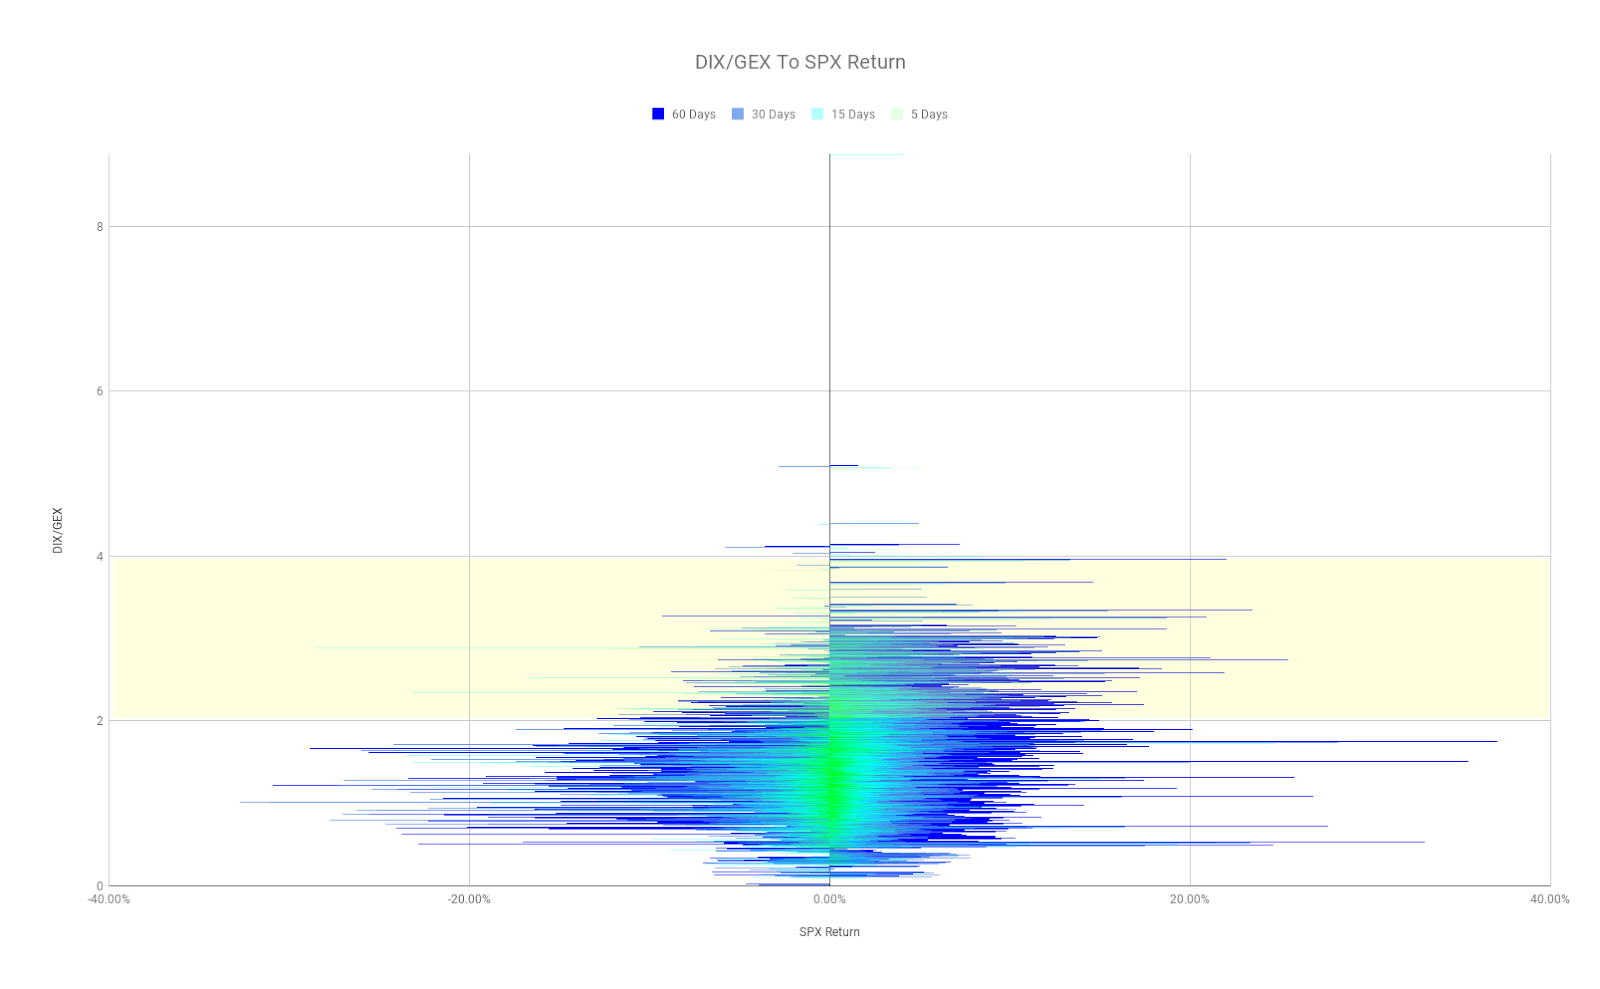
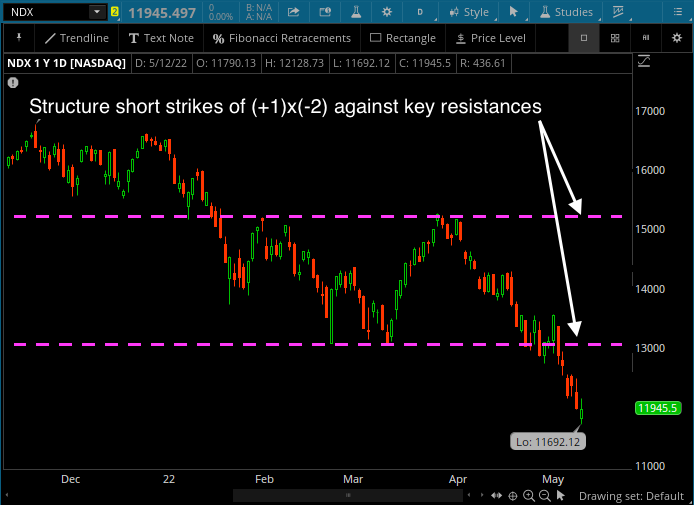
This plays into decreased odds for a far-reaching rally. Participants are positioned out in strikes that are lower and the activity in those strikes plays into a change in tone with respect to the non-linearity and strength of volatility and skew with respect to linear changes in asset prices.
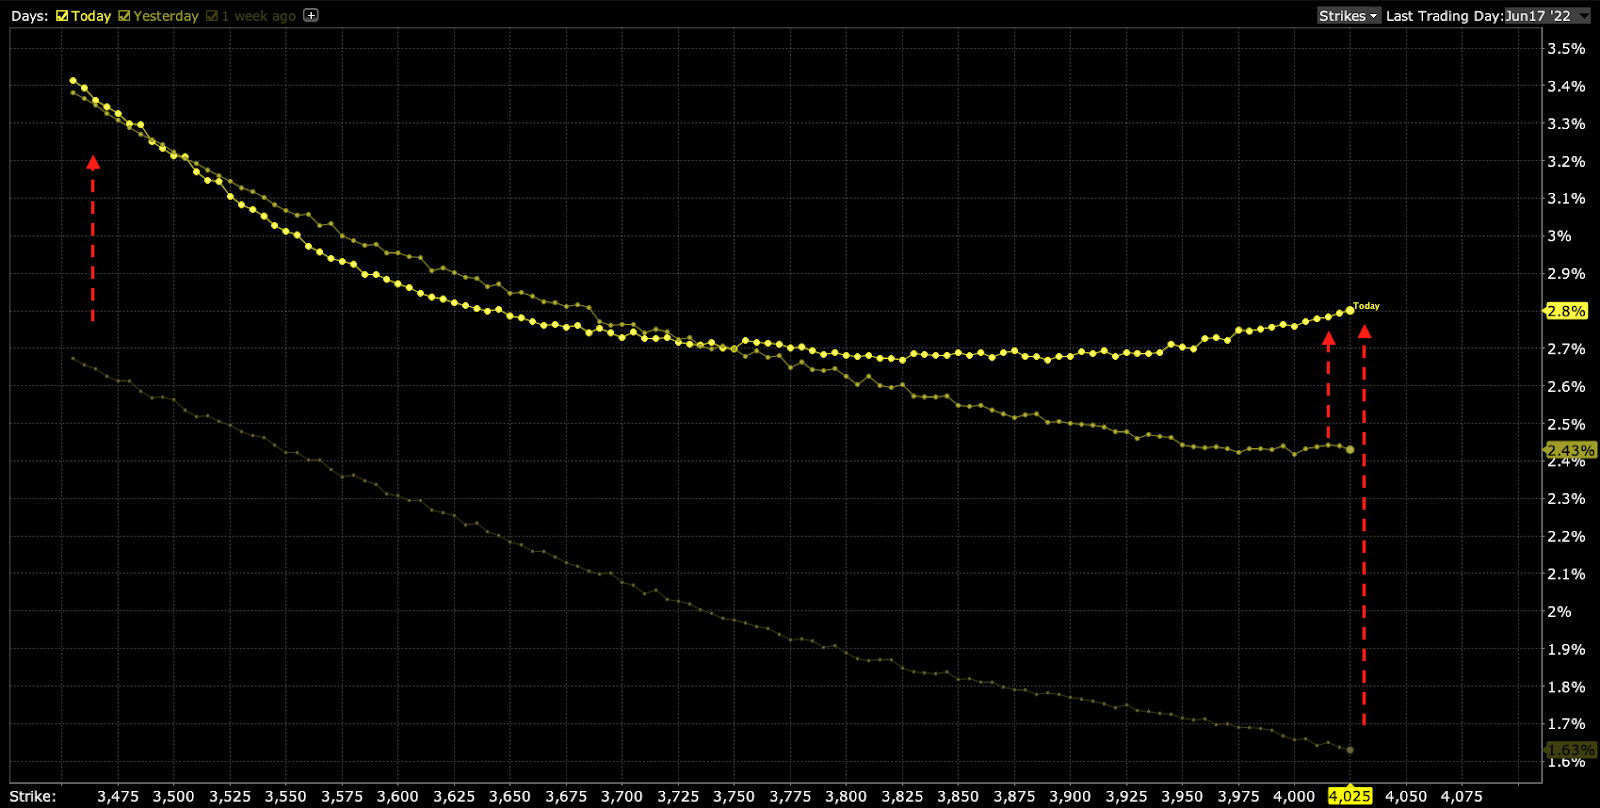
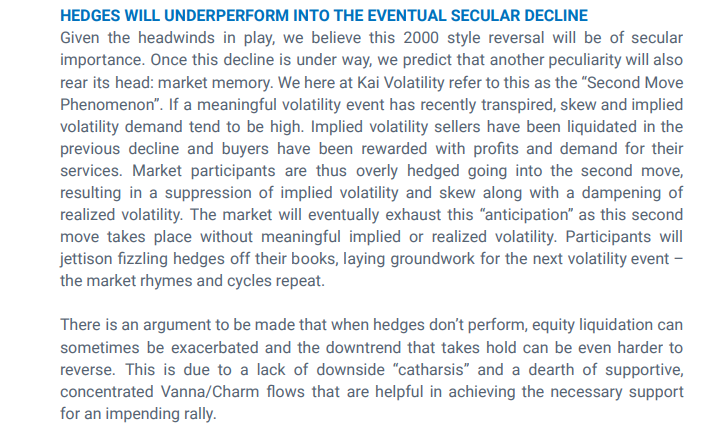
As Karsan spoke to, last week, the spikes in short-dated -sticky skew – the “first we’ve seen since [the] secular decline began” – hints at a “critical change in dealer positioning.”
“We’re transitioning to a fat left tail, right-based distribution,” Karsan adds.
So why does any of this matter?
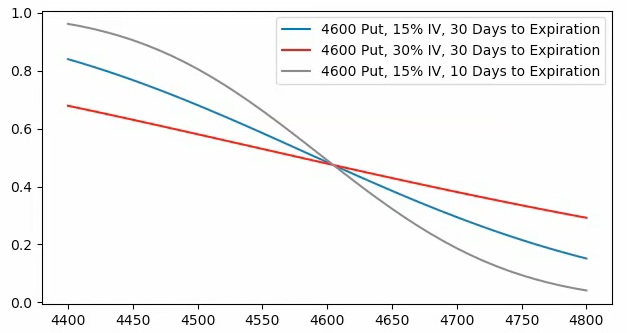
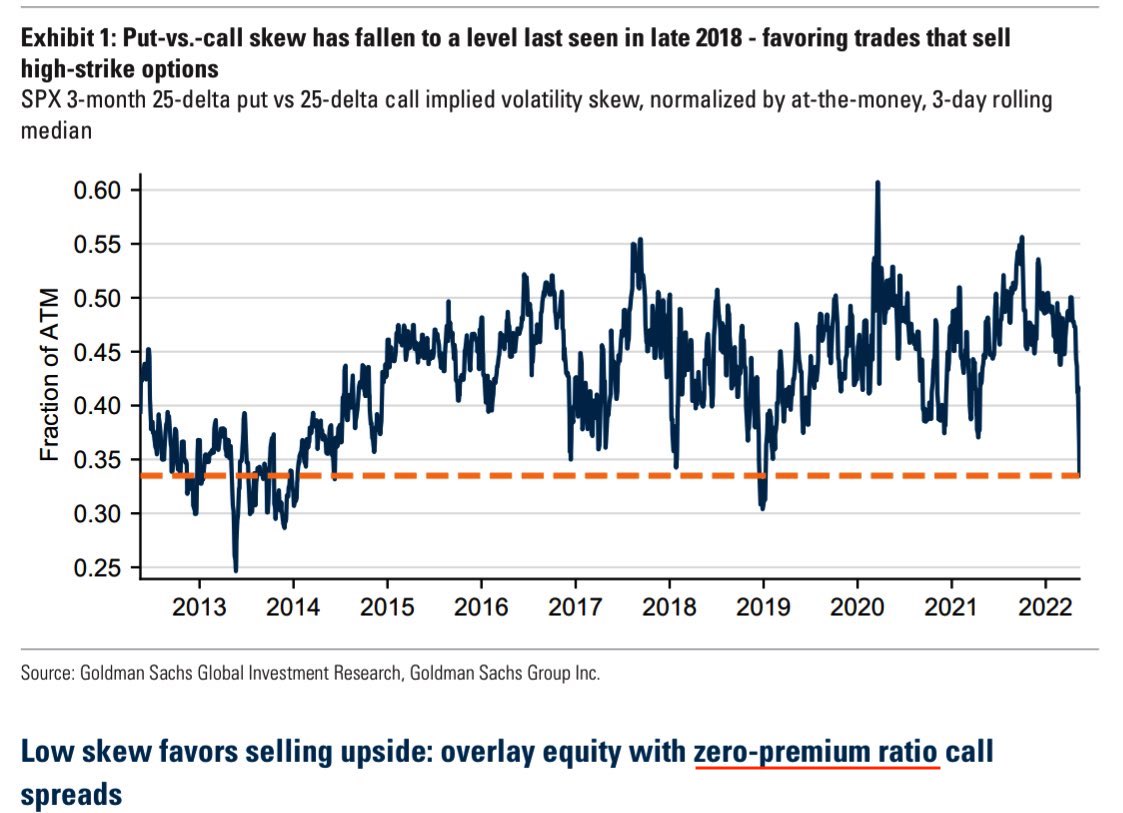
There still appears to be a heavy supply of options, particularly those with less time to maturity, and skew remains poor-performing (hence comments in prior letters on the benefit of buying into implied skew convexity should volatility reprice).
Basically, participants are hedged and volatility remains well-supplied.
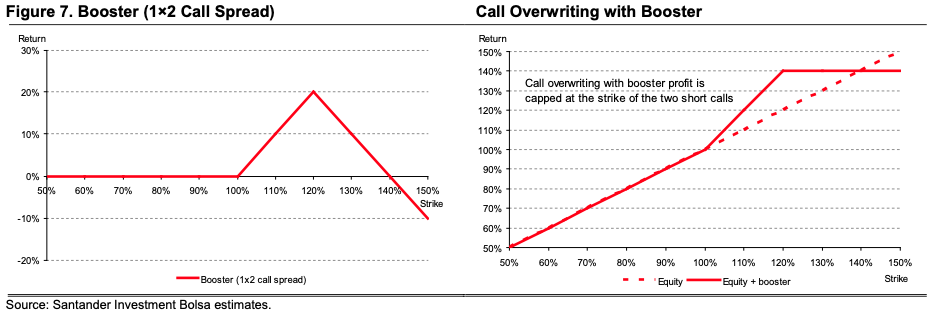
If there was to be forced selling or demand for protection by a greater share of the market in ways not recently seen, then the repricing of the aforementioned structures would be a boon for those who own them.

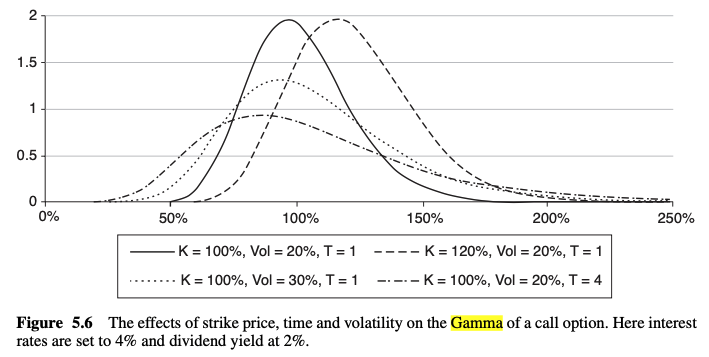
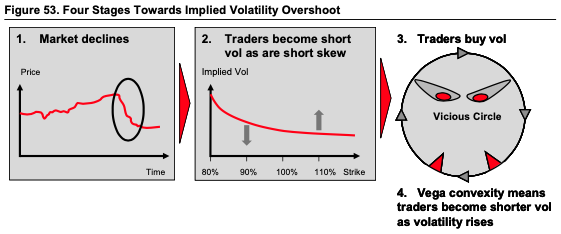
Options have a “non-zero second-order price sensitivity (or convexity) to a change in volatility,” as Mohamed Bouzoubaa et al explain well in the book Exotic Options and Hybrids.
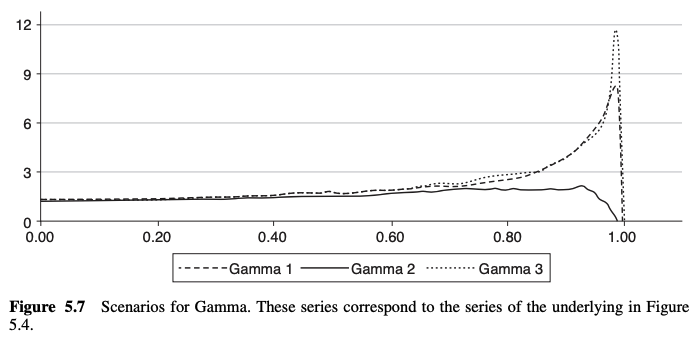
“ATM vanillas are [not] convex in the underlying’s price, … but OTM vanillas do have vega convexity … [so], when the holder of an option is long vega convexity, we say she is long vol-of-vol.”
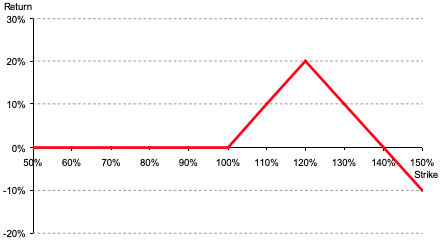
In other words, by owning that protection – e.g., butterfly and back spreads – you are positioned to monetize on a continued non-linear repricing of volatility. The difficult part is cutting the decay of those spreads when nothing happens.
Read: Trading Volatility, Correlation, Term Structure and Skew by Colin Bennett et al. Originally sourced via Academia.edu.
As an aside, despite the bearish tilt in positioning, there has been a notable uptick in index call buying per UBS Group AG (NYSE: UBS), presumably so that participants don’t miss out on a vicious reversal, should one transpire.
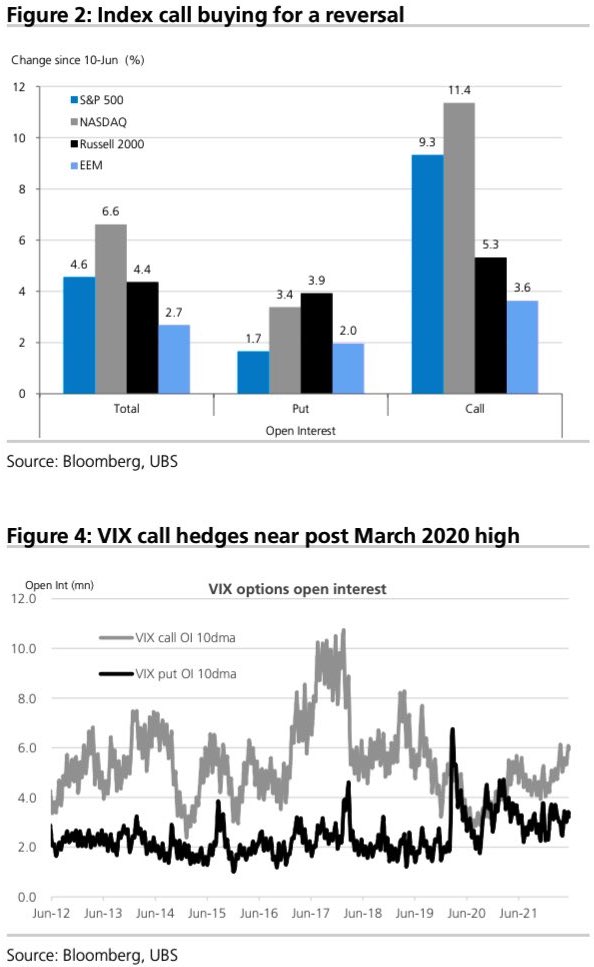
Adding, the “high starting point” in IVOL makes it possible to put on zero- and low-cost bets that deliver asymmetric payouts in case of violent and short-lived reversals.
Read: Daily Brief for May 13, 2022.

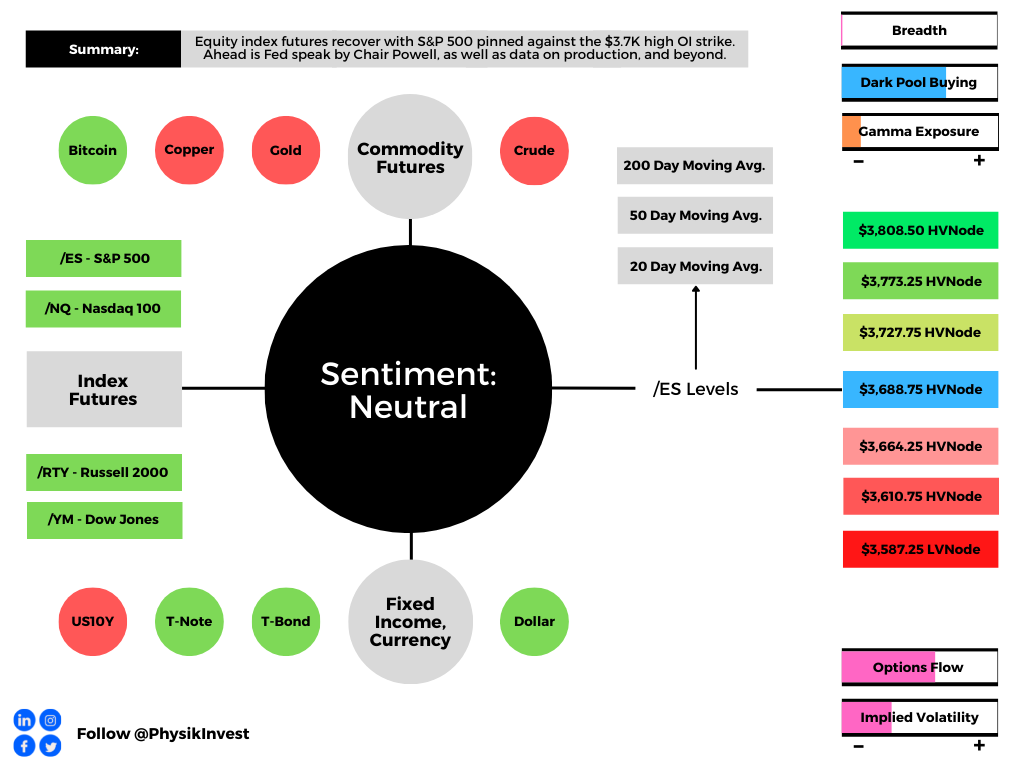
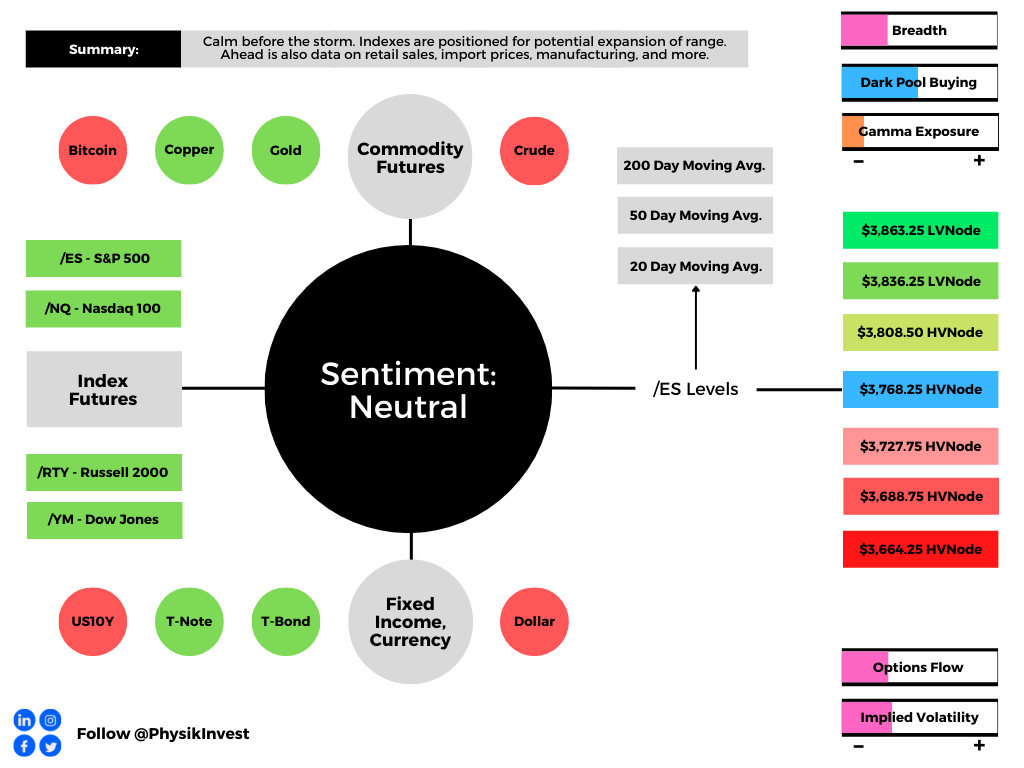
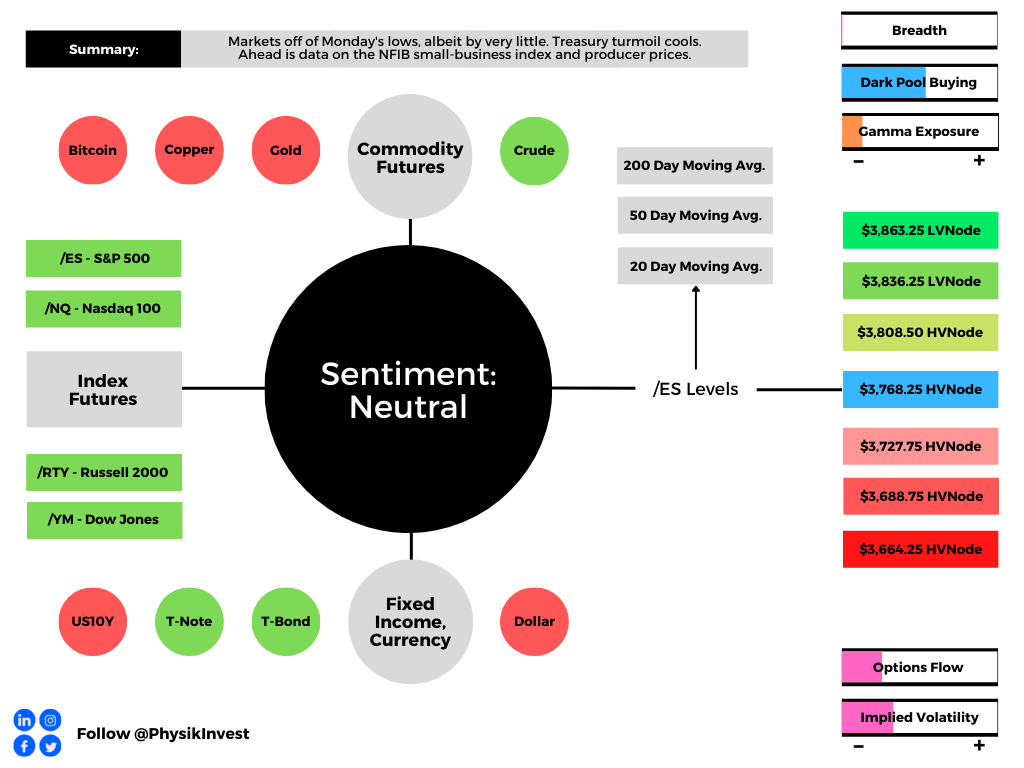
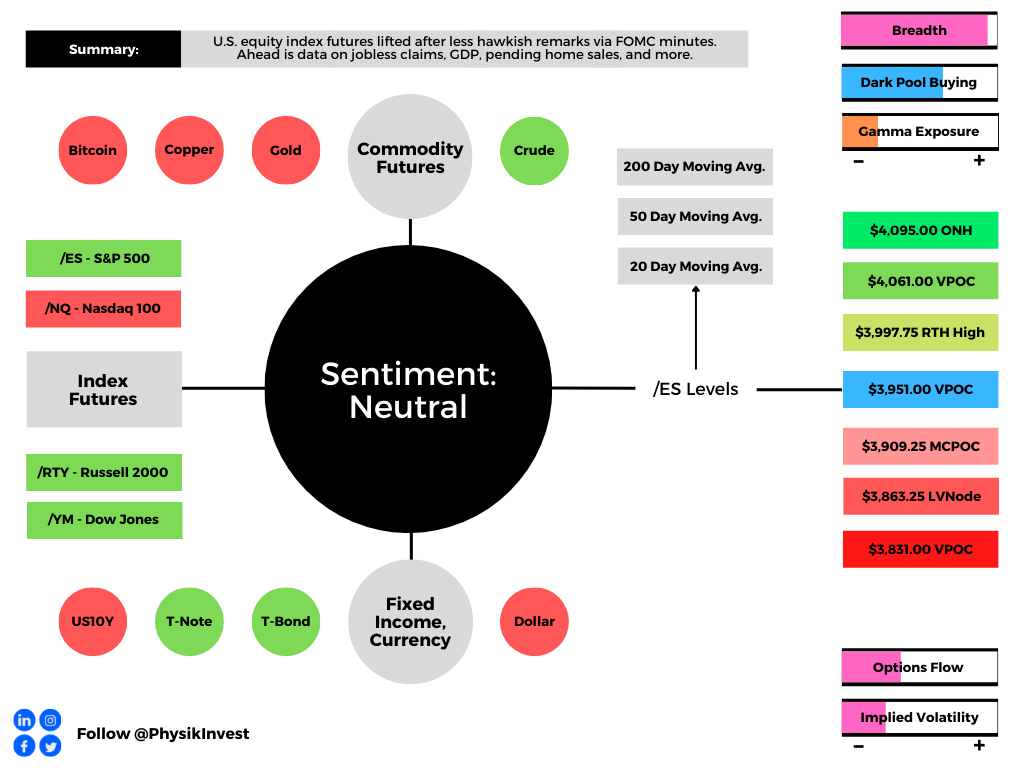
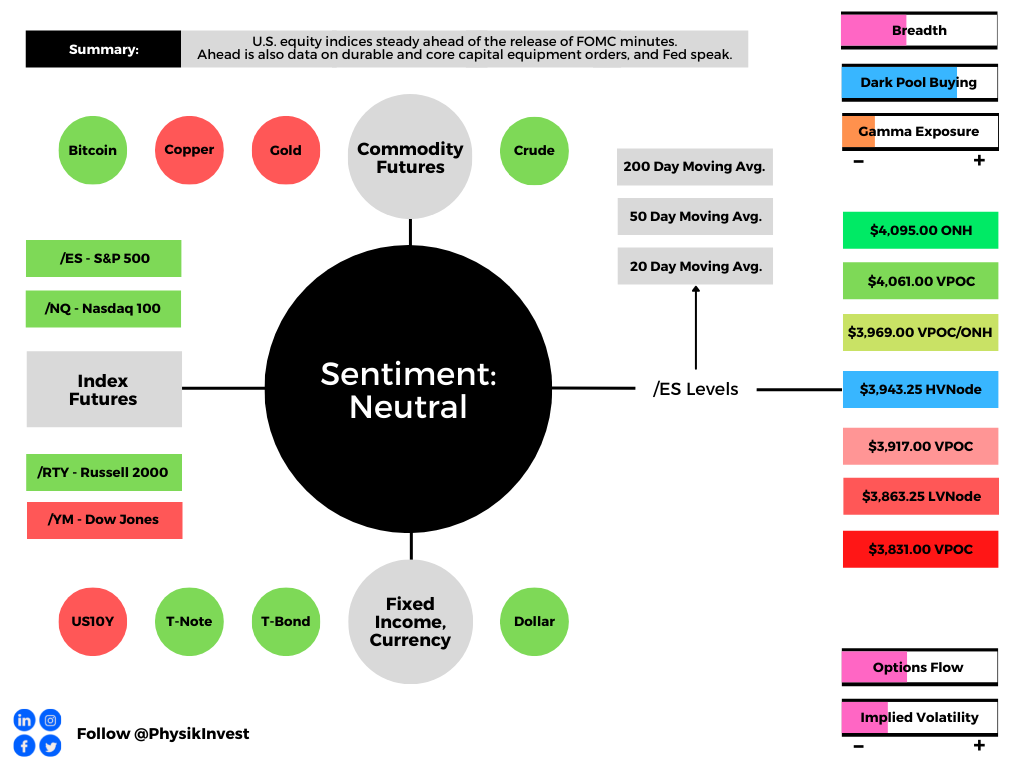
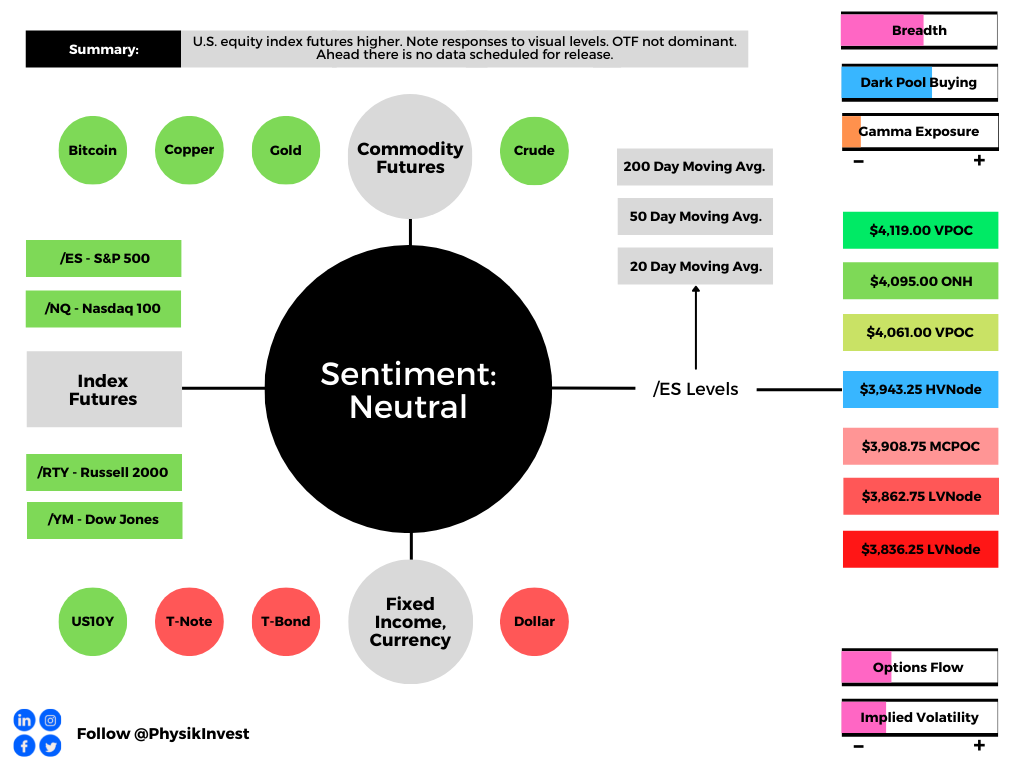
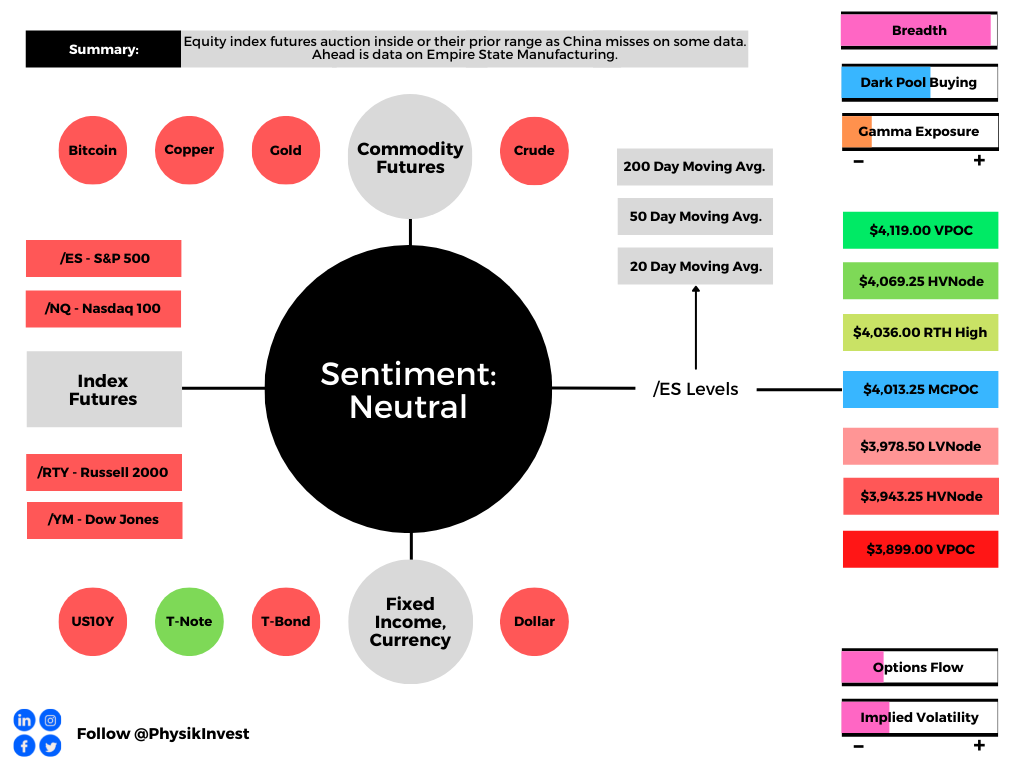
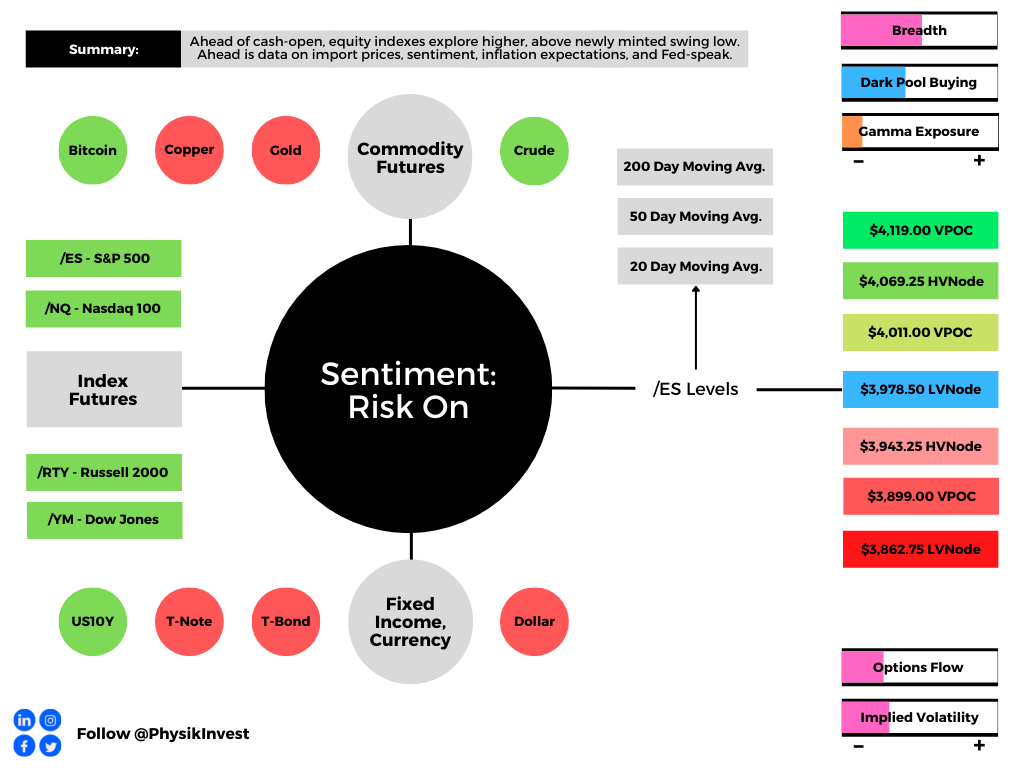
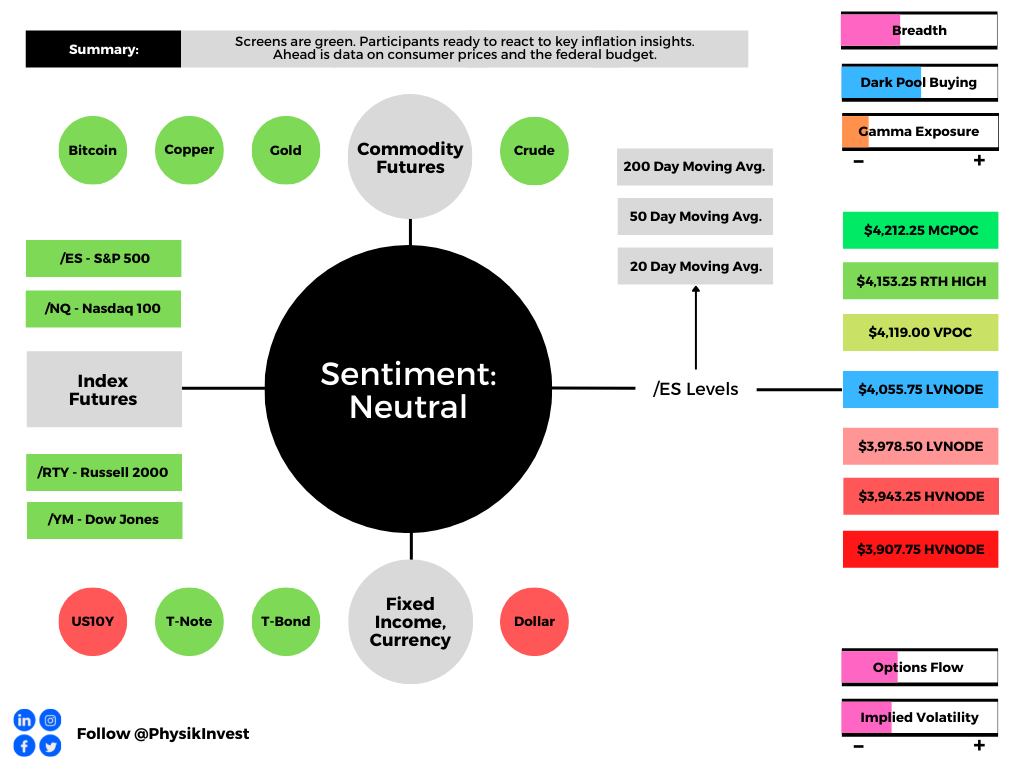
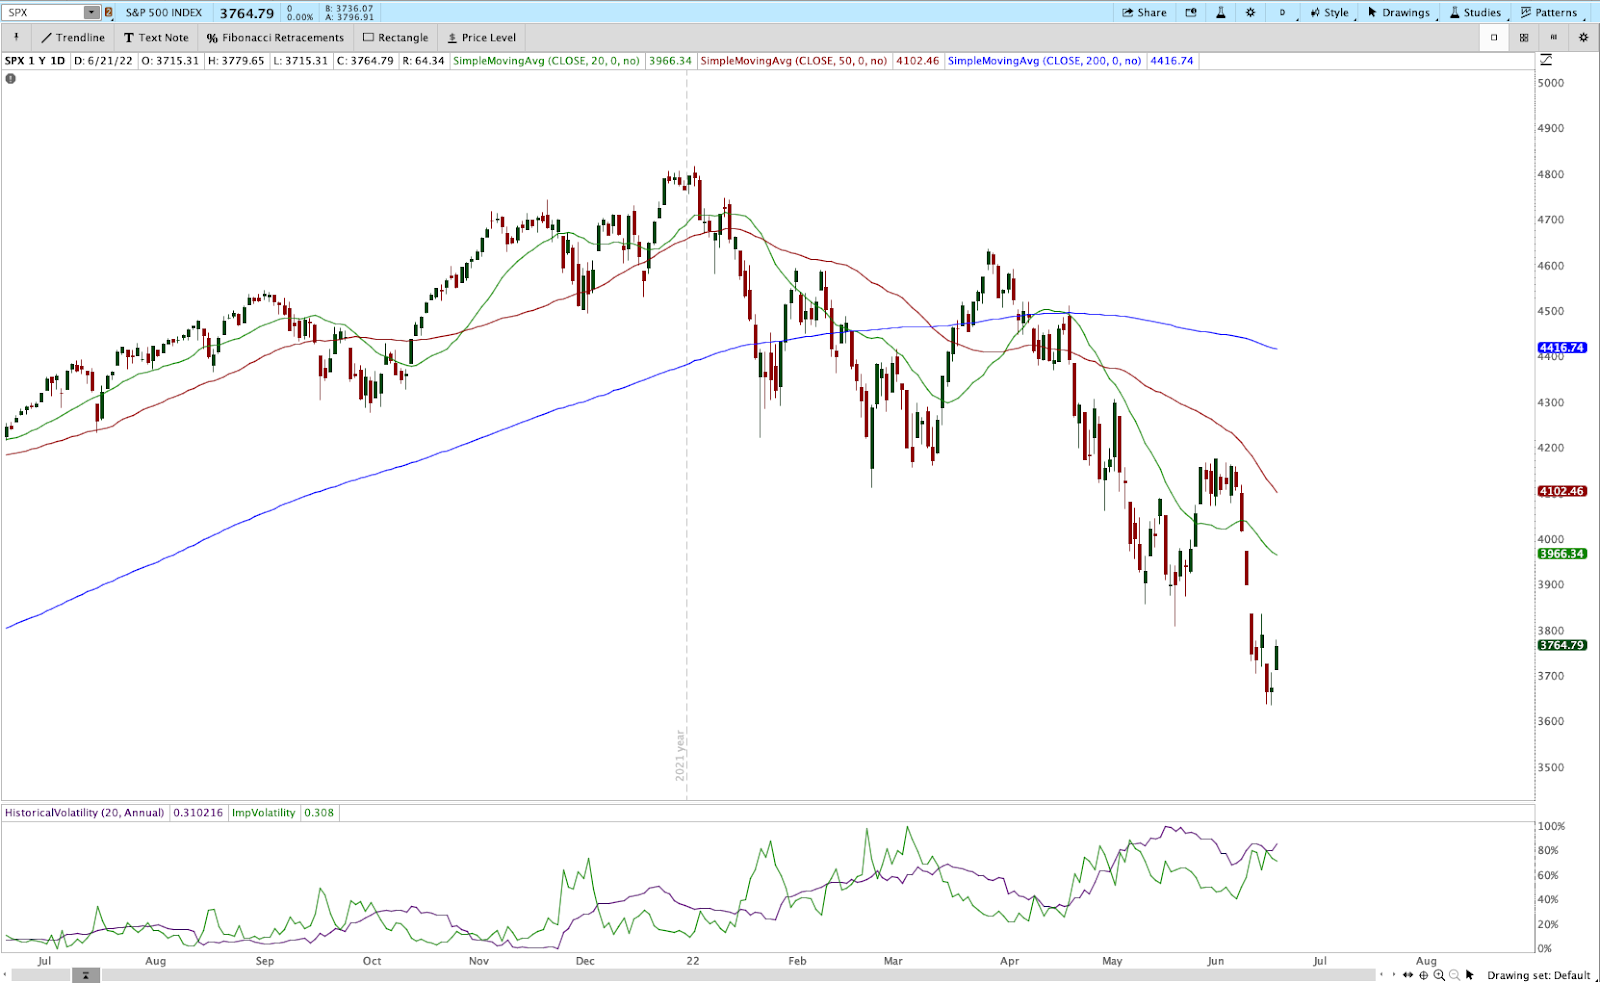
Technical: As of 6:30 AM ET, Wednesday’s regular session (9:30 AM – 4:00 PM ET), in the S&P 500, will likely open in the lower part of a negatively skewed overnight inventory, inside of prior-range and -value, suggesting a limited potential for immediate directional opportunity.
In the best case, the S&P 500 trades higher; activity above the $3,696.00 low volume area (LVNode) puts in play the $3,722.50 LVNode. Initiative trade beyond the LVNodes could reach as high as the $3,735.75 and $3,770.75 high volume areas (HVNodes), or higher.
In the worst case, the S&P 500 trades lower; activity below the $3,696.00 LVNode puts in play the $3,675.25 HVNode. Initiative trade beyond the HVNode could reach as low as the $3,639.00 RTH Low and $3,610.75 HVNode, or lower.
Click here to load today’s key levels into the web-based TradingView charting platform. Note that all levels are derived using the 65-minute timeframe. New links are produced, daily.

Considerations: Gap scenarios are in play, today.
Gaps ought to fill quickly. Should they not, that’s a signal of strength; do not fade. Leaving value behind on a gap-fill or failing to fill a gap (i.e., remaining outside of the prior session’s range) is a go-with indicator.
Auctioning and spending at least 1-hour of trade back in the prior range suggests a lack of conviction; in such a case, do not follow the direction of the most recent initiative activity.
Definitions
A structurally sound market will build on areas of high volume (HVNodes). Should the market trend for long periods of time, it will lack sound structure, identified as low volume areas (LVNodes). LVNodes denote directional conviction and ought to offer support on any test.
If participants were to auction and find acceptance into areas of prior low volume (LVNodes), then future discovery ought to be volatile and quick as participants look to HVNodes for favorable entry or exit.
About
After years of self-education, strategy development, mentorship, and trial-and-error, Renato Leonard Capelj began trading full-time and founded Physik Invest to detail his methods, research, and performance in the markets.
Capelj also develops insights around impactful options market dynamics at SpotGamma and is a Benzinga reporter.
Some of his works include conversations with ARK Invest’s Catherine Wood, investors Kevin O’Leary and John Chambers, FTX’s Sam Bankman-Fried, Kai Volatility’s Cem Karsan, The Ambrus Group’s Kris Sidial, among many others.
Disclaimer
In no way should the materials herein be construed as advice. Derivatives carry a substantial risk of loss. All content is for informational purposes only.