Categories
Commentary

Daily Brief For March 15, 2022

Editor’s Note: The Daily Brief is a free glimpse into the prevailing fundamental and technical drivers of U.S. equity market products. Join the 200+ that read this report daily, below!

What Happened

Overnight, equity index futures explored lower prices alongside most commodities. Bonds and implied volatility metrics were bid, also.

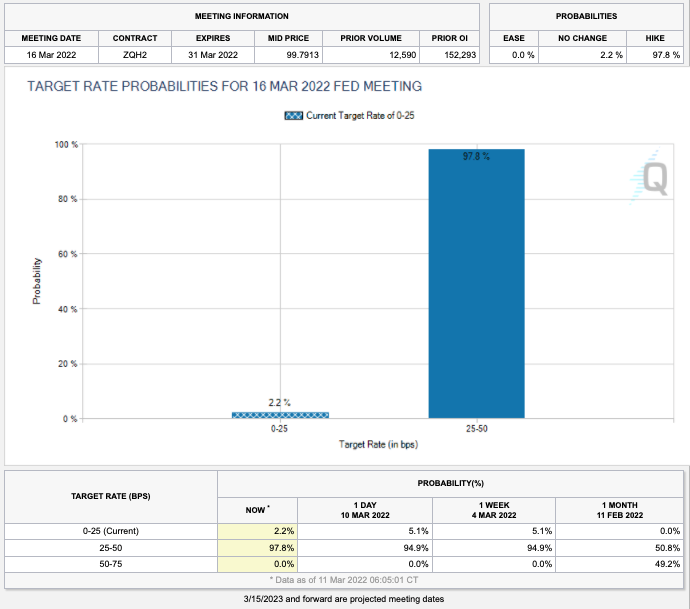
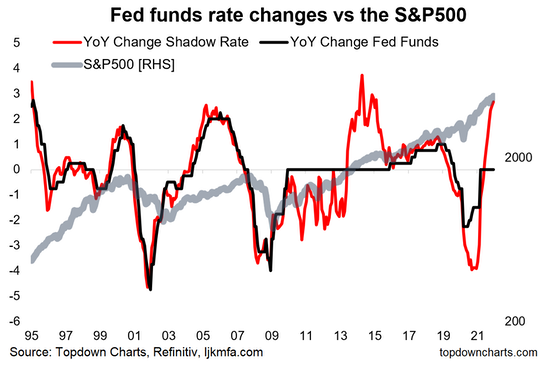
The narrative is that this is follow-on selling as participants look to price in the implications of COVID-19 lockdowns in China, as well as the Russia-Ukraine conflict. Arguably, there is some pre-Federal Open Market Committee (FOMC) positioning going on, too.

Ahead is data on the Producer Price Index and Empire State Manufacturing (8:30 AM ET).

Graphic updated 6:15 AM ET. Sentiment Neutral if expected /ES open is inside of the prior day’s range. /ES levels are derived from the profile graphic at the bottom of the following section. Levels may have changed since initially quoted; click here for the latest levels. SqueezeMetrics Dark Pool Index (DIX) and Gamma (GEX) calculations are based on where the prior day’s reading falls with respect to the MAX and MIN of all occurrences available. A higher DIX is bullish. At the same time, the lower the GEX, the more (expected) volatility. Learn the implications of volatility, direction, and moneyness. SHIFT data used for S&P 500 (INDEX: SPX) options activity. Note that options flow is sorted by the call premium spent; if more positive, then more was spent on call options. Breadth reflects a reading of the prior day’s NYSE Advance/Decline indicator. VIX reflects a current reading of the CBOE Volatility Index (INDEX: VIX) from 0-100.

What To Expect

Fundamental: Keeping it short, today. Please check out Monday’s commentary, if you haven’t!

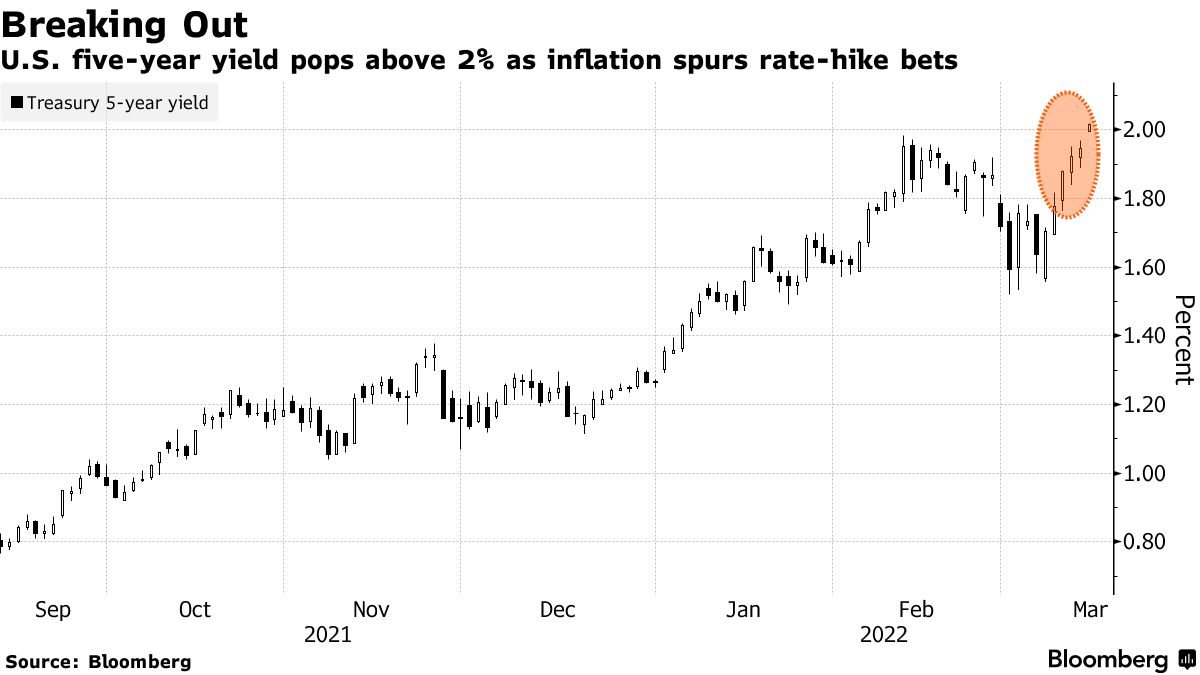
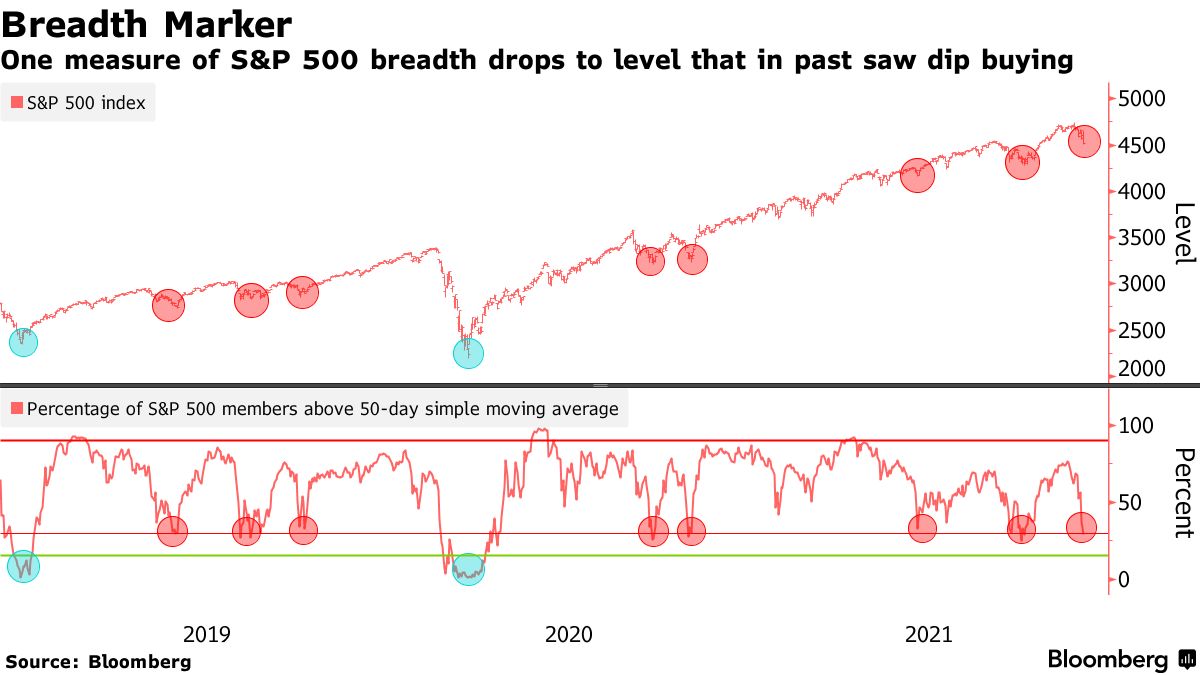
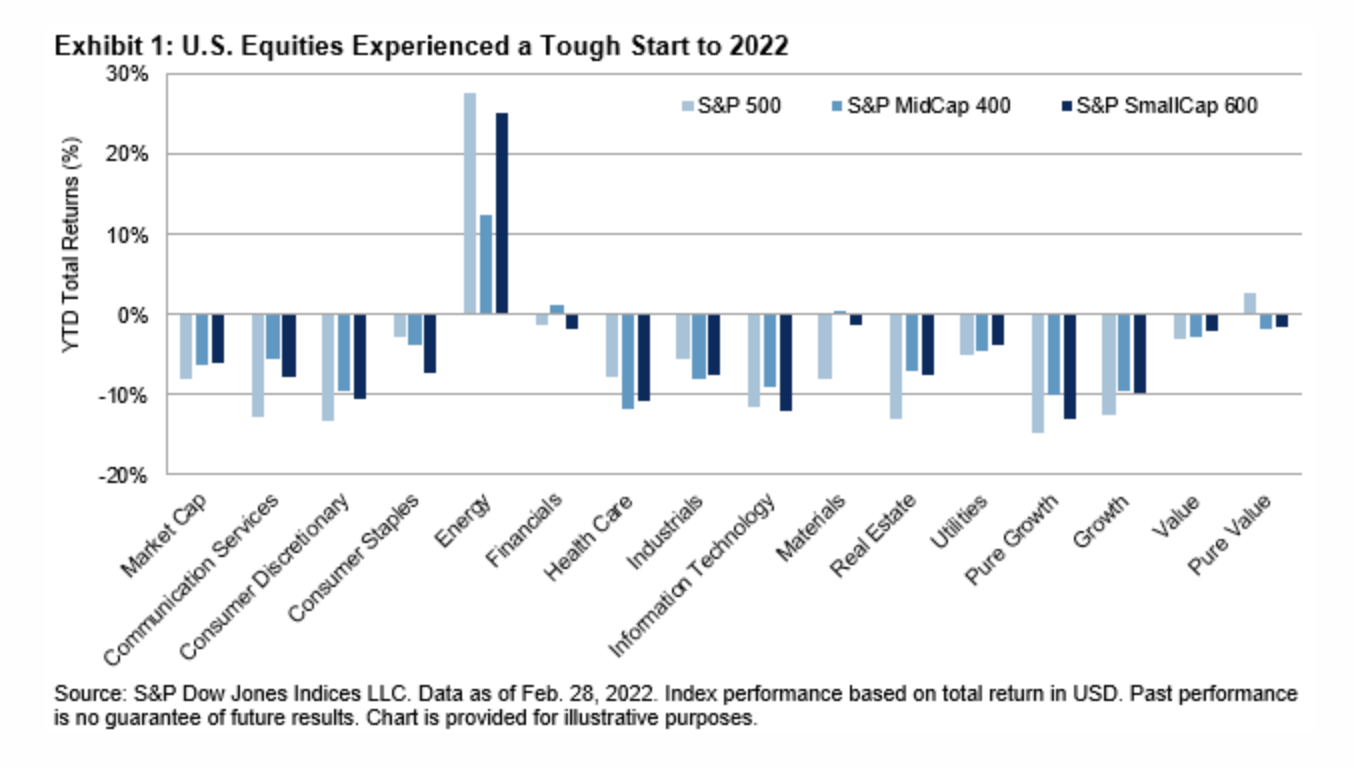
Weak start to 2022 as participants look to price slower growth and inflation, tighter monetary policy, geopolitical tensions, a resurgence in COVID-19, potential Russian defaults, and beyond.

Graphic: Via S&P Global Inc (NYSE: SPGI). 

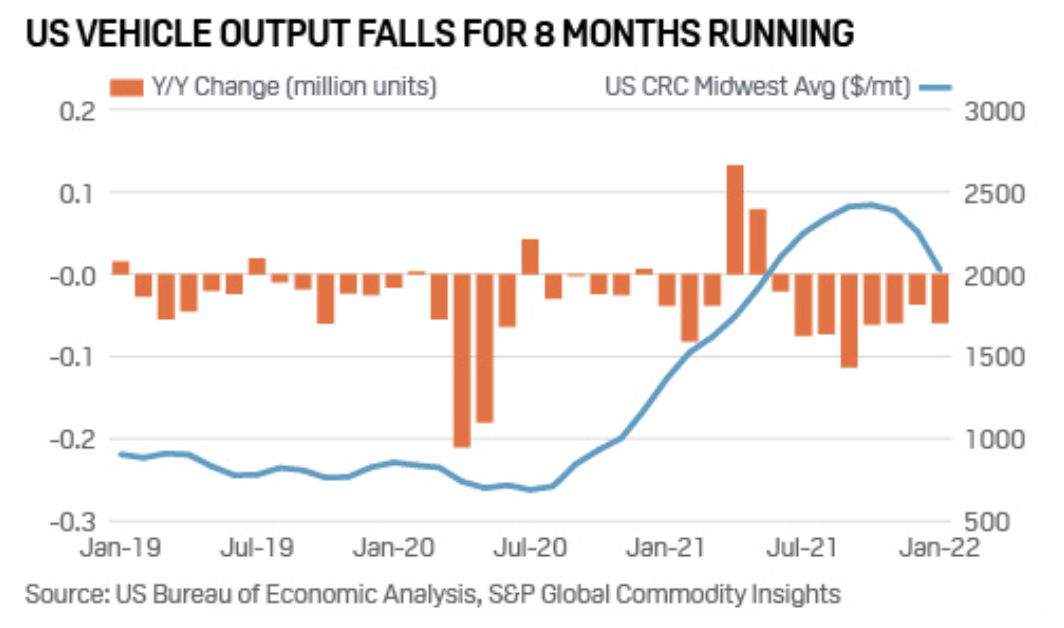
Bolstering inflation pressures are supply-demand challenges. For instance, geopolitical tensions are stifling vehicle production here in the U.S.

Graphic: Via S&P Global Inc (NYSE: SPGI). 

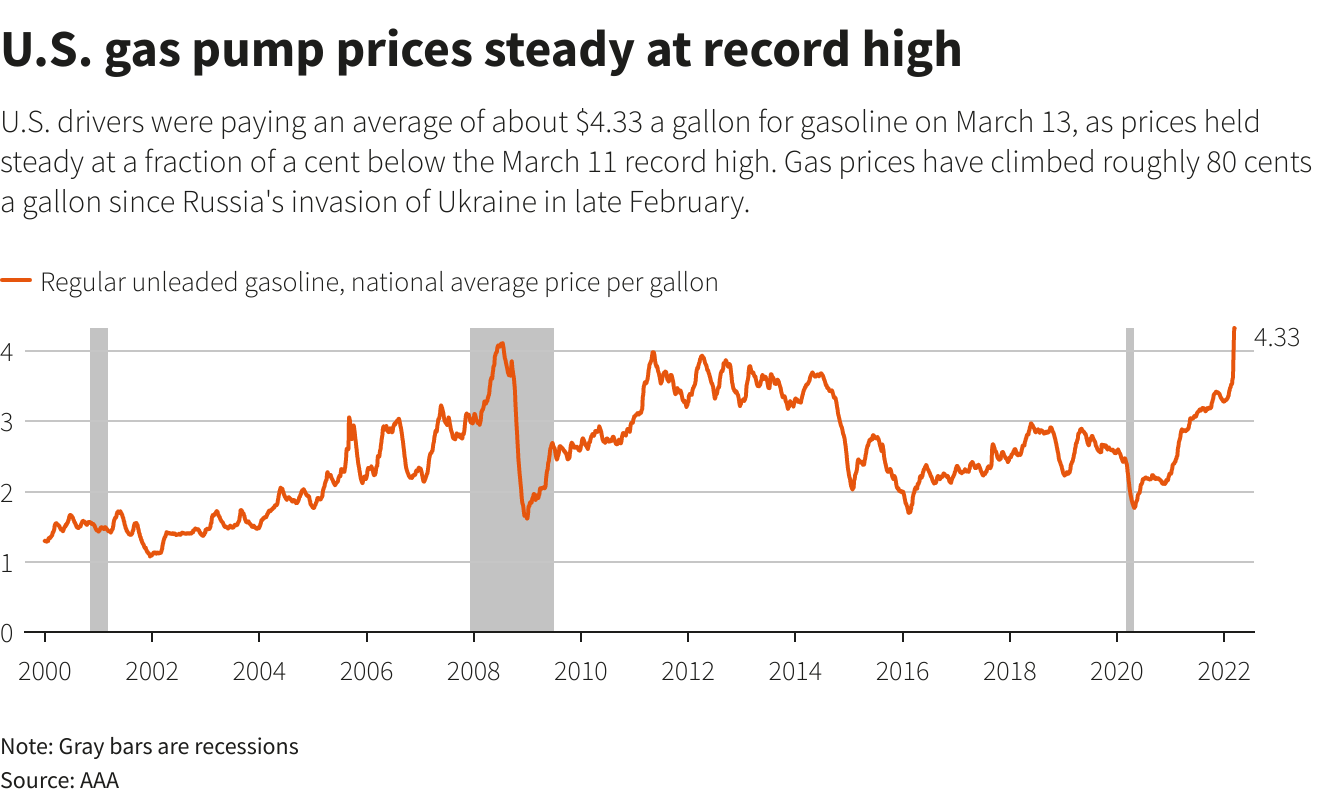
Since Russia’s invasion of Ukraine, gas in the U.S. climbed about $0.80/gallon, also, prompting talk of gas tax holidays.

Graphic: Via Reuters.

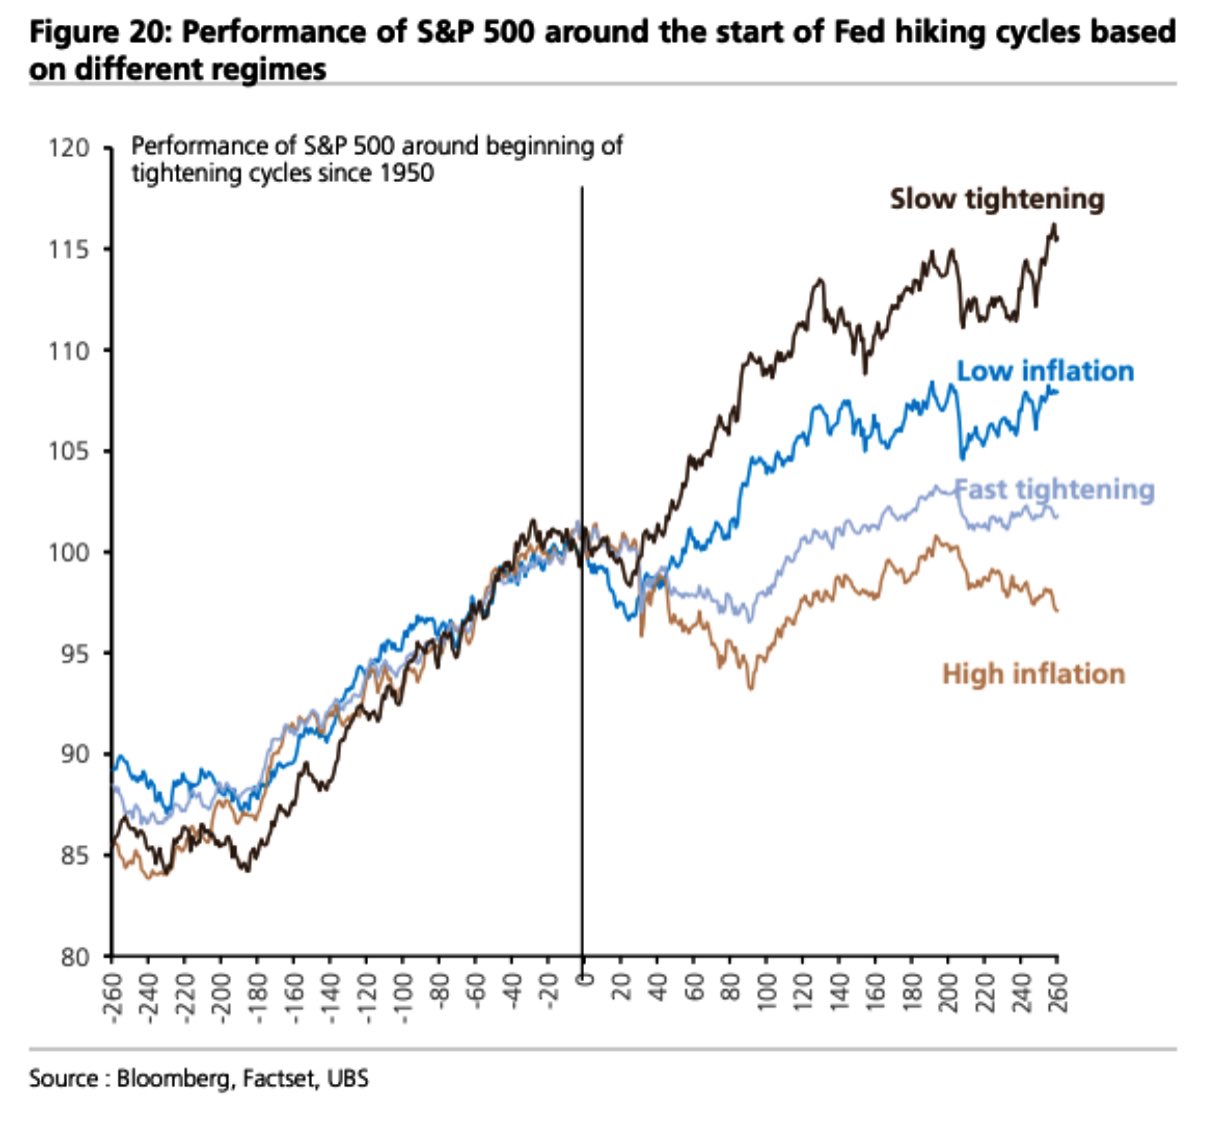
Pursuant to these remarks, Goldman Sachs Group Inc (NYSE: GS) economists suggest the probability of recession in the next year is between 20-35% while Morgan Stanley (NYSE: MS) strategists see equity valuations overshooting to the downside with out of control inflation.

Graphic: Via Goldman Sachs Group Inc.

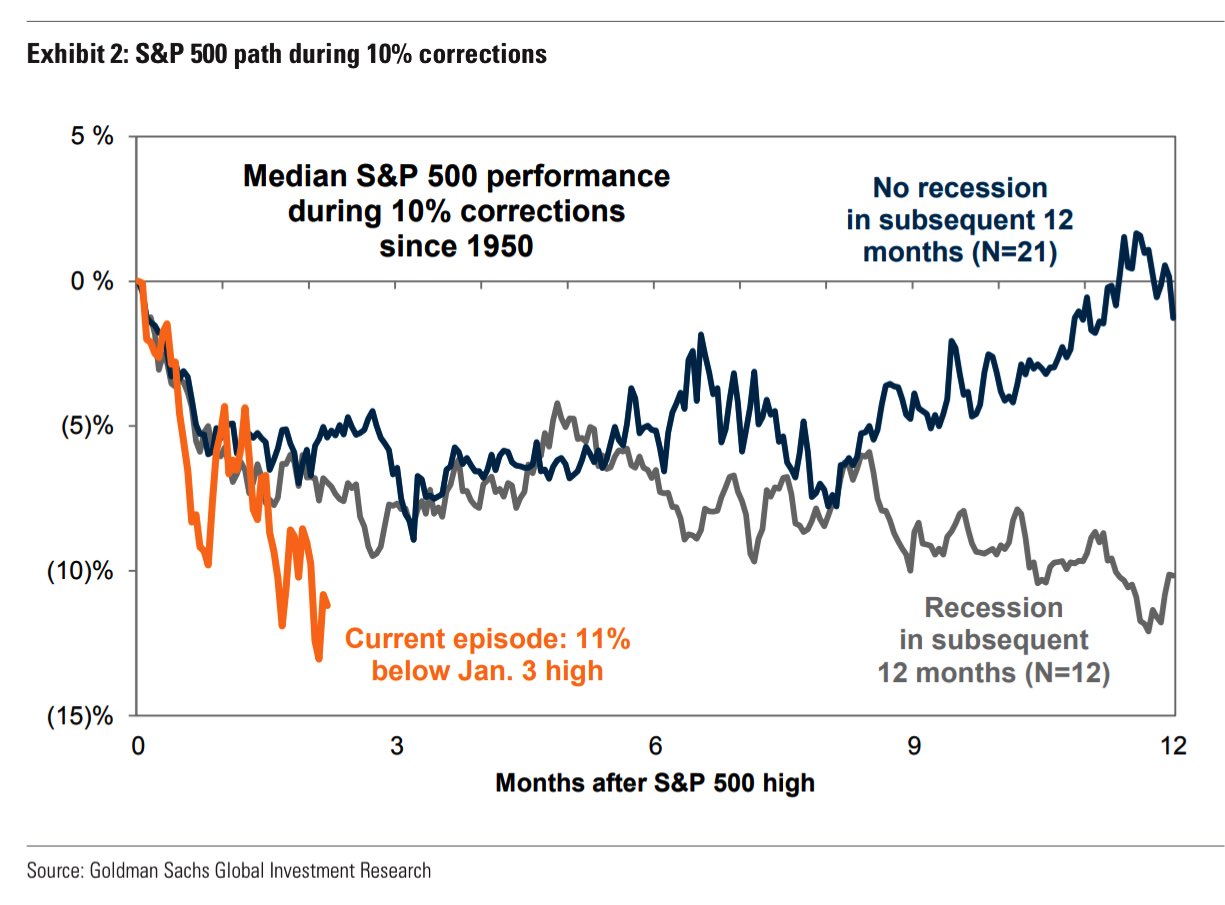
In opposition, JPMorgan Chase & Co’s (NYSE: JPM) Marko Kolanovic suggests there is too much negativity priced in and that investors should add equity risk

“We believe that the past month’s correction has induced too much negativity in markets, e.g., reflected by our market-implied recession probabilities, on the fear that growth will be severely affected by the war. We stay with a pro-risk stance as we do not believe that we will see a recession or that we have entered a sustained bear market.”

Graphic: Via Bloomberg. “A Moody’s Analytics computer model suggests that the U.S. as a whole would be able to avoid a recession, even if military hostilities are prolonged.”

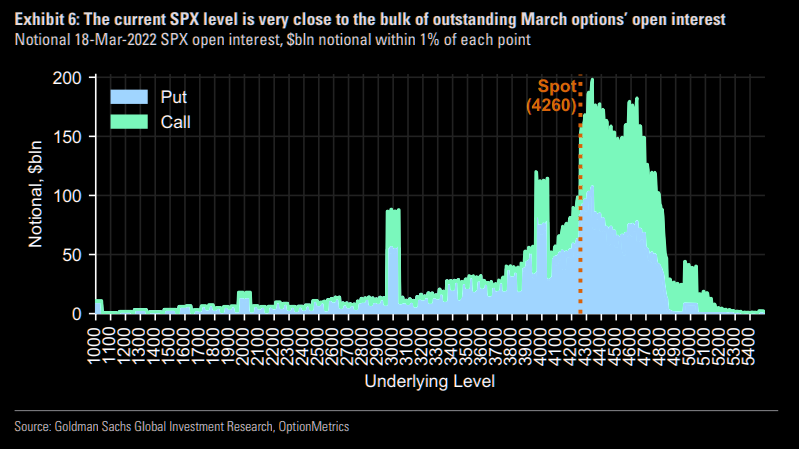
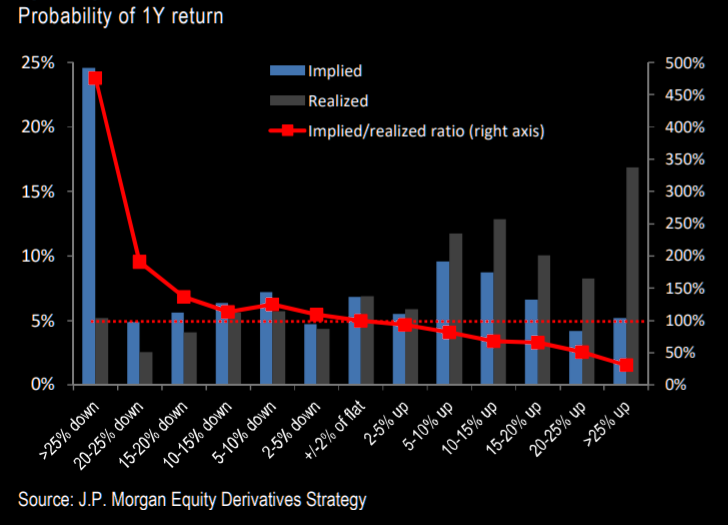
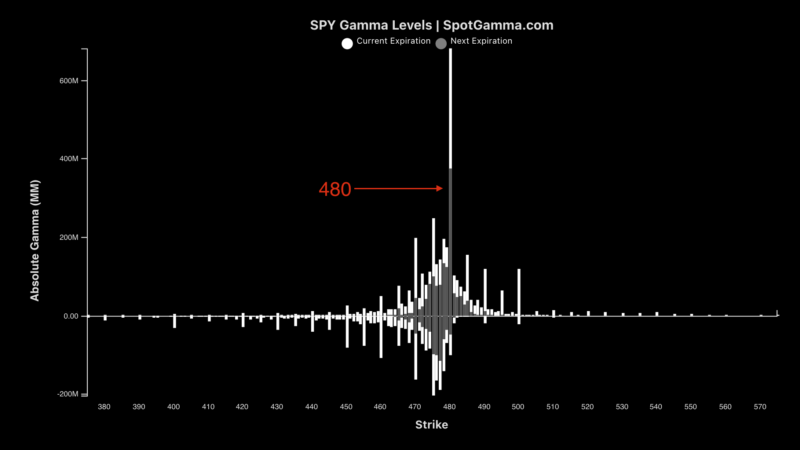
Positioning: Per Goldman Sachs Group Inc’s derivatives team, “puts are more overvalued than any time over the past five years.”

Graphic: Via SpotGamma. “Netting call & put delta, you can see we’re near extremes in terms of put:call positions. Often large put positions are removed by expirations, which seems to coincide with market lows. Many of these are quarterly expirations which coincide w/FOMC meetings – such as next week.”

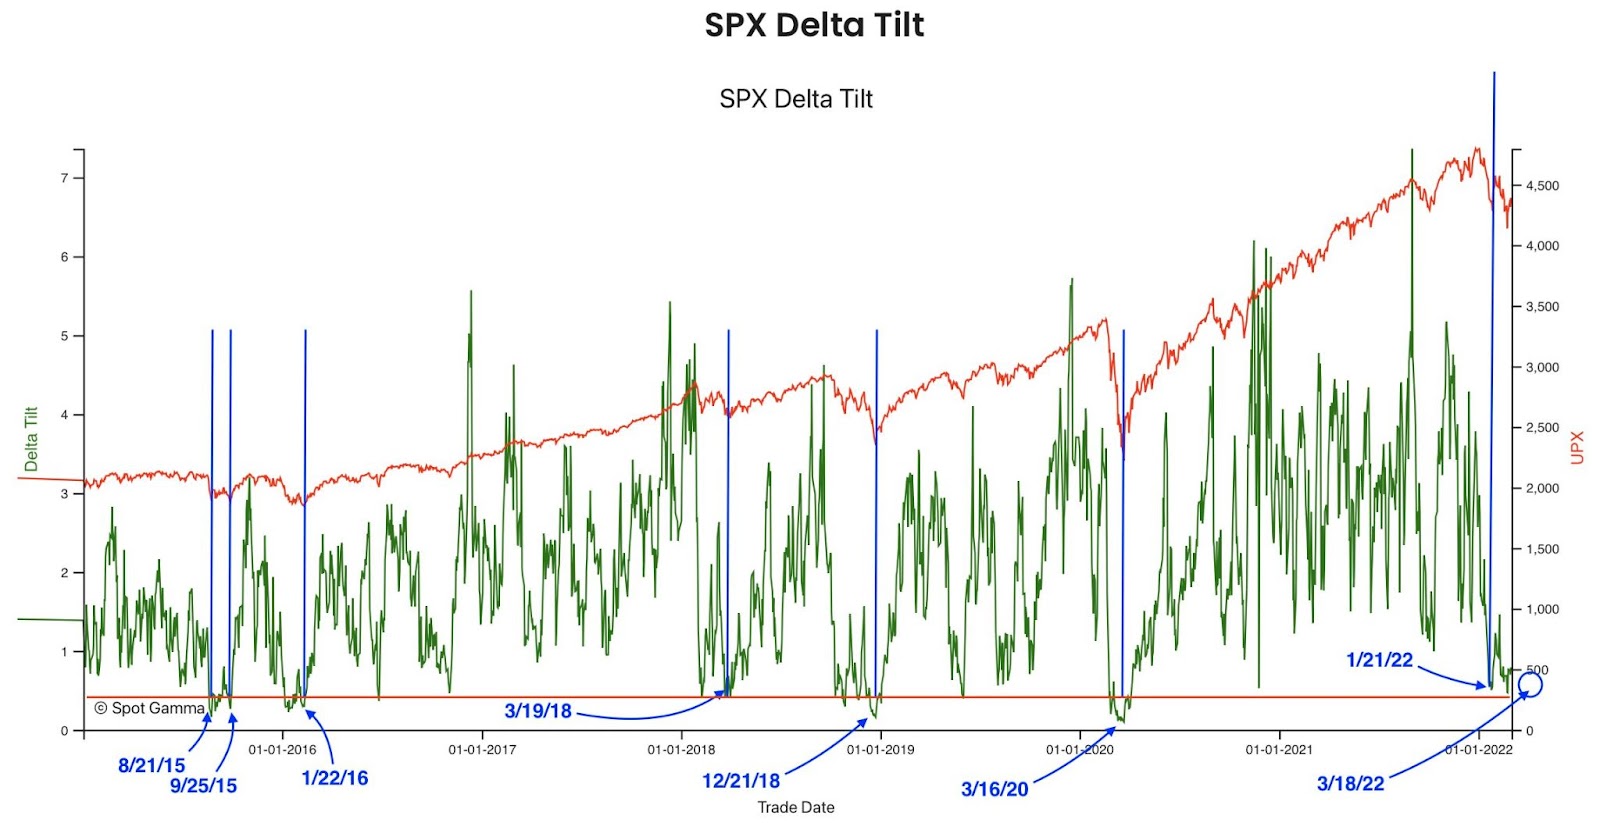
Further, it is expected that the compression of volatility (via passage of FOMC), as well as the removal of customer puts and (accordingly) counterparty negative gamma exposure (OPEX) may serve to alleviate some of this pressure.

Graphic: Via Goldman Sachs Group Inc (NYSE: GS). Taken from The Market Ear. “18-Mar has more expiring near-the-money SPX open interest than any expiration since 2019.”

In taking the other side of this demand for protection, counterparties carry exposure to positive delta and negative gamma (losses amplified to the downside). In hedging their own exposure, counterparties will sell underlying(s), and this is where the aforementioned pressure arises.

Graphic: SqueezeMetrics details the implications of customer activity in the options market, on the underlying’s order book. For instance, in selling a put, customers add liquidity and stabilize the market. How? The market maker long the put will buy (sell) the underlying to neutralize directional risk as price falls (rises).

Given present supply and demand conditions (customer hedging in months prior), the incremental pressure counterparties add with each leg lower is less, if you will. 

Here’s a good explanation:

“When implied volatility is high, that same 1% move lower is much more ‘expected’ so there generally won’t be the same upward pressure on volatility and in fact it might decline,” said Christopher Jacobson, a strategist at Susquehanna Financial Group LLP.

“Along the same lines, investors at that point have had more opportunity and time to hedge, so those same market moves may not lead to as much hedging activity.”

Pictured: SqueezeMetrics highlights implications of volatility, direction, and moneyness.

Adding to that last remark, as Amy Wu Silverman of Royal Bank of Canada’s (NYSE: RY) capital markets group puts it well: “You’re also seeing people selling that volatility and doing some overwriting. That can probably dampen volatility.”

Graphic: SpotGamma’s Hedging Impact of Real-Time Options (HIRO) indicator for QQQ shows strong put selling 3/14/2022. Divergences often precede reversals in the underlying.

There is the potential, according to SpotGamma, for some “path dependency,” however, as “the expiration and/or covering of a large swath of these put hedges may place the market back into an ‘underhedged’ position.” In such a case, new demand would add fuel to weakness.

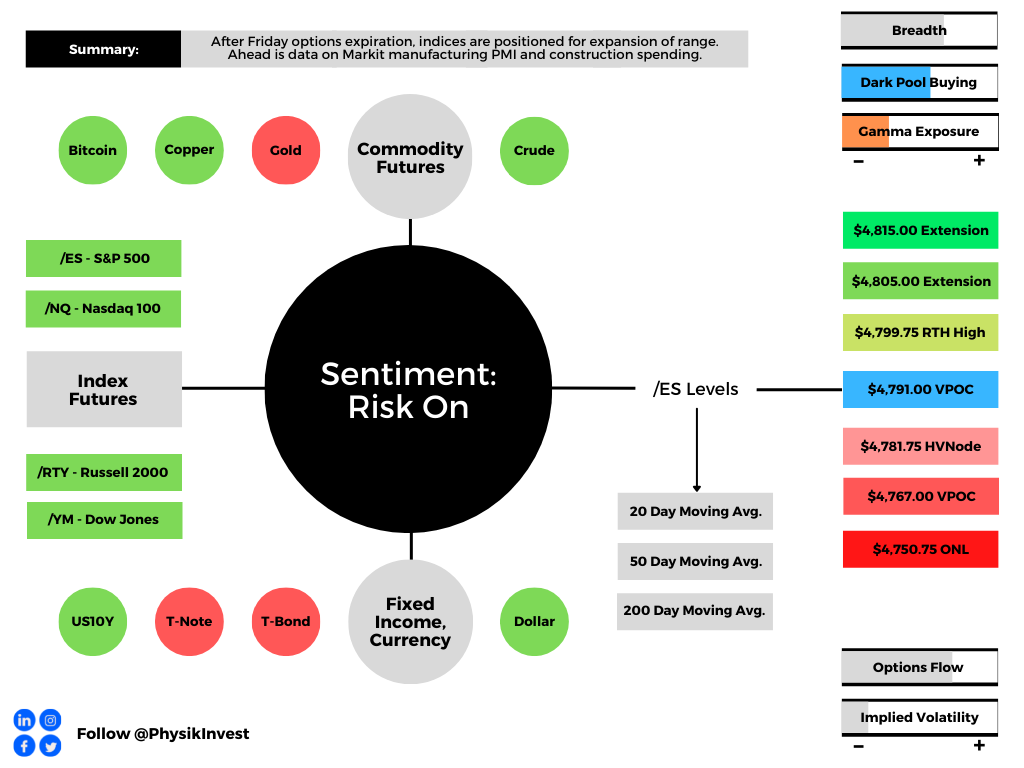
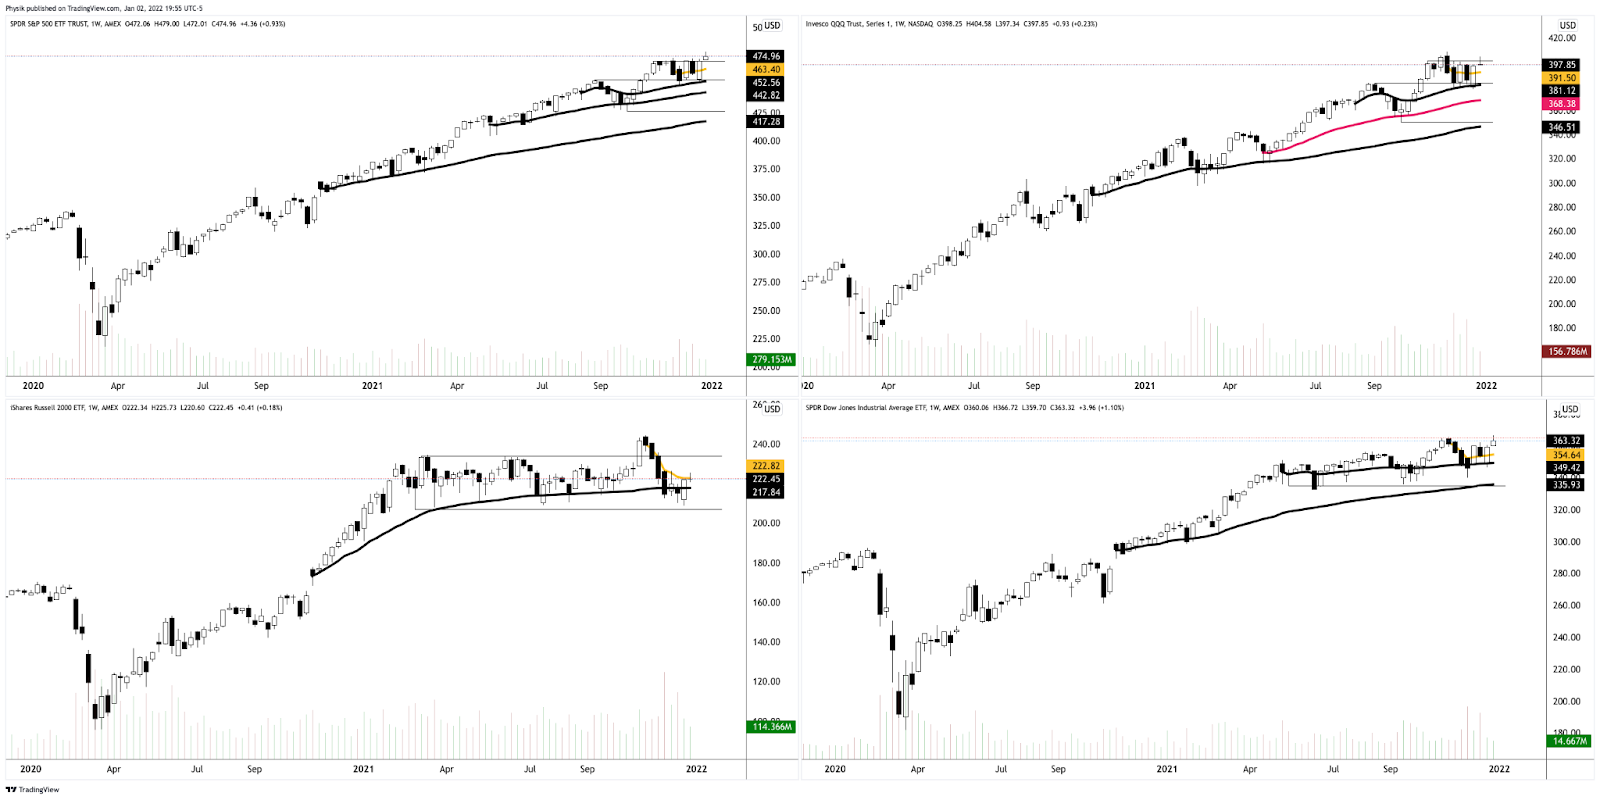
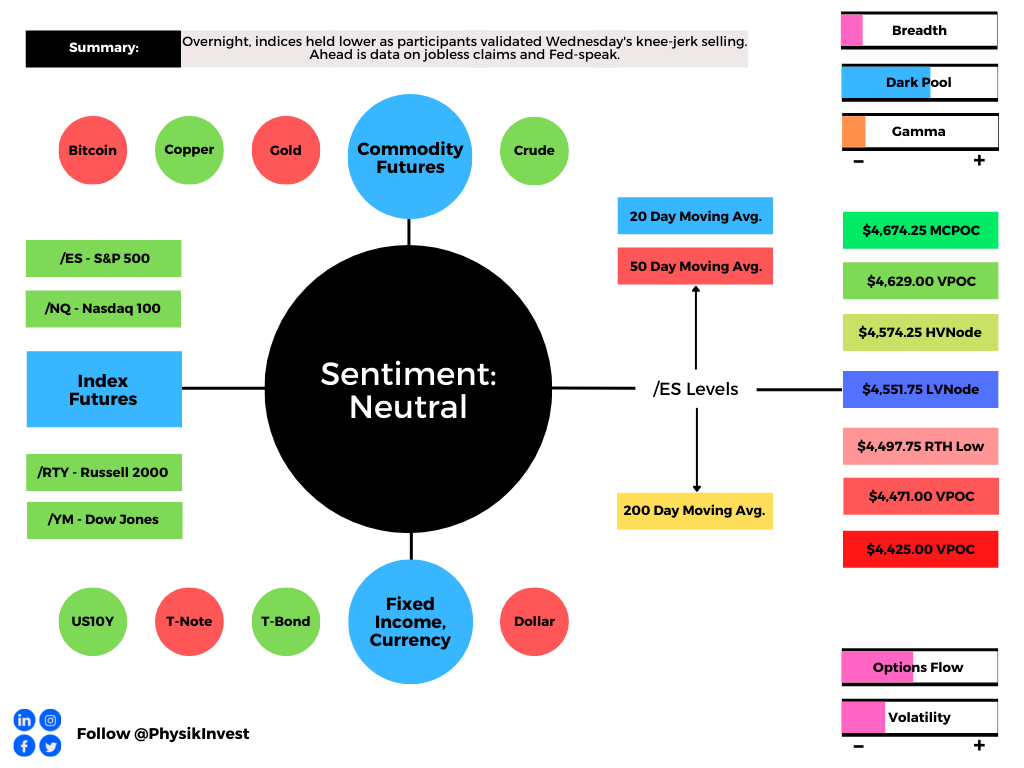
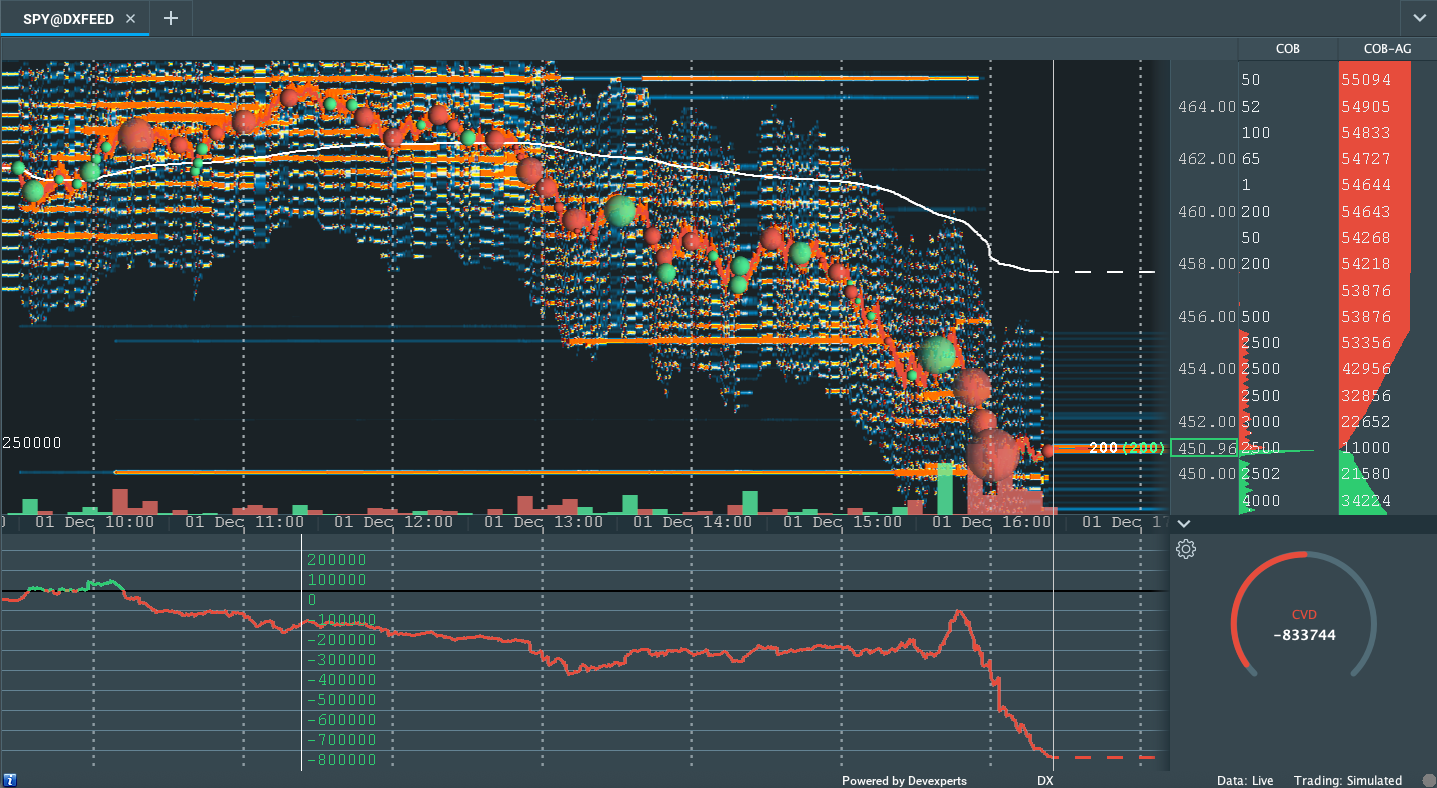
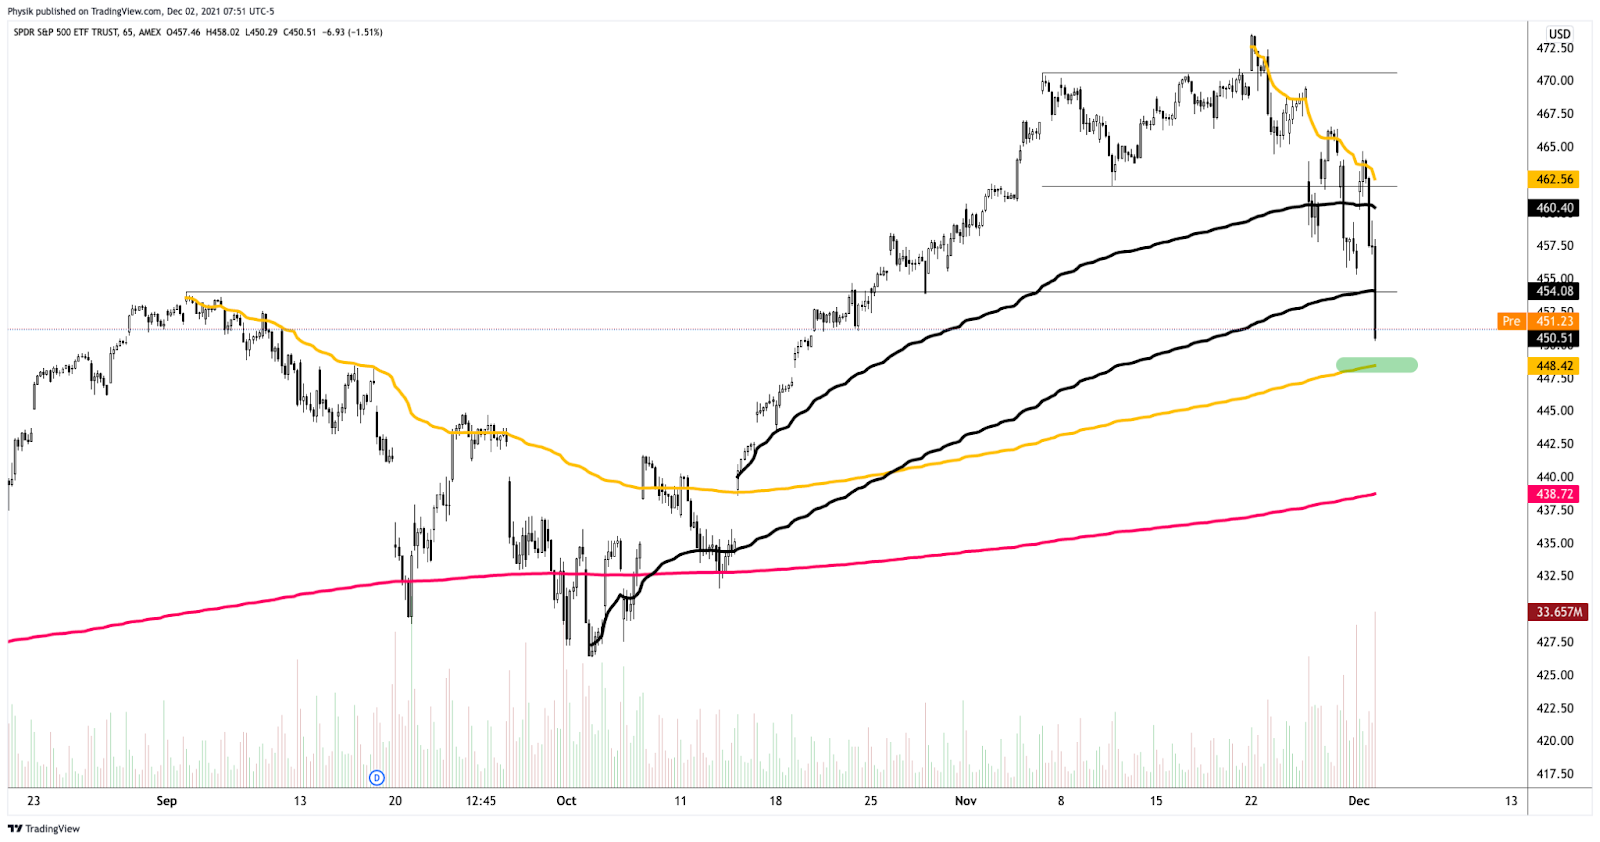
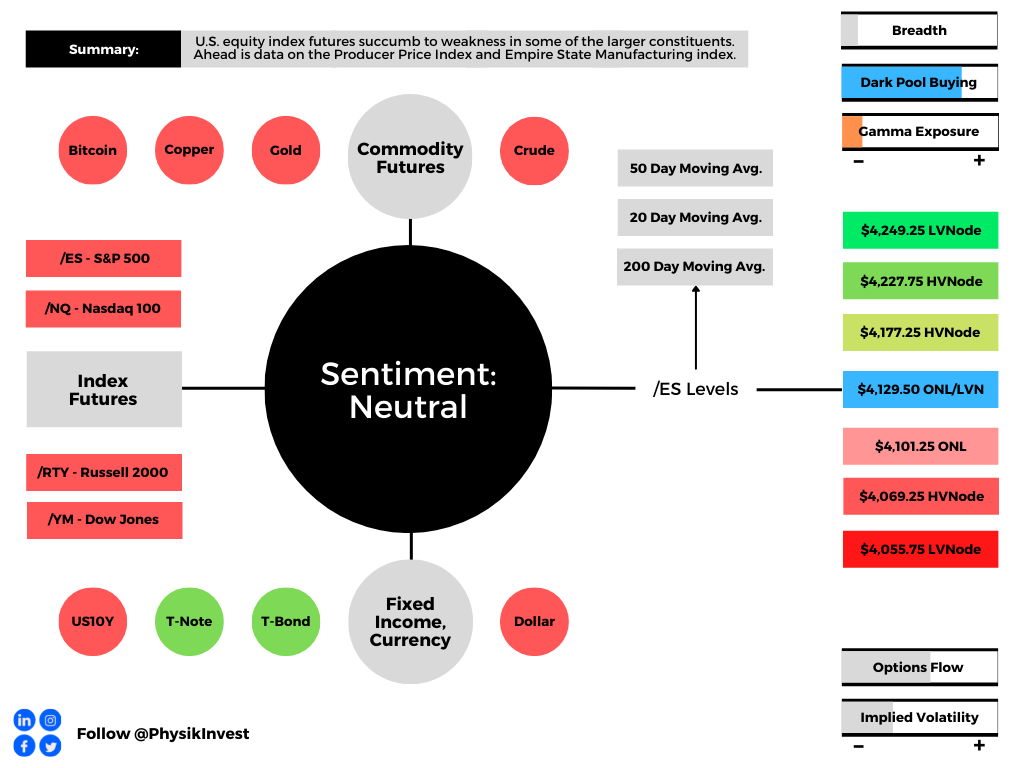
Technical: As of 6:15 AM ET, Tuesday’s regular session (9:30 AM – 4:00 PM ET), in the S&P 500, will likely open in the middle part of a negatively skewed overnight inventory, inside of prior-range and -value, suggesting a limited potential for immediate directional opportunity.

Gap Scenarios: Gaps ought to fill quickly. Should they not, that’s a signal of strength; do not fade. Leaving value behind on a gap-fill or failing to fill a gap (i.e., remaining outside of the prior session’s range) is a go-with indicator.

Auctioning and spending at least 1-hour of trade back in the prior range suggests a lack of conviction; in such a case, do not follow the direction of the most recent initiative activity.

In the best case, the S&P 500 trades higher; activity above the $4,129.50 overnight low (ONL) puts in play the $4,177.25 high volume area (HVNode). Initiative trade beyond the $4,177.25 HVNode could reach as high as the $4,227.75 HVNode and $4,249.25 LVNode, or higher.

In the worst case, the S&P 500 trades lower; activity below the $4,129.50 ONL puts in play the $4,101.25 ONL. Initiative trade beyond the ONL could reach as low as the $4,069.25 HVNode and $4,055.75 LVNode, or lower.

Considerations: Push-and-pull, as well as responsiveness near key-technical areas (that are discernable visually on a chart), suggests technically-driven traders with short time horizons are very active. 

Such traders often lack the wherewithal to defend retests and, additionally, the type of trade may be indicative of the other time frame participants waiting for more information to initiate trades.

Click here to load today’s key levels into the web-based TradingView charting platform. Note that all levels are derived using the 65-minute timeframe. New links are produced, daily.
Graphic: 65-minute profile chart of the Micro E-mini S&P 500 Futures.

Definitions

Overnight Rally Highs (Lows): Typically, there is a low historical probability associated with overnight rally-highs (lows) ending the upside (downside) discovery process.

Volume Areas: A structurally sound market will build on areas of high volume (HVNodes). Should the market trend for long periods of time, it will lack sound structure, identified as low volume areas (LVNodes). LVNodes denote directional conviction and ought to offer support on any test. 

If participants were to auction and find acceptance into areas of prior low volume (LVNodes), then future discovery ought to be volatile and quick as participants look to HVNodes for favorable entry or exit.

About

After years of self-education, strategy development, mentorship, and trial-and-error, Renato Leonard Capelj began trading full-time and founded Physik Invest to detail his methods, research, and performance in the markets.

Capelj is also a Benzinga finance and technology reporter interviewing the likes of Shark Tank’s Kevin O’Leary, JC2 Ventures’ John Chambers, FTX’s Sam Bankman-Fried, and ARK Invest’s Catherine Wood, as well as a SpotGamma contributor developing insights around impactful options market dynamics.

Disclaimer

Physik Invest does not carry the right to provide advice.

In no way should the materials herein be construed as advice. Derivatives carry a substantial risk of loss. All content is for informational purposes only.

Categories
Commentary

Daily Brief For March 14, 2022

Editor’s Note: The Daily Brief is a free glimpse into the prevailing fundamental and technical drivers of U.S. equity market products. Join the 200+ that read this report daily, below!

What Happened

A lot to unpack, today. Part of the newsletter may be cut off, as a result, in your inbox. Just click to view in another window.

Overnight, equity index futures auctioned sideways-to-higher, masking turmoil in products listed abroad, as well as commodities and fixed income.

In regards to bonds, they slumped (globally) in light of participants’ pricing in monetary action given heightened inflation. The Federal Reserve, Bank of England, and Bank of Japan are to issue policy updates this week.

Commodity markets are still roiling after a price spike in some products “created a systemic risk” that prompted exchanges to cancel trades, while equity markets in Asia saw their worst-selling in years.

The Hang Seng China Enterprises Index (INDEX: HSCEI) closed down 7.2%, the biggest drop since 2008. This was after Russia asked for China’s assistance in Ukraine (which could result, later, in sanctions from the U.S.), thus compounding uncertainties with respect to an ongoing regulatory crackdown.

Ahead is data on 1- and 3-year inflation expectations (11:00 AM ET).

Graphic updated 6:11 AM ET. Sentiment Neutral if expected /ES open is inside of the prior day’s range. /ES levels are derived from the profile graphic at the bottom of the following section. Levels may have changed since initially quoted; click here for the latest levels. SqueezeMetrics Dark Pool Index (DIX) and Gamma (GEX) calculations are based on where the prior day’s reading falls with respect to the MAX and MIN of all occurrences available. A higher DIX is bullish. At the same time, the lower the GEX, the more (expected) volatility. Learn the implications of volatility, direction, and moneyness. SHIFT data used for S&P 500 (INDEX: SPX) options activity. Note that options flow is sorted by the call premium spent; if more positive, then more was spent on call options. Breadth reflects a reading of the prior day’s NYSE Advance/Decline indicator. VIX reflects a current reading of the CBOE Volatility Index (INDEX: VIX) from 0-100.

What To Expect

Fundamental: We may attribute participants’ uncertainty to how far monetary policymakers want to tighten, slower economic growth, the implications of geopolitical tensions, imminent Russian defaults, a resurgence in COVID-19 abroad, and more.

Graphic: Via Bloomberg. As Treasury yields rise, participants price in Fed tightening.

As revealed by metrics like CME Group Inc’s (NASDAQ: CME) FedWatch Tool, for instance, participants are pricing a high certainty of an increase in rates.

Graphic: Via CME Group Inc (NASDAQ: CME). Participants price in an increased probability of a shift in the target rate. Click here to access the FedWatch Tool.

“Yields are reflecting a surprise higher shift upward in inflation expectations,” said Morgan Stanley’s (NYSE: MS) Jim Caron. “Many thought inflation would peak in the first quarter and fall. Now, with oil prices, inflation may stay high.”

At the same time, there are some indications of market stresses.

Graphic: Via McClellan Financial Publications. “The Daily A-D Line for corporate high yield bonds continues to look quite ugly. That is a concern for the overall stock market because high yield bonds drink from the same liquidity pool as stocks do, and these bonds are arguably more sensitive than stocks are to liquidity problems.”

As explained in DC’s Chartbook discussion, however, “stress in money markets is for now mostly contained and not an imminent risk to financial sustainability.”

Graphic: Via DC’s Chartbook. Funding spreads “have stabilized over the past week, not making new highs after the gap-up open on March 7. These are encouraging signs that the stress in money markets is for now mostly contained and not an imminent risk to financial stability.”

In regards to credit default swap spreads, though they are wider than in recent history, “they are still far below where they were during times of material solvency risk such as March of 2020, and the term structure of CDS spreads suggests this is more due to mechanical de-risking.”

Graphic: Via DC’s Chartbook. Cost of credit insurance for Citigroup Inc (NYSE: C). Hedging with CDS results in mechanical steepening which raises the curve. “This is in sharp contrast to the curve in March 2020 (yellow, orange, and red), when the short end of the CDS curve rose quickly and flattened the curve.”

Okay. So, the “financial system is functioning smoothly.” How do you trade slowing growth in the face of heightened inflation?

As Andreas Steno Larsen of Heimstaden explains, the “best way to assess this question is via a historical study of empirical returns during times of actual stagflation dating back to the early 1970s.”

Graphic: Via Andreas Steno Larsen. “Heatmap on quarterly inflation-adjusted returns across asset classes during stagflation periods (1973 – today).”

“Assets that tend to keep the value intact or even increase in real terms through stagflation are typically negatively correlated to low or negative real rates, which is why gold and real estate (REITs) are some of the best places to hide during stagflation,” Steno Larsen says. 

“Equities overall struggle to perform in real terms and so do bonds, which might be even worse this time around due to the outset of bond yields into this potential stagflationary environment.”

To note, pursuant to the idea that participants have “priced in” the aforementioned, S&P Global Inc (NYSE: SPGI) data suggests “the initial stages of a monetary tightening cycle have not been disastrous for the U.S. stock market historically.”

Graphic: Via S&P Global.

Positioning: Based on a comparison of present options positioning and buying metrics, the returns distribution is skewed positive.

This is in the face of an S&P 500 (INDEX: SPX) and Cboe Volatility Index (INDEX: VIX) down environment.

Graphic: Via Bloomberg. S&P 500 (INDEX: SPX) down, CBOE Volatility Index (INDEX: VIX) down.

In part, this has to do with the supply and demand of protection; mainly, the market is “well hedged and well-positioned,” Amy Wu Silverman of Royal Bank of Canada’s (NYSE: RY) says

Graphic: Via SpotGamma. “Netting call & put delta, you can see we’re near extremes in terms of put:call positions. Often large put positions are removed by expirations, which seems to coincide with market lows. Many of these are quarterly expirations which coincide w/FOMC meetings – such as next week.”

Given this, as JPMorgan Chase & Co (NYSE: JPM) analysts explain, “we could be closer to the end” of discretionary de-risking, and the compression of volatility (via passage of FOMC), as well as the removal of counterparty negative exposure (via OPEX) may serve to alleviate pressure. 

Graphic: Via Goldman Sachs Group Inc (NYSE: GS). Taken from The Market Ear. “18-Mar has more expiring near-the-money SPX open interest than any expiration since 2019.”

As SpotGamma, explains, “As it stands, without further geopolitical events causing, even more, fear, the markets are due for a relief rally,” on improving seasonality, among other things. 

“Following the FOMC meeting, as well as the reduction in put-heavy exposures post-OPEX (options expiration), the need for put ownership (protection) and relative short positions is reduced (less positive delta = less selling to hedge = less pressure).”

Graphic: Via EquityClock. Taken from The Market Ear.

Technical: As of 6:30 AM ET, Monday’s regular session (9:30 AM – 4:00 PM ET), in the S&P 500, will likely open in the middle part of a positively skewed overnight inventory, inside of prior-range and -value, suggesting a limited potential for immediate directional opportunity.

In the best case, the S&P 500 trades higher; activity above the $4,227.75 high volume area (HVNode) puts in play the $4,249.25 low volume area (LVNode). Initiative trade beyond the LVNode could reach as high as the $4,285.25 and $4,314.75 HVNode, or higher.

In the worst case, the S&P 500 trades lower; activity below the $4,227.75 HVNode puts in play the $4,189.00 regular trade low (RTH Low). Initiative trade beyond the RTH Low could reach as low as the $4,138.75 and $4,101.25 overnight low (ONL), or lower.

Considerations: Participants resolve a pinch of two anchored volume-weighted average price indicators (VWAPs). A VWAP is a metric highly regarded by chief investment officers, among other participants, for quality of trade. Additionally, liquidity algorithms are benchmarked and programmed to buy and sell around VWAPs.

We look to buy above a flat/rising VWAP pinch. We look to sell below a flat/declining VWAP pinch.

Click here to load today’s key levels into the web-based TradingView charting platform. Note that all levels are derived using the 65-minute timeframe. New links are produced, daily.
Graphic: 65-minute profile chart of the Micro E-mini S&P 500 Futures.

Definitions

Overnight Rally Highs (Lows): Typically, there is a low historical probability associated with overnight rally-highs (lows) ending the upside (downside) discovery process.

Volume Areas: A structurally sound market will build on areas of high volume (HVNodes). Should the market trend for long periods of time, it will lack sound structure, identified as low volume areas (LVNodes). LVNodes denote directional conviction and ought to offer support on any test. 

If participants were to auction and find acceptance into areas of prior low volume (LVNodes), then future discovery ought to be volatile and quick as participants look to HVNodes for favorable entry or exit.

POCs: POCs are valuable as they denote areas where two-sided trade was most prevalent in a prior day session. Participants will respond to future tests of value as they offer favorable entry and exit.

About

After years of self-education, strategy development, mentorship, and trial-and-error, Renato Leonard Capelj began trading full-time and founded Physik Invest to detail his methods, research, and performance in the markets.

Capelj is also a Benzinga finance and technology reporter interviewing the likes of Shark Tank’s Kevin O’Leary, JC2 Ventures’ John Chambers, FTX’s Sam Bankman-Fried, and ARK Invest’s Catherine Wood, as well as a SpotGamma contributor developing insights around impactful options market dynamics.

Disclaimer

Physik Invest does not carry the right to provide advice.

In no way should the materials herein be construed as advice. Derivatives carry a substantial risk of loss. All content is for informational purposes only.

Categories
Commentary

Daily Brief For January 21, 2022

The Daily Brief is a free glimpse into the prevailing fundamental and technical drivers of U.S. equity market products. Join the 200+ that read this report daily, below!

What Happened

Overnight, equity index futures auctioned sideways, mostly, after a weak close, Thursday.

Measures of implied volatility remained bid while bonds rose after yields briefly surpassed 1.9%.

Ahead is data on leading economic indicators (10:00 AM ET).

Graphic updated 6:30 AM ET. Sentiment Neutral if expected /ES open is inside of the prior day’s range. /ES levels are derived from the profile graphic at the bottom of the following section. Levels may have changed since initially quoted; click here for the latest levels. SqueezeMetrics Dark Pool Index (DIX) and Gamma (GEX) calculations are based on where the prior day’s reading falls with respect to the MAX and MIN of all occurrences available. A higher DIX is bullish. At the same time, the lower the GEX, the more (expected) volatility. Learn the implications of volatility, direction, and moneyness. SHIFT data used for S&P 500 (INDEX: SPX) options activity. Note that options flow is sorted by the call premium spent; if more positive, then more was spent on call options. Breadth reflects a reading of the prior day’s NYSE Advance/Decline indicator. VIX reflects a current reading of the CBOE Volatility Index (INDEX: VIX) from 0-100.

What To Expect

Fundamental: The Nasdaq dipped into correction territory as stocks extended lower, Thursday.

Weakness was compounded by geopolitical tensions, the prospects of reduced stimulus to combat high inflation, as well as poor responses to earnings results.

Shares of Amazon Inc (NASDAQ: AMZN) just missed the round $3,000.00 figure and Peloton Interactive Inc (NASDAQ: PTON) fell on waning demand, while Netflix Inc (NASDAQ: NFLX) traded down just over 20.00% on a weak subscriber outlook.

“Thursday’s trading pattern looks exactly like a typical session from the summer of 2007 as the sub-prime crisis was beginning to send the first shock waves through the stock market,” said Bloomberg’s John Authers on wild changes in sentiment exacerbating the volatility. 

“Big changes of direction in the last hour, with no obvious news to trigger them, became a fact of life.”

Moreover, with pandemic-era speculation still embedded in prices, Authers adds, the removal of central bank liquidity opens the door to even lower prices as the “process to correct a lot of excess is now underway.”

Regardless of how aggressive contractions in monetary policy are, the Federal Reserve will spell out its plans well in advance, Fed Governor Christopher Waller explained

“I don’t see a 50 basis point hike in March. We have not prepared markets for anything that dramatic. One of our key themes has been not to surprise market, giving well enough advance, in terms of what we’re trying to do.”

Graphic: Per The Market Ear, “Equities usually deliver lower returns but with lower volatility during faster Fed hiking episodes.”

At present, a full 25 basis point hike is priced by March. 

Graphic: Via Bloomberg, there are four rate hikes priced for the year.

Per S&P Global Inc (NYSE: SPGI) analyses, these hikes are likely to “cause shorter-term rates, such as the 1- and 2-year Treasury yields, to climb more rapidly than longer-term rates,” potentially pressuring consumer credit, and increasing the costs of loans.

“By launching the reduction in the balance sheet, the Fed could match the rise in short-term rates with a similar rise in longer duration rates,” thus reducing the Fed’s need to hike rates, S&P Global explained.

“Given mortgage rates and corporate borrowing costs are more impacted by movements in 10-year yields than 3-month rates, the Fed funds target rate may not need to be increased as aggressively to get inflation under control,” James Knightley, an ING Groep NV (NYSE: ING) economist, added.

Positioning: Per Morgan Stanley’s (NYSE: MS) prime brokerage data, investors are deploying a more defensive tilt to portfolios in the face of a deceleration in sales and margin compression.

This “stock liquidation played into the large negative gamma position which accelerated selling into the close,” according to options modeling and analysis service SpotGamma.

For context, “when a position’s delta falls (rises) with stock or index price rises (falls), the underlying is in a negative-gamma environment.”

In such an environment, the expansion of volatility as a result of demand for downside (put) protection (a lot of which is short-dated and increasingly sensitive to direction) for instance, leaves dealers compounding weakness. 

Graphic: Implied volatility term structure shifts higher, mostly at the front-end.

Therefore, in the case of heightened demand for downside put protection (a negative-delta trade), higher implied volatility increases dealer exposure positive delta. 

To offset this positive delta exposure, dealers sell more underlying, exacerbating weakness.

The passage of the monthly options expiration (OPEX) ought to clear some of the put-heavy positioning; “removal of this exposure post-OPEX,” coupled with a reduction in embedded event premiums tied to the approaching Federal Open Market Committee (FOMC) event, “will leave dealers with less positive delta exposure to sell against.”

This opens up a window of strength wherein dealers are to take less liquidity (buy strength and sell weakness) and pressure less the market in hedging put-heavy positioning. 

Graphic: Taken from The Market Ear. In a lower liquidity environment, dealer hedging matters more.

Technical: As of 6:30 AM ET, Friday’s regular session (9:30 AM – 4:00 PM ET), in the S&P 500, will likely open in the middle part of a balanced overnight inventory, inside of prior-range and -value, suggesting a limited potential for immediate directional opportunity.

Spikes: Spike’s mark the beginning of a break from value. Spikes higher (lower) are validated by trade at or above (below) the spike base (i.e., the origin of the spike). The base is $4,549.00.

In the best case, the S&P 500 trades higher; activity above the $4,471.00 point of control (POC) puts in play the $4,526.25 high volume area (HVNode). Initiative trade beyond the HVNode could reach as high as the $4,581.00 untested point of control (VPOC) and $4,619.00 HVNode, or higher.

In the worst case, the S&P 500 trades lower; activity below the $4,471.00 POC puts in play the $4,425.00 VPOC. Initiative trade beyond the $4,425.00 VPOC could reach as low as the $4,349.00 and $4,299.00 VPOCs, or lower.

Click here to load today’s key levels into the web-based TradingView charting platform. Note that all levels are derived using the 65-minute timeframe. New links are produced, daily.
Graphic: 65-minute profile chart of the Micro E-mini S&P 500 Futures.

What People Are Saying

Definitions

Volume Areas: A structurally sound market will build on areas of high volume (HVNodes). Should the market trend for long periods of time, it will lack sound structure, identified as low volume areas (LVNodes). LVNodes denote directional conviction and ought to offer support on any test. 

If participants were to auction and find acceptance into areas of prior low volume (LVNodes), then future discovery ought to be volatile and quick as participants look to HVNodes for favorable entry or exit.

POCs: POCs are valuable as they denote areas where two-sided trade was most prevalent in a prior day session. Participants will respond to future tests of value as they offer favorable entry and exit.

Options Expiration (OPEX): Traditionally, option expiries mark an end to pinning (i.e, the theory that market makers and institutions short options move stocks to the point where the greatest dollar value of contracts will expire) and the reduction dealer gamma exposure.

About

After years of self-education, strategy development, mentorship, and trial-and-error, Renato Leonard Capelj began trading full-time and founded Physik Invest to detail his methods, research, and performance in the markets.

Capelj is also a Benzinga finance and technology reporter interviewing the likes of Shark Tank’s Kevin O’Leary, JC2 Ventures’ John Chambers, FTX’s Sam Bankman-Fried, and ARK Invest’s Catherine Wood, as well as a SpotGamma contributor developing insights around impactful options market dynamics.

Disclaimer

Physik Invest does not carry the right to provide advice.

In no way should the materials herein be construed as advice. Derivatives carry a substantial risk of loss. All content is for informational purposes only.

Categories
Commentary

Daily Brief For January 3, 2022

What Happened

Overnight, equity index futures auctioned higher. Ahead is data on Markit Manufacturing PMI (9:45 AM ET) and Construction Spending (10:00 AM ET).

Graphic updated 6:20 AM ET. Sentiment Risk-On if expected /ES open is above the prior day’s range. /ES levels are derived from the profile graphic at the bottom of the following section. Levels may have changed since initially quoted; click here for the latest levels. SqueezeMetrics Dark Pool Index (DIX) and Gamma (GEX) calculations are based on where the prior day’s reading falls with respect to the MAX and MIN of all occurrences available. A higher DIX is bullish. At the same time, the lower the GEX, the more (expected) volatility. Learn the implications of volatility, direction, and moneyness. SHIFT data used for S&P 500 (INDEX: SPX) options activity. Note that options flow is sorted by the call premium spent; if more positive then more was spent on call options. Breadth reflects a reading of the prior day’s NYSE Advance/Decline indicator. VIX reflects a current reading of the CBOE Volatility Index (INDEX: VIX) from 0-100.

What To Expect

Technicals: Given the Monday gap, the S&P 500, based on its relation to Thursday’s failed balance breakout and end-of-week liquidation, is positioned for sideways-to-higher.

To note, however, the persistence of responses to technical levels, weaker-handed participants (which seldom bear the wherewithal to defend retests) carry a heavier hand in recent discovery.

Via volume profile analysis, we see a plethora of low-volume pockets – voids – that likely hold virgin tests. Successful penetration often portends follow-through as the participants that were most active at those levels (quickly run for the exits when wrong).

Graphic: Weekly chart for the S&P 500 (top left), Nasdaq 100 (top right), Russell 2000 (bottom left), and Dow Jones Industrial Average (bottom right). Technically, indices are still positioned for sideways or higher.

Fundamental: The aforementioned trade is happening in the context of higher valuations, interest rates, and tax rates, according to Morgan Stanley (NYSE: MS).

These themes serve as a headwind.

To elaborate, as Nordea recently explained, the Fed will “accelerate its tapering process, and is now set to conclude net purchases already by mid-March vs mid-June with the earlier pace.”

“The dot plot was revised significantly higher, and the plot now shows three hikes for next year, a further three for 2023 and another two for 2024.”

Graphic: The “annual rate of change in the Fed Funds rate” via topdowncharts.com.

At the same time, equity markets tend to rally into the first hike; Moody’s Corporation’s (NYSE: MCO) forecast aligns with that – “the Dow Jones Industrial Average increases this quarter and peaks in early 2022, … [followed by] steady decline through 2022.”

Graphic: S&P 500 performance before and after rate hikes.

Why? Rising rates, among other factors, have the potential to decrease the present value of future earnings, thereby making stocks, especially those that are high growth, less attractive.

“Our view is that 2022 will be the year of a full global recovery, an end of the global pandemic, and a return to normal conditions we had prior to the Covid-19 outbreak,” JPMorgan Chase & Co (NYSE: JPM) noted

“We believe this will produce a strong cyclical recovery, a return of global mobility, and strong growth in consumer and corporate spending, within the backdrop of still-easy monetary policy.”

Positioning: According to JPMorgan Chase & Co, “S&P 500 skew overprices downside and underprices upside probabilities relative to historical returns.”

Graphic: Via The Market Ear, JPMorgan’s analysis suggests downside protection is overpriced.

This is all the while the S&P 500’s implied volatility remains above pre-COVID levels.

“SPX implied volatility is well above its pre-Covid level across the term structure.” The compression of volatility lowers the counterparties’ exposure to the positive delta. This “vanna” flow may support higher prices.

Taken together (in the face of last week’s options expiration which reduced the level of positive sticky options gamma concentrated mostly at the $4,800.00 level in the S&P 500), current options positioning and buying pressure supports a seasonally-aligned price rise in January.

Explanation: As a position’s delta rises with underlying price rises, gamma (or how an option’s delta is expected to change given a change in the underlying) is added to the delta. Counterparties are to offset gamma by adding liquidity to the market (i.e., buy dips, sell rips).
Graphic: SpotGamma data suggests the pin heading into Friday’s options expiration is no more.

The continued compression of volatility will only serve to bolster any price rise as “hedging vanna and charm flows, and whatnot will push the markets higher.”

Should that thesis not pan out – meaning the removal of hedging pressures associated with “put-heavy” single stock options positions and an end to tax-loss harvesting, among other factors – indices likely succumb to the “stealth correction” of its lesser weighted constituents.

Were participants to reach for downside protection, the implications of this would be staggering. In such a case, markets will tend toward instability. At present, the metrics don’t point to this.

Graphic: Via The Market Ear, amidst heightened cash allocations that are likely to be redeployed, “January is the big inflow month but the seasonality from here is looking less exciting.”

Expectations: As of 6:20 AM ET, Monday’s regular session (9:30 AM – 4:00 PM ET), in the S&P 500, will likely open in the upper part of a positively skewed overnight inventory, outside of prior-range and -value, suggesting a potential for immediate directional opportunity.

Gap Scenarios: Gaps ought to fill quickly. Should they not, that’s a signal of strength; do not fade. Leaving value behind on a gap-fill or failing to fill a gap (i.e., remaining outside of the prior session’s range) is a go-with indicator.

Auctioning and spending at least 1-hour of trade back in the prior range suggests a lack of conviction; in such a case, do not follow the direction of the most recent initiative activity.

In the best case, the S&P 500 trades higher; activity above the $4,791.00 untested point of control (VPOC) puts in play the $4,799.75 regular trade high (RTH High). Initiative trade beyond the RTH High could reach as high as the $4,805.00 and $4,815.00 extensions, or higher.

In the worst case, the S&P 500 trades lower; activity below the $4,791.00 VPOC puts in play the $4,781.75 high volume area (HVNode). Initiative trade beyond the HVNode could reach as low as the $4,767.00 VPOC and $4,750.75 overnight low (ONL), or lower.

Click here to load today’s key levels into the web-based TradingView charting platform. Note that all levels are derived using the 65-minute timeframe. New links are produced, daily.
Graphic: 65-minute profile chart of the Micro E-mini S&P 500 Futures.

What People Are Saying

Definitions

Overnight Rally Highs (Lows): Typically, there is a low historical probability associated with overnight rally-highs (lows) ending the upside (downside) discovery process.

Volume Areas: A structurally sound market will build on areas of high volume (HVNodes). Should the market trend for long periods of time, it will lack sound structure, identified as low volume areas (LVNodes). LVNodes denote directional conviction and ought to offer support on any test. 

If participants were to auction and find acceptance into areas of prior low volume (LVNodes), then future discovery ought to be volatile and quick as participants look to HVNodes for favorable entry or exit.

Gamma: Gamma is the sensitivity of an option to changes in the underlying price. Dealers that take the other side of options trades hedge their exposure to risk by buying and selling the underlying. When dealers are short-gamma, they hedge by buying into strength and selling into weakness. When dealers are long-gamma, they hedge by selling into strength and buying into weakness. The former exacerbates volatility. The latter calms volatility.

Vanna: The rate at which the delta of an option changes with respect to volatility.

Charm: The rate at which the delta of an option changes with respect to time.

POCs: POCs are valuable as they denote areas where two-sided trade was most prevalent in a prior day session. Participants will respond to future tests of value as they offer favorable entry and exit.

MCPOCs: POCs are valuable as they denote areas where two-sided trade was most prevalent over numerous day sessions. Participants will respond to future tests of value as they offer favorable entry and exit.

Options Expiration (OPEX): Traditionally, option expiries mark an end to pinning (i.e, the theory that market makers and institutions short options move stocks to the point where the greatest dollar value of contracts will expire) and the reduction dealer gamma exposure.

Excess: A proper end to price discovery; the market travels too far while advertising prices. Responsive, other-timeframe (OTF) participants aggressively enter the market, leaving tails or gaps which denote unfair prices.

About

After years of self-education, strategy development, mentorship, and trial-and-error, Renato Leonard Capelj began trading full-time and founded Physik Invest to detail his methods, research, and performance in the markets.

Capelj is also a Benzinga finance and technology reporter interviewing the likes of Shark Tank’s Kevin O’Leary, JC2 Ventures’ John Chambers, FTX’s Sam Bankman-Fried, and ARK Invest’s Catherine Wood, as well as a SpotGamma contributor developing insights around impactful options market dynamics.

Disclaimer

At this time, Physik Invest does not carry the right to provide advice. 

In no way should the materials herein be construed as advice. Derivatives carry a substantial risk of loss. All content is for informational purposes only.

Categories
Commentary

Daily Brief For December 2, 2021

What Happened

Overnight, equity index futures steadied at the prior day’s lows

There were signs of a shift in relative strength as the Russell 2000’s extended-day recovery outpaced that of the S&P 500 and (now) weaker Nasdaq 100. 

At the same time, yields on the ten-year rose while volatility came in. Still, the VIX futures term structure remained higher, a clear indication of stress, in the face of demand for protection.

Ahead is data on jobless claims (8:30 AM ET) with Fed-speak scattered throughout the day.

Graphic updated 6:40 AM ET. Sentiment Neutral if expected /ES open is inside of the prior day’s range. /ES levels are derived from the profile graphic at the bottom of the following section. Levels may have changed since initially quoted; click here for the latest levels. SqueezeMetrics Dark Pool Index (DIX) and Gamma (GEX) calculations are based on where the prior day’s reading falls with respect to the MAX and MIN of all occurrences available. A higher DIX is bullish. At the same time, the lower the GEX, the more (expected) volatility. Learn the implications of volatility, direction, and moneyness. SHIFT data used for S&P 500 (INDEX: SPX) options activity. Note that options flow is sorted by the call premium spent; if more positive then more was spent on call options. Breadth reflects a reading of the prior day’s NYSE Advance/Decline indicator. VIX reflects a current reading of the CBOE Volatility Index (INDEX: VIX) from 0-100.

What To Expect

On nonparticipatory breadth and weak market liquidity metrics, the worst-case outcome occurred, evidenced by the S&P 500’s spike away from the value (i.e., the prices at which 70% of the day’s volume occurred).

The knee-jerk selling, which coincided with news that a COVID-19 variant was spotted in the U.S., broke the S&P 500 out of a short-term consolidation (i.e., balance) area. 

The developing balance was a result of participants looking for new information to base a directional move. With new information, participants chose downside price exploration.

Adding, the knee-jerk selling and associated price action left behind poor structure (i.e., participants will look to validate [or invalidate] the move, spending time below [or above] the ~$4,574.25 spike base). Caution is warranted on overnight validation of the spike. 

Graphic: Supportive delta (i.e., committed selling as measured by volume delta or buying and selling power as calculated by the difference in volume traded at the bid and offer) in SPDR S&P 500 ETF Trust (NYSE: SPY), one of the largest ETFs that track the S&P 500 index, via Bookmap. The readings are supportive of initiative trade (i.e., directional trade that suggests current prices offer unfavorable entry and exit; the market is seeking balance).

Context: A resurgence in COVID-19, a change in tone with respect to monetary policy, and last-minute tax-selling, in the face of seasonally-bullish buybacks and new month inflows.

The implications of these themes on price are contradictory. 

As stated, yesterday, the Federal Reserve’s Jerome Powell unexpectedly changed his tone around inflation, becoming more open to a faster taper in bond-buying and rate hikes. 

This is as policymakers look to tame price readings without inhibiting economic growth; fears of the aforementioned change in tone were clearly spotted by the bond market’s pricing of risk, so to speak, diverging from that of the equity market, weeks before current volatility.

Graphic: “The ICE BofA MOVE Index, which measures implied volatility for Treasuries, is close to the steepest level since April 2020,” via Bloomberg.

Rising rates, among other factors, have the potential to decrease the present value of future earnings, thereby making stocks, especially those that are high growth, less attractive to own.

As the market is a forward-looking mechanism, the implications of this are staggering. 

Prevailing monetary frameworks and max liquidity promoted a large divergence in price from fundamentals. The growth of passive investing – the effect of increased moneyness among nonmonetary assets – and derivatives trading imply a lot of left-tail risks.

Graphic: Via The Market Ear, “Bank of America estimates that corporate earnings used to explain half of equity market returns up to the financial crisis, but since then they only explain 21%. Meanwhile, changes to the Fed’s balance sheet explain 52% of market returns since 2010, it estimates. Buy what the FED buys. Sell what the FED stops buying.”

As Kai Volatility’s Cem Karsan once told me: “There’s this constant structural positioning that naturally drives markets higher as long as volatility is compressed,” or there is supply.

“At the end of the day, though, the higher you go, the further off the ground you are and the more tail risk.”

Eventually, the fear on the part of bond market participants fed into equity market positioning; breadth weakened for weeks into November’s large monthly options expiration, after which the absence of sticky and supportive hedging flows finally freed the market for directional resolve. 

Couple that with participants being “underexposed to downside put protection,” according to SpotGamma, there was an expectation that there could be a rough re-pricing of tail risk as participants, en masse, sought after highly “convex” downside options which had the counterparties to those trades exacerbating underlying price movement.

Per the VIX term structure graphic below, there is tons of movement in the front-end, a sign that participants are concentrating activity in shorter-dated tenors where the sensitivity of options to direction is higher.

Graphic: VIX term structure. 

So long as this dynamic remains, participants can expect instability.

In assuaging fears, however, Moody’s Corporation (NYSE: MCO) put out research that found “information about the variant and the policy actions taken to date do not yet support a material shift” in forecasts.

This is as S&P Global Inc (NYSE: SPGI), despite lowering growth forecasts a touch, expects GDP to reach a 37-year high in 2021. With odds that it will likely take the next few weeks to find out more with respect to the severity of new COVID-19 variants, attention moves to “cyclicals, commodities, and reopening themes,” according to JPMorgan Chase & Co’s (NYSE: JPM) Marko Kolanovic. 

Graphic: Via Bloomberg, “there is ‘plenty of liquidity available to drive stock prices higher as dip-buyers enter the market,’” strategists at Yardeni Research, wrote.

Expectations: As of 6:40 AM ET, Thursday’s regular session (9:30 AM – 4:00 PM ET), in the S&P 500, will likely open in the lower part of a positively skewed overnight inventory, inside of prior-range and -value, suggesting a limited potential for immediate directional opportunity.

Spike Rules In Play: Spike’s mark the beginning of a break from value. Spikes higher (lower) are validated by trade at or above (below) the spike base (i.e., the origin of the spike).

In the best case, the S&P 500 trades sideways or higher; activity above the $4,551.75 low volume area (LVNode) puts in play the $4,574.25 high volume area (HVNode). Initiative trade beyond the HVNode could reach as high as the $4,629.00 untested point of control (VPOC) and $4,674.25 micro composite point of control (MCPOC), or higher.

In the worst case, the S&P 500 trades lower; activity below the $4,551.75 low volume area (LNVode) puts in play the $4,497.75 regular-trade low (RTH Low). Initiative trade beyond the RTH Low could reach as low as the $4,471.00 and $4,425.00 VPOC, or lower.

Click here to load today’s updated key levels into the web-based TradingView charting platform. Note that all levels are derived using the 65-minute timeframe. New links are produced, daily.
Graphic: 65-minute profile chart of the Micro E-mini S&P 500 Futures. Learn about the profile.

Charts To Watch

Graphic: (NYSE: SPY). (S~$448, $438 and R~$454, $460). S is for support. R is for resistance.

Definitions

Volume Areas: A structurally sound market will build on areas of high volume (HVNodes). Should the market trend for long periods of time, it will lack sound structure, identified as low volume areas (LVNodes). LVNodes denote directional conviction and ought to offer support on any test. 

If participants were to auction and find acceptance into areas of prior low volume (LVNodes), then future discovery ought to be volatile and quick as participants look to HVNodes for favorable entry or exit.

POCs: POCs are valuable as they denote areas where two-sided trade was most prevalent in a prior day session. Participants will respond to future tests of value as they offer favorable entry and exit.

MCPOCs: POCs are valuable as they denote areas where two-sided trade was most prevalent over numerous day sessions. Participants will respond to future tests of value as they offer favorable entry and exit.

Options Expiration (OPEX): Traditionally, option expiries mark an end to pinning (i.e, the theory that market makers and institutions short options move stocks to the point where the greatest dollar value of contracts will expire) and the reduction dealer gamma exposure.

Price Discovery (One-Timeframe Or Trend): Elongation and range expansion denotes a market seeking new prices to establish value, or acceptance (i.e., more than 30-minutes of trade at a particular price level). 

Balance (Two-Timeframe Or Bracket): Rotational trade that denotes current prices offer favorable entry and exit. Balance-areas make it easy to spot a change in the market (i.e., the transition from two-time frame trade, or balance, to one-time frame trade, or trend). 

Modus operandi is responsive trade (i.e., fade the edges), rather than initiative trade (i.e., play the break).

Value-Area Placement: Perception of value unchanged if value overlapping (i.e., inside day). Perception of value has changed if value not overlapping (i.e., outside day). Delay trade in the former case.

About

After years of self-education, strategy development, and trial-and-error, Renato Leonard Capelj began trading full-time and founded Physik Invest to detail his methods, research, and performance in the markets.

Additionally, Capelj is a Benzinga finance and technology reporter interviewing the likes of Shark Tank’s Kevin O’Leary, JC2 Ventures’ John Chambers, and ARK Invest’s Catherine Wood, as well as a SpotGamma contributor, developing insights around impactful options market dynamics.

Disclaimer

At this time, Physik Invest does not manage outside capital and is not licensed. In no way should the materials herein be construed as advice. Derivatives carry a substantial risk of loss. All content is for informational purposes only.