
The daily brief is a free glimpse into the prevailing fundamental and technical drivers of U.S. equity market products. Join the 750+ that read this report daily, below!
Fundamental
A heavy week content-wise.
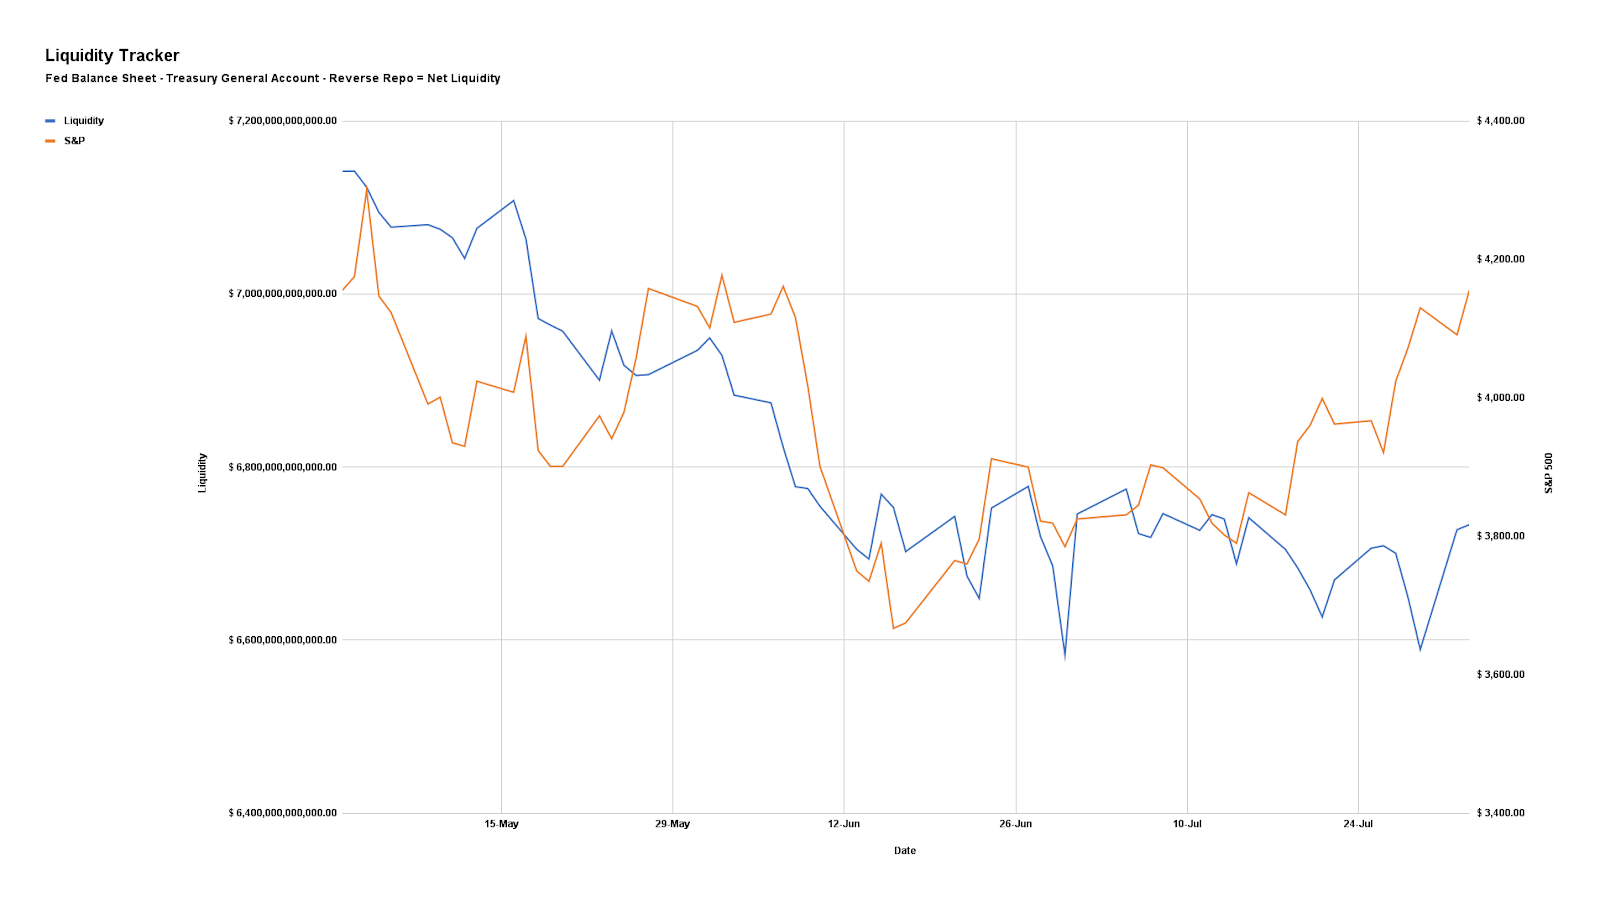
Monday, we talked about some of the big narratives participants are seeking to price. Tuesday and Wednesday we elaborated, providing information on the calculation of net liquidity and its relationship with equity index prices, as well as the probable paths the economy may traverse.
Today, we’ll add context with respect to some of the big headlines heading into today’s trade.
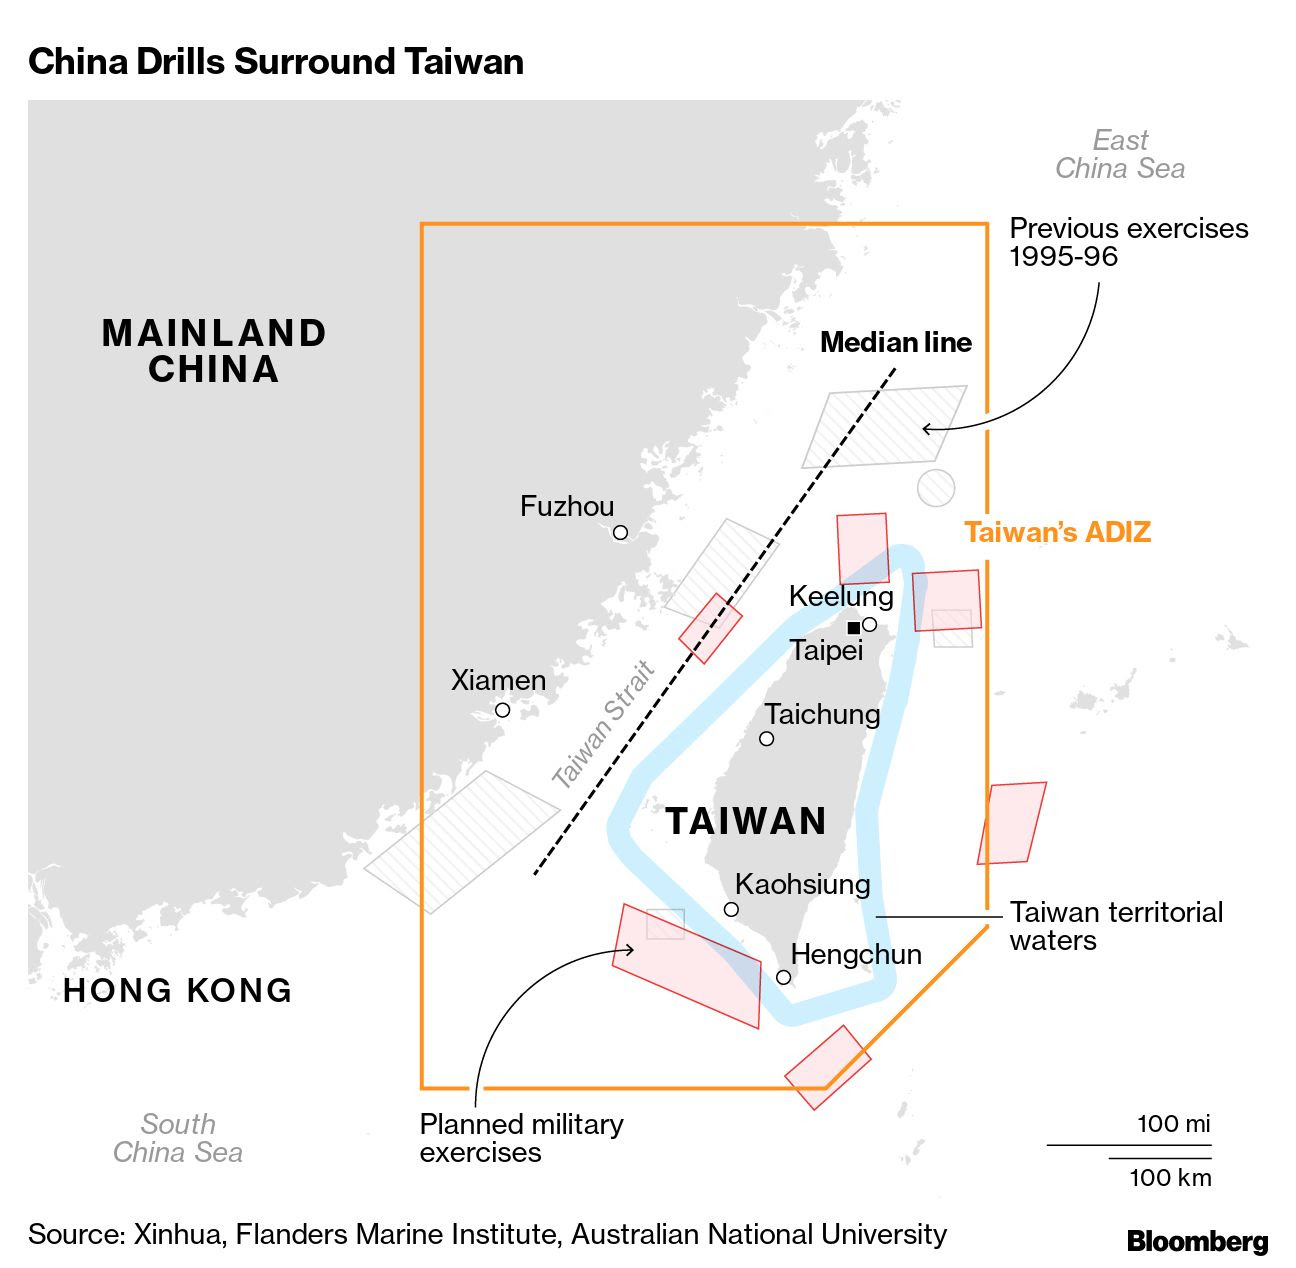
At the top of the list is geopolitical tension. US House Speaker Nancy Pelosi traveled to Taiwan.
It’s the case that “China views Taiwan as a breakaway island” subject to mainland rules. The visit by Pelosi, who, per NPR, “has long been a critic of China and an advocate for Taiwan’s democracy,” China viewed as a provocation.
Accordingly, China responded with trade boycotts and military exercises such as the firing of 11 missiles into the sea around Taiwan.
White House officials, per Bloomberg, were said to be “fuming” at Pelosi. In response, the Biden administration was seeking to put brakes on friendlier US and Taiwan policies.
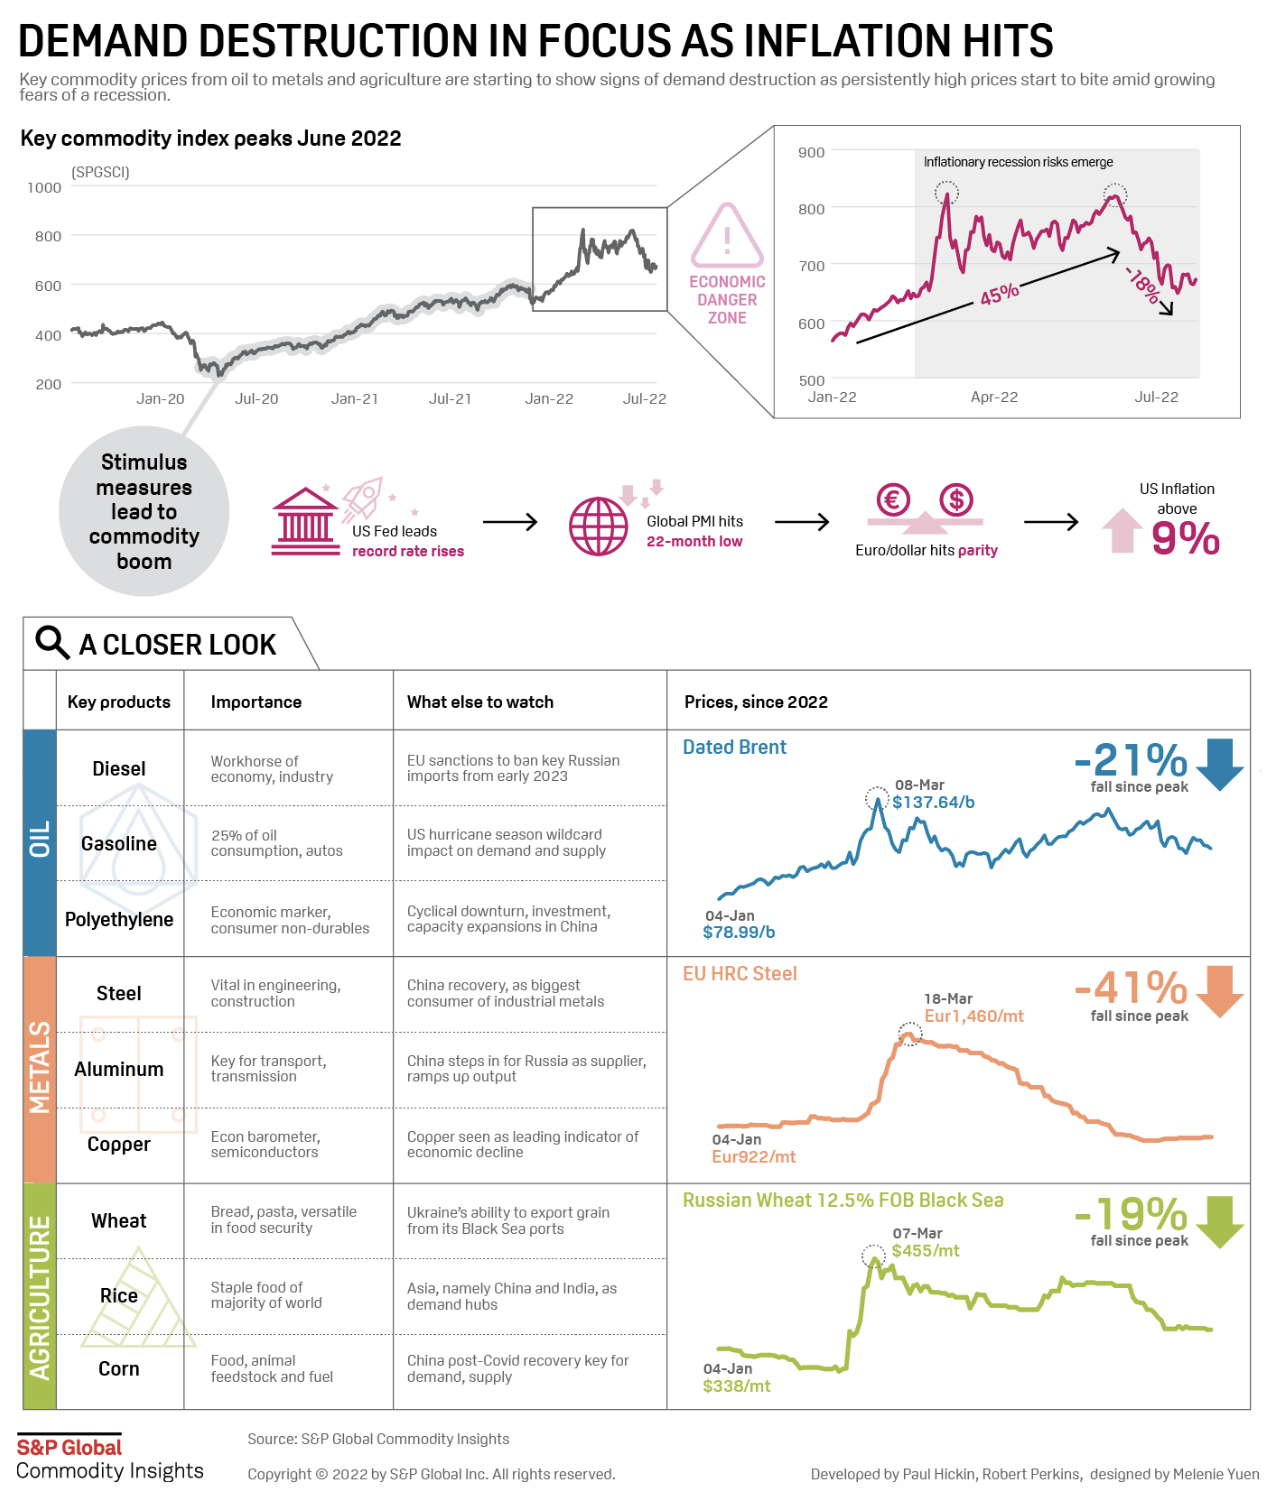
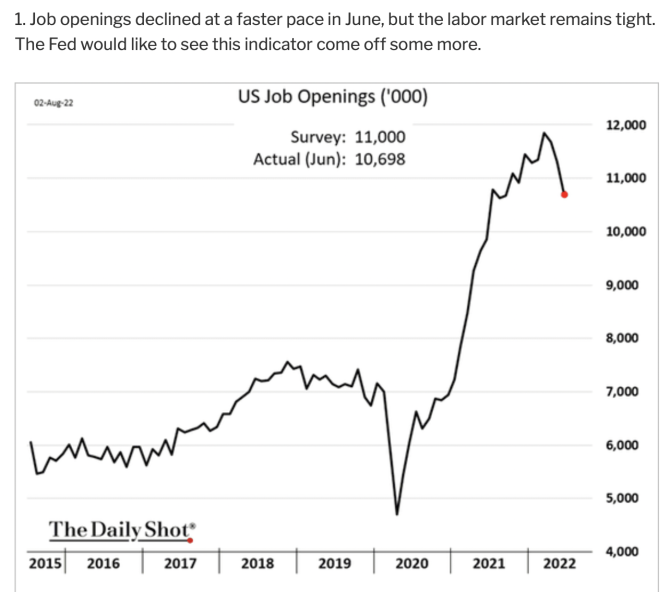
In other news, an ISM Services reading climbed unexpectedly, easing the concern of economic slowing while other data showed material and commodity prices falling.
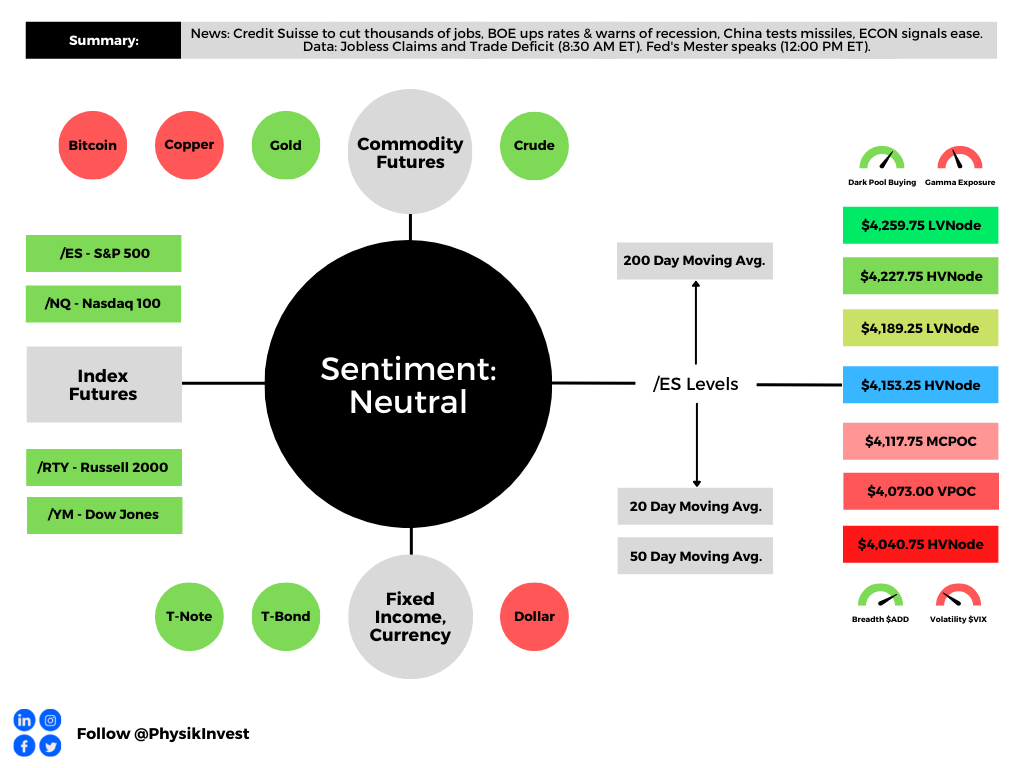
Still, more firms, from the likes of Credit Suisse Group AG (NYSE: CS) to Robinhood Markets Inc (NASDAQ: HOOD), are seeking to cut thousands of jobs and restructure.
And, though equity markets are enjoying some relief, profit forecasts continue to be cut, and broad measures of the supply of money are falling.
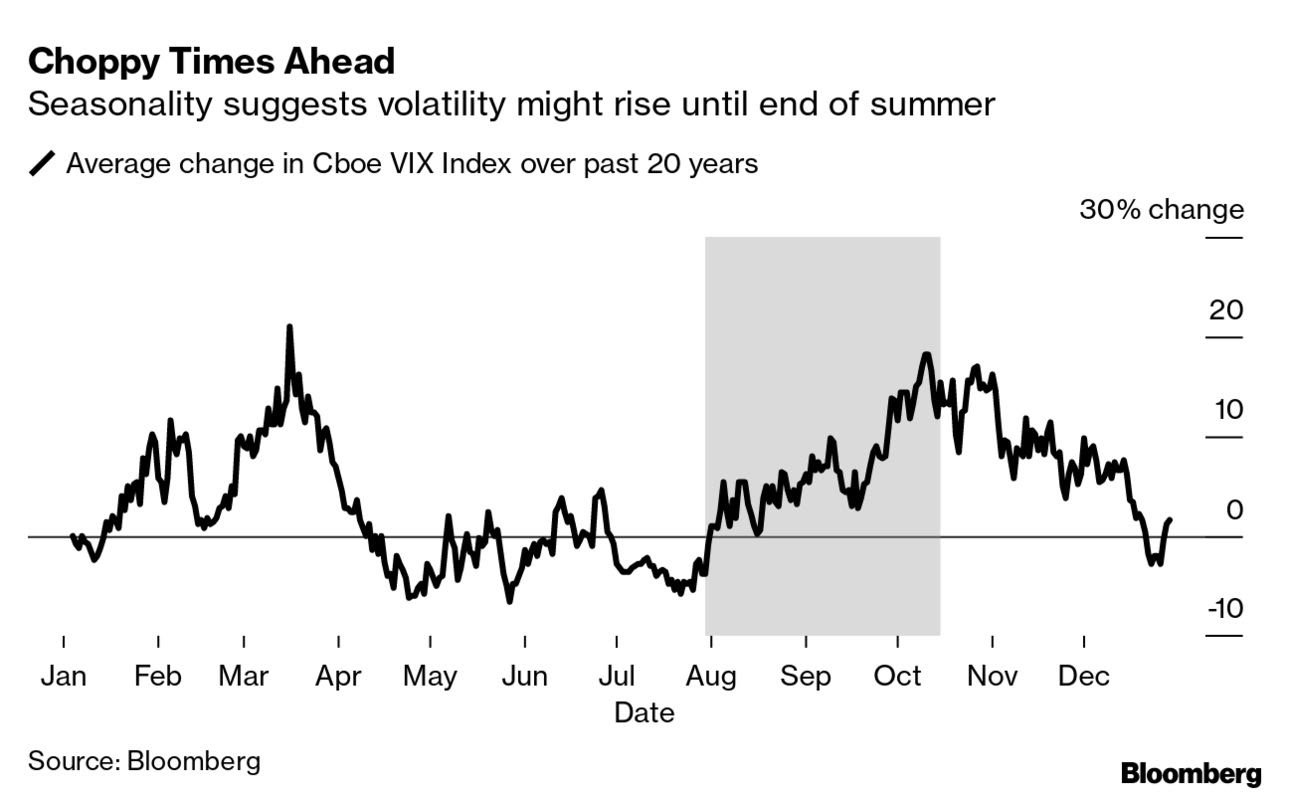
Additionally, many maintain that conditions are set to get tighter with the Bank of England raising rates the most since 1995 and a Fed funds rate of 5-6% not out of the realm of possibilities.
Positioning
As of 7:10 AM ET, Thursday’s expected volatility, via the Cboe Volatility Index (INDEX: VIX), sits at ~1.14%. Net gamma exposures increasing may promote tighter ranges at higher price levels.
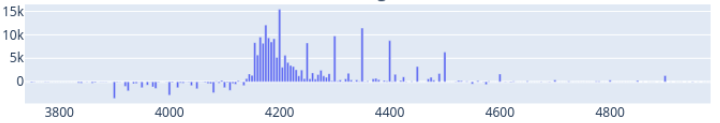
Context: Customers concentrate bets at and above current S&P 500 (INDEX: SPX) prices.

Taking the naive view and assuming this activity is, indeed, aligned with historical trends (i.e., customers sell calls and use those proceeds to finance protection, down below), then counterparts are likely taking on exposure to more long call positions, which they hedge by selling underlying. Into strength, some more underlying will be sold. Into weakness, some underlying will be bought. This activity can promote mean-reversion at higher prices.
As well put in our August 3 letter, given where realized (RVOL) and implied (IVOL) volatility are, as well as skew, it is beneficial to be a buyer of options structures (e.g., put back spread).

According to SpotGamma, “data suggests markets have entered into a period of normalization” and “IVOL likely reached a lower bound (see the bid skew).”
“To maintain a risk-on (rally) environment, traders would need to position themselves into call options, now, further up in price, farther out in time, which they seem to be doing, albeit in not overly significant quantities.”
Notwithstanding, as SpotGamma adds, “with participants getting rid of commodity inflation and long volatility hedges that performed poorly, [this] (1) leaves equity markets more susceptible to the whims of potentially negative underlying macro forces and (2) leaves volatility markets more prone to jumps.”
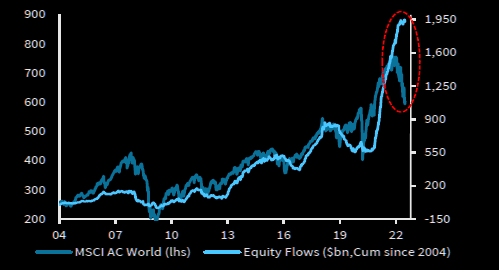
Thus far, it’s the case that we’re far more than halfway through a dot-com type collapse that’s happened “underneath the surface of the indices,” per Simplify Asset Management’s Mike Green. Should those strong passive flows falter, that likely takes from some of the support in the largest of index constituents.
Were the latter to happen, you’d want protection in the form of structures that would enable you to monetize on some sort-of non-linear repricing in volatility (e.g., butterflies and back spreads), should participants seek protection in a way they haven’t this year.
If nothing were to happen, the bid in skew would, at least, assist those structures in maintaining their value better, essentially.
Technical
As of 7:00 AM ET, Thursday’s regular session (9:30 AM – 4:00 PM ET), in the S&P 500, is likely to open in the upper part of a positively skewed overnight inventory, just inside of prior-range and -value, suggesting a limited potential for immediate directional opportunity.
In the best case, the S&P 500 trades higher.
Any activity above the $4,153.25 HVNode puts into play the $4,189.25 LVNode. Initiative trade beyond the LVNode could reach as high as the $4,227.75 HVNode and $4,259.75 LVNode, or higher.
In the worst case, the S&P 500 trades lower.
Any activity below the $4,153.25 HVNode puts into play the $4,117.75 MCPOC. Initiative trade beyond the MCPOC could reach as low as the $4,073.00 VPOC and $4,040.75 HVNode, or lower.
Click here to load today’s key levels into the web-based TradingView charting platform. Note that all levels are derived using the 65-minute timeframe. New links are produced, daily.

Considerations: Responsiveness near key-technical areas (that are discernable visually on a chart), suggests technically-driven traders with short time horizons are very active.
Such traders often lack the wherewithal to defend retests and, additionally, the type of trade may be indicative of the other time frame participants waiting for more information to initiate trades.
Definitions
Volume Areas: A structurally sound market will build on areas of high volume (HVNodes). Should the market trend for long periods of time, it will lack sound structure, identified as low volume areas (LVNodes). LVNodes denote directional conviction and ought to offer support on any test.
If participants were to auction and find acceptance into areas of prior low volume (LVNodes), then future discovery ought to be volatile and quick as participants look to HVNodes for favorable entry or exit.
POCs: POCs are valuable as they denote areas where two-sided trade was most prevalent in a prior day session. Participants will respond to future tests of value as they offer favorable entry and exit.
MCPOCs: POCs are valuable as they denote areas where two-sided trade was most prevalent over numerous day sessions. Participants will respond to future tests of value as they offer favorable entry and exit.
Volume-Weighted Average Prices (VWAPs): A metric highly regarded by chief investment officers, among other participants, for quality of trade. Additionally, liquidity algorithms are benchmarked and programmed to buy and sell around VWAPs.
About
After years of self-education, strategy development, mentorship, and trial-and-error, Renato Leonard Capelj began trading full-time and founded Physik Invest to detail his methods, research, and performance in the markets.
Capelj also develops insights around impactful options market dynamics at SpotGamma and is a Benzinga reporter.
Some of his works include conversations with ARK Invest’s Catherine Wood, investors Kevin O’Leary and John Chambers, FTX’s Sam Bankman-Fried, ex-Bridgewater Associate Andy Constan, Kai Volatility’s Cem Karsan, The Ambrus Group’s Kris Sidial, among many others.
Disclaimer
In no way should the materials herein be construed as advice. Derivatives carry a substantial risk of loss. All content is for informational purposes only.


