
The daily brief is a free glimpse into the prevailing fundamental and technical drivers of U.S. equity market products. Join the 300+ that read this report daily, below!
What Happened
Overnight, equity index and commodity futures were higher while bonds were lower. Volatility measures were bid, too.
In the news is Russia’s default on foreign debts. Quarterly repositioning may bolster attempts higher, per JPMorgan Chase & Co (NYSE: JPM), while Morgan Stanley (NYSE: MS) strategists see the potential for lower with base cases calling for a soft economic landing.
Ahead is data on goods orders (8:30 AM ET) and pending home sales (10:00 AM ET).
What To Expect
Fundamental: Very short, today.
Later this week, I’m excited to share some insights I gleaned from a veteran trader and macro strategist. As a preview, this person thinks that we are in a recession. However, a recovery in equity markets is not off the table with 2022 likely being a 1% total GPD year with 4% inflation.
Stay tuned for that.
Positioning: We’ve been speaking on the demand for protection and the still-strong supply of it lending to tameness in Wall Street’s preferred “fear gauge,” relative to those gauges tracking markets like rates and commodities.
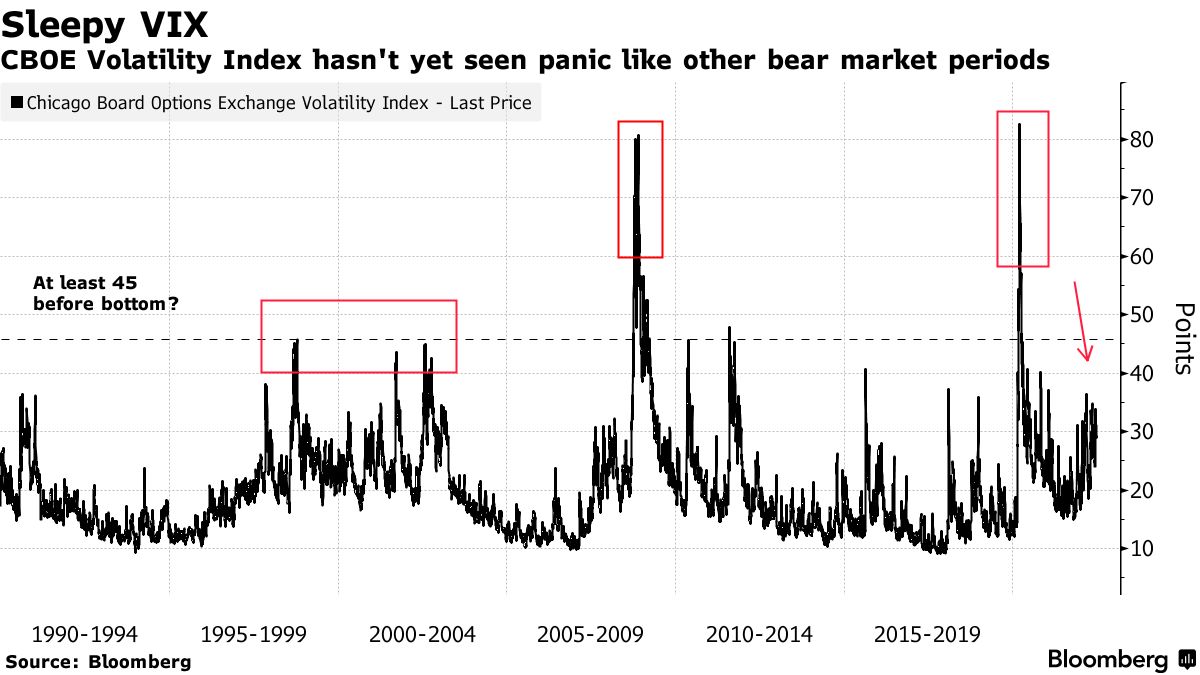
“The current behavior is playing out similar to the 2000-2002 dot-com bear market, with no big sudden shocks but sustained high realized volatility,” explained Talal Dehbi of PrismFP.
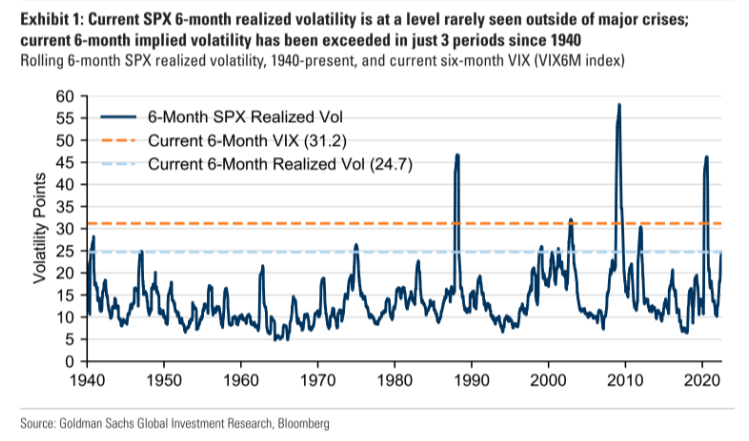
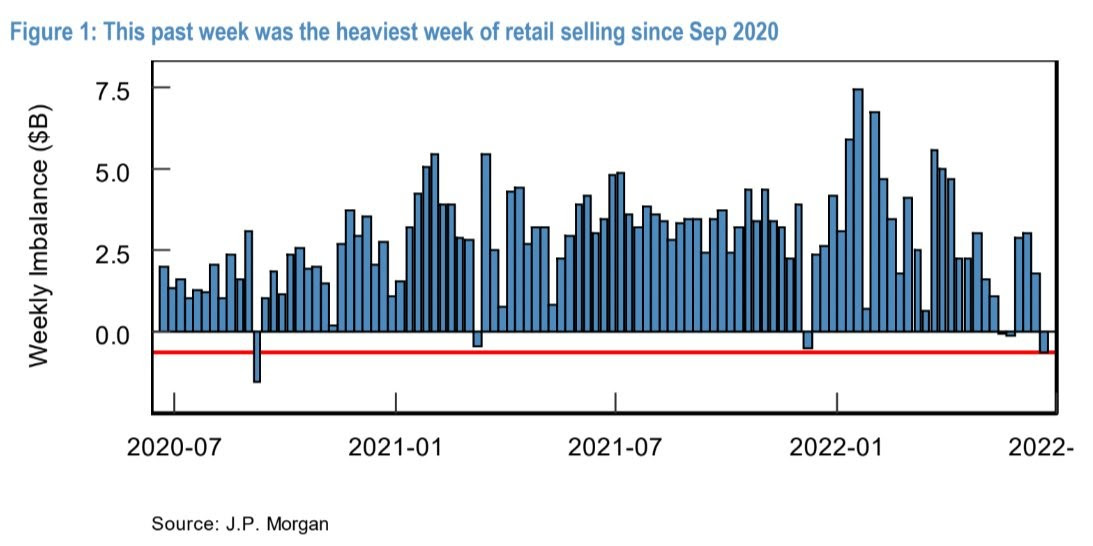
Options data and insights platform SqueezeMetrics explained that this is due in part to lower leverage, too.
“Leveraged long S&P lost favor (understandable), and marginal demand for puts went with it. Creeping into net selling territory is ‘smart’ bear market positioning. Short delta, short skew.”
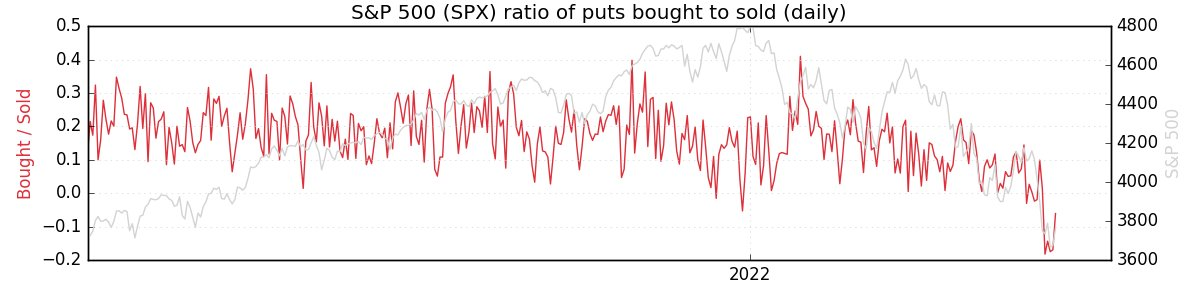
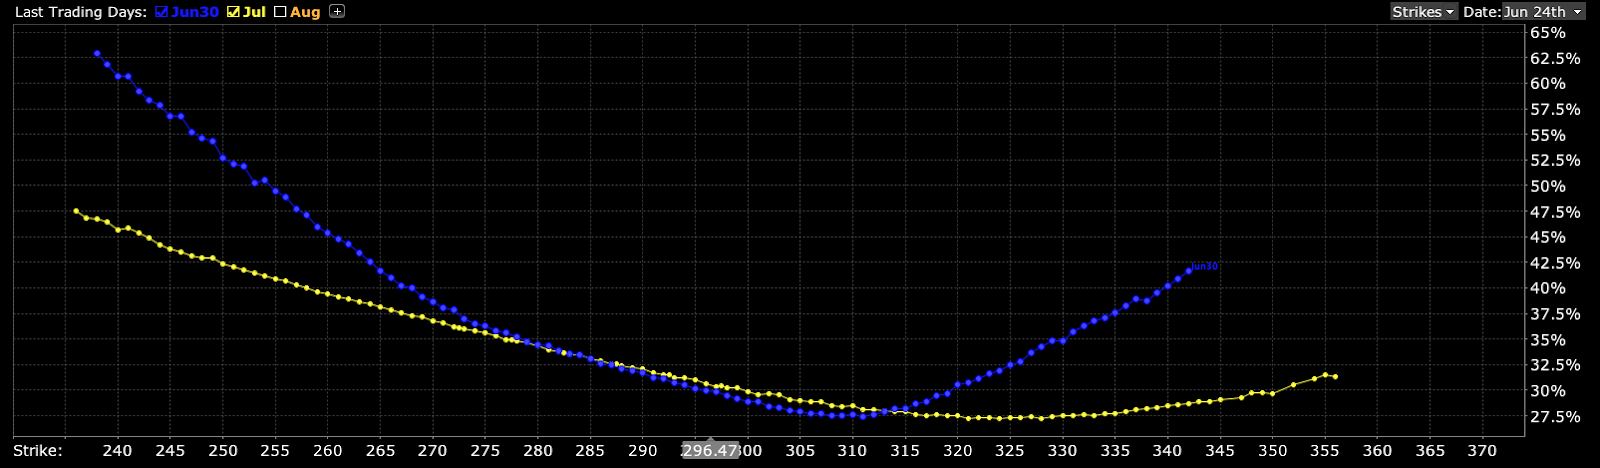
Anyways, noteworthy is the sale of short-dated volatility, and this has played into generally poor performance in skew. In light of that, it makes sense to lean toward owning volatility, rather than selling it.

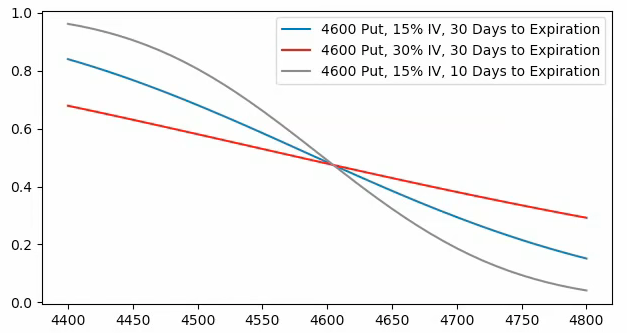
The note to point out, here, is – and this is in accordance with some very recent notes – that a “higher starting point” in IVOL, and a still-present right-tail, makes it so we may position, for less cost, in shorter-dated spread structures with attractive and asymmetric payouts.
Heading into the end of the quarter is the expected rollover of large options positions. These are hedges to customer long-equity exposure, which the liquidity providers are short. A front-running of this repositioning flow is (and is expected), in part, to add to the equity market upside.
Per SpotGamma, after expiration, “it is more likely the [bearish] tone [all else equal] remains unchanged at least from a positioning perspective,” albeit many metrics appear a tad stretched.
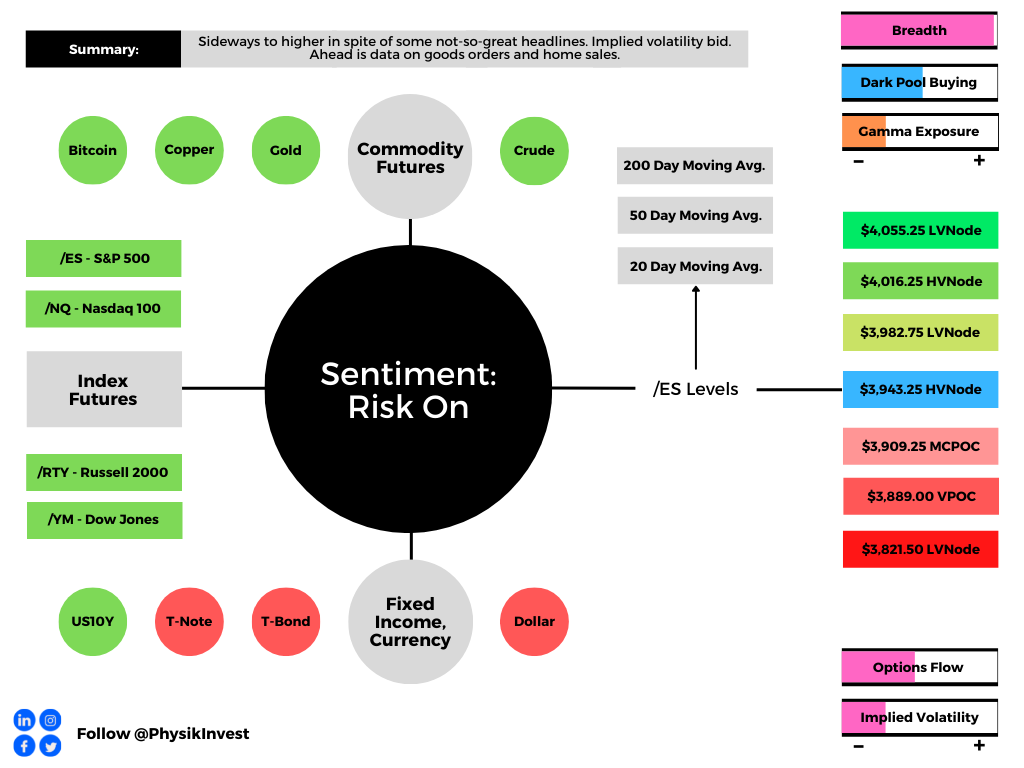
Technical: As of 6:30 AM ET, Monday’s regular session (9:30 AM – 4:00 PM ET), in the S&P 500, will likely open in the middle part of a positively skewed overnight inventory, outside of prior-range and -value, suggesting a potential for immediate directional opportunity.
In the best case, the S&P 500 trades higher; activity above the $3,943.25 HVNode puts in play the $3,982.75 LVNode. Initiative trade beyond the LVNode could reach as high as the $4,016.25 HVNode and $4,055.25 LVNode, or higher.
In the worst case, the S&P 500 trades lower; activity below the $3,943.25 HVNode puts in play the $3,909.25 MCPOC. Initiative trade beyond the $3,909.25 MCPOC could reach as low as the $3,889.00 VPOC and $3,821.50 LVNode, or lower.
Click here to load today’s key levels into the web-based TradingView charting platform. Note that all levels are derived using the 65-minute timeframe. New links are produced, daily.

Gap Scenarios In Play: Gaps ought to fill quickly. Should they not, that’s a signal of strength; do not fade. Leaving value behind on a gap-fill or failing to fill a gap (i.e., remaining outside of the prior session’s range) is a go-with indicator.
Auctioning and spending at least 1-hour of trade back in the prior range suggests a lack of conviction; in such a case, do not follow the direction of the most recent initiative activity.
Definitions
A structurally sound market will build on areas of high volume (HVNodes). Should the market trend for long periods of time, it will lack sound structure, identified as low volume areas (LVNodes). LVNodes denote directional conviction and ought to offer support on any test.
If participants were to auction and find acceptance into areas of prior low volume (LVNodes), then future discovery ought to be volatile and quick as participants look to HVNodes for favorable entry or exit.
Also, MCPOCs are valuable as they denote areas where two-sided trade was most prevalent over numerous day sessions. Participants will respond to future tests of value as they offer favorable entry and exit.
About
After years of self-education, strategy development, mentorship, and trial-and-error, Renato Leonard Capelj began trading full-time and founded Physik Invest to detail his methods, research, and performance in the markets.
Capelj also develops insights around impactful options market dynamics at SpotGamma and is a Benzinga reporter.
Some of his works include conversations with ARK Invest’s Catherine Wood, investors Kevin O’Leary and John Chambers, FTX’s Sam Bankman-Fried, Kai Volatility’s Cem Karsan, The Ambrus Group’s Kris Sidial, among many others.
Disclaimer
In no way should the materials herein be construed as advice. Derivatives carry a substantial risk of loss. All content is for informational purposes only.


