The daily brief is a free glimpse into the prevailing fundamental and technical drivers of U.S. equity market products. Join the 750+ that read this report daily, below!
Fundamental
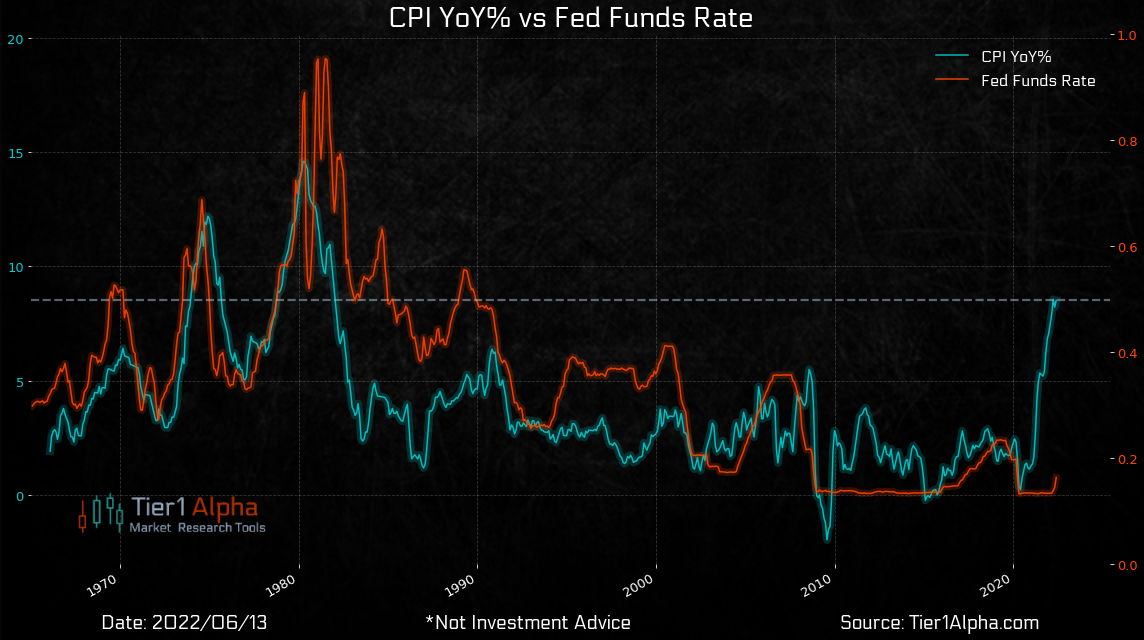
Equity market rally spurred by cooler a Consumer Price Index (CPI).
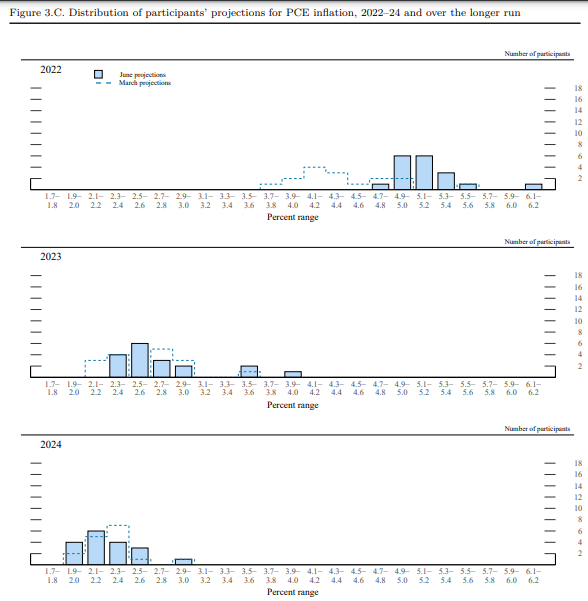
Expected was an 8.7% rise year-over-year (YoY) and 0.2% month-over-month (MoM). Core CPI (which excludes food and energy) was to rise by 6.1% YoY and 0.5% MoM, respectively.
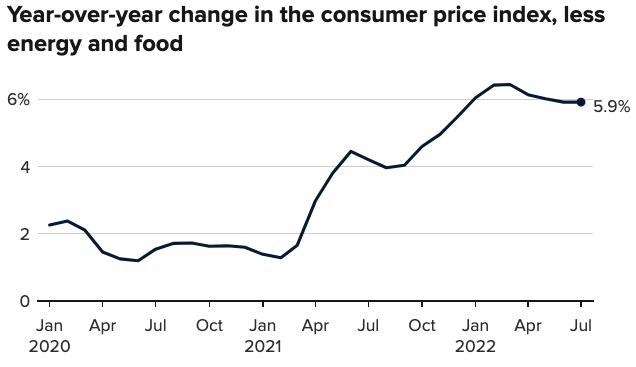
Officially, the headline number rose to 8.5%. The core CPI rose 5.9% YoY and 0.3% MoM, meaning the March peak remains (6.5% YoY, then).
Participants responded positively to the number, as expected could happen in a case where the CPI printed lower.
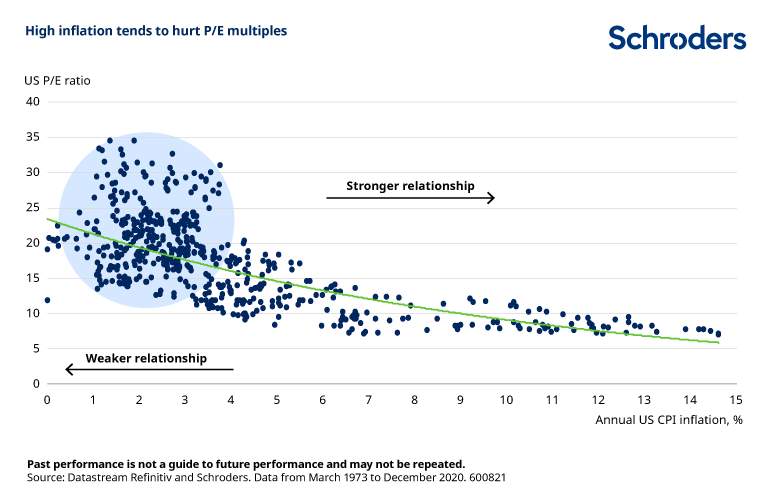
As I talked about in yesterday’s morning letter and in a SpotGamma note, with easing inflation:
(1) investors may command a lower rate of return for their purchasing power and (2) lower rates (if policymakers were to become less aggressive) do less to negatively impact discounted cash flows and the ability to finance future growth.
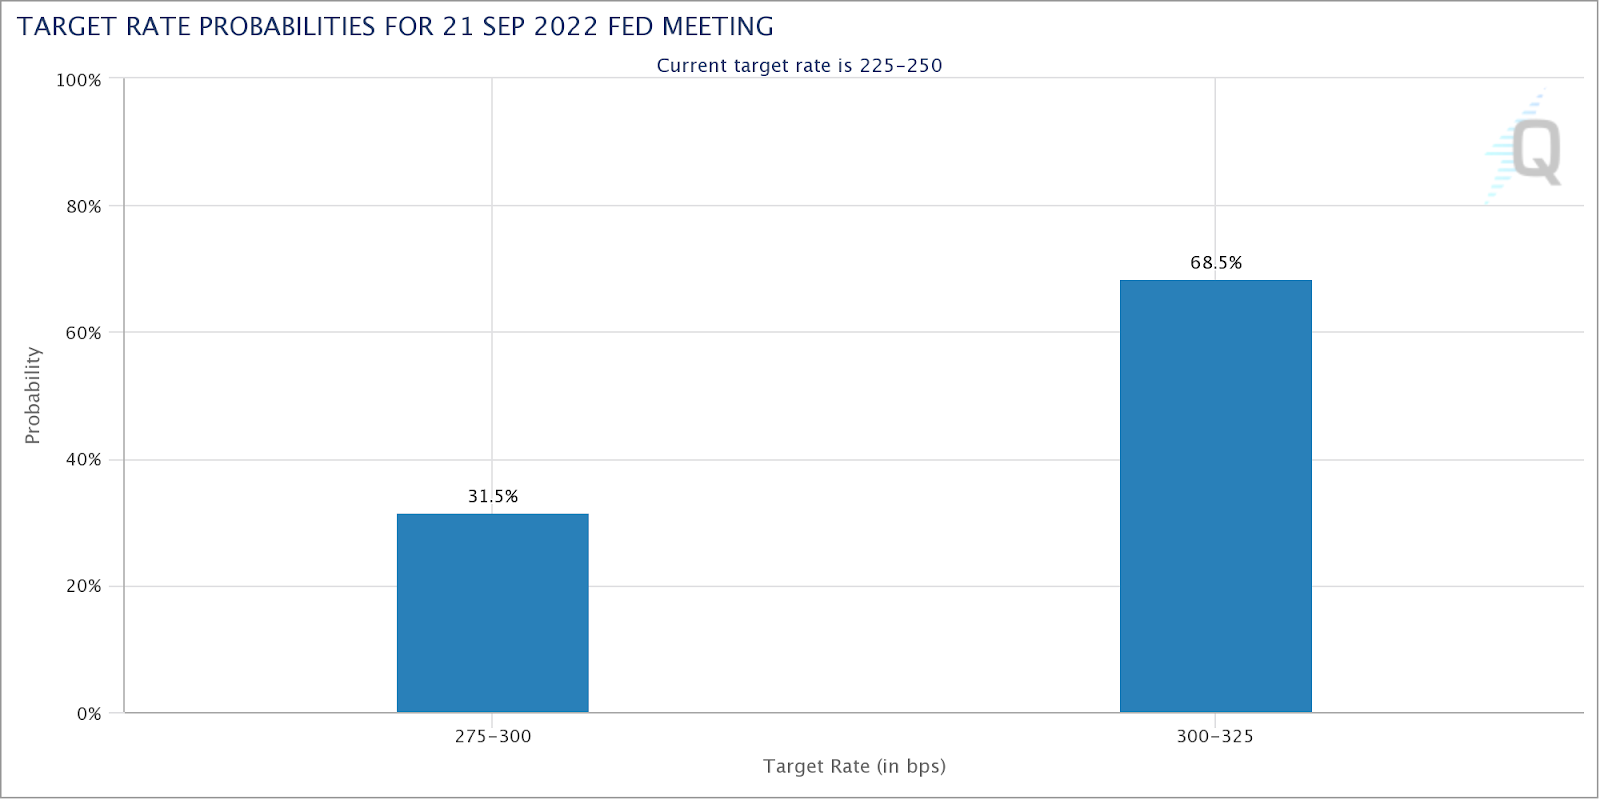
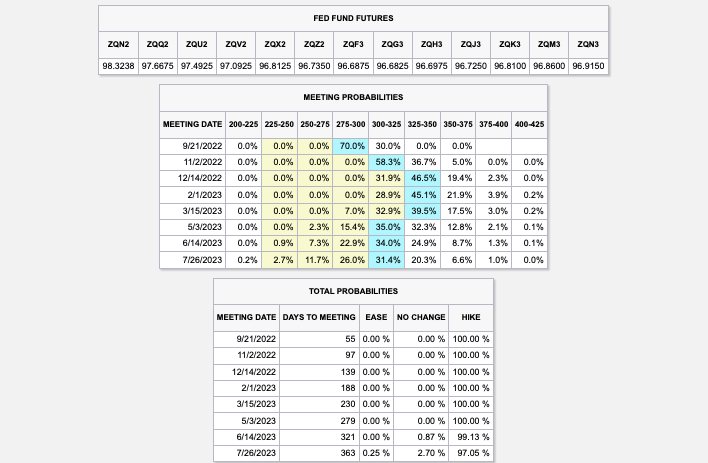
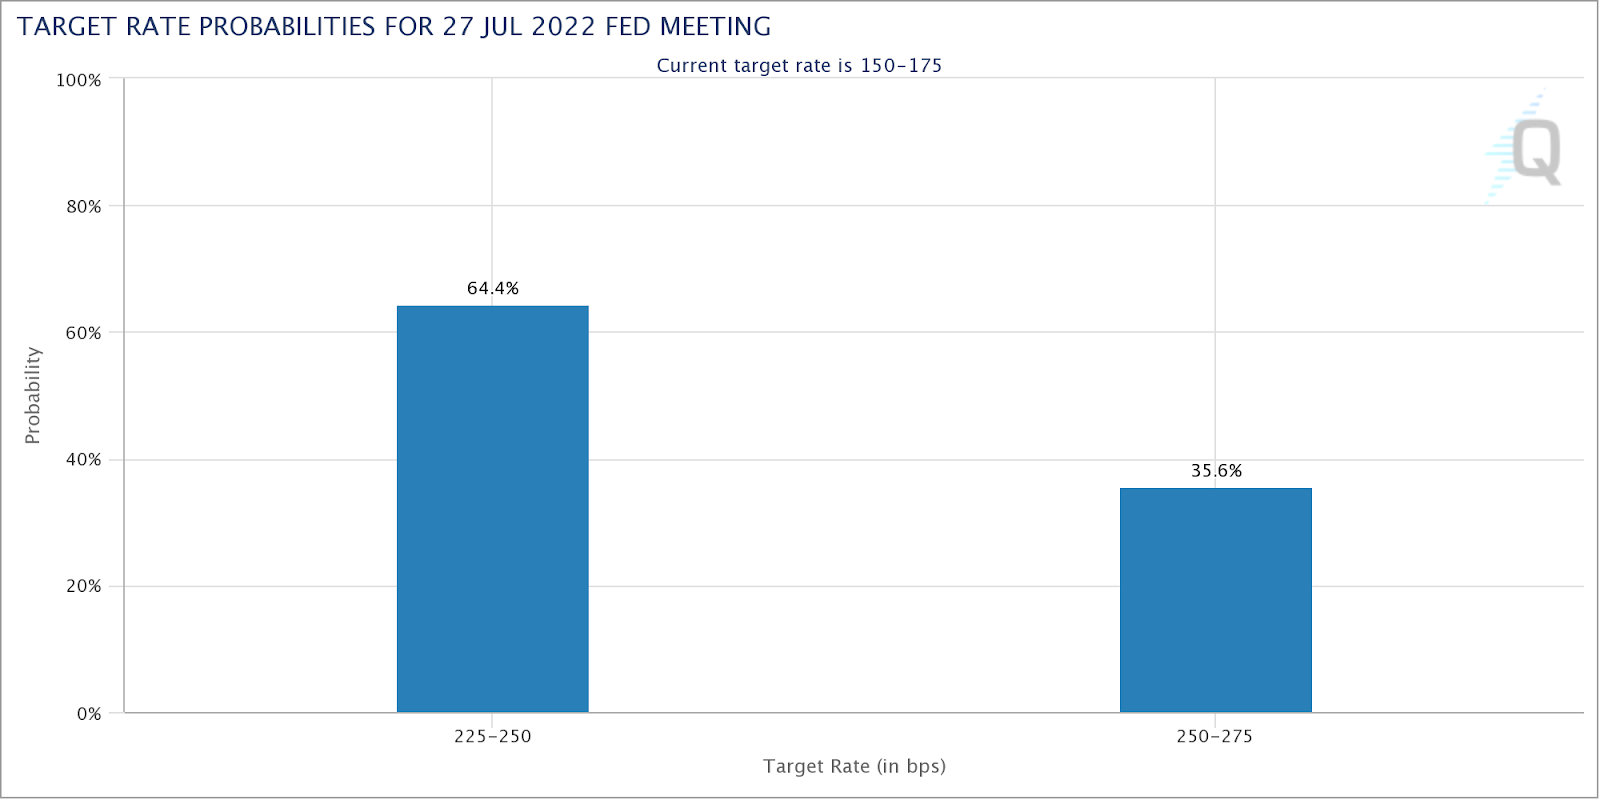
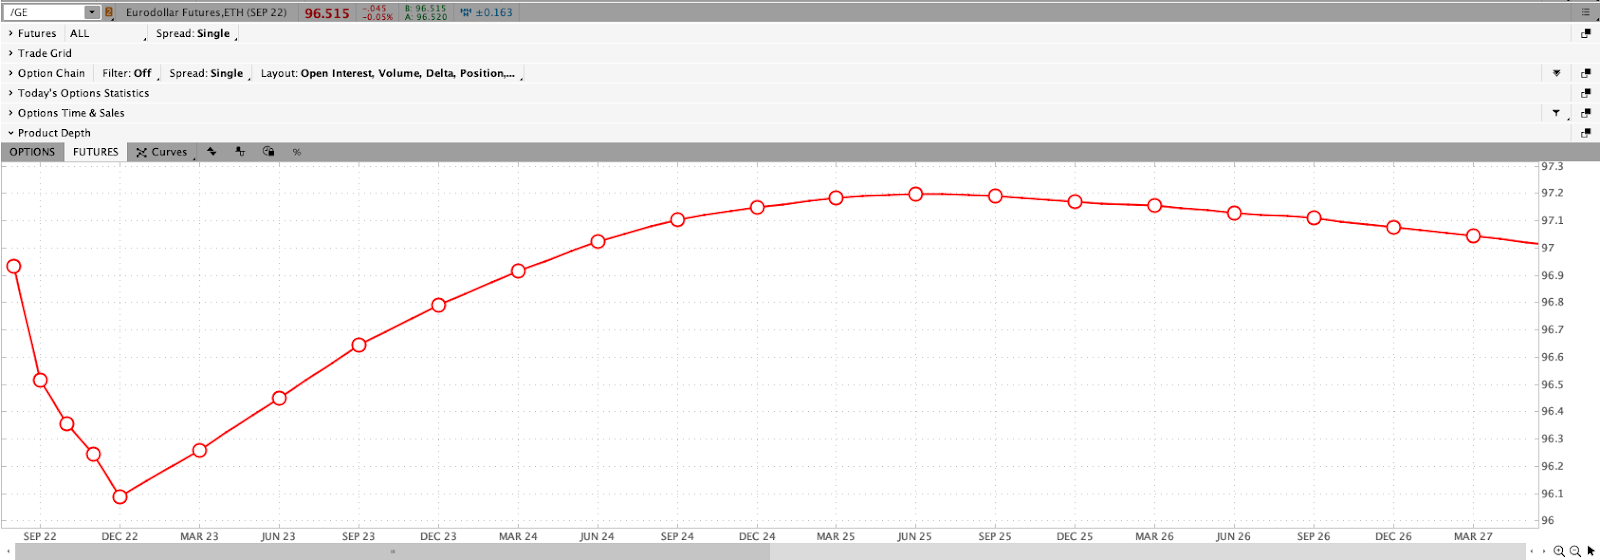
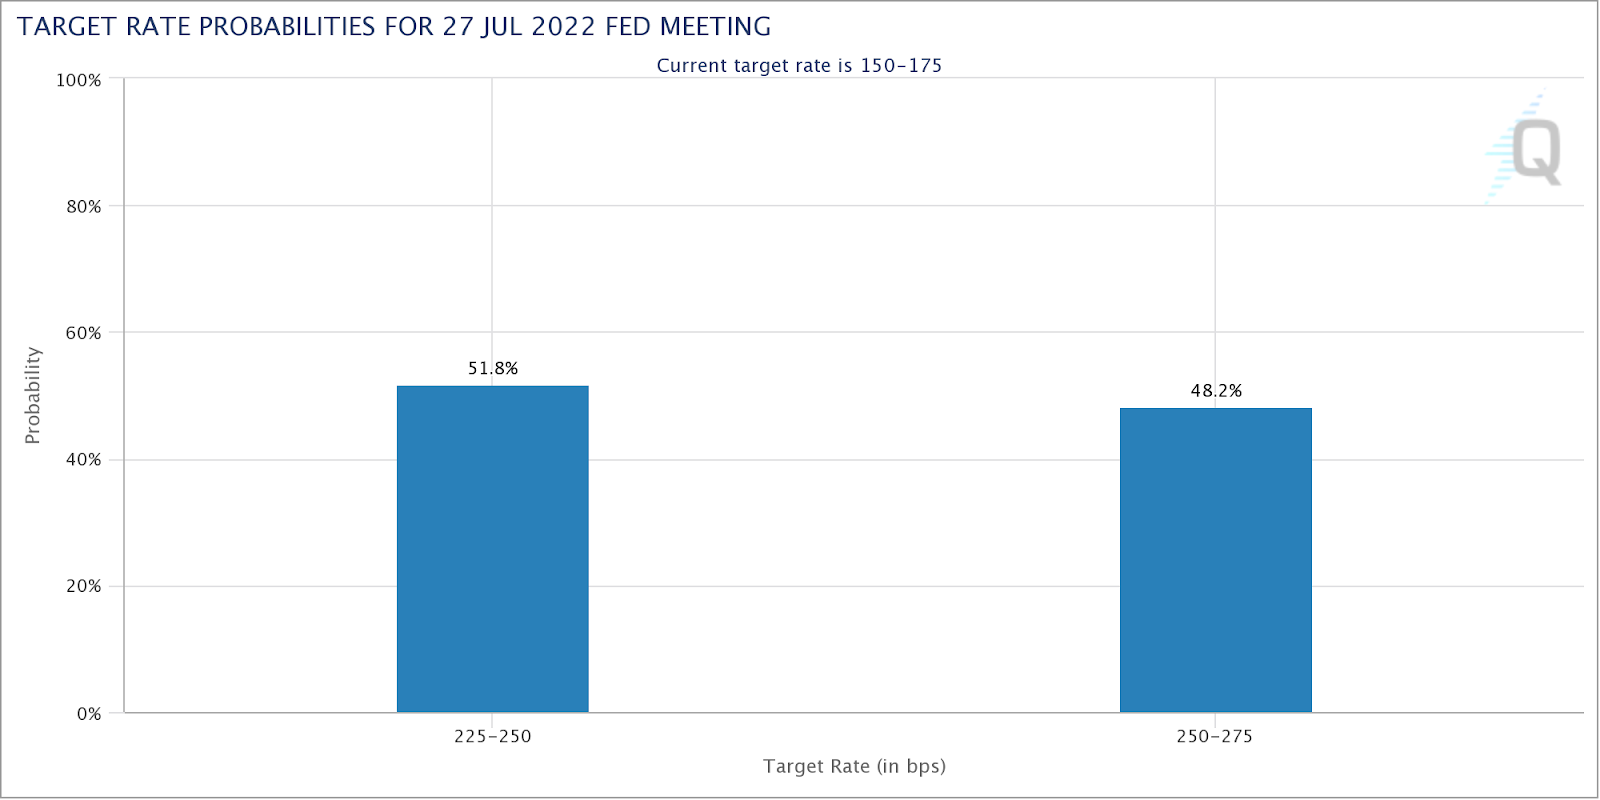
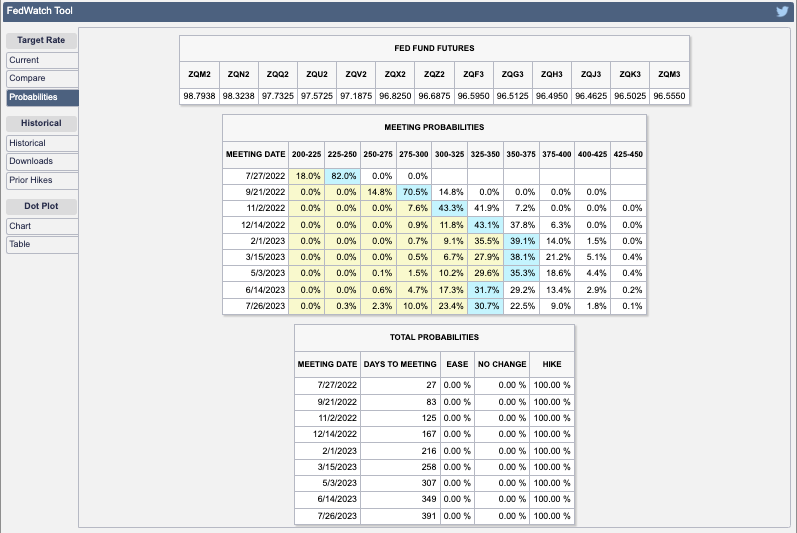
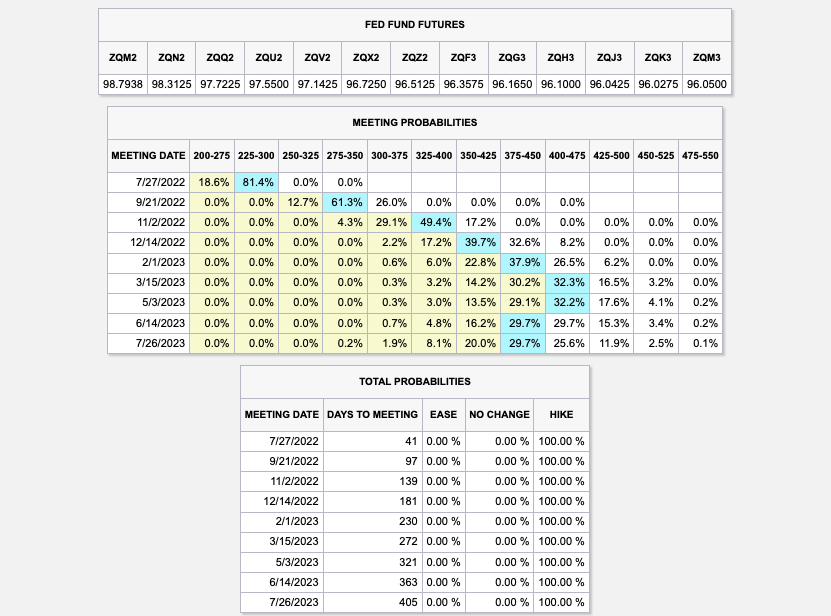
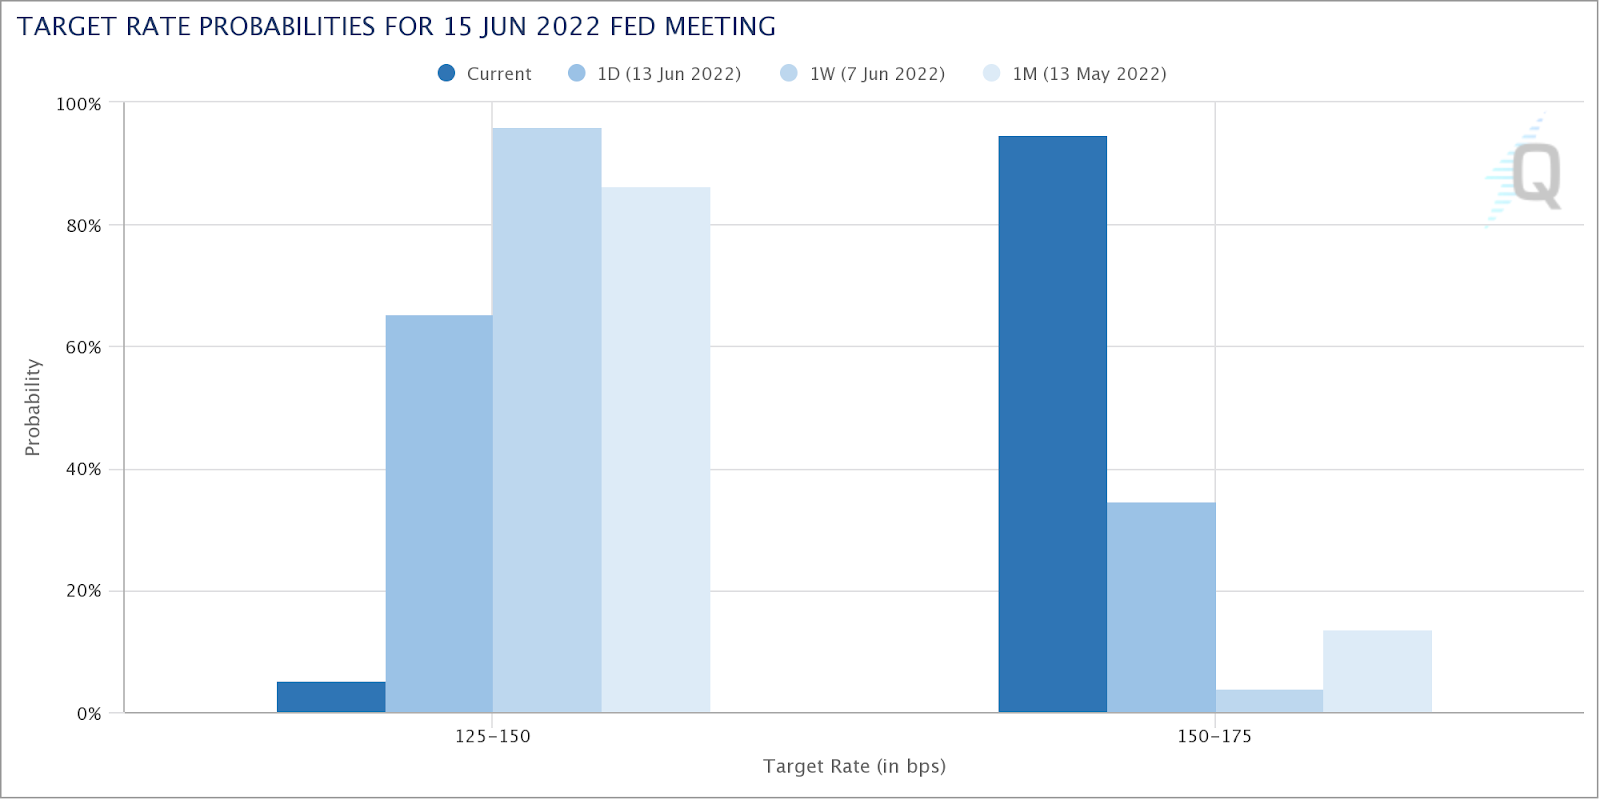
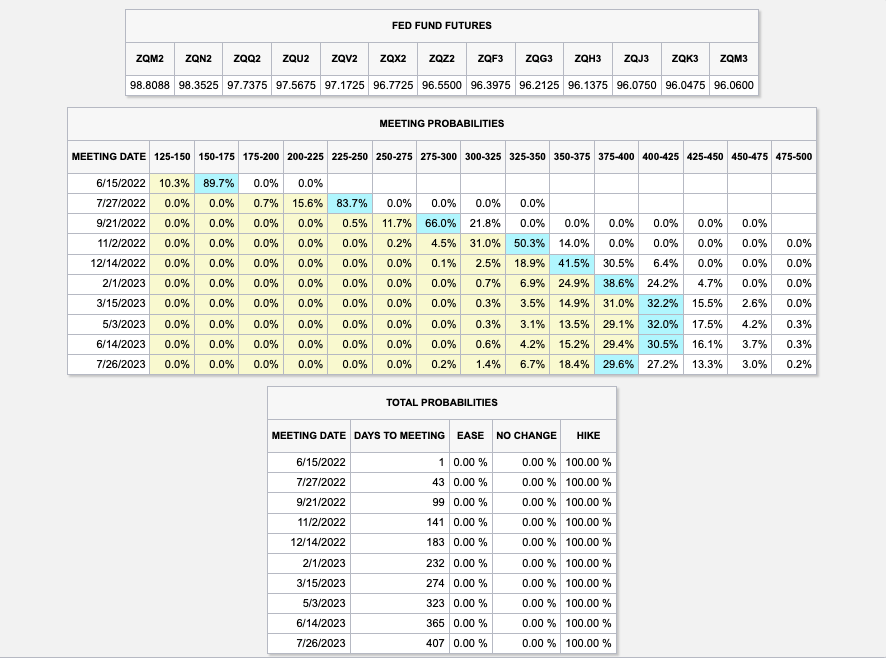
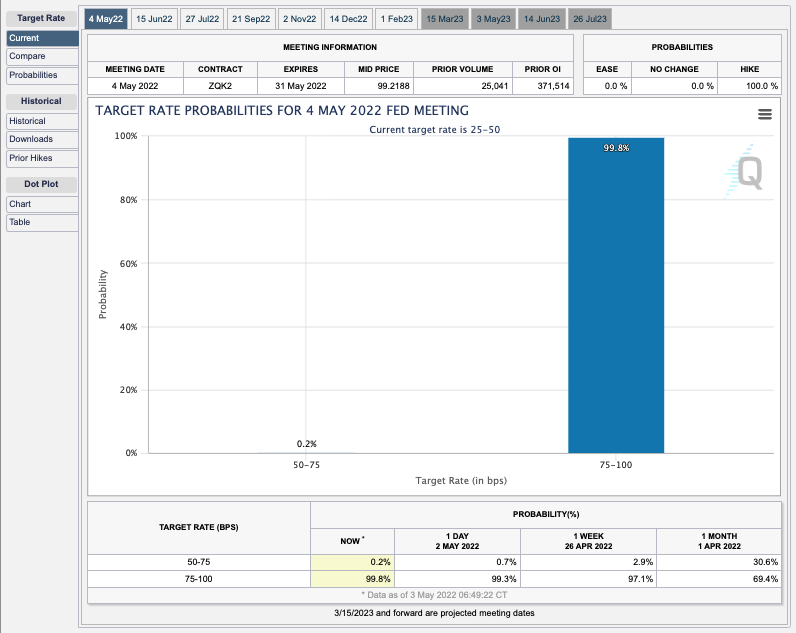
It is the case that immediately after the release of the CPI, traders dramatically shifted their bets on monetary action.
Previously, it was thought a 75 to 100 basis point hike would follow the report. Now, there are higher odds, as priced by the market, that there is a 25 to 50 basis point hike.

“I think the market is a bit overly giddy on this CPI number and it’s probably unlikely that the [Federal Reserve] (Fed) will start to ease up and take a less hawkish stance,” The Ambrus Group’s Kris Sidial put forth.
“The increase in risk assets somewhat gives the Fed the green light to be able to move more swiftly with a hawkish tone.”
Accordingly, the Fed’s Mary Daly said it is too early to declare victory in the inflation fight (and rightfully so), signaling, however, that she may support a slower pace of hikes.
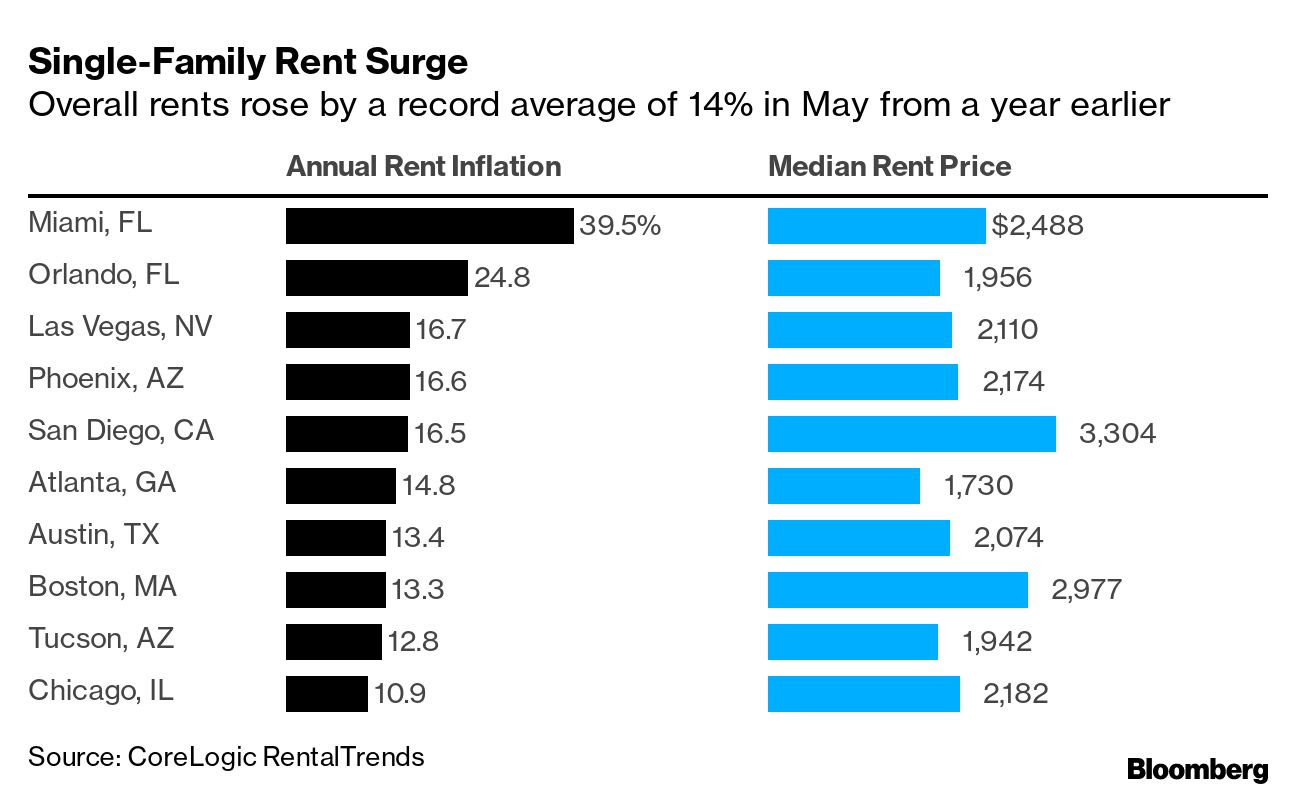
This is as home buyers and renters, in some areas, are seeing large hikes in prices. For instance, per one Bloomberg article, a Miami native saw their rent increase “by $650 to $2,400.00 a month,” forcing them to search for new places to live.
The Ambrus Group’s Sidial adds:
“Inflation is one of those things that is difficult to control when it’s out [of] the bag (historically). I think the Fed understands this and if they have the opportunity to tame it, while not completely obliterating risk assets, it seems like a perfect scenario.”
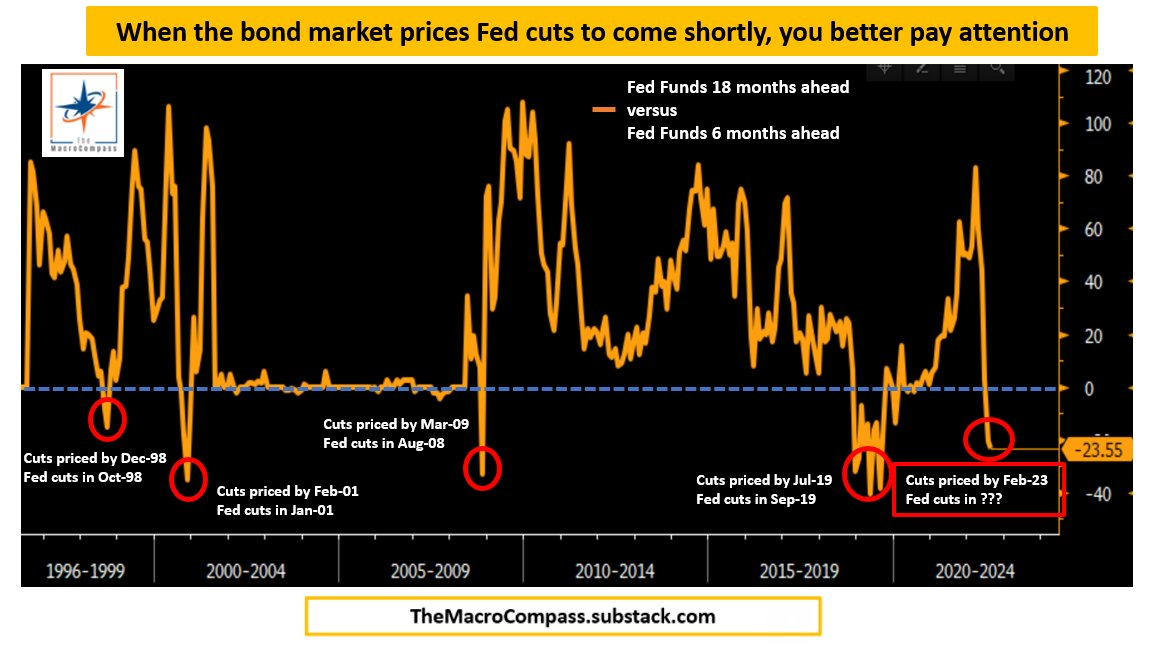
Ultimately, farther out in time, some metrics, which have incredible success in forecasting pivots, show the Fed likely to cut in 2023, shortly following the aggressive hiking cycle.
On the topic of (eventual) declines and slowing in the risk assets (like housing), “in most cases today, a borrower with 60 points of equity in their property, even facing moderate declines in their current home price, are not a big default risk,” explains Dan Ivascyn of PIMCO.
“A lot of what we like in the market today is seasoned-type risk that benefits from the multi-years of home price appreciation, and therefore is much less sensitive to what goes on from this point forward.”
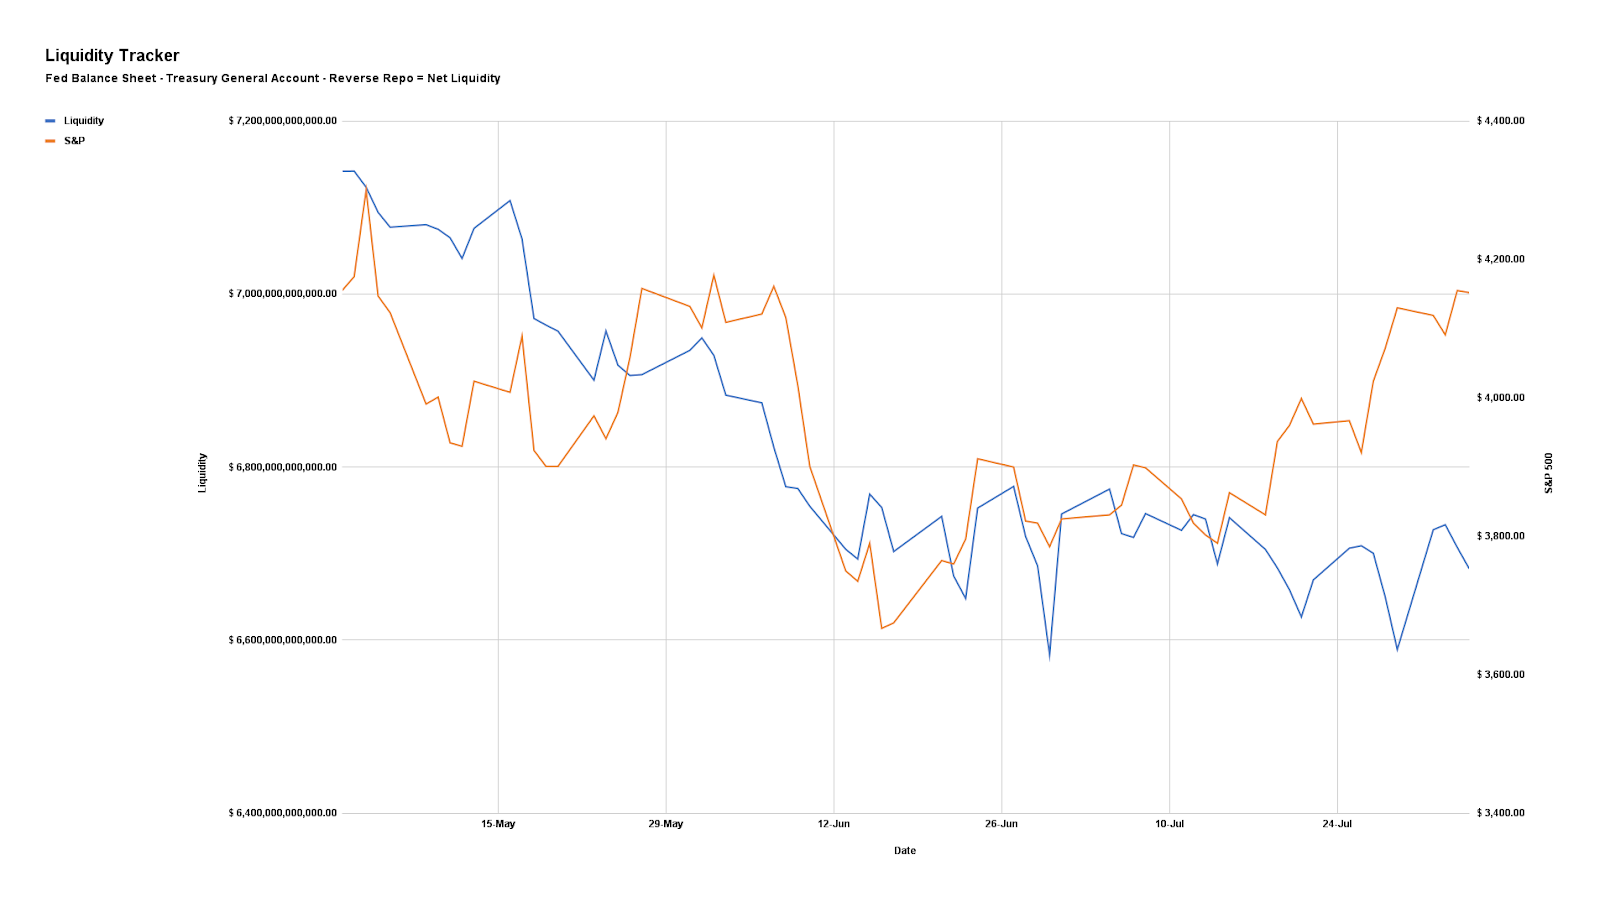
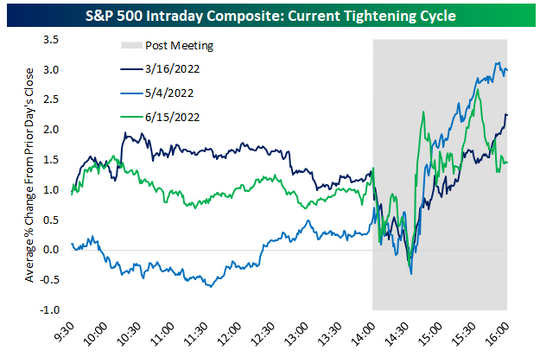
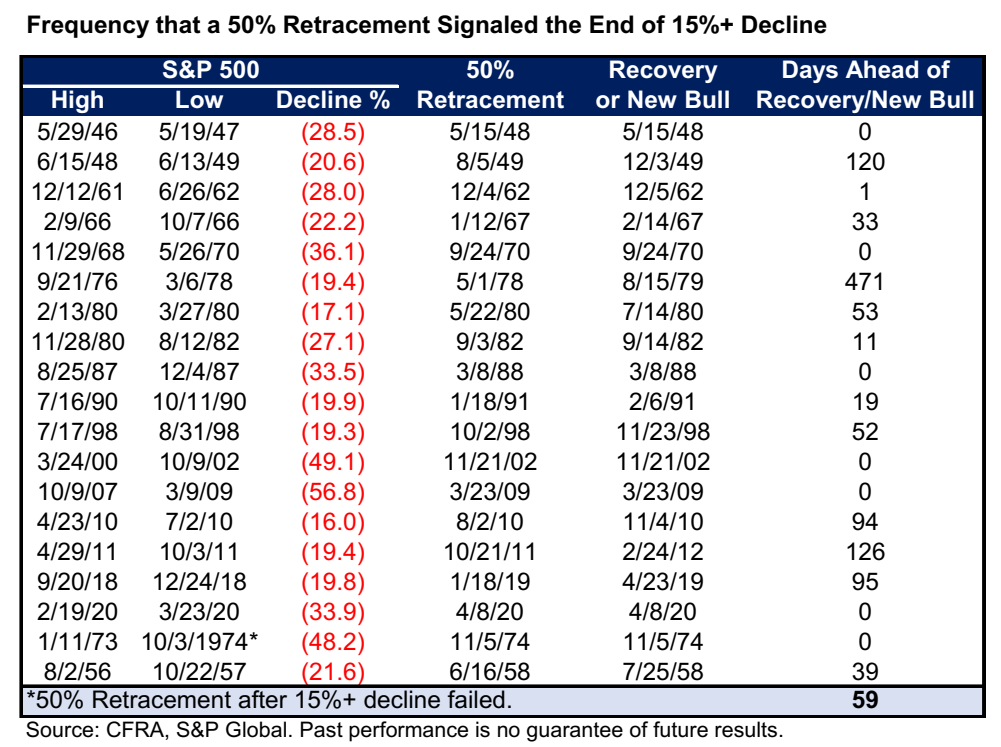
From an S&P 500 (INDEX: SPX) perspective, the index has basically recouped half its losses for the year. This often came after the bear lows were in.
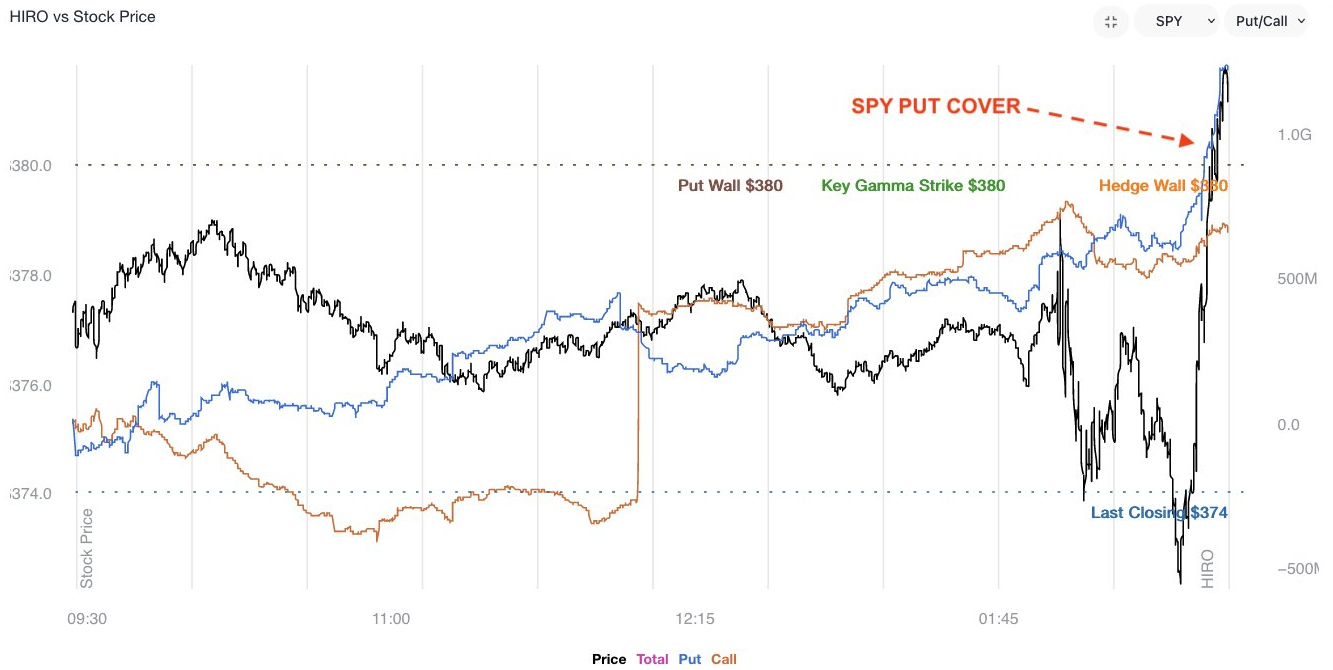
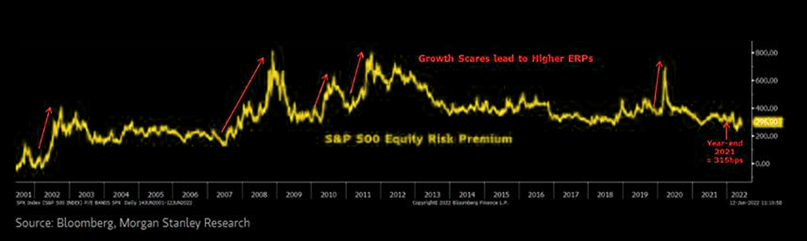
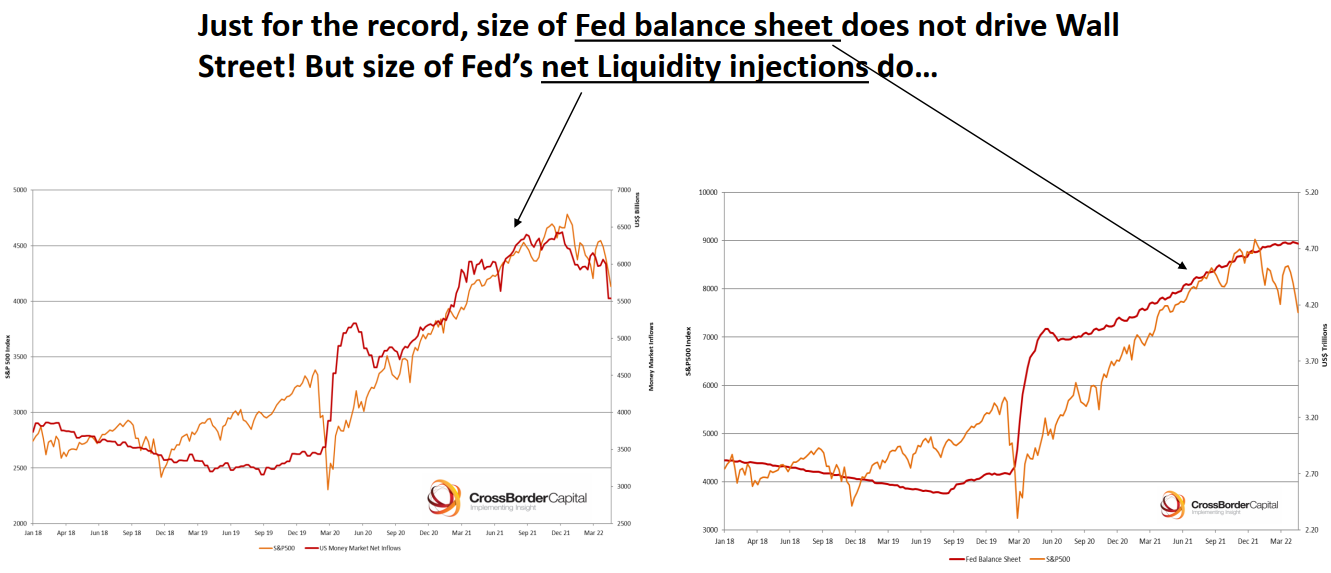
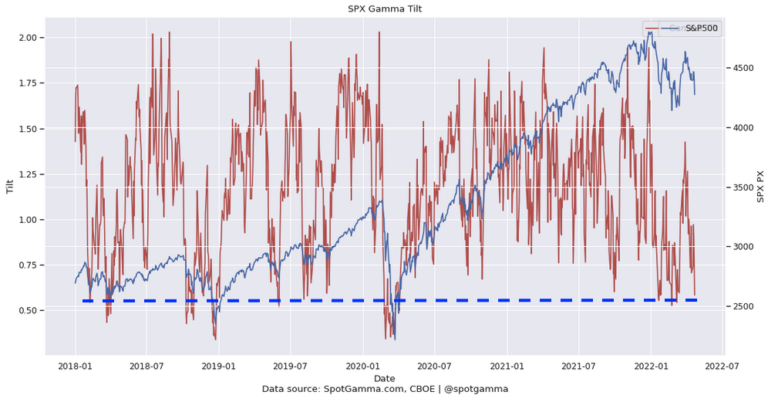
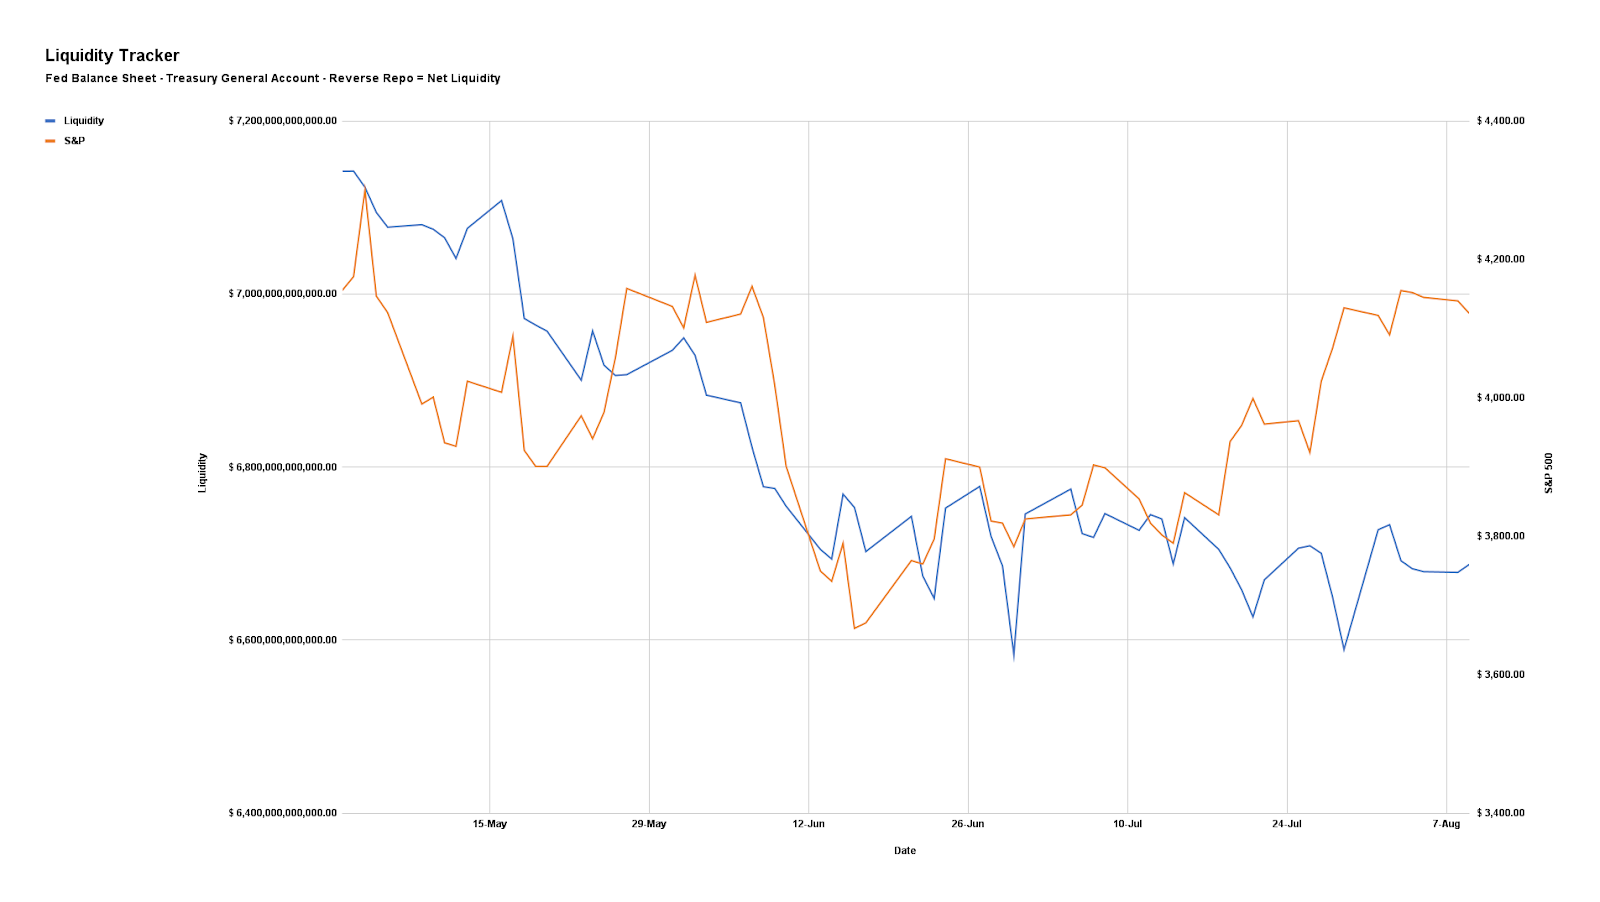
Notwithstanding, here’s our updated liquidity tracker that is monitoring the “preeminent driver of markets during the post-crisis decade.”
Positioning
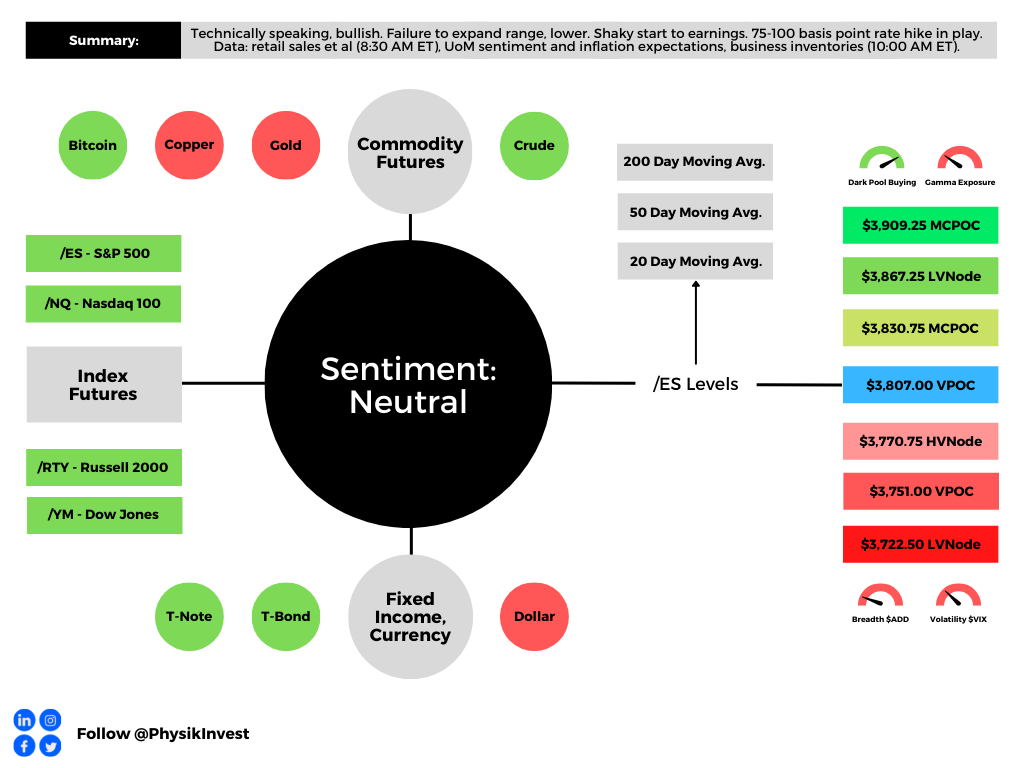
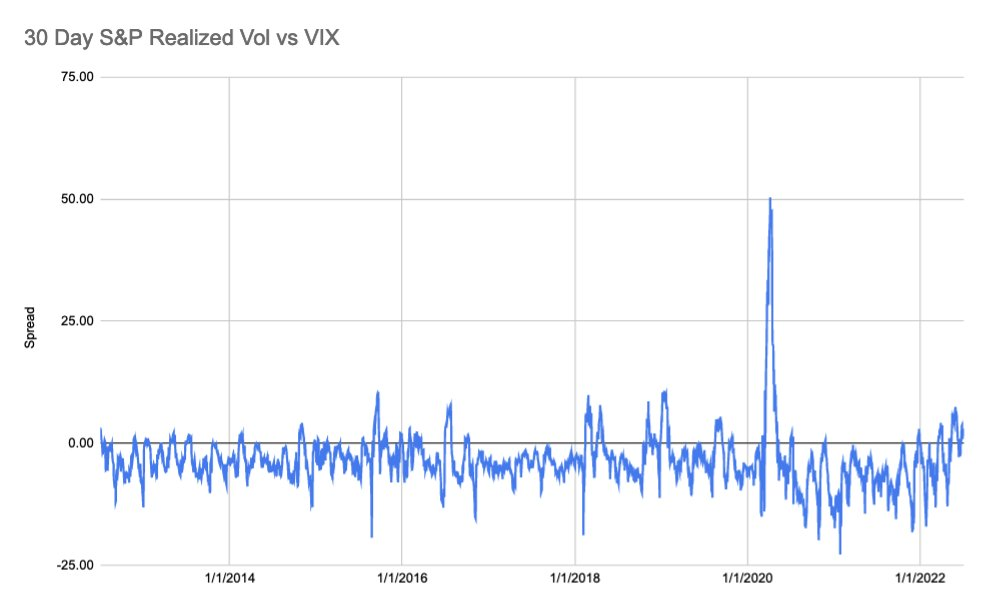
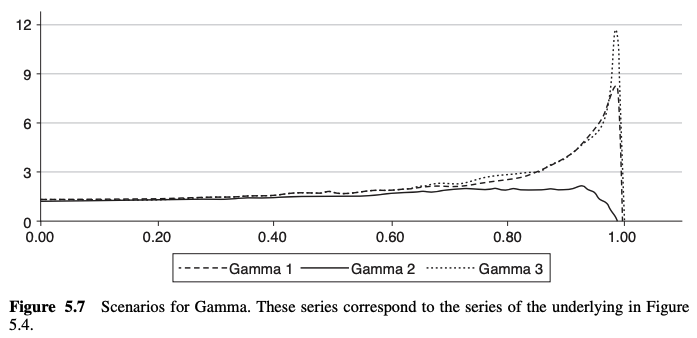
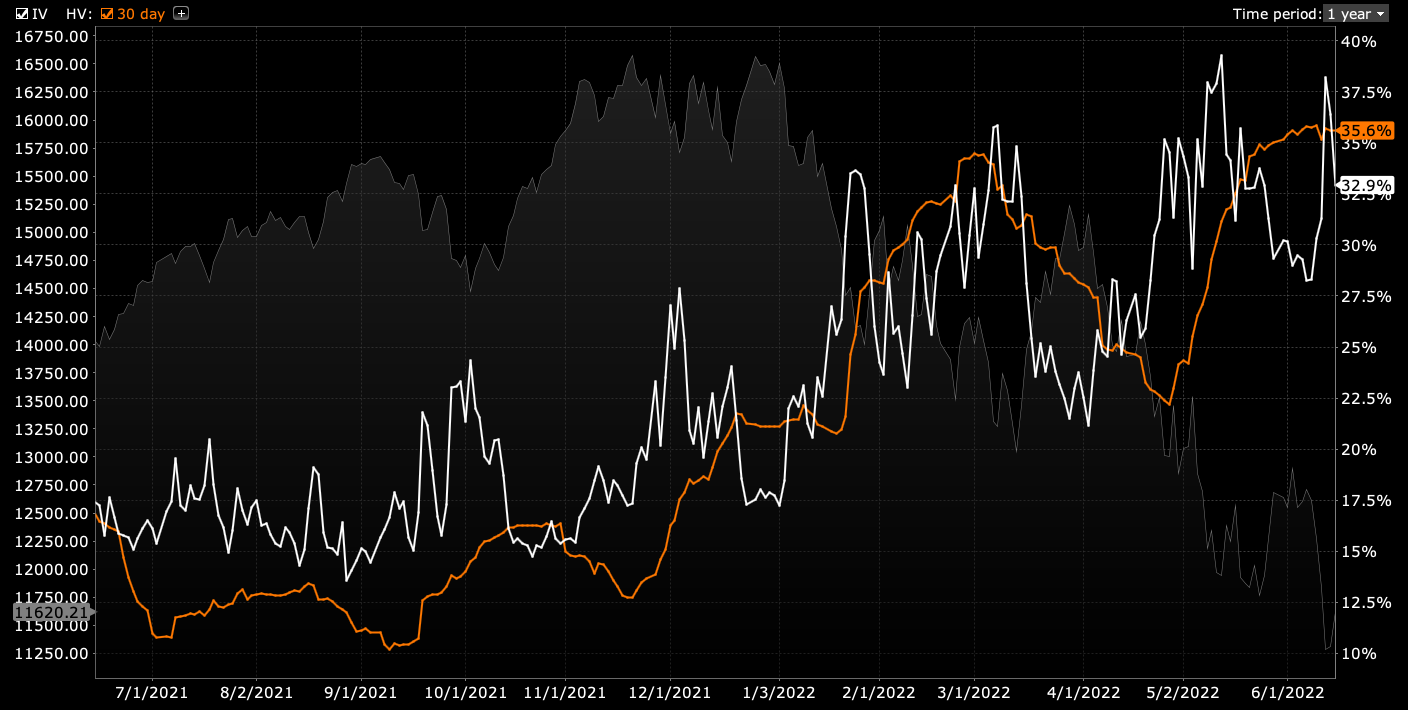
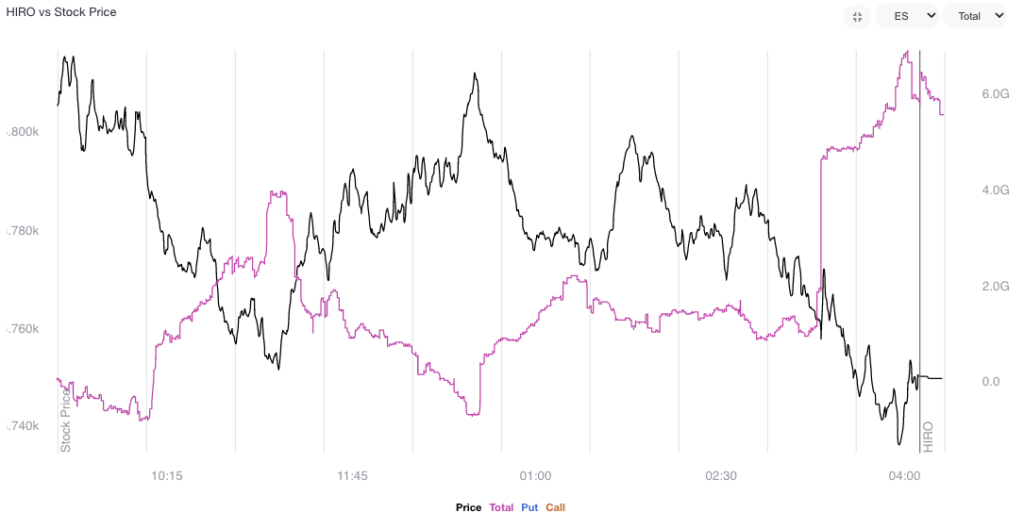
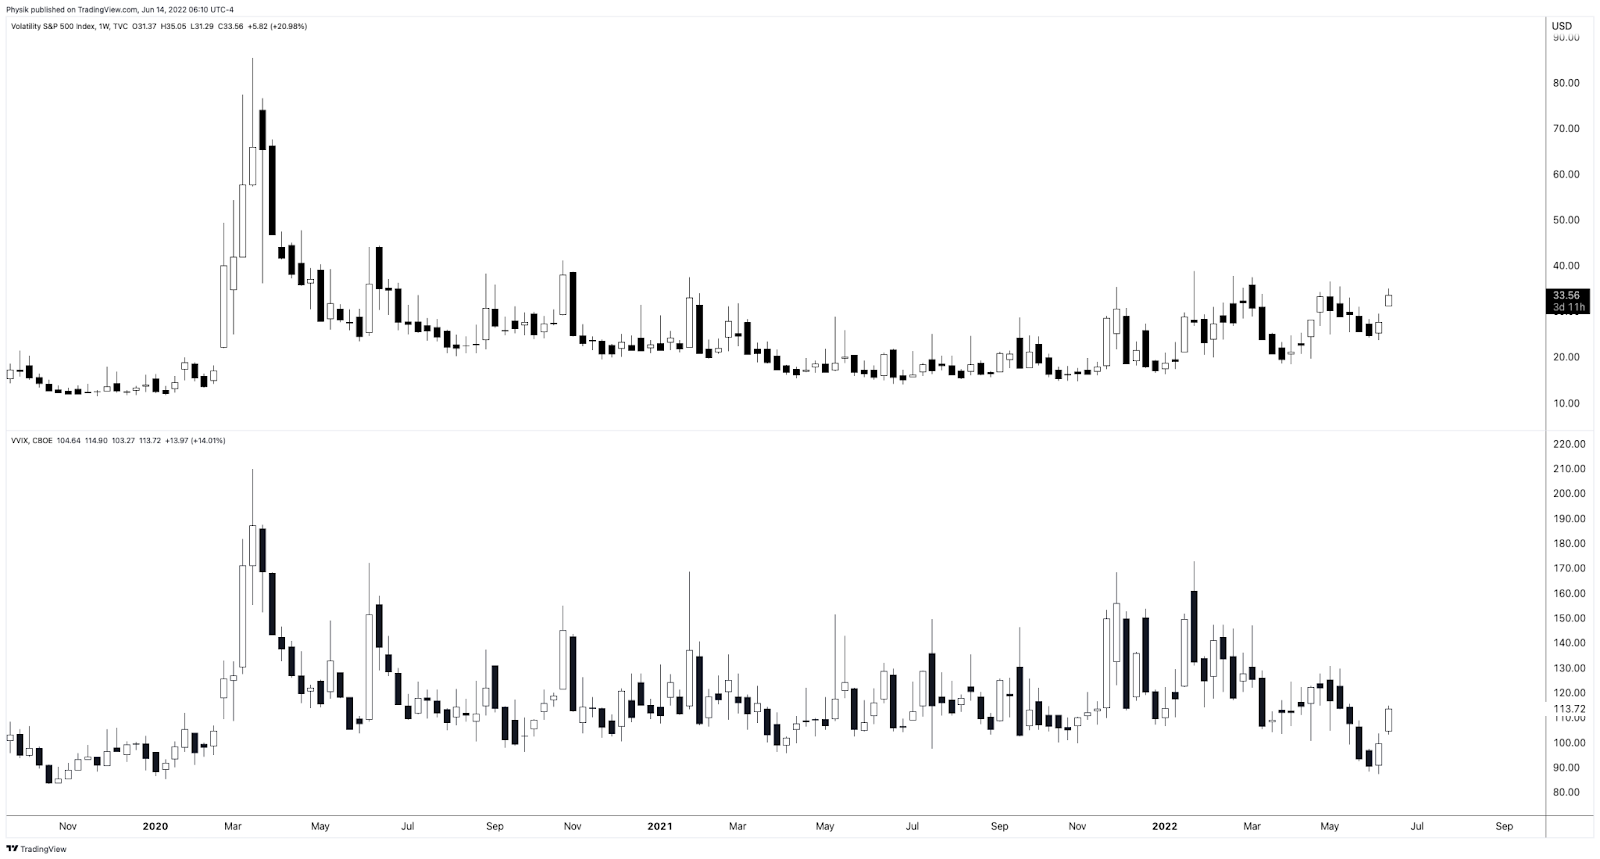
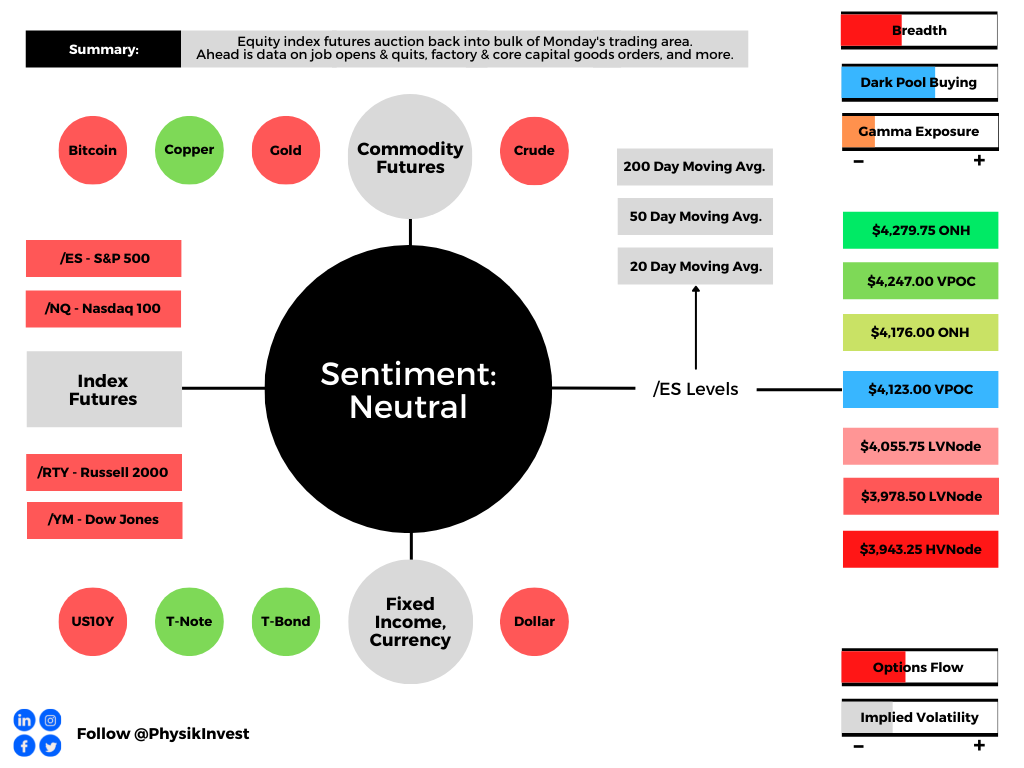
As of 7:15 AM ET, Thursday’s expected volatility, via the Cboe Volatility Index (INDEX: VIX), sits at ~1.04%. Net gamma exposures increasing may promote tighter trading ranges.
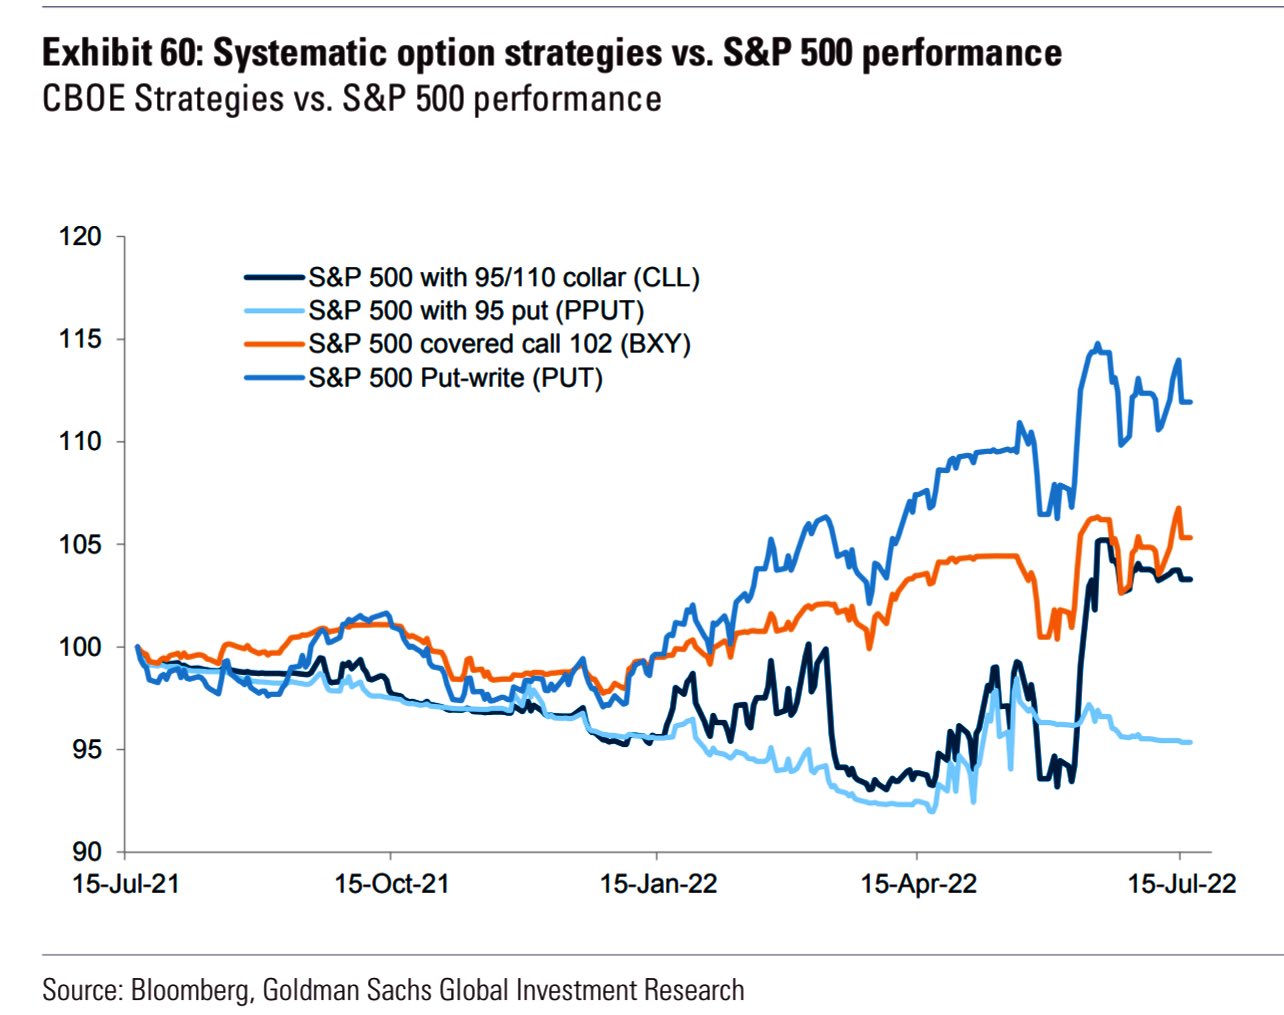
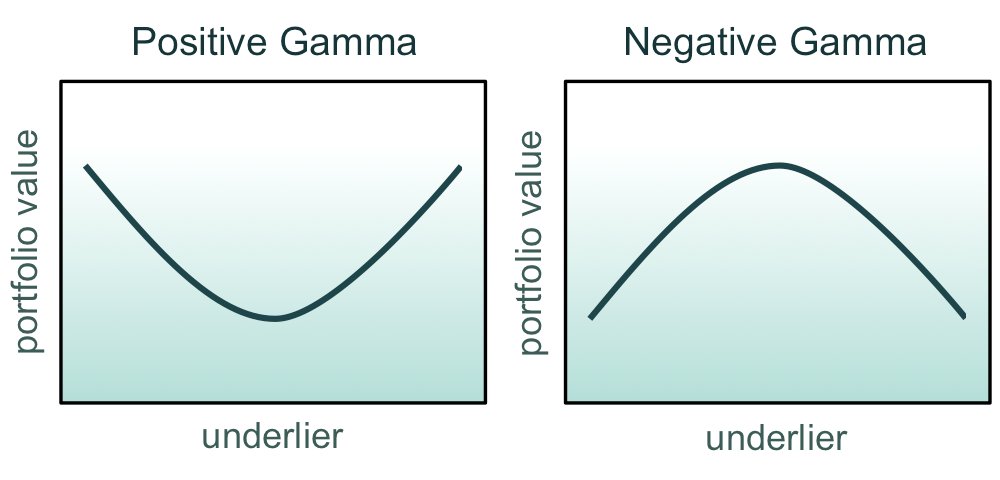
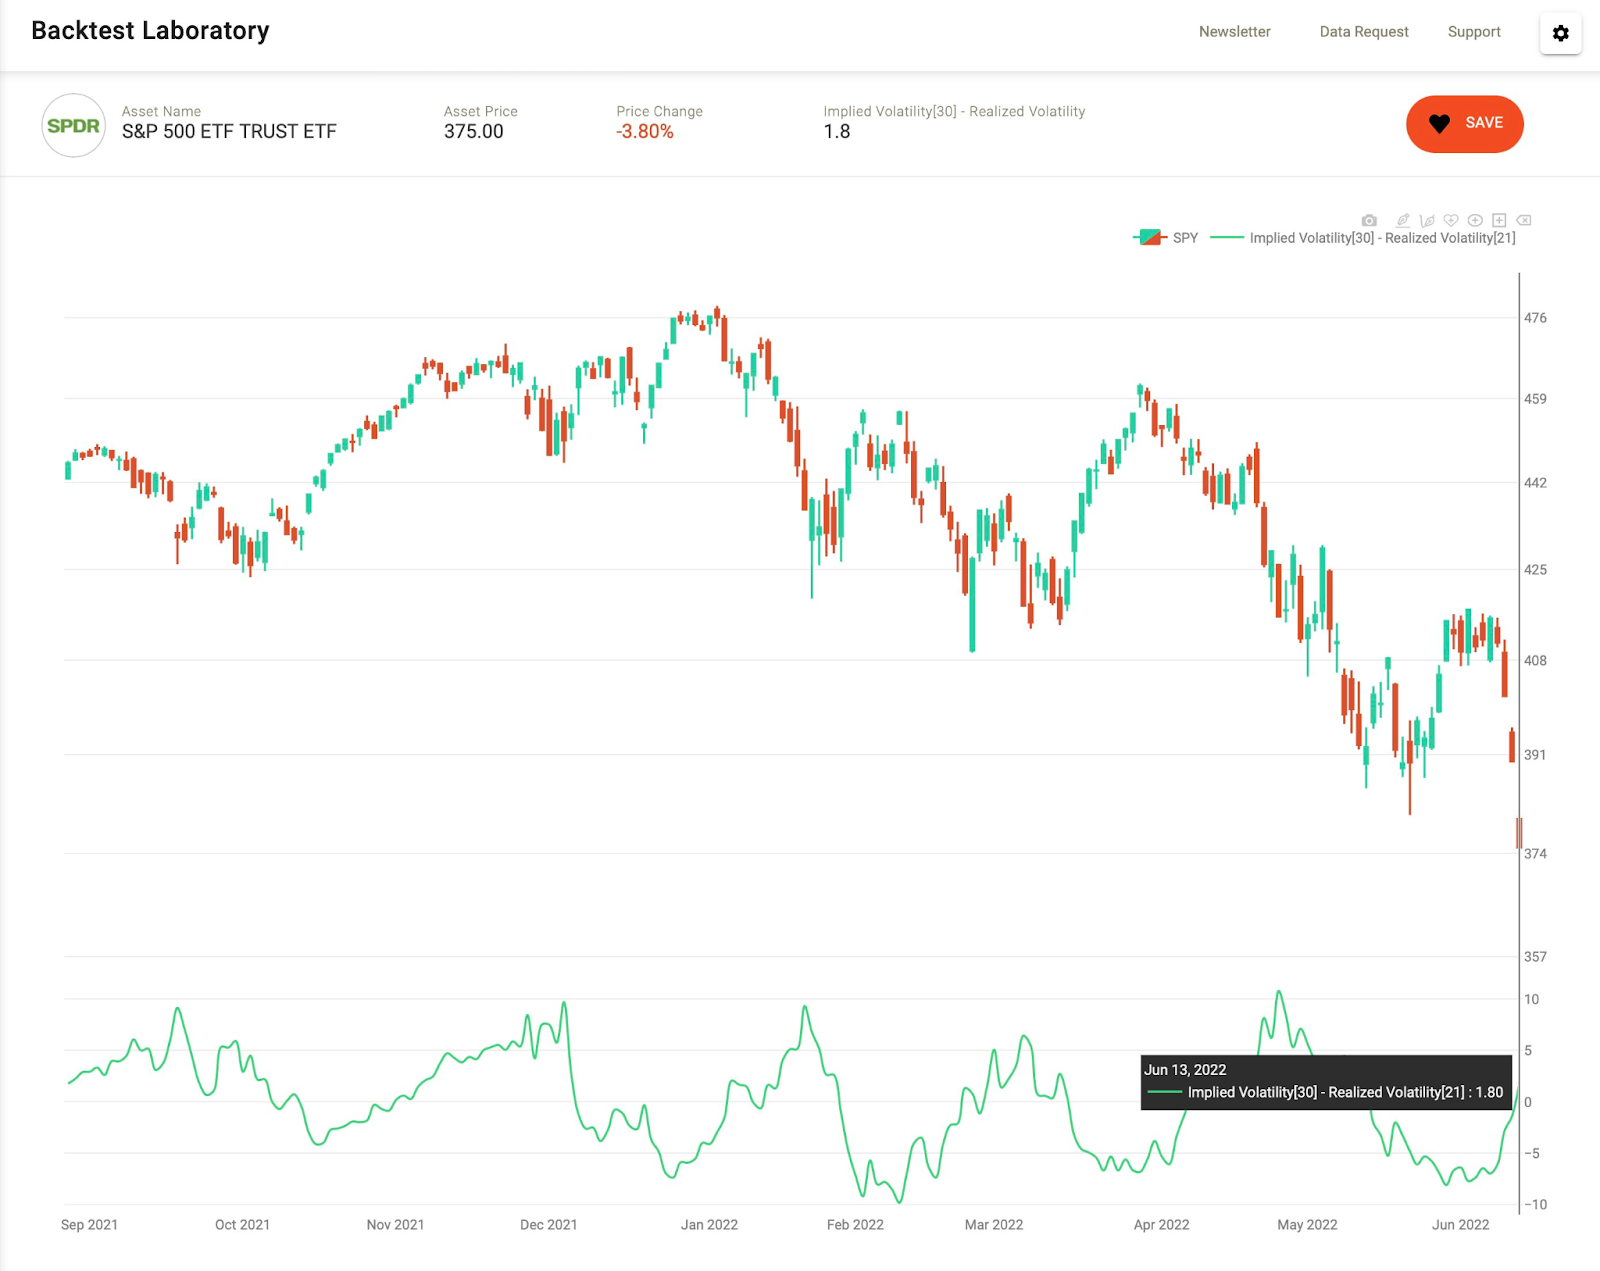
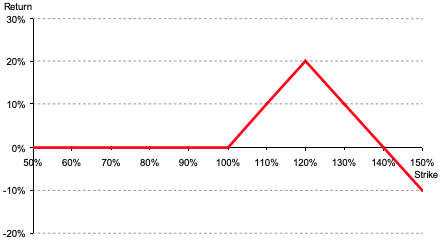
Given where realized (RVOL) and implied (IVOL) volatility measures are, as well as skew, it is beneficial to be a buyer of options structures (i.e., replacing static directional exposures or delta with those that are dynamic) tied to the broader measures we follow like the S&P 500 (given increased average stock correlation and lower return dispersion).
The reason why?
Per SpotGamma: “From an options perspective, a lot of the boost from volatility compression has played out. With implied volatility at a lower bound, it may be opportune to replace static delta bets for those that are dynamic (i.e., long option exposures) and have less to lose in this lower volatility environment.”
“In a case where market participants see the Fed keeping its commitment to aggressive monetary policy action, negative delta options exposures may outperform static short equity (bets on the downside).”
Technical
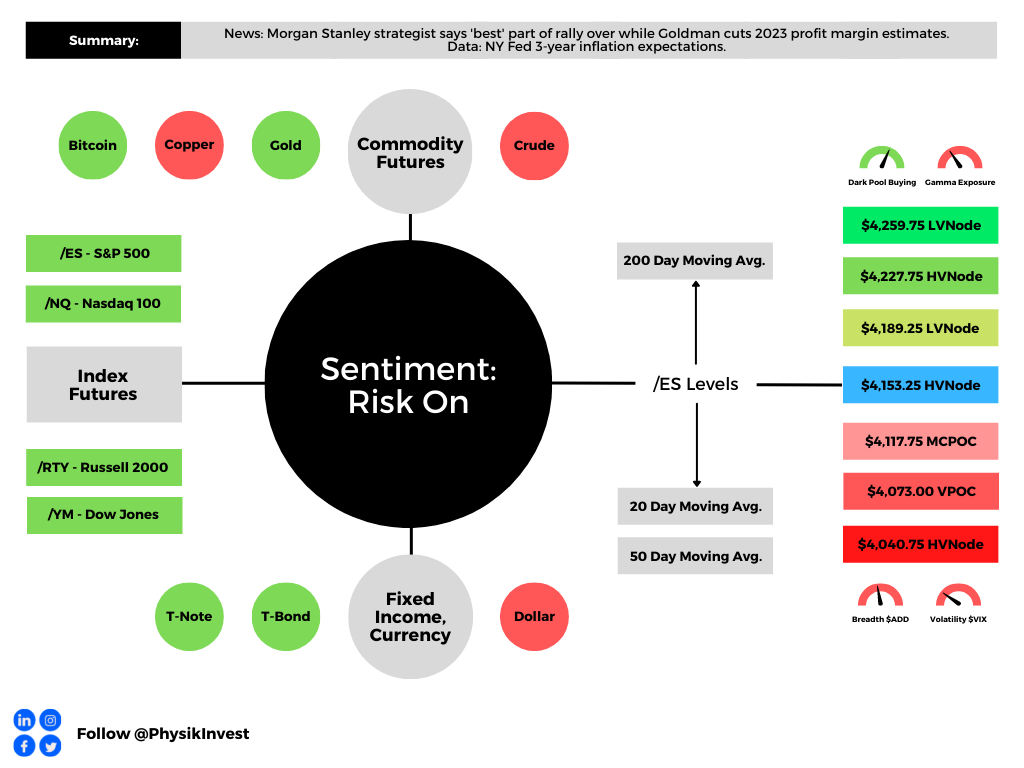
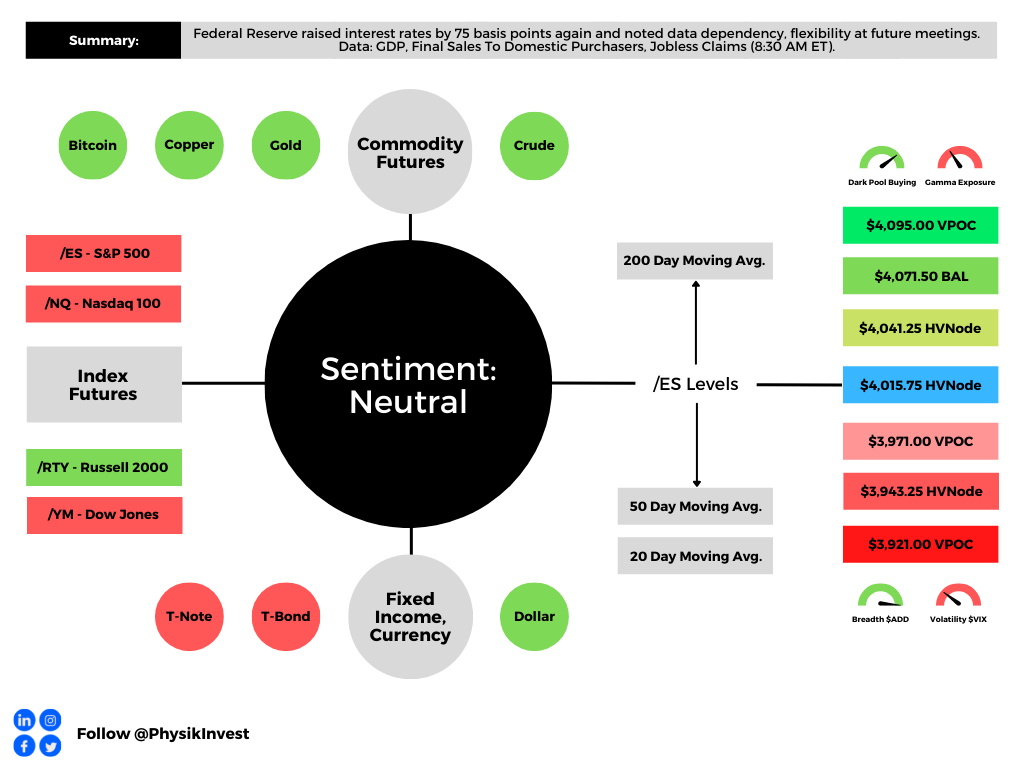
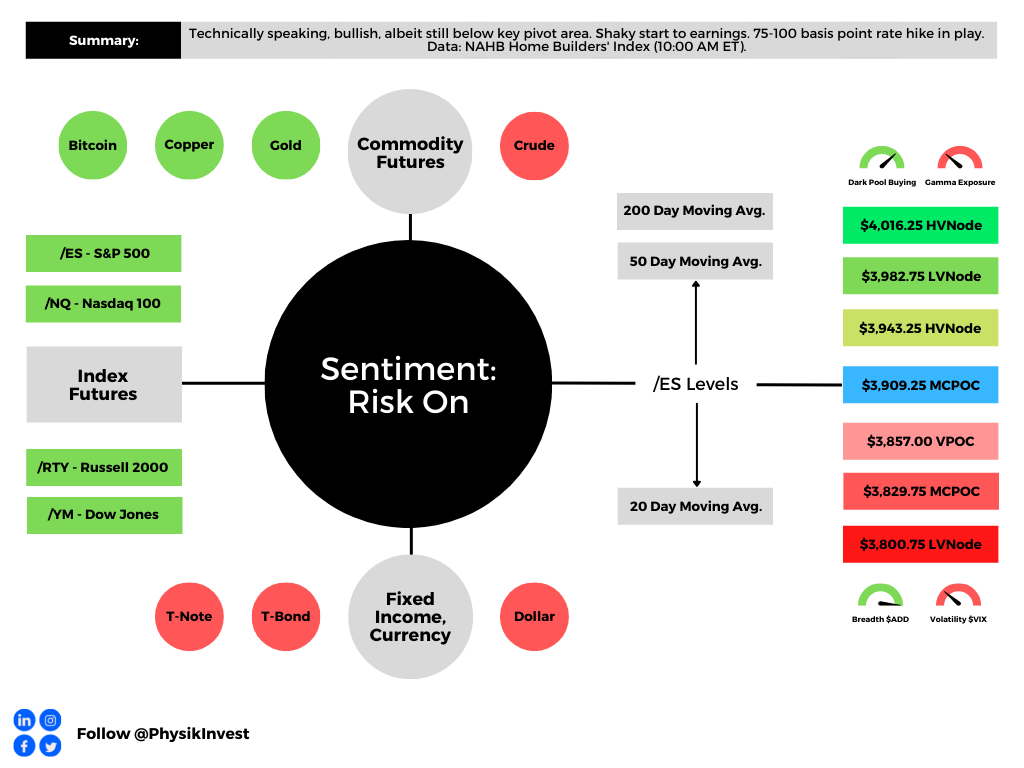
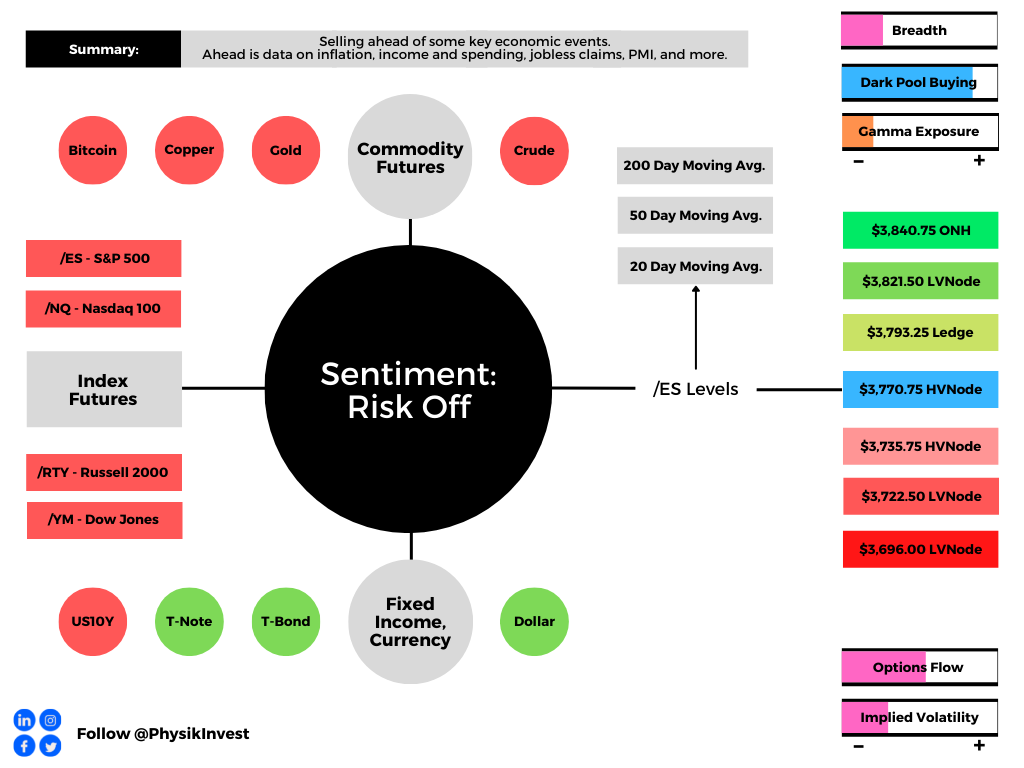
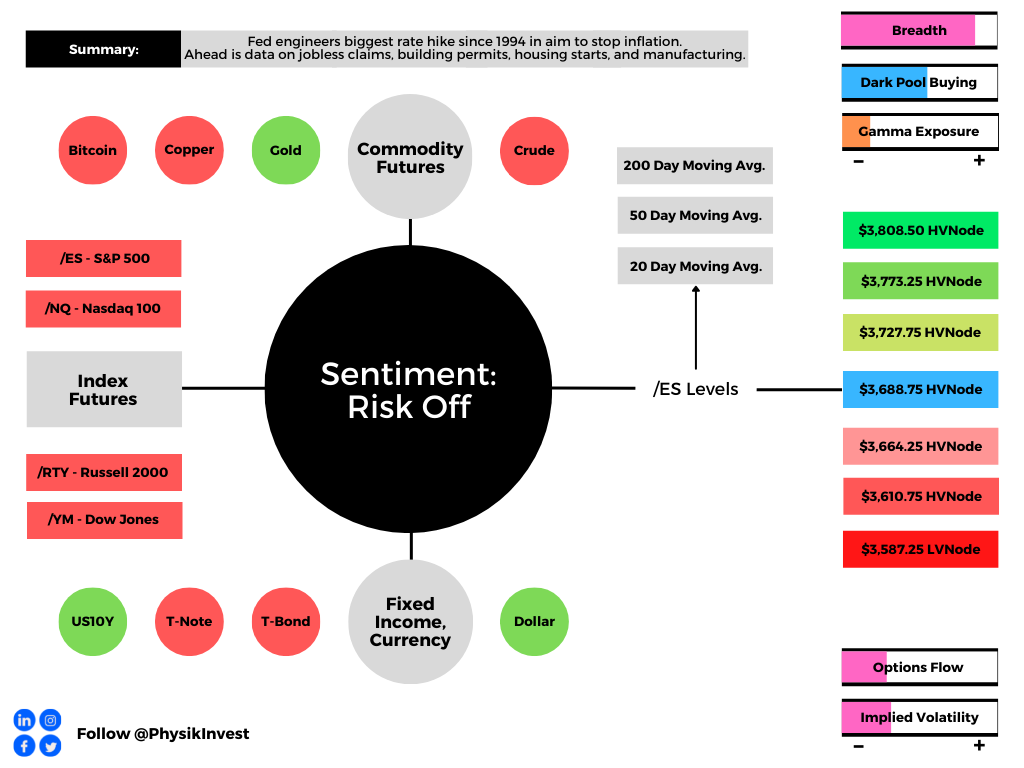
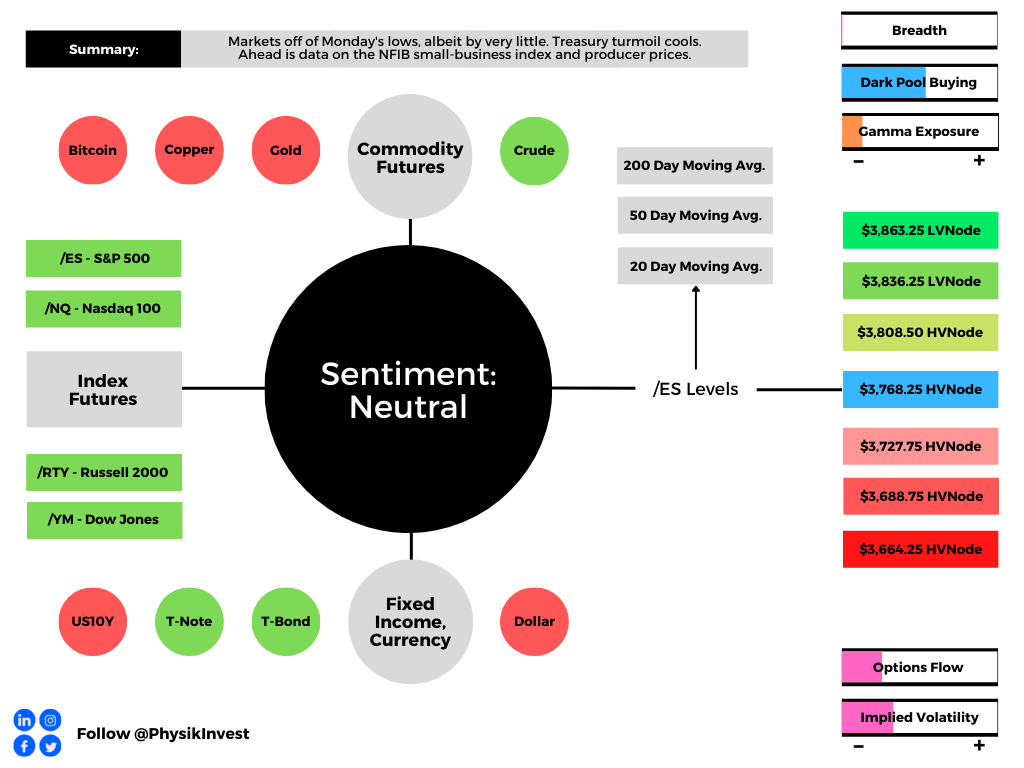
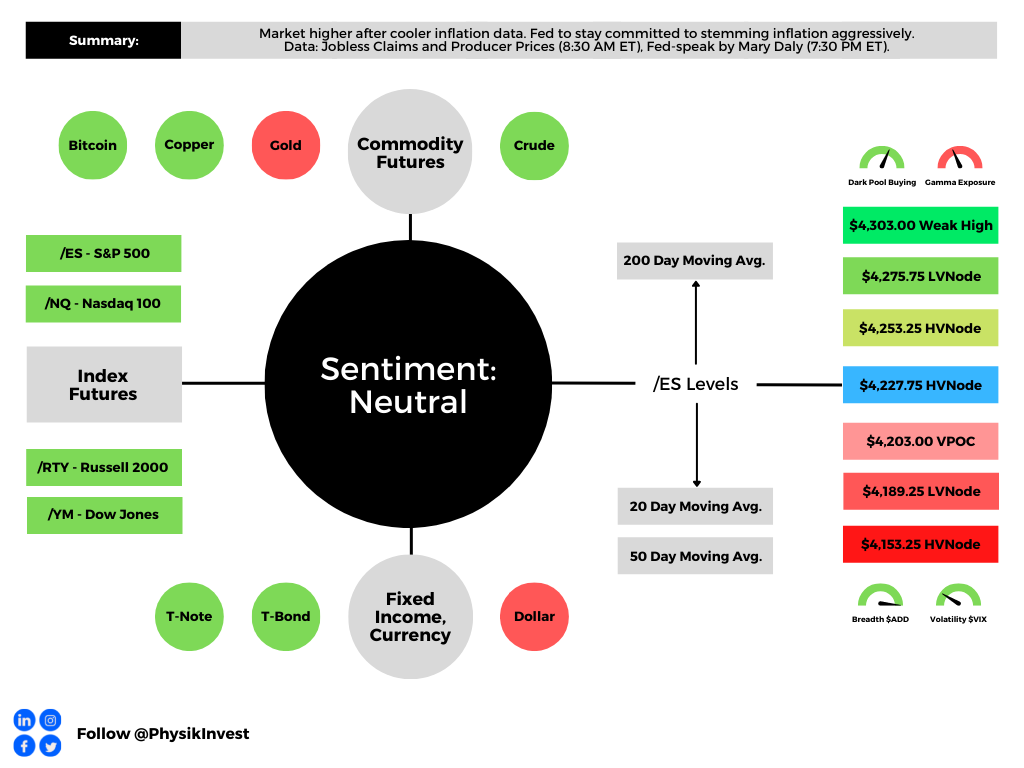
As of 7:30 AM ET, Thursday’s regular session (9:30 AM – 4:00 PM ET), in the S&P 500, is likely to open in the upper part of a positively skewed overnight inventory, outside of prior-range and -value, suggesting a potential for immediate directional opportunity.
In the best case, the S&P 500 trades higher.
Any activity above the $4,227.75 HVNode puts into play the $4,253.25 HVNode. Initiative trade beyond the latter could reach as high as the $4,275.75 LVNode and $4,303.00 Weak High, or higher.
In the worst case, the S&P 500 trades lower.
Any activity below the $4,227.75 HVNode puts into play the $4,203.00 VPOC. Initiative trade beyond the VPOC could reach as low as the $4,189.25 LVNode and $4,153.25 HVNode, or lower.
Click here to load today’s key levels into the web-based TradingView charting platform. Note that all levels are derived using the 65-minute timeframe. New links are produced, daily.

Definitions
Volume Areas: A structurally sound market will build on areas of high volume (HVNodes). Should the market trend for long periods of time, it will lack sound structure, identified as low volume areas (LVNodes). LVNodes denote directional conviction and ought to offer support on any test.
If participants were to auction and find acceptance into areas of prior low volume (LVNodes), then future discovery ought to be volatile and quick as participants look to HVNodes for favorable entry or exit.
POCs: POCs are valuable as they denote areas where two-sided trade was most prevalent in a prior day session. Participants will respond to future tests of value as they offer favorable entry and exit.
MCPOCs: POCs are valuable as they denote areas where two-sided trade was most prevalent over numerous day sessions. Participants will respond to future tests of value as they offer favorable entry and exit.
Volume-Weighted Average Prices (VWAPs): A metric highly regarded by chief investment officers, among other participants, for quality of trade. Additionally, liquidity algorithms are benchmarked and programmed to buy and sell around VWAPs.
About
After years of self-education, strategy development, mentorship, and trial-and-error, Renato Leonard Capelj began trading full-time and founded Physik Invest to detail his methods, research, and performance in the markets.
Capelj also develops insights around impactful options market dynamics at SpotGamma and is a Benzinga reporter.
Some of his works include conversations with ARK Invest’s Catherine Wood, investors Kevin O’Leary and John Chambers, FTX’s Sam Bankman-Fried, ex-Bridgewater Associate Andy Constan, Kai Volatility’s Cem Karsan, The Ambrus Group’s Kris Sidial, among many others.
Disclaimer
In no way should the materials herein be construed as advice. Derivatives carry a substantial risk of loss. All content is for informational purposes only.