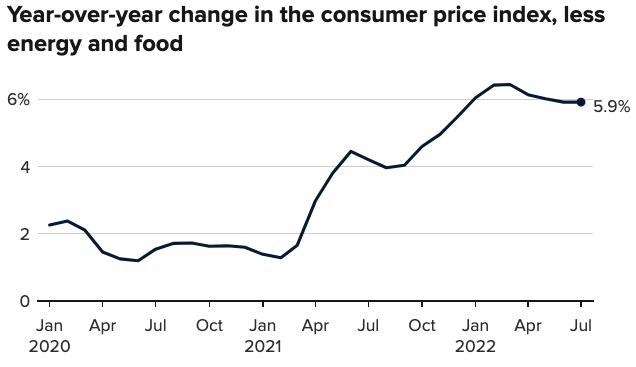
US consumer prices rose by 4.9% in the 12 months to April, down from the previous month’s 5%. Wednesday’s figures suggest inflation is moderating and emboldens the case for a pause to interest rate increases.
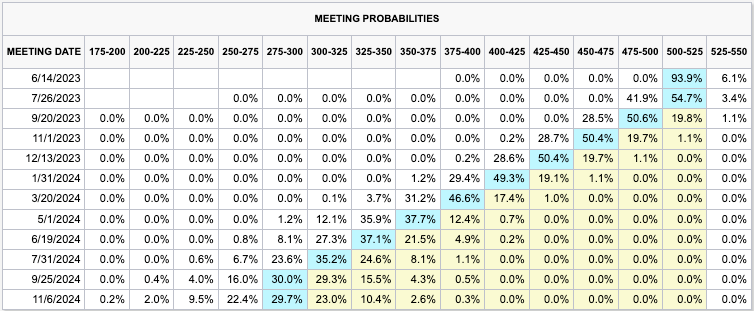
Graphic: Retrieved from CME Group Inc’s (NASDAQ: CME) FedWatch Tool.
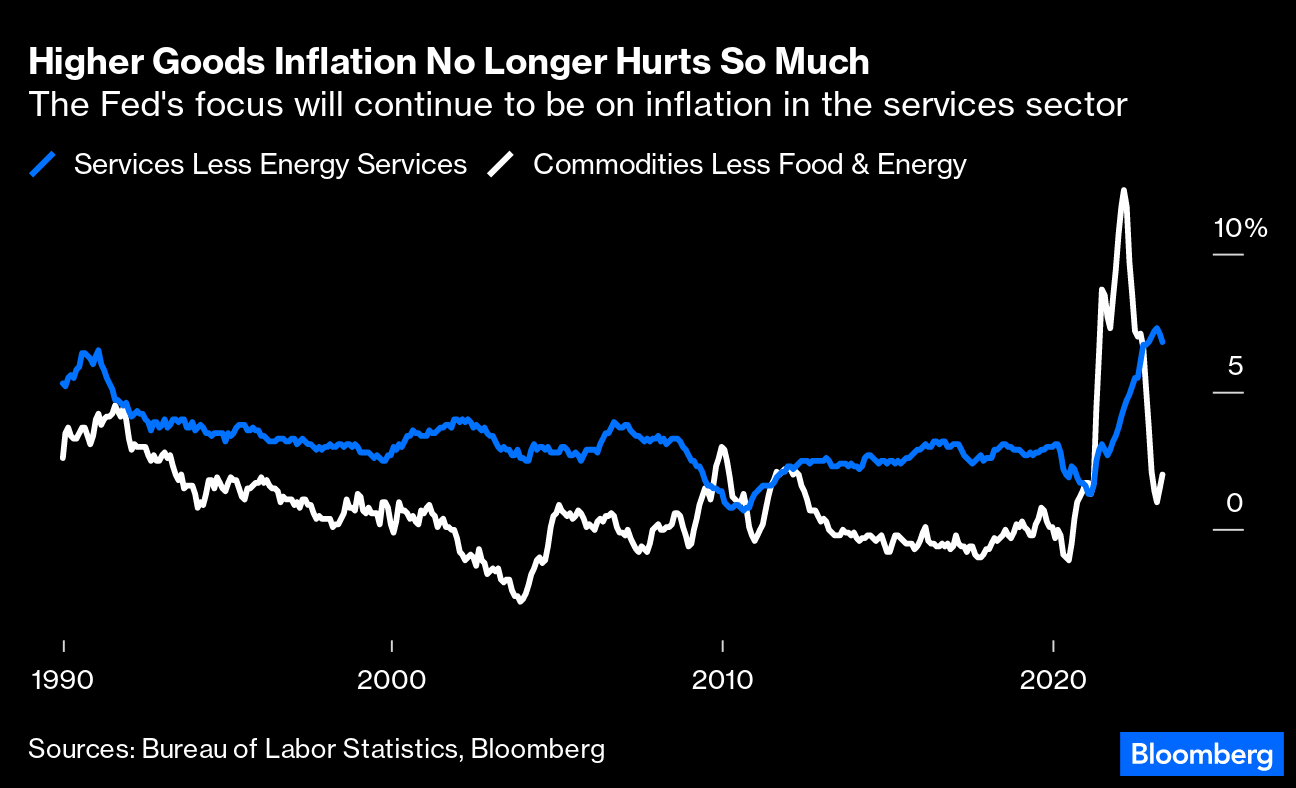
“The Fed will want to see declines in these statistical measures for a few more months before it could feel comfortable about cutting rates,” John Authers writes.
Notwithstanding “sticky price inflation” falling (only “if shelter prices are excluded,” the most challenging “front in the battle on inflation”), applications to purchase and refinance homes rose with yields falling, and that’s exactly what the Fed doesn’t want.
Many maintain the Fed is looking to walk-up long-end yields, and that’s problematic for assets; higher interest rates portend lesser allocations toward risky assets.
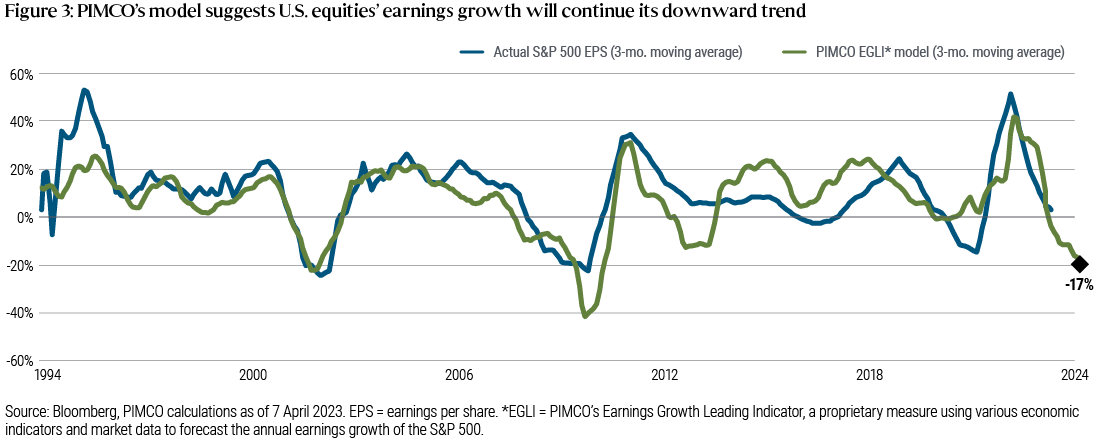
Pimco’s Erin Browne and Emmanuel Sharef add that “12-month returns following the final rate hike could be flat for 10-year U.S. Treasuries, while the S&P 500 could sell off sharply.”
Accordingly, bonds look attractive “for their diversification, capital preservation, and upside opportunities,” while “earnings expectations appear too high, and valuations too rich,” warranting “underweight” equities positioning.
Compounding the risks are flows “that eventually will constrain lending and nominal growth on a 6- to 12-month horizon,” writes Goldman Sachs Group Inc (NYSE: GS).
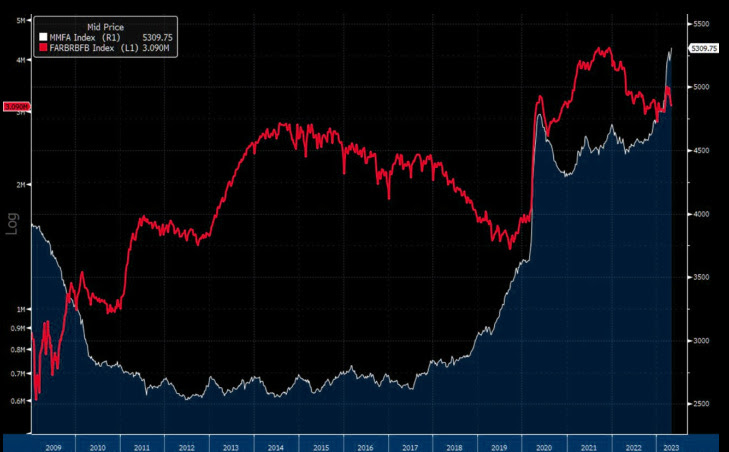
Graphic: Retrieved from Bloomberg via The Market Ear. “The bull in money market funds refuses to cool down.”
In other news was worry over a US debt default.
The US government has been using accounting measures to provide cash after reaching a borrowing limit. Treasury Secretary Janet Yellen informed Congress that these measures might be exhausted by June, resulting in payment disruptions; a default would cause an economic disaster and “global downturn,” threatening “US global economic leadership” and “national security,” Yellen says. A solution (e.g., to raise the debt ceiling) could manifest issuance of “a substantial amount of bills in 2H23 … that would drain liquidity,” Morgan Stanley (NYSE: MS) writes.
Despite the worry, markets are contained in part due to positioning contexts. Decline in realized volatility (RVOL), coupled with implied volatility (IVOL) premium, makes it difficult for the market to resolve directionally.
In fact, Nomura Holdings Inc (NYSE: NMR) said it sees “significant further potential for additional equities re-allocation buying from the vol control space over the next month if this ongoing rVol smash / tight daily ranges phenomenon holds—i.e., +$37.8B of US Equities to buy on theoretical 50bps daily SPX change).”
Options are sold systematically as traders aim to extract the premium; the Ambrus Group’s Kris Sidial says there is a puking off options exposures and short-bias activity (i.e., selling options) used as yield enhancement as traders call bluff on authorities not being there to prevent crises.
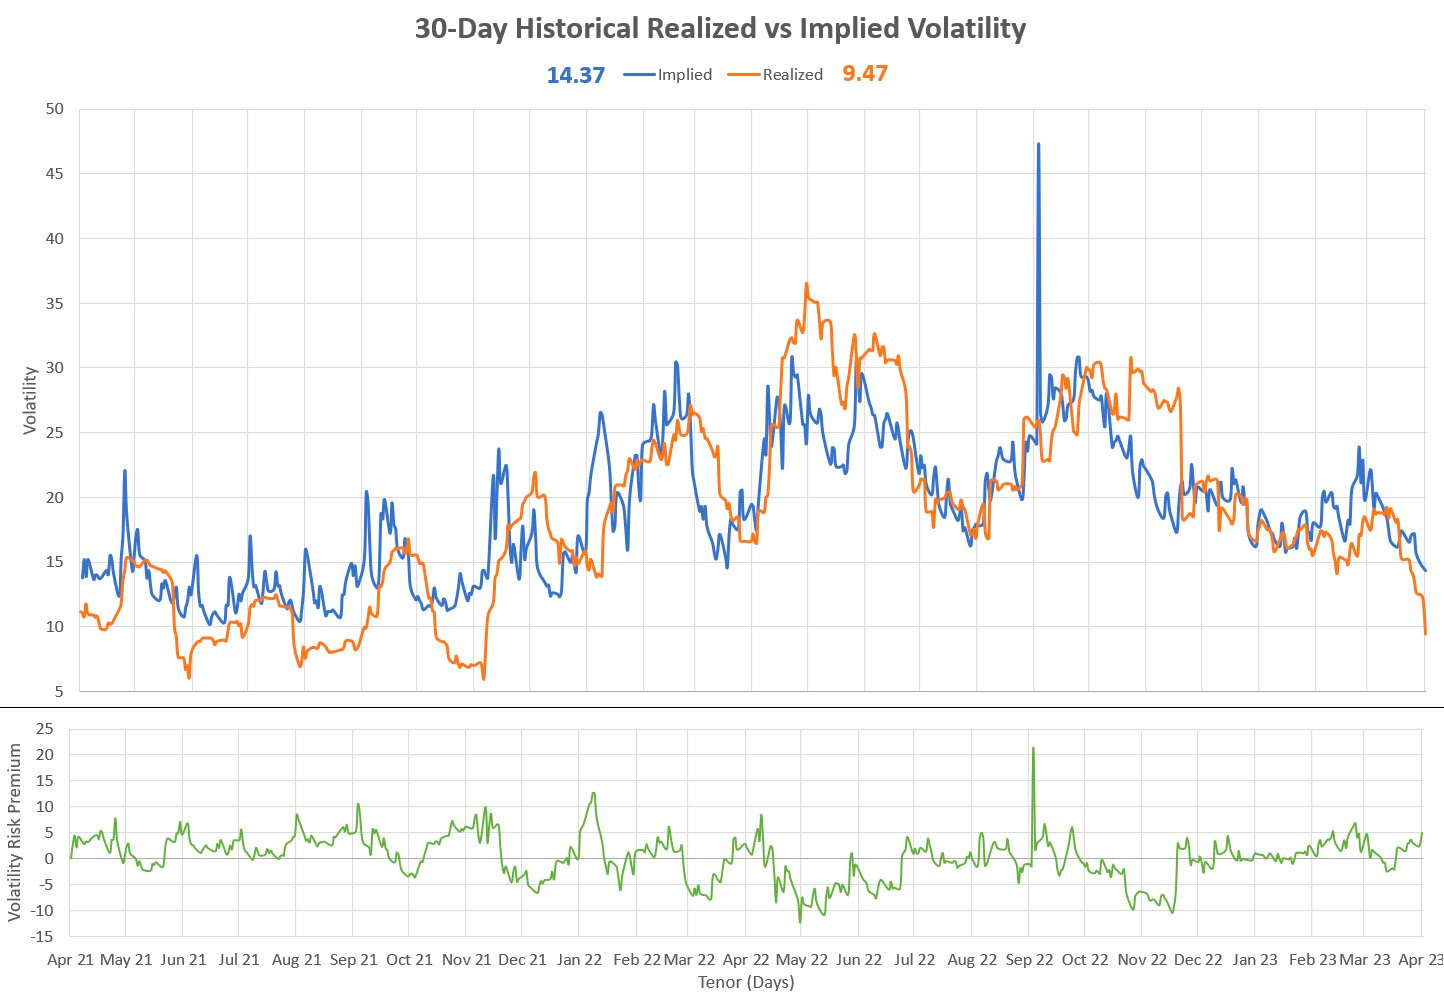
Graphic: Retrieved from Sergei Perfiliev. “This is a 1-month vol – it’s 30 calendar days for implied and I’m using 20 trading days for realized – both of which represent a month.” Note that “juicy VRP = big difference between options’ implied vol (what you pay) and realized vol (what you got). Options are cheap historically, but expensive relative to realized vol.”
Should readers wish to hedge the debt ceiling debacle, June call options on the Cboe Volatility Index appear attractive, some suggest. But, with RVOL as low as it is, owning optionality is not generally warranted. The risk is lower volatility, not higher.
About
Welcome to the Daily Brief by Physik Invest, a soon-to-launch research, consulting, trading, and asset management solutions provider. Learn about our origin story here, and consider subscribing for daily updates on the critical contexts that could lend to future market movement.
Separately, please don’t use this free letter as advice; all content is for informational purposes, and derivatives carry a substantial risk of loss. At this time, Capelj and Physik Invest, non-professional advisors, will never solicit others for capital or collect fees and disbursements. Separately, you may view this letter’s content calendar at this link.
The daily brief is a free glimpse into the prevailing fundamental and technical drivers of U.S. equity market products. Join the 750+ that read this report daily, below!
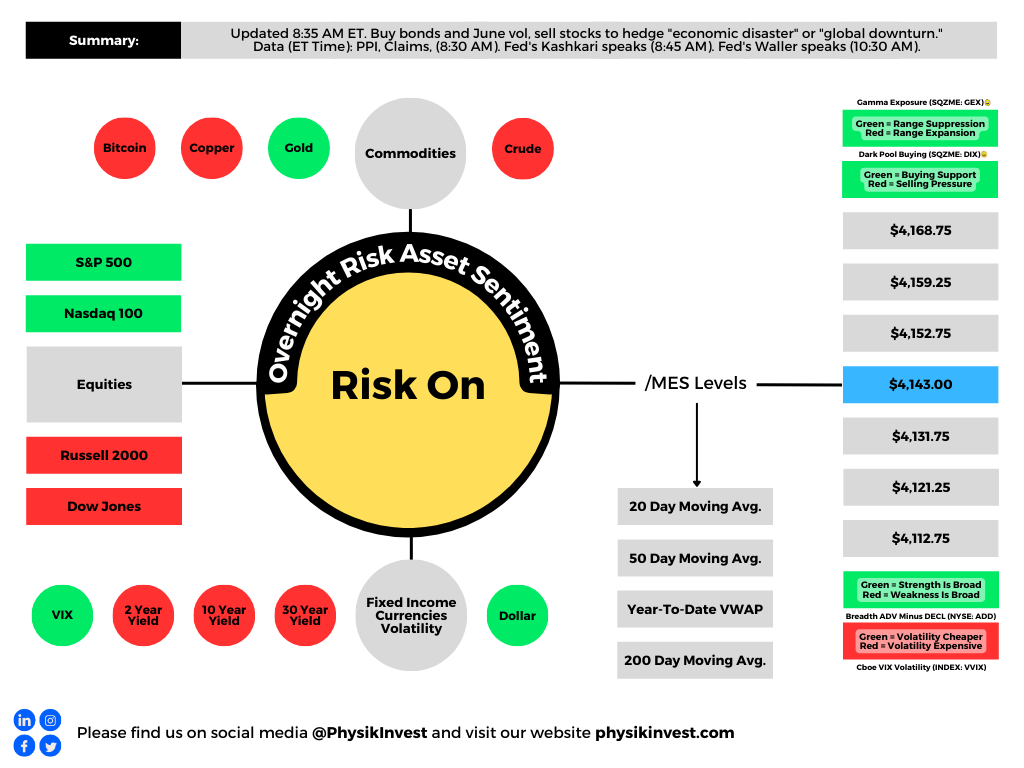
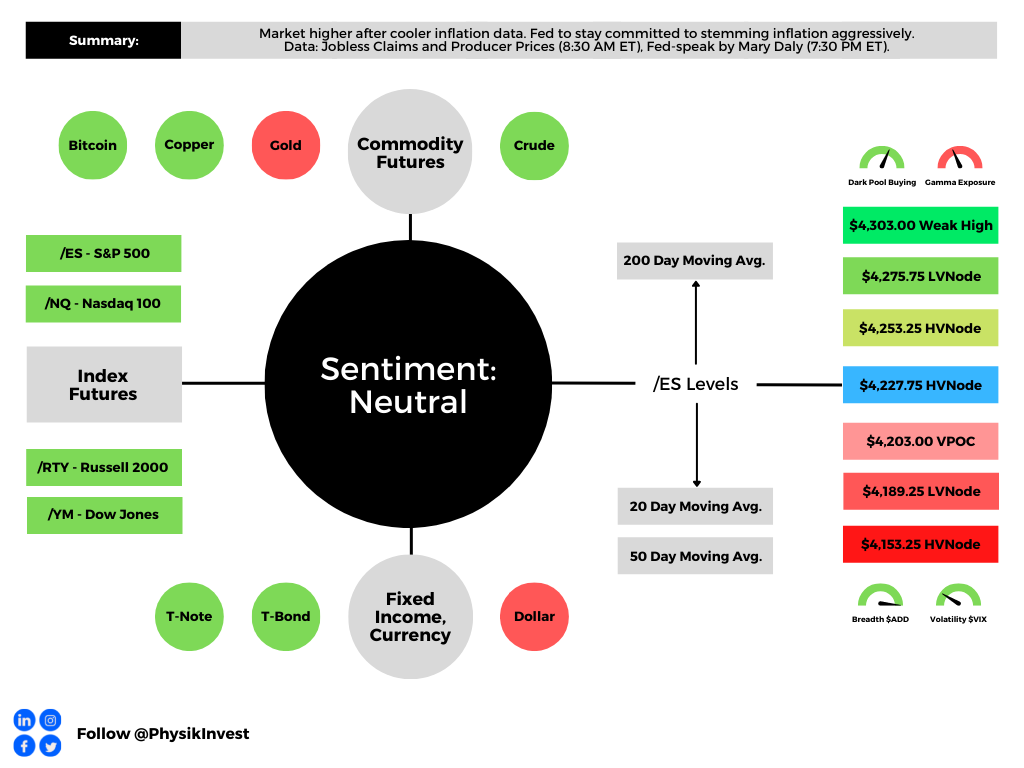
Graphic updated 7:30 AM ET. Sentiment Risk-On if expected /ES open is above the prior day’s range. /ES levels are derived from the profile graphic at the bottom of the following section. Levels may have changed since initially quoted; click here for the latest levels. SqueezeMetrics Dark Pool Index (DIX) and Gamma (GEX) calculations are based on where the prior day’s reading falls with respect to the MAX and MIN of all occurrences available. A higher DIX is bullish. At the same time, the lower the GEX, the more (expected) volatility. Learn the implications of volatility, direction, and moneyness. Breadth reflects a reading of the prior day’s NYSE Advance/Decline indicator. VIX reflects a current reading of the CBOE Volatility Index (INDEX: VIX) from 0-100.
Fundamental
Equity market rally spurred by cooler a Consumer Price Index (CPI).
Expected was an 8.7% rise year-over-year (YoY) and 0.2% month-over-month (MoM). Core CPI (which excludes food and energy) was to rise by 6.1% YoY and 0.5% MoM, respectively.
Officially, the headline number rose to 8.5%. The core CPI rose 5.9% YoY and 0.3% MoM, meaning the March peak remains (6.5% YoY, then).
Participants responded positively to the number, as expected could happen in a case where the CPI printed lower.
As I talked about in yesterday’s morning letter and in a SpotGamma note, with easing inflation:
(1) investors may command a lower rate of return for their purchasing power and (2) lower rates (if policymakers were to become less aggressive) do less to negatively impact discounted cash flows and the ability to finance future growth.
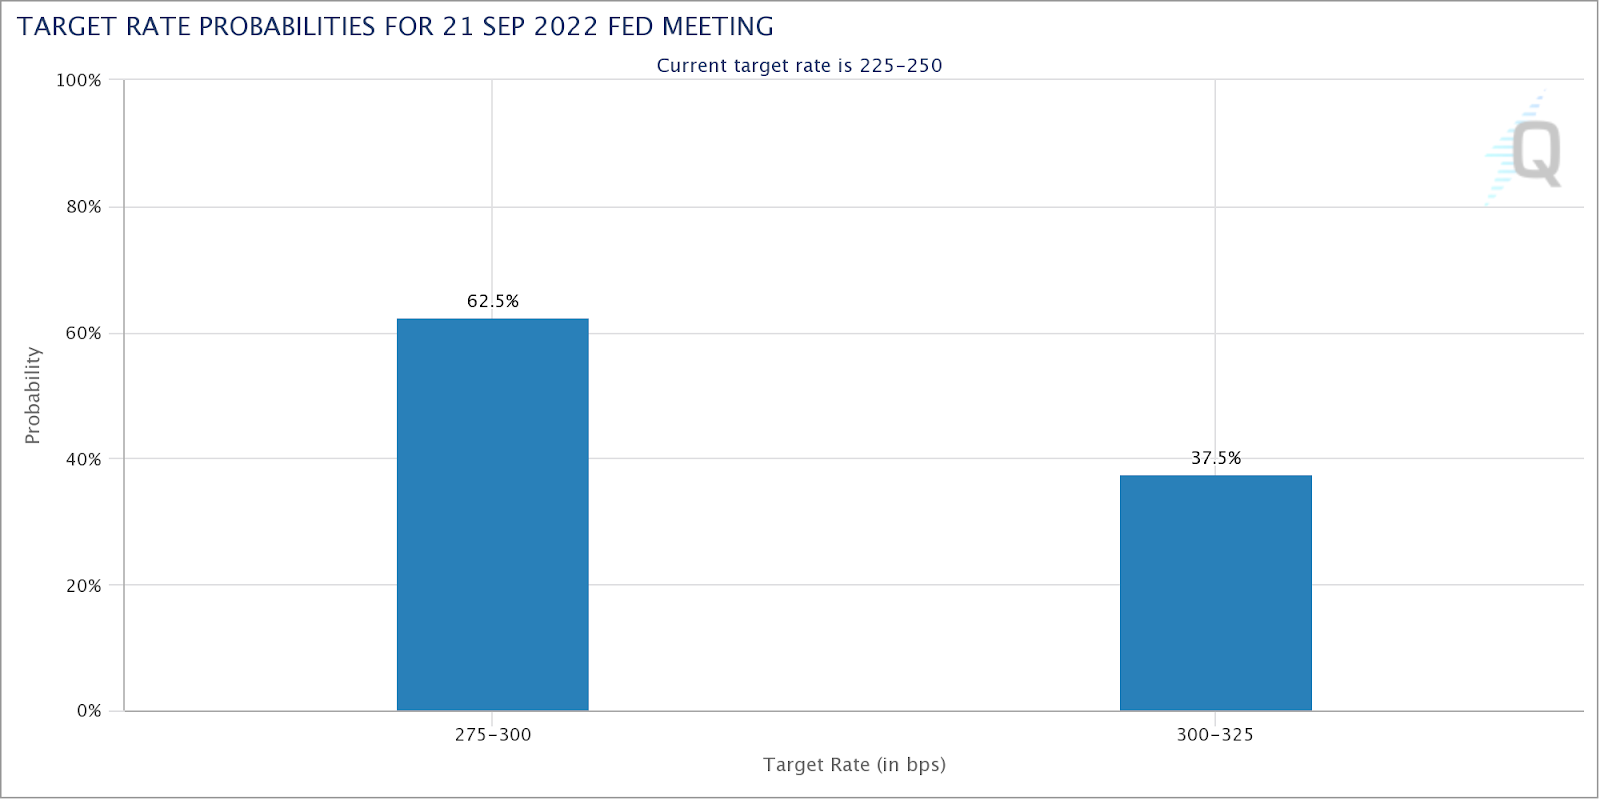
It is the case that immediately after the release of the CPI, traders dramatically shifted their bets on monetary action.
Previously, it was thought a 75 to 100 basis point hike would follow the report. Now, there are higher odds, as priced by the market, that there is a 25 to 50 basis point hike.
Graphic: Retrieved from CME Group Inc (NASDAQ: CME).
“I think the market is a bit overly giddy on this CPI number and it’s probably unlikely that the [Federal Reserve] (Fed) will start to ease up and take a less hawkish stance,” The Ambrus Group’s Kris Sidial put forth.
“The increase in risk assets somewhat gives the Fed the green light to be able to move more swiftly with a hawkish tone.”
Accordingly, the Fed’s Mary Daly said it is too early to declare victory in the inflation fight (and rightfully so), signaling, however, that she may support a slower pace of hikes.
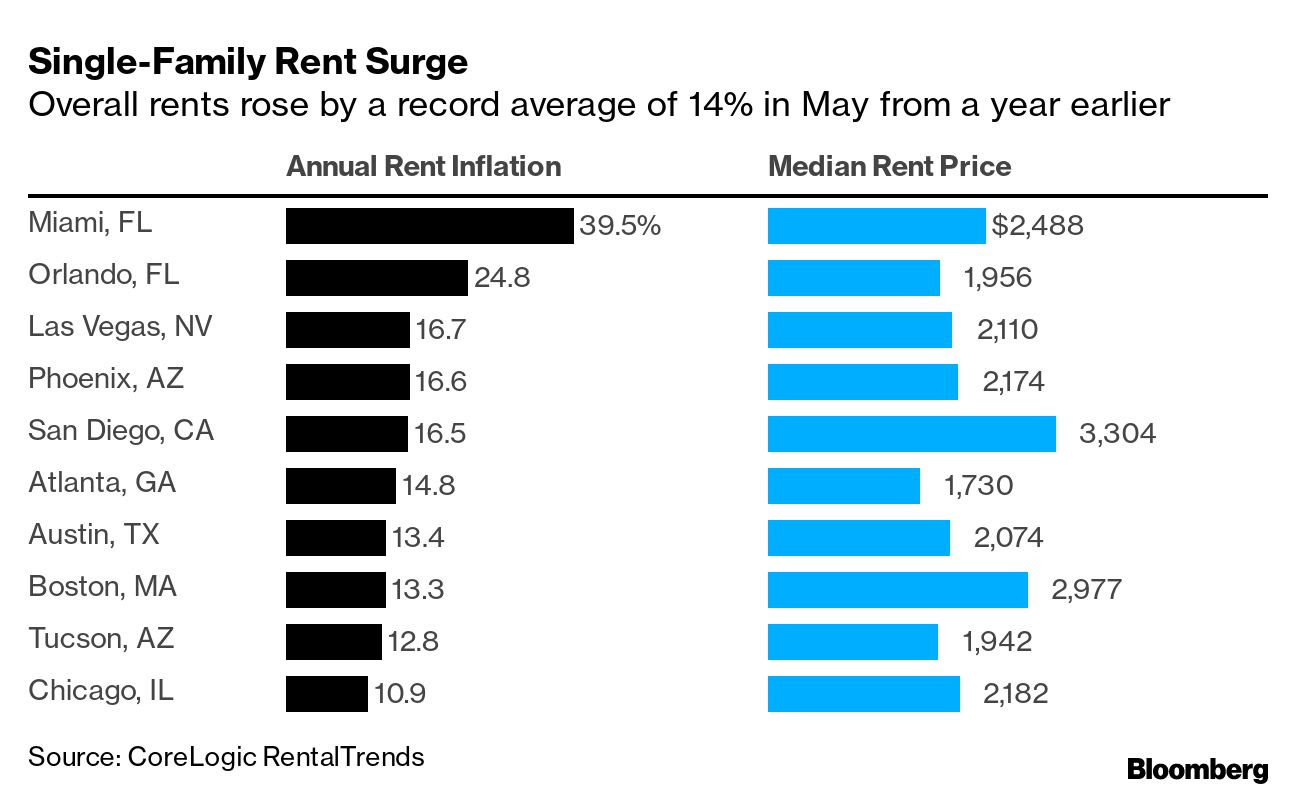
This is as home buyers and renters, in some areas, are seeing large hikes in prices. For instance, per one Bloomberg article, a Miami native saw their rent increase “by $650 to $2,400.00 a month,” forcing them to search for new places to live.
The Ambrus Group’s Sidial adds:
“Inflation is one of those things that is difficult to control when it’s out [of] the bag (historically). I think the Fed understands this and if they have the opportunity to tame it, while not completely obliterating risk assets, it seems like a perfect scenario.”
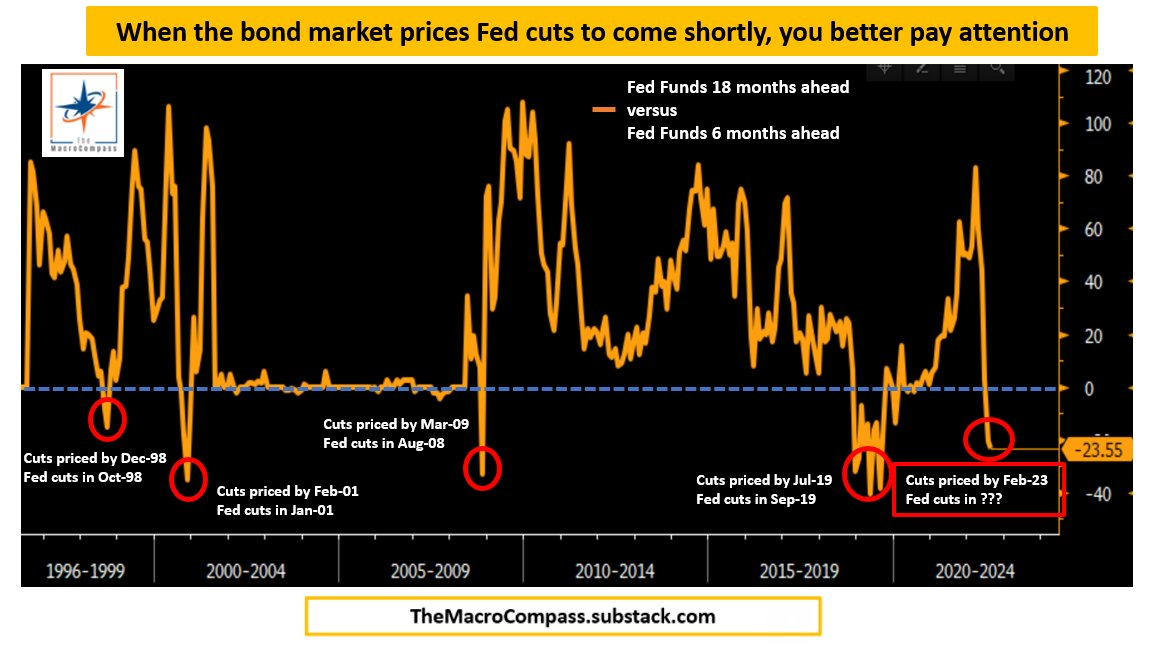
Ultimately, farther out in time, some metrics, which have incredible success in forecasting pivots, show the Fed likely to cut in 2023, shortly following the aggressive hiking cycle.
Graphic: Retrieved from Alfonso Peccatiello of The Macro Compass.
On the topic of (eventual) declines and slowing in the risk assets (like housing), “in most cases today, a borrower with 60 points of equity in their property, even facing moderate declines in their current home price, are not a big default risk,” explains Dan Ivascyn of PIMCO.
“A lot of what we like in the market today is seasoned-type risk that benefits from the multi-years of home price appreciation, and therefore is much less sensitive to what goes on from this point forward.”
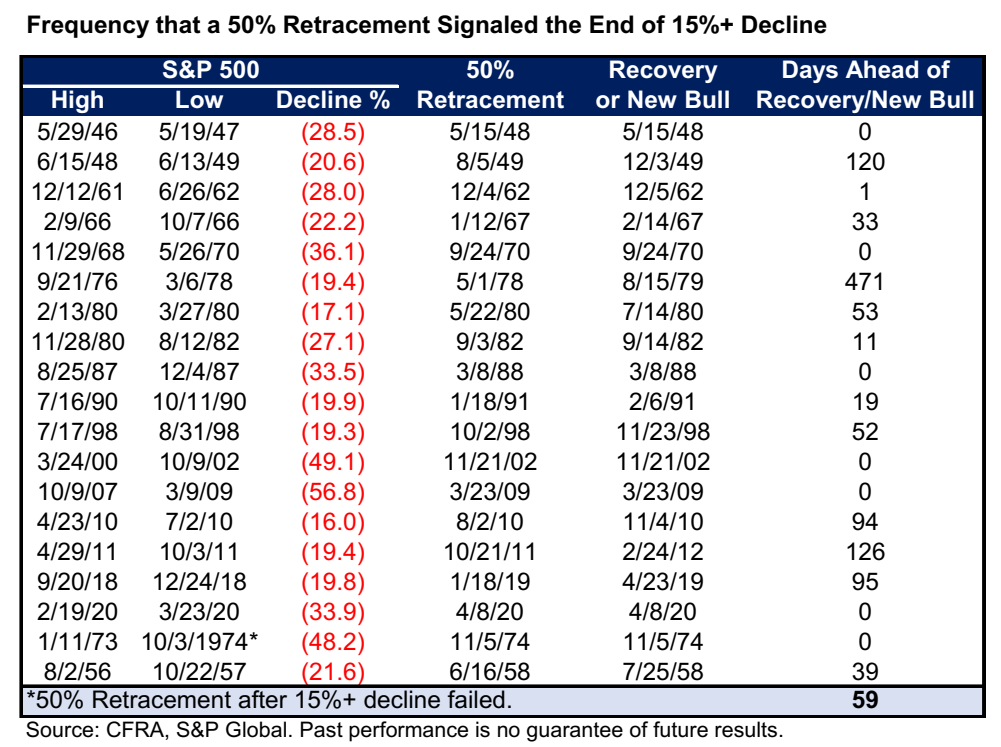
From an S&P 500 (INDEX: SPX) perspective, the index has basically recouped half its losses for the year. This often came after the bear lows were in.
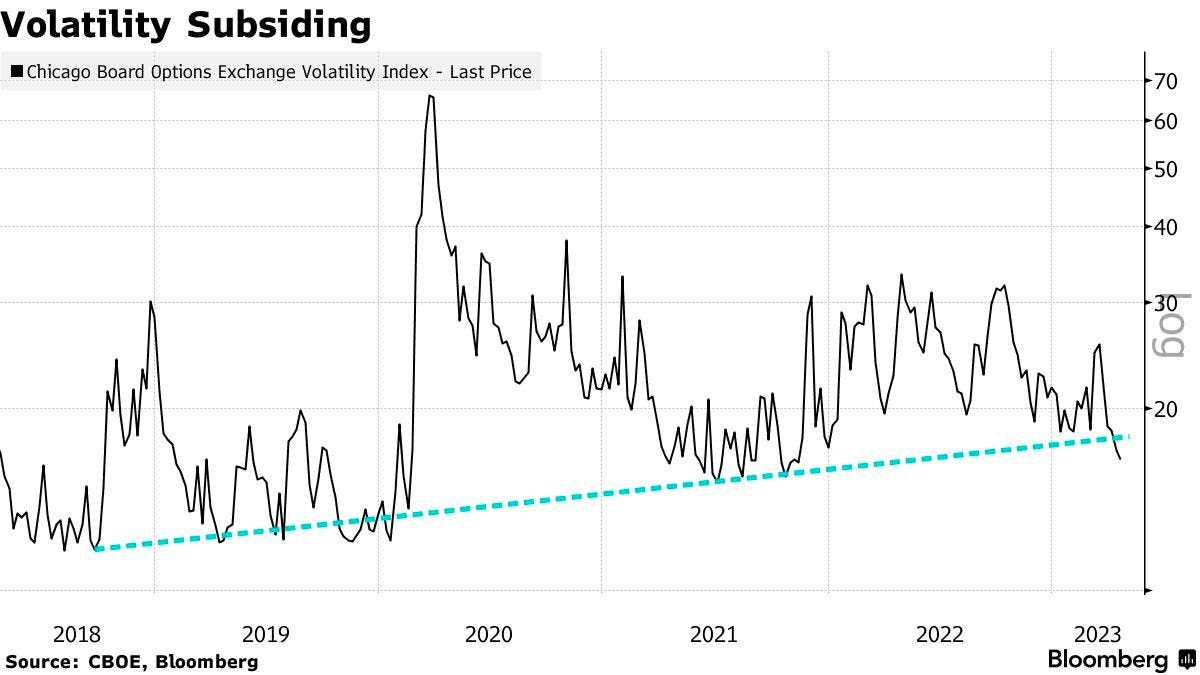
Graphic: Retrieved from Bloomberg.
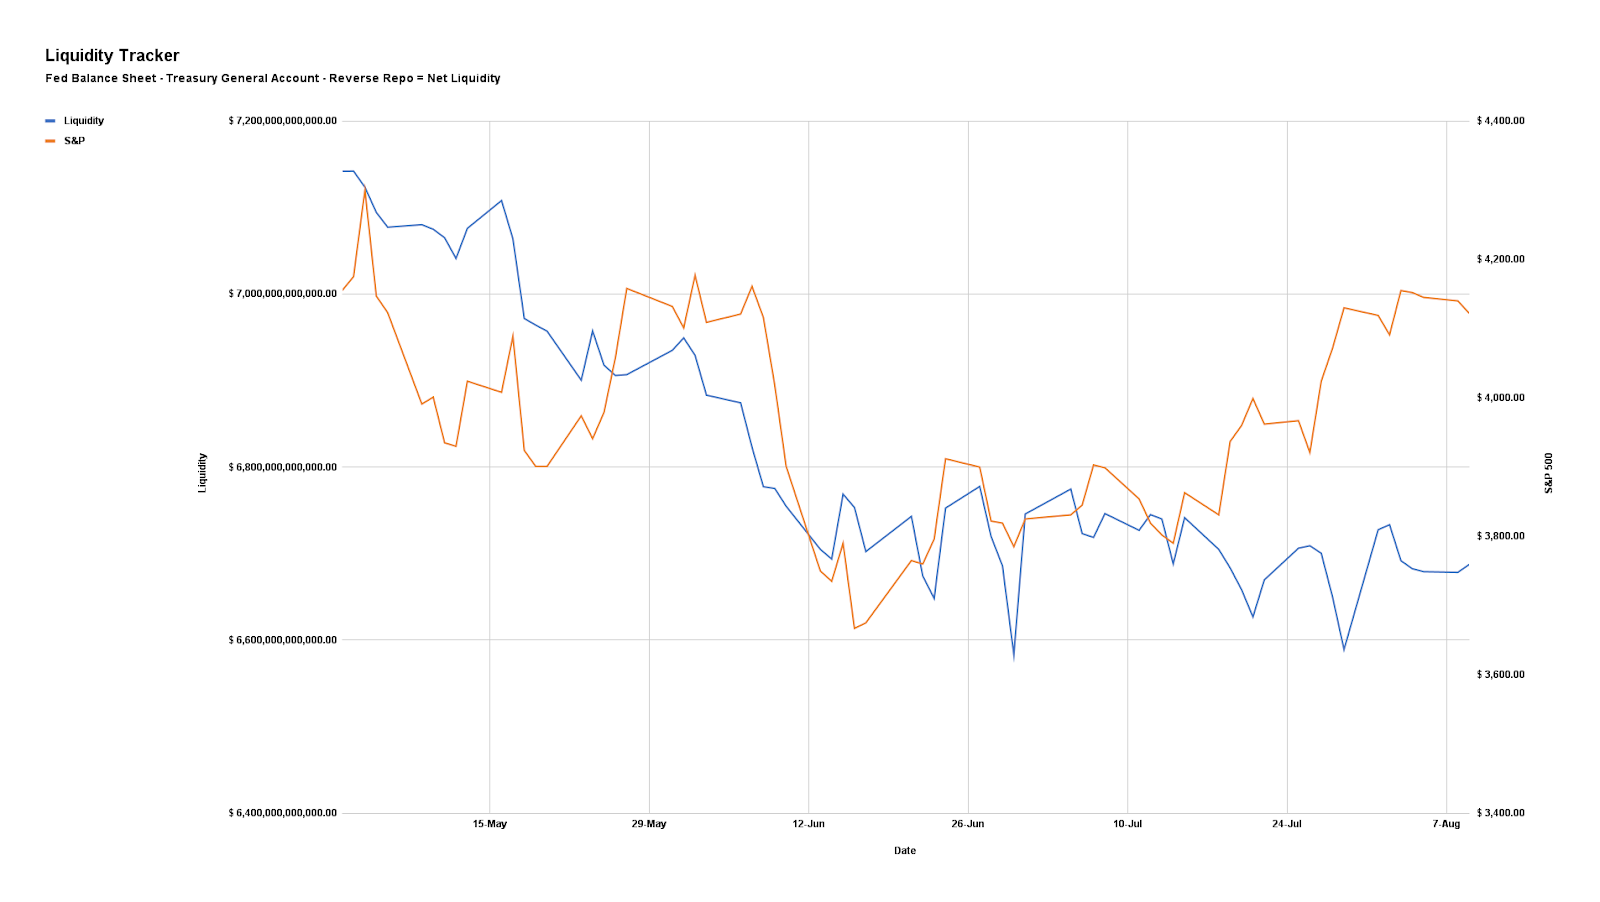
Notwithstanding, here’s our updated liquidity tracker that is monitoring the “preeminent driver of markets during the post-crisis decade.”
Graphic: Via Physik Invest. Data compiled by @jkonopas623. Fed Balance Sheet data, here. Treasury General Account Data, here. Reverse Repo data, here. NL = BS – TGA – RRP.
Positioning
As of 7:15 AM ET, Thursday’s expected volatility, via the Cboe Volatility Index (INDEX: VIX), sits at ~1.04%. Net gamma exposures increasing may promote tighter trading ranges.
Given where realized (RVOL) and implied (IVOL) volatility measures are, as well as skew, it is beneficial to be a buyer of options structures (i.e., replacing static directional exposures or delta with those that are dynamic) tied to the broader measures we follow like the S&P 500 (given increased average stock correlation and lower return dispersion).
The reason why?
Per SpotGamma: “From an options perspective, a lot of the boost from volatility compression has played out. With implied volatility at a lower bound, it may be opportune to replace static delta bets for those that are dynamic (i.e., long option exposures) and have less to lose in this lower volatility environment.”
“In a case where market participants see the Fed keeping its commitment to aggressive monetary policy action, negative delta options exposures may outperform static short equity (bets on the downside).”
Technical
As of 7:30 AM ET, Thursday’s regular session (9:30 AM – 4:00 PM ET), in the S&P 500, is likely to open in the upper part of a positively skewed overnight inventory, outside of prior-range and -value, suggesting a potential for immediate directional opportunity.
In the best case, the S&P 500 trades higher.
Any activity above the $4,227.75 HVNode puts into play the $4,253.25 HVNode. Initiative trade beyond the latter could reach as high as the $4,275.75 LVNode and $4,303.00 Weak High, or higher.
In the worst case, the S&P 500 trades lower.
Any activity below the $4,227.75 HVNode puts into play the $4,203.00 VPOC. Initiative trade beyond the VPOC could reach as low as the $4,189.25 LVNode and $4,153.25 HVNode, or lower.
Click here to load today’s key levels into the web-based TradingView charting platform. Note that all levels are derived using the 65-minute timeframe. New links are produced, daily.
Graphic: 65-minute profile chart of the Micro E-mini S&P 500 Futures.
Definitions
Volume Areas: A structurally sound market will build on areas of high volume (HVNodes). Should the market trend for long periods of time, it will lack sound structure, identified as low volume areas (LVNodes). LVNodes denote directional conviction and ought to offer support on any test.
If participants were to auction and find acceptance into areas of prior low volume (LVNodes), then future discovery ought to be volatile and quick as participants look to HVNodes for favorable entry or exit.
POCs: POCs are valuable as they denote areas where two-sided trade was most prevalent in a prior day session. Participants will respond to future tests of value as they offer favorable entry and exit.
MCPOCs: POCs are valuable as they denote areas where two-sided trade was most prevalent over numerous day sessions. Participants will respond to future tests of value as they offer favorable entry and exit.
Volume-Weighted Average Prices (VWAPs): A metric highly regarded by chief investment officers, among other participants, for quality of trade. Additionally, liquidity algorithms are benchmarked and programmed to buy and sell around VWAPs.
About
After years of self-education, strategy development, mentorship, and trial-and-error, Renato Leonard Capelj began trading full-time and founded Physik Invest to detail his methods, research, and performance in the markets.
Capelj also develops insights around impactful options market dynamics at SpotGamma and is a Benzinga reporter.
In no way should the materials herein be construed as advice. Derivatives carry a substantial risk of loss. All content is for informational purposes only.
What Happened: U.S. stock index futures auctioned lower last week.
What Does It Mean: Market participants witnessed a rapid de-risking event, as a result of individual stock volatility, and a subsequent v-pattern recovery, that was later taken back as Friday’s large February monthly options expiration (OPEX) neared.
More On The V-Pattern: A pattern that forms after a market establishes a high, retests some support, and then breaks above said high. In most cases, this pattern portends continuation.
At the same time, bond and equity market volatility diverged, materially.
In other words, a rapid move up in rates — as investors become increasingly concerned over the value of their bonds due to rising debt levels and inflation — has yet to be priced in as an equity market risk.
Graphic 1: The Market Ear unpacks divergence in volatility across different markets.
Adding, the risk of inflation comes alongside a potential for slowing in economic growth, which may have knock-on effects, such as savers protecting their capital by investing in non-productive assets, thus helping form speculative asset bubbles.
Risk Of Monetary Support: The increased moneyness of financial markets; investors look to exchange-traded products (e.g., S&P 500) as savings vehicles, thereby forcing participants, like the Federal Reserve, to backstop market liquidity, and promote market and economic stability in times of turmoil.
A great paper on the impact of central bank intervention, passive index investing, and asymmetric liquidity provisioning.
Still, as Bloomberg suggests, reasons to not panic include an overreaction by market participants, premature Fed tightening, and a risk asset rout (i.e., rising rates may eventually increase demand for safety assets).
“Typically it’s a good environment for risk assets. Neither the pace nor the extent of the move so far has been unusual relative to other historical moves coming out of a recession,” said Pimco’s Erin Browne. “It would take a significant move in real yields in order to disrupt risk markets broadly.”
Graphic 2: Benchmark 10-year real rate in solidly negative territory.
Moving on, given OPEX, participants have a clue as to why the market failed to resolve directionally over the past week: option expiries mark an end to pinning (i.e, the theory that market makers and institutions short options move stocks to the point where the greatest dollar value of contracts will expire worthless) and the reduction dealer gamma exposure.
Aside from OPEX, we must talk more about the v-pattern recovery and a prior week’s spike exit from balance, as well as low broad market volatility.
In light of the v-pattern, balance, and spike, the S&P 500’s long-term uptrend remains intact. In support of this uptrend, systematic and hedge fund participants are increasing their long-exposure, given the economic recovery, and a drop in volatility.
Beyond that, speculative activity in the options market and measures of market liquidity fail in offering much information.
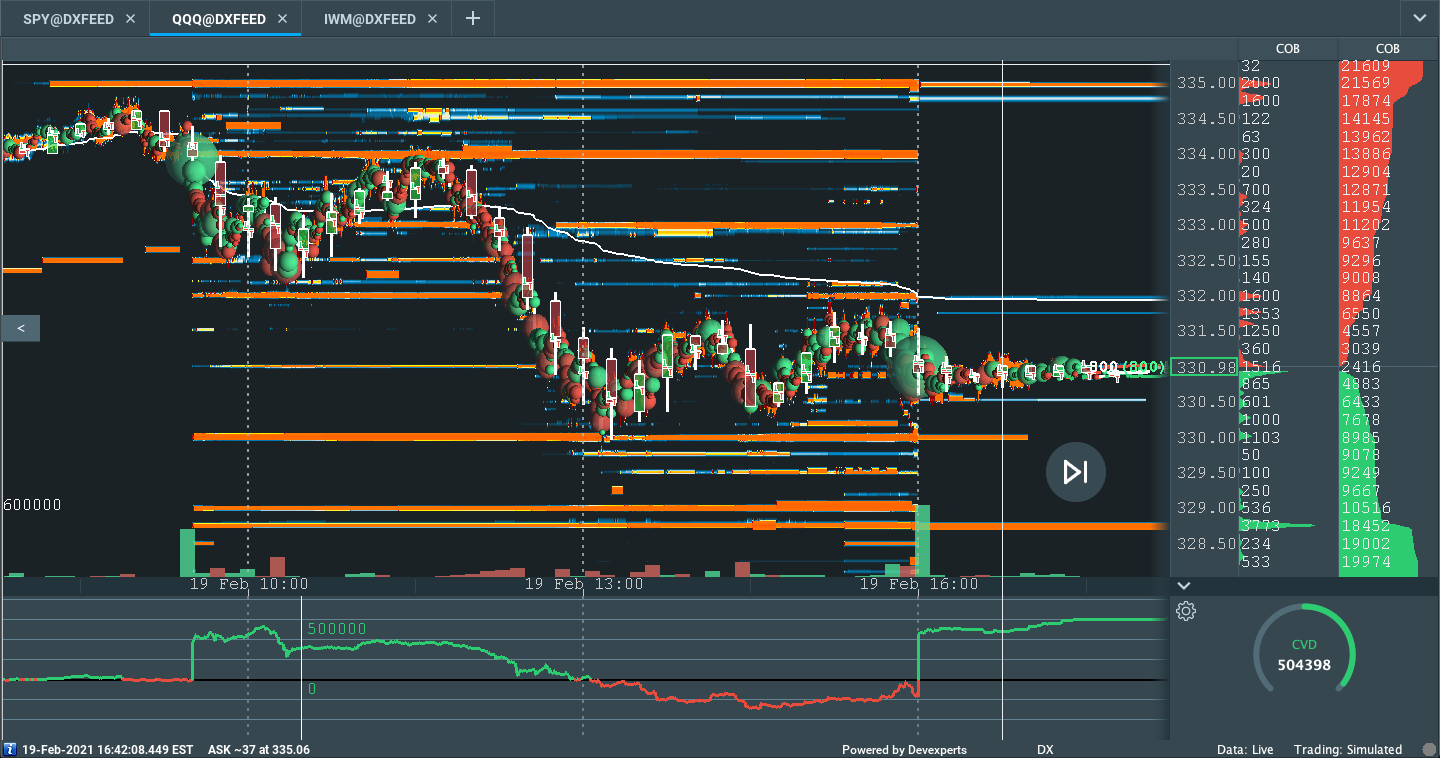
Graphic 3: Physik Invest maps out the purchase of call and put options in the SPDR S&P 500 ETF Trust(NYSE: SPY), for the week ending February 19, 2021. Activity in the options market was primarily concentrated in short- and long-dated tenors, near the $390, a strike that corresponds with $3,900.00 in the cash-settled S&P 500 Index (INDEX: SPX).
SPY Market Liquidity
QQQ Market Liquidity
IWM Market Liquidity
What To Expect: U.S. stock indexes are positioned for directional resolve.
This comes alongside the acceptance of higher prices (inside a prominent high-volume area, or HVNode) and an overnight rally-high at $3,959.25.
More On Overnight Rally Highs: Typically, there is a low historical probability associated with overnight rally-highs ending the upside discovery process.More On Volume Areas: A structurally sound market will build on past areas of high-volume. Should the market trend for long periods of time, it will lack sound structure (identified as a low-volume area which denotes directional conviction and ought to offer support on any test). If participants were to auction and find acceptance into areas of prior low-volume, then future discovery ought to be volatile and quick as participants look to areas of high-volume for favorable entry or exit.
What To Do: In the coming sessions, participants will want to pay attention to the VWAP anchored from the $3,959.25 peak and $3,909.25 HVNode.
Volume-Weighted Average Prices (VWAPs): Metrics highly regarded by chief investment officers, among other participants, for quality of trade. Additionally, liquidity algorithms are benchmarked and programmed to buy and sell around VWAPs.
In the best case, the S&P 500 opens and remains above the $3,909.25 volume area.
Additionally, auctioning above the $3,915.00 VWAP would suggest buyers, on average, are in control and winning, since the February 15 rally high.
Auctioning beneath $3,909.25 turns the HVNode, nearby, into an area of supply, offering initiative sellers favorable entry and responsive buyers favorable exit.
The situation would drastically deteriorate with trade beneath the $3,880.00 HVNode, the last reference before participants find acceptance in an area of low-volume.
In such scenario, future discovery ought to be volatile and quick as participants repair some of the poor structures left in the wake of a prior advance, and look to the next area of high-volume (i.e., $3,830.75) for favorable entry and exit.
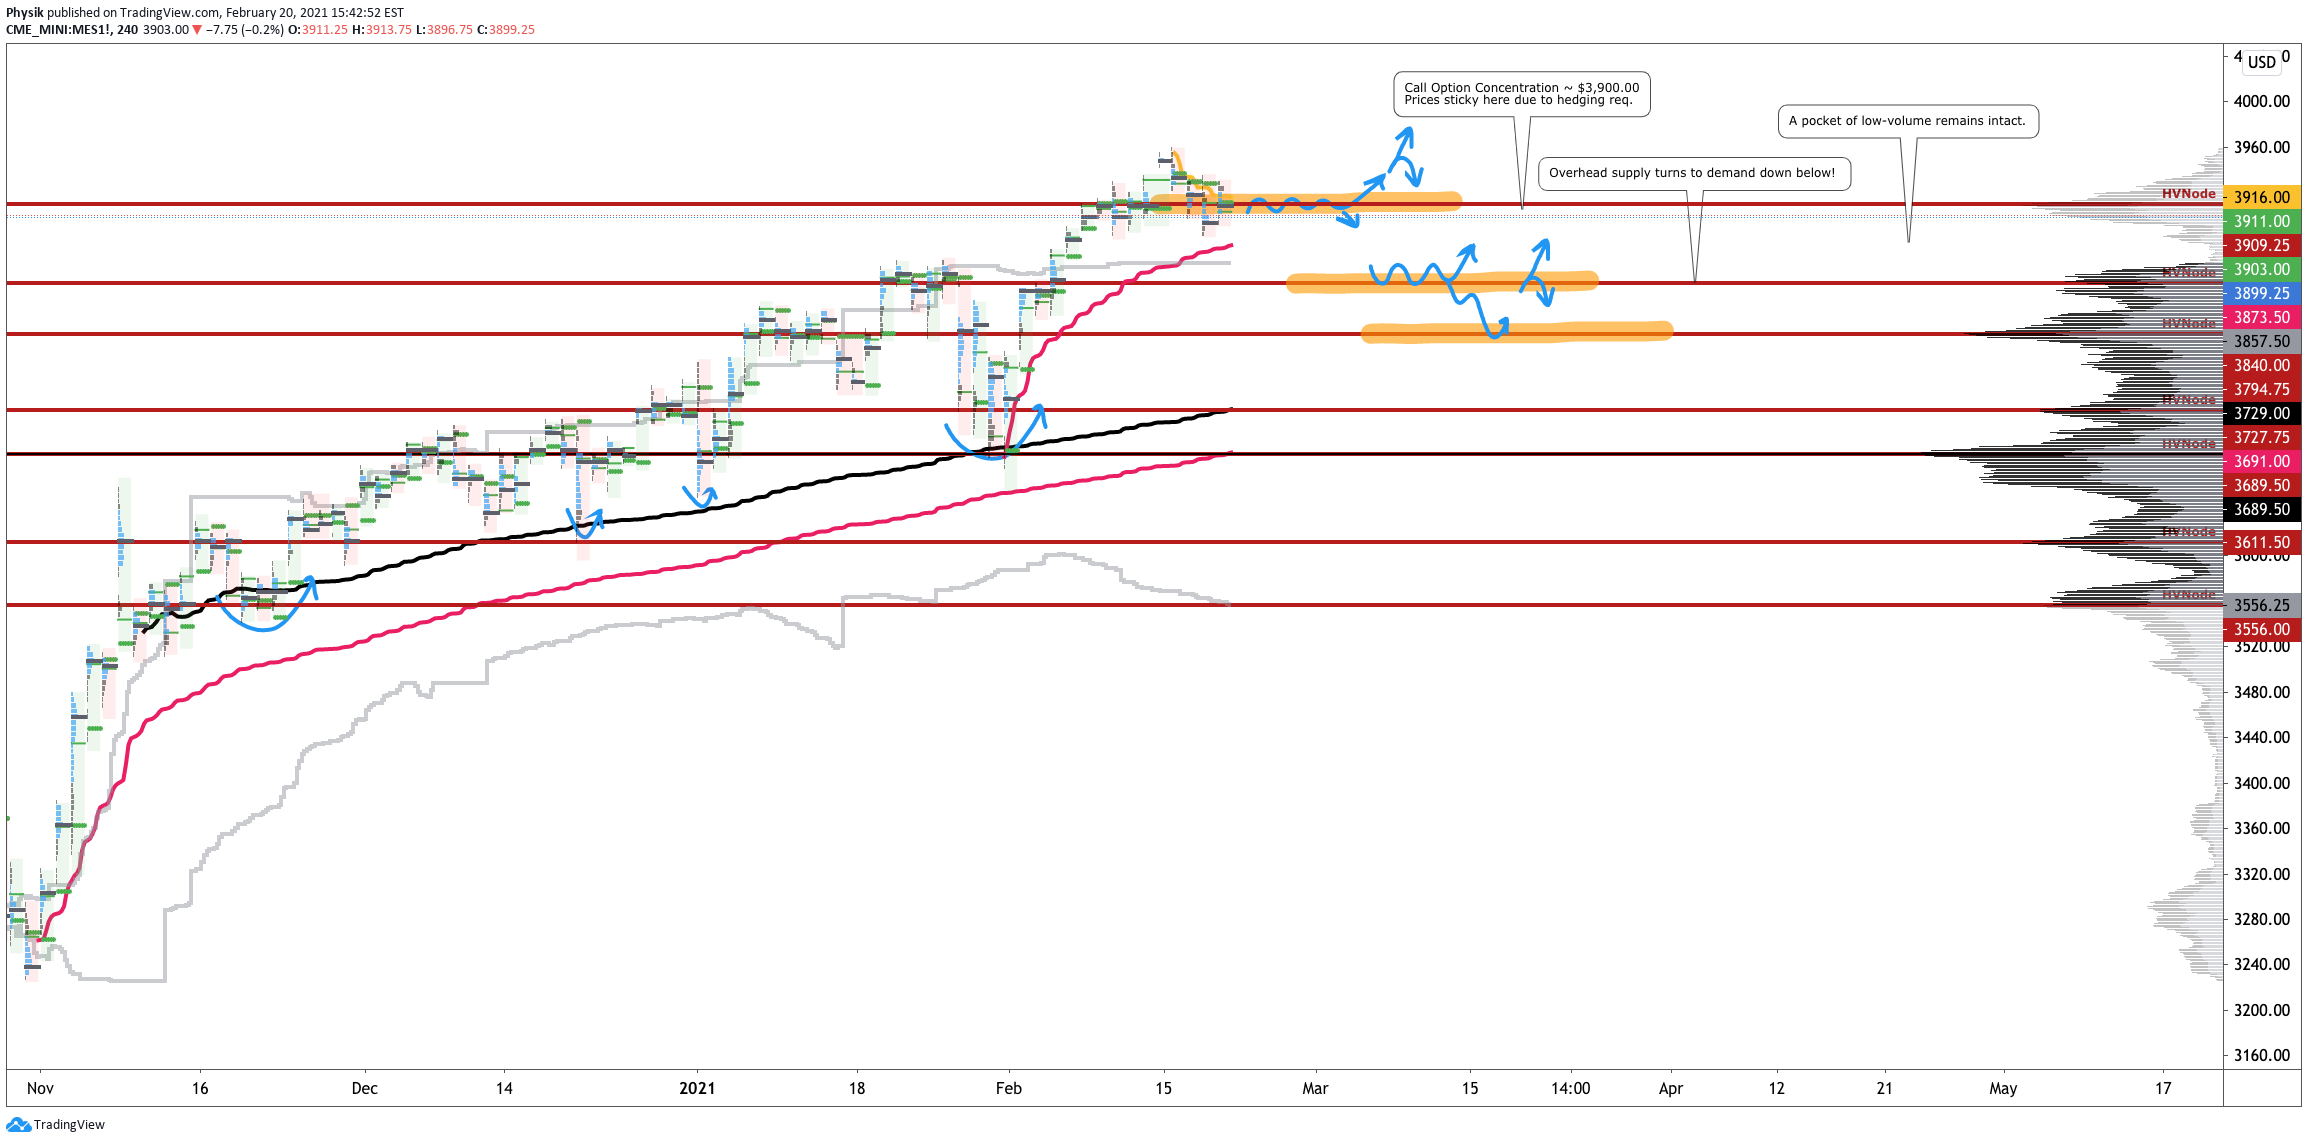
Graphic 4: Profile overlays on a 65-minute and 4-hour chart of the Micro E-mini S&P 500 Futures. See all decision levels of /ES and /NQ here, also.
Conclusions: The go/no-go level for next week’s trade is $3,909.25.
Any activity at this level suggests market participants are looking for more information to base their next move. Anything above (below) this level increases the potential for higher (lower).