
The daily brief is a free glimpse into the prevailing fundamental and technical drivers of U.S. equity market products. Join the 600+ that read this report daily, below!
Fundamental
Key, yesterday, was the Federal Reserve’s (Fed) move to rein inflation with another 75 basis point interest rate hike. This lifted the target for the federal funds rate to 2.25-2.5%.
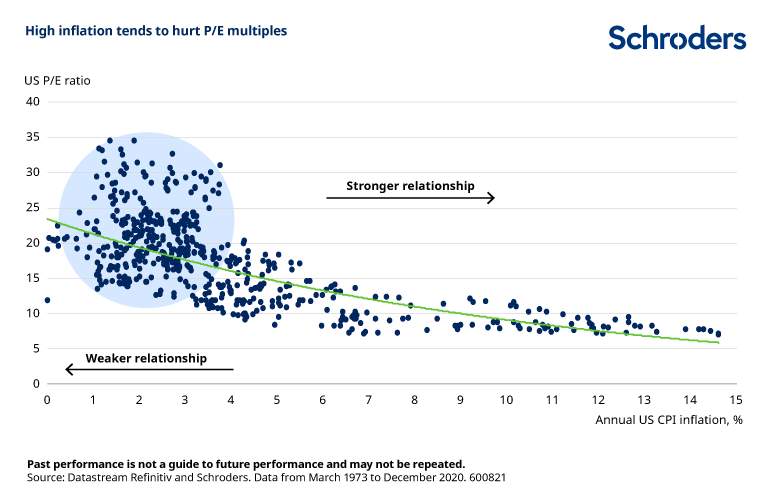
Accordingly, with inflation (which is to be dampened) a negative for stocks, a primary driver behind this year’s de-rate, already, equity markets closed sharply higher.
Despite room for higher rates, the Fed explained future decisions would “depend on the data,” and that, per Bloomberg, the economy is likely “to withstand rapid monetary tightening.”
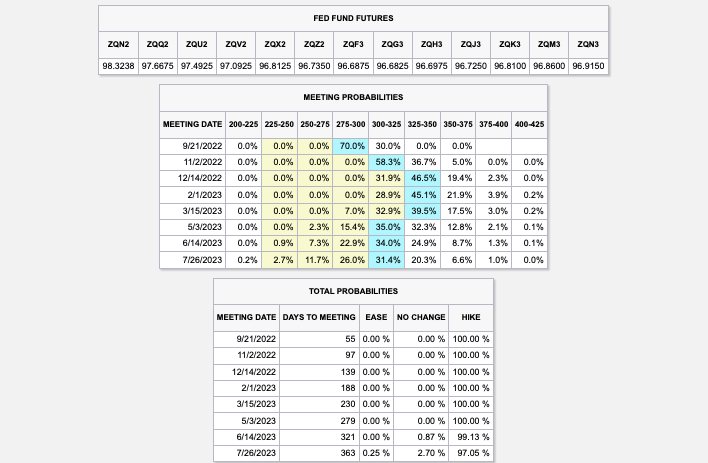
Adding, participants are, now, pricing in the potential for a federal funds rate peak in the range of 3.25-3.50% early-to-mid 2023, down from 4.00-4.75% after the last rate hike took place.
Strategists at the likes of Bank of America Corporation (NYSE: BAC) put forth that it is likely, given an economic slowing, that the Fed, indeed, cuts rates next year and ends quantitative tightening (QT).
“The Fed is likely to stop QT with rate cuts due to the contradictory signal it sends on monetary policy and to simplify policy communications; the Fed will likely not want to be easing with rate cuts but tightening with QT,” the bank’s strategists explained.
An end to QT would cut the supply that the “Treasury needs to issue to cover Fed redemptions. It also means the Fed may conduct secondary purchases, further limiting the amount of supply the market needs to absorb.”
This is in comparison to the narrative we discussed earlier this week, put forth by Damped Spring Advisors’ Andy Constan.
With “most of [the Fed] balance sheet reduction to be run-off” – non-reinvestment of “proceeds from maturing assets they own” – coupled with the Treasury halving “coupon issuance that the market must absorb,” Constan explained, instead, that the “Fed is done for the summer.”
This is likely to “result in less surprise and falling asset volatility” as investors realize “they are now under-risked,” which may drive a “risk premium contraction” and demand for risk assets.
Positioning
As of 6:50 AM ET, Thursday’s expected volatility, via the Cboe Volatility Index (INDEX: VIX), sits at ~1.22%. Net gamma exposures increasing may promote tighter ranges.
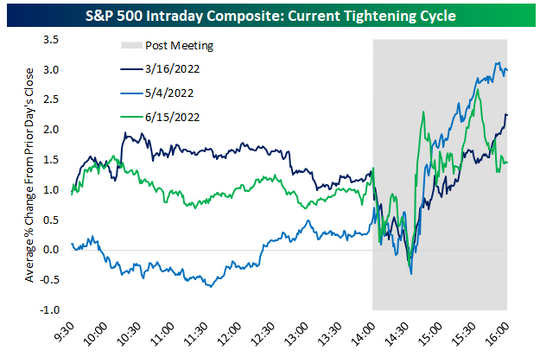
It is often, just after an event, that market movement is the result of inventory rebalances. Per Kai Volatility’s Cem Karsan, the subsequent move is to be “tied to the incremental effects on liquidity (QE/QT).”
Rising rates and the withdrawal of liquidity, coupled with the impact of inflation and an economic slowing, could prompt continued pressure on equity markets.
Given the macro risk, and the poor performance of implied volatility (IVOL), relative to that which markets have realized (RVOL), per The Ambrus Group’s Kris Sidial, “if you wanted to go out and hedge, the opportunity is still there in the equity space.”
Should investors “ditch their [old] hedges in frustration as sentiment improves, because they didn’t work properly in a falling market,” this may set up “the potential for a second-leg-down event,” in the next year, as well explained in the Systemic Individual Investor.
“During the next sell-off, panic put-buying can cause a much more violent downward spiral, because options dealers are forced to sell an increasing amount of S&P futures into an accelerating down move.”
So, what to do?
With call options outperforming “their delta to the upside,” it continues to make much sense to replace static equity long exposure with that which is dynamic, Karsan explained.
Technical
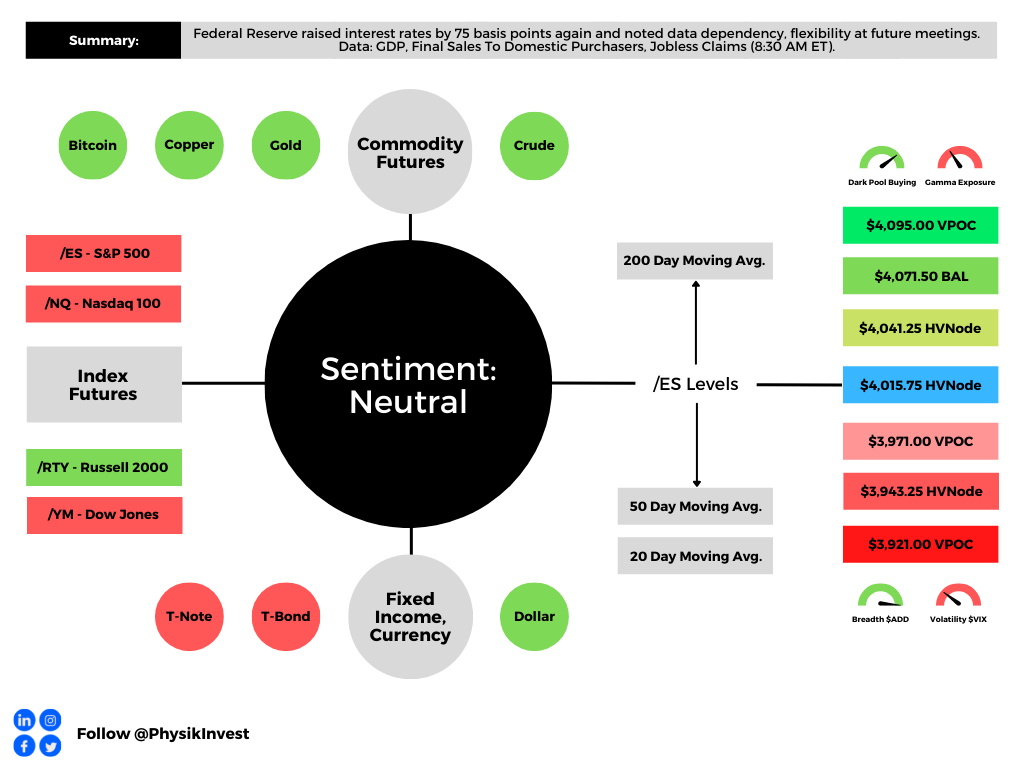
As of 6:50 AM ET, Thursday’s regular session (9:30 AM – 4:00 PM ET), in the S&P 500, is likely to open in the middle part of a negatively skewed overnight inventory, inside of prior-range and -value, suggesting a limited potential for immediate directional opportunity.
In the best case, the S&P 500 trades higher.
Any activity above the $4,015.75 HVNode puts into play the $4,041.25 HVNode. Initiative trade beyond the $4,041.25 HVNode could reach as high as the $4,071.50 BAL and $4,095.00 VPOC, or higher.
In the worst case, the S&P 500 trades lower.
Any activity below the $4,015.75 HVNode puts into play the $3,971.00 VPOC. Initiative trade beyond the VPOC could reach as low as the $3,943.25 HVNode and $3,921.00 VPOC, or lower.
Click here to load today’s key levels into the web-based TradingView charting platform. Note that all levels are derived using the 65-minute timeframe. New links are produced, daily.

Definitions
Volume Areas: A structurally sound market will build on areas of high volume (HVNodes). Should the market trend for long periods of time, it will lack sound structure, identified as low volume areas (LVNodes). LVNodes denote directional conviction and ought to offer support on any test.
If participants were to auction and find acceptance into areas of prior low volume (LVNodes), then future discovery ought to be volatile and quick as participants look to HVNodes for favorable entry or exit.
POCs: POCs are valuable as they denote areas where two-sided trade was most prevalent in a prior day session. Participants will respond to future tests of value as they offer favorable entry and exit.
MCPOCs: POCs are valuable as they denote areas where two-sided trade was most prevalent over numerous day sessions. Participants will respond to future tests of value as they offer favorable entry and exit.
Volume-Weighted Average Prices (VWAPs): A metric highly regarded by chief investment officers, among other participants, for quality of trade. Additionally, liquidity algorithms are benchmarked and programmed to buy and sell around VWAPs.
About
After years of self-education, strategy development, mentorship, and trial-and-error, Renato Leonard Capelj began trading full-time and founded Physik Invest to detail his methods, research, and performance in the markets.
Capelj also develops insights around impactful options market dynamics at SpotGamma and is a Benzinga reporter.
Some of his works include conversations with ARK Invest’s Catherine Wood, investors Kevin O’Leary and John Chambers, FTX’s Sam Bankman-Fried, ex-Bridgewater Associate Andy Constan, Kai Volatility’s Cem Karsan, The Ambrus Group’s Kris Sidial, among many others.
Disclaimer
In no way should the materials herein be construed as advice. Derivatives carry a substantial risk of loss. All content is for informational purposes only.


