Good Morning! I hope you had a great weekend and enjoy today’s letter. I would be so honored if you could comment and/or share this post. Cheers!
Nvidia Corporation (NASDAQ: NVDA) beat on earnings last week, lifting the entire stock market.
The chipmaker confirms it can meet lofty expectations fueled by the artificial intelligence boom, with demand for Nvidia’s newest products likely to outpace supply throughout the year. Despite mounting competition and regulatory challenges in markets like China, Nvidia pursues strategic partnerships to expand its distribution channels.

Before the earnings announcement, heightened implied volatility derived from options prices on the chipmaker’s stock indicated anticipation of significant fluctuations. The at-the-money straddles, composed of call and put options, suggested movement expectations of as much as +/-10% after earnings.
Various methods exist to estimate the expected move. One approach involves taking the value of the at-the-money straddle for the front month and multiplying it by 85%. Another entails using a narrow range of options.
The volatility skew, which will be defined later, implied that the perceived risk of movement was tilted toward the upside. In any case, staying within the anticipated movement would not favor options buyers, as we show later.

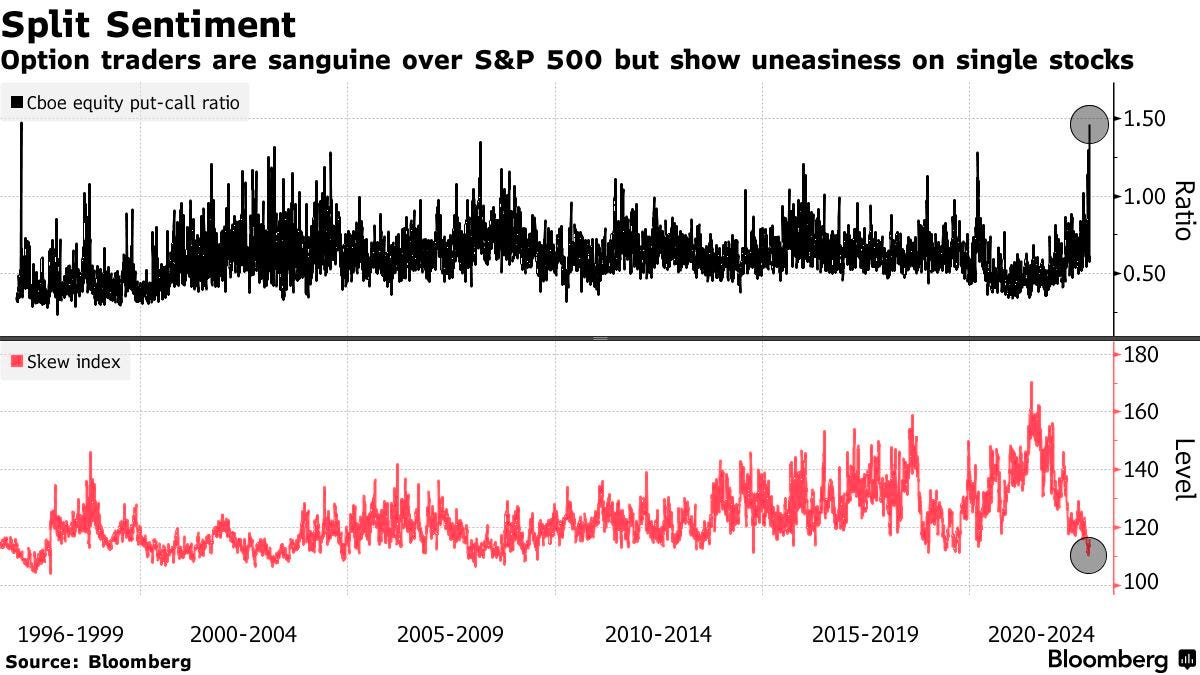
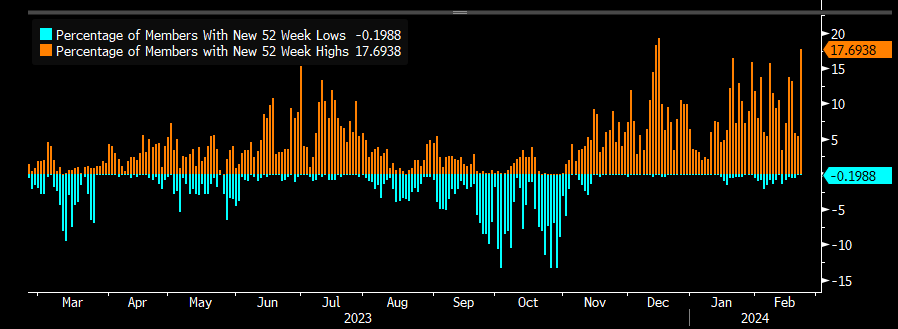
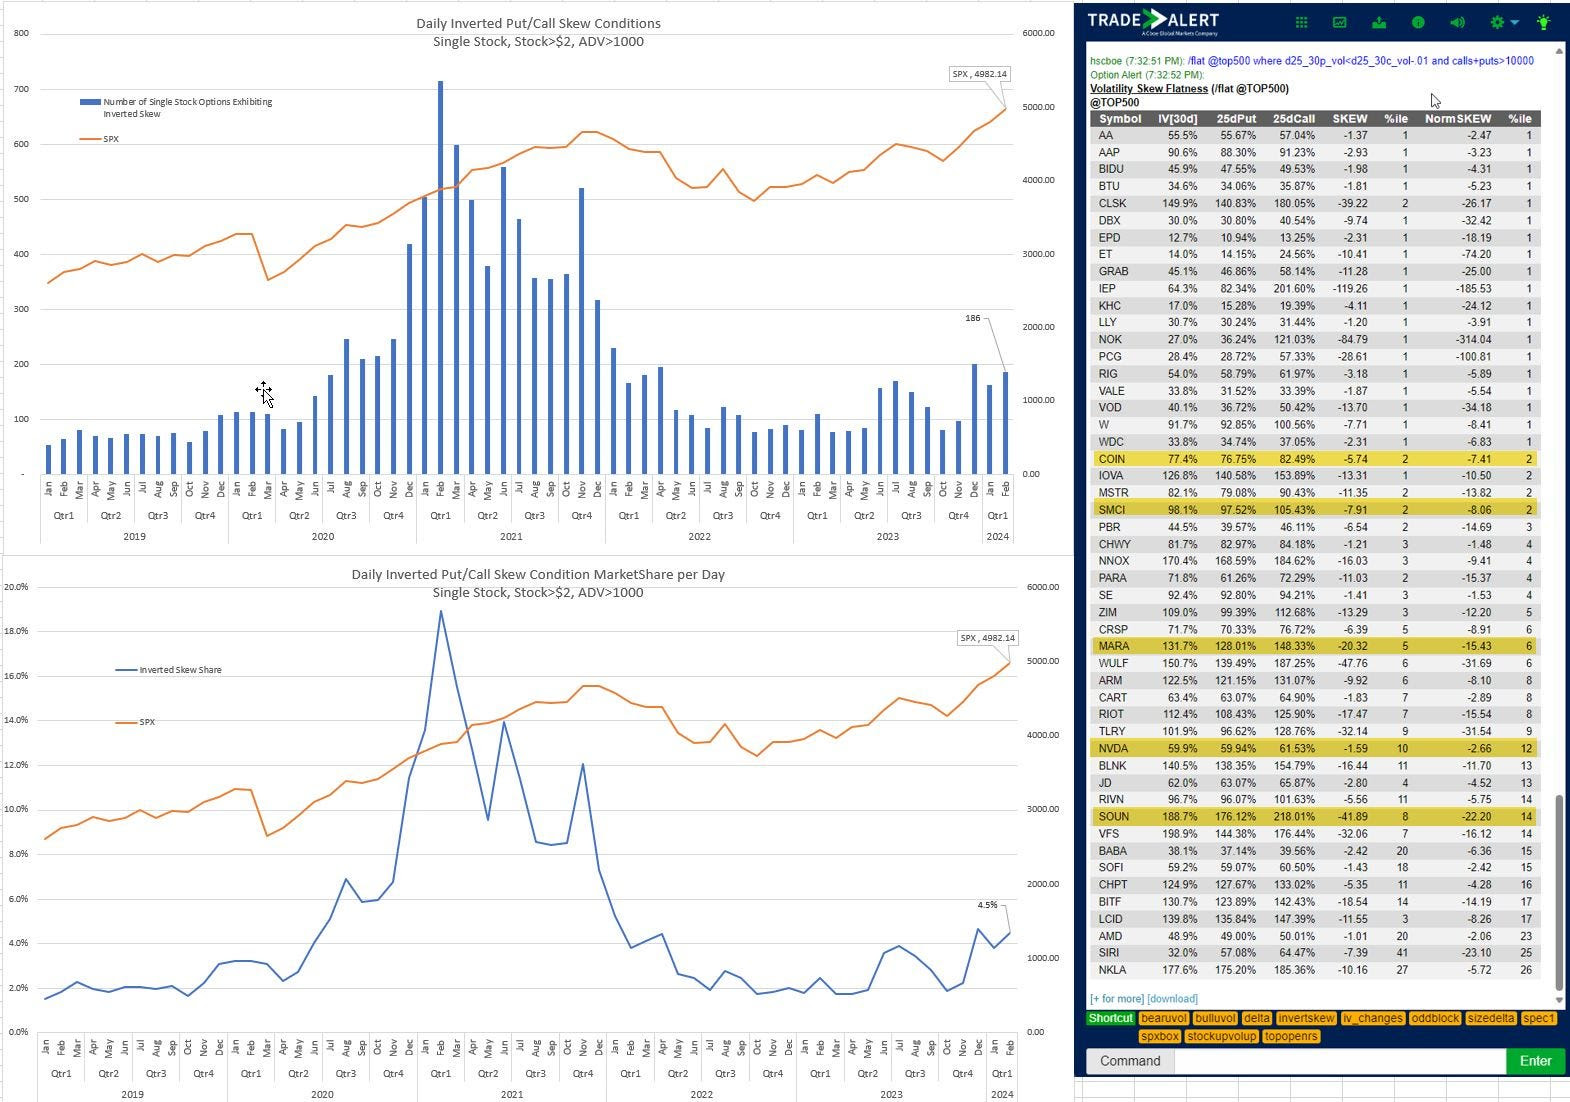
Since late 2023, traders have increasingly been hedging against or speculating on market upswings. This is evident in the higher call option implied volatility. Expectations for significant upward movement are particularly notable in the growing number of stocks where the 25 delta call implied volatility exceeds the 25 delta put implied volatility, shares Henry Schwartz of Cboe Global Markets.
To elaborate, options delta (∆) measures the change in an option’s price relative to changes in the underlying asset’s price. It indicates the option’s sensitivity to the underlying asset’s price movements. A delta of 0.50 means that for every $1 change in the underlying asset’s price, the option’s price would change by $0.50 in the same direction. The skew reflects the difference in implied volatility between out-of-the-money call and put options with the same delta.
When the 25 delta call implied volatility surpasses that of the 25 delta put implied volatility, a more pronounced positive skew suggests traders are willing to pay a premium for calls. Conversely, if the 25 delta put implied volatility exceeds that of the 25 delta call implied volatility, often observed in products like the S&P 500 (due to concerns about protecting equity downside), there is a negative skew or stronger inclination to pay a higher price for put options.
This persistent fear of missing out on sudden upward movements manifests a cascading effect when markets move higher, says Nomura Americas Cross-Asset Macro Strategist Charlie McElligott.
“The key to equities seemingly being able to keep shaking off nascent pullbacks? Well outside of the ongoing ‘AI euphoria’ theme and de-grossing of shorts, … it’s been all about the Pavlovian ‘options selling’ flows, which continue to suppress [implied volatility].”

As explained by McElligott, these “options selling flows” have the potential to amplify momentum. For instance, when traders or customers purchase call spreads, as they are large, the counterparties or dealers are left with a short skew, negative delta position that loses money if implied volatility rises or markets rise. In response to a rising market, dealers may manage their delta by selling put options or buying call options, stocks, or futures. Adding these positive delta hedges helps propel the market into uncharted territory during swift movements.

As validation, after Nvidia Corporation’s stock surged about 10% post-earnings, Bloomberg reported that “to fully re-hedge all open option positions coming into the day, 51 million shares, or 91% of the daily average,” would need to be traded. Bloomberg added that the March 15 $680 call, February 23 $700, and $750 calls experienced the most significant changes in the delta before the market opening.

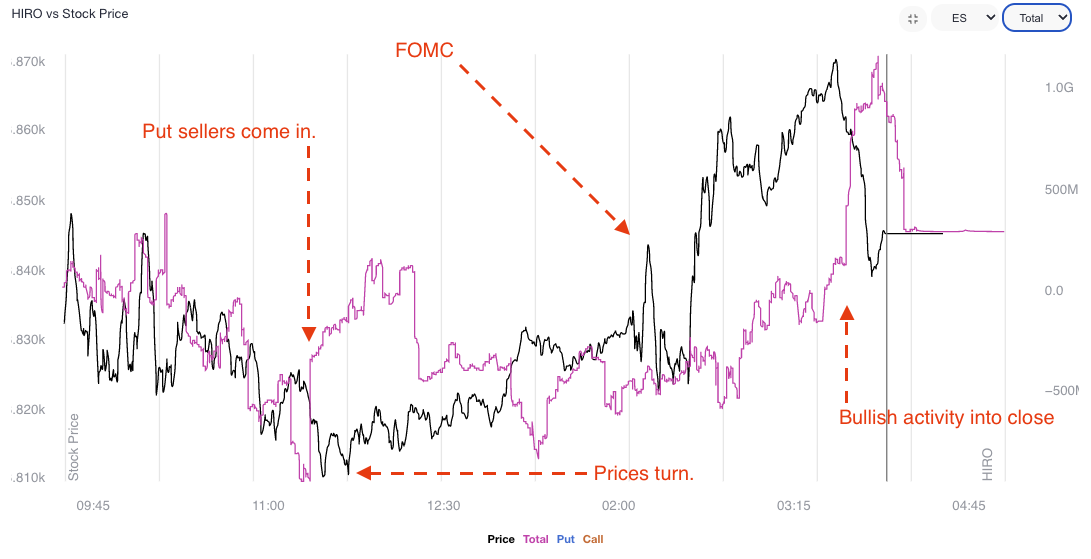
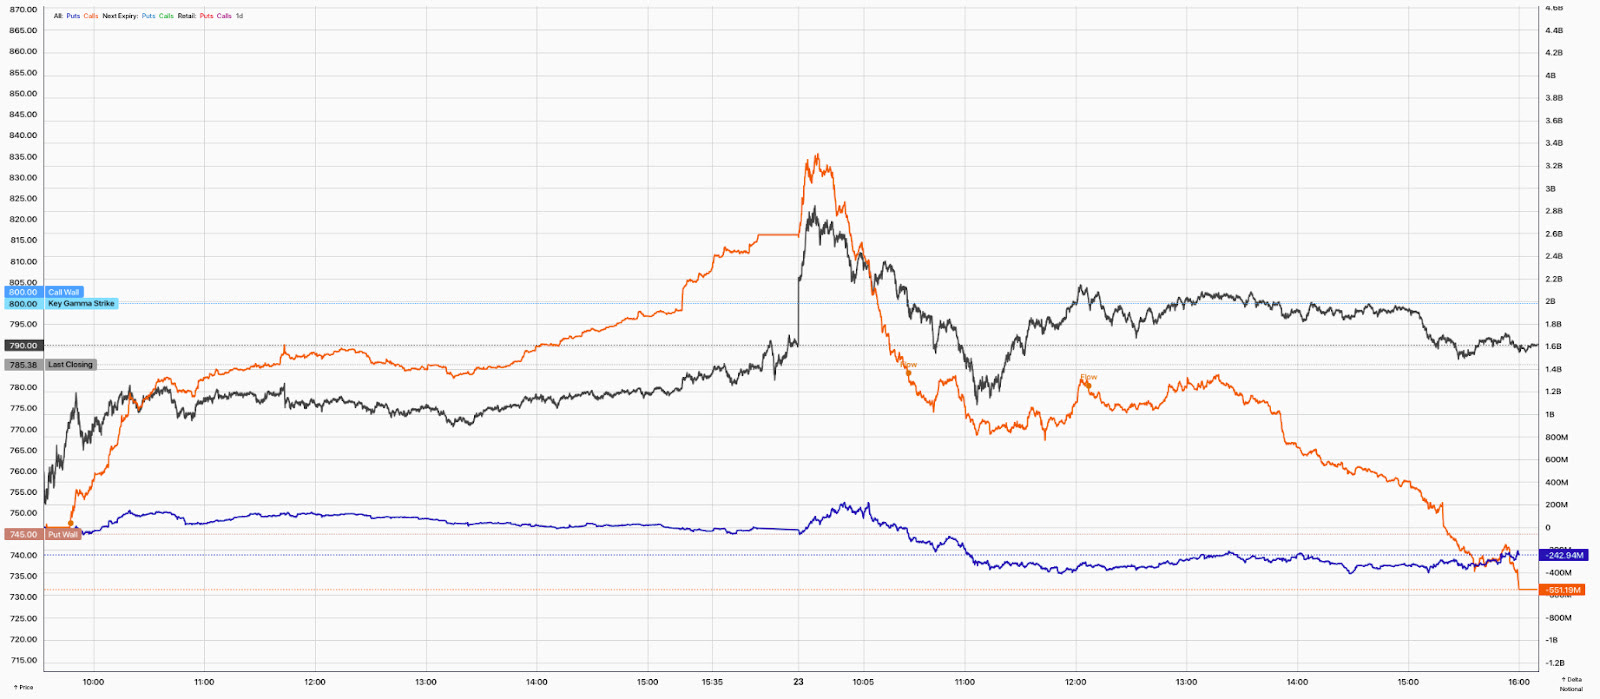
Observing SpotGamma’s real-time options hedging impact measure HIRO, the chipmaker was boosted partly on positive flows from the hedging of call options, as shown by the orange line below, while put options trading had a limited effect, as indicated by the blue line. The re-hedging activity positively affected the stock on Thursday post-earnings and had a pressuring effect on Friday, owing to the short-datedness of some of the options exposure traders initiated.
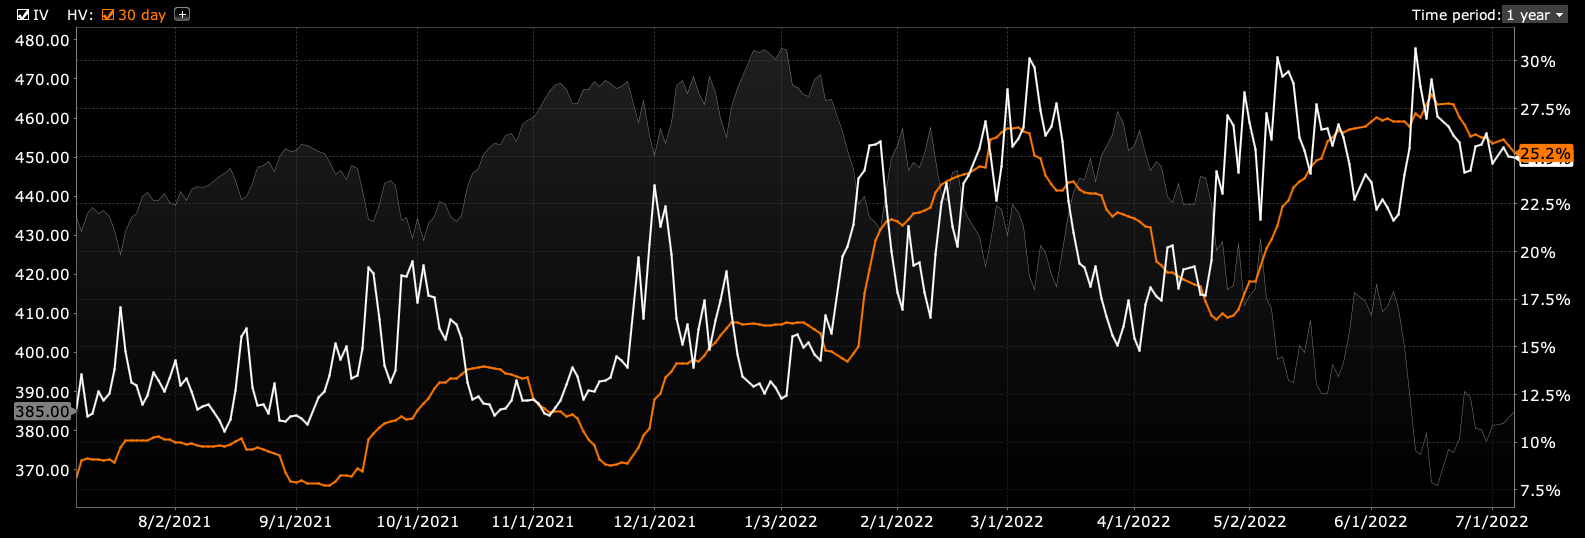
While mentioning pressures, see below the volatility skew before (green) and after (grey) earnings.

Short-dated options with very high strikes (e.g., 900+) and close expiration dates (e.g., ten days) struggled to hold their value. SpotGamma shared that the pricing of near-the-money $785 calls expiring on March 15 returned to their previous levels just a week before earnings. Since the actual movement closely matched the expected movement, there was little justification for options well above the market (i.e., +30%) to retain their value.

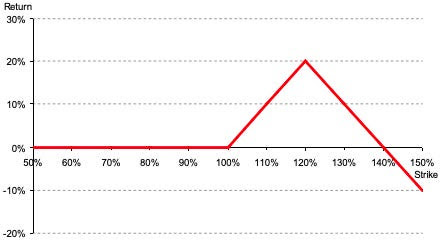
At Physik Invest, we foresaw such a situation and executed 100-point wide 1×2 call ratio spreads between the 900s and 1000s for a credit of approximately 0.90. We closed these positions the next day for an additional credit of 0.50 when the 1000 strike options failed to keep their value as good as the closer 900 strike options. The resulting profit was a 1.40 credit per spread.
Please be aware that similar trades are present in other high-flying products, albeit less widespread than in 2021 during the meme-stock trend. A simple way to determine whether such trades are safe is to check the pricing of fully in-the-money spreads. If the spreads trade at substantial credits to close, they are worth considering. However, if the spreads require a debit to close, it’s best to avoid them. In the case of Nvidia, the 100-point spread was priced at 25.00 in credit to close the day of earnings.

Generally speaking, this trend in implied volatility is something that may continue. Kris Sidial from The Ambrus Group says the trend, which masks the risks of short volatility under the hood, such as those tied to risk-management practices, is driven by several factors not limited to the following:
(1) Increased demand for call options.
(2) Larger institutions seeking volatility as a hedge against rising risk exposure as the S&P 500 climbs.
(3) Significant market movements make it difficult for implied volatility to decrease significantly.
Must Read: Two Major Risks Investors Should Watch Out For

As such, Sidial suggests that “there is significant value in embracing volatility in both directions,” hedging against geopolitical and economic uncertainties while also capitalizing on the market upside. As discussed last week, we focus on leveraging elevated skew to reduce the cost of bullish trades (e.g., metals). Additionally, we plan to replenish our long put skew by acquiring put spreads in equities as a precaution against potential risks ahead, mainly local market peaks this time of year.

With recent data dissuading anticipated cuts, there’s room to safeguard cash at higher rates for longer.
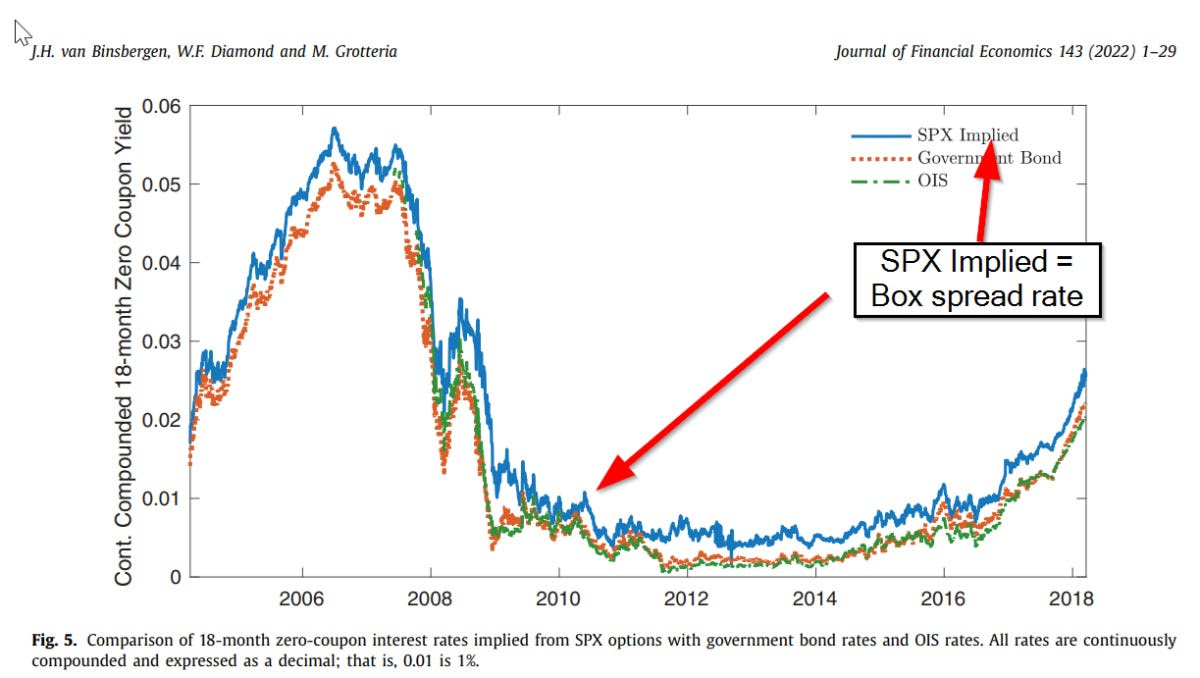
One trade structure to help us do so is the box spread, which includes benefits such as a convenience yield, capital efficiencies achieved through portfolio margining, easy entry/exit on an exchange through most retail brokers, and potential 60% long-term and 40% short-term tax treatment.
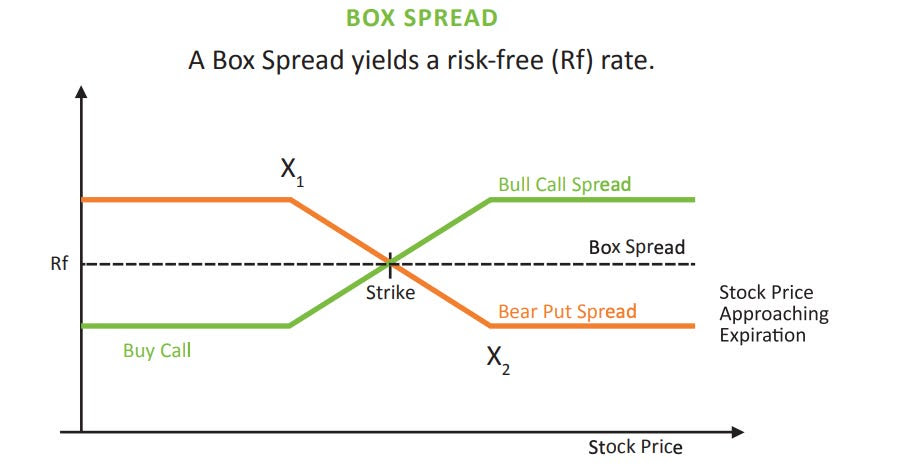
Like a Treasury bill, the loan structure combines a bull call spread and a bear put spread. In a bull call spread, an investor purchases a call option and sells another at a higher strike price. A bear put spread involves buying a put option and selling another at a lower strike price. The lower (X1) and higher strikes (X2) match for a box spread, with all legs sharing the same expiration date.
In calculating the loan rate, we take, for example, a recent box spread trade of Physik Invest’s: BOT +1 IRON CONDOR SPX 100 (Quarterlys) 31 DEC 24 3000/6000/6000/3000 CALL/PUT @2867.90 CBOE.
[(WIDTH−PRICE)/Price](365/DTE) = Implied Interest Rate
Where:
WIDTH: Distance between higher and lower strikes
PRICE: The price of the box spread
DTE: Days until the trade matures
[(3000-2867.90)/2867.90](365/319) = 0.0527036866 = 5.27%
We lend $286,790.00, at a risk-free rate of 5.27%, in exchange for $13,210.00 of interest at maturity. You can track box spread yields more quickly using tools like boxtrades.com. Such insights open up several strategic avenues for traders.
One approach is investing about 95% of your cash into box spreads to return the principal at maturity, risking the 5% interest you make on trades with a limited downside (e.g., SPX bull call spread).
A more preferable option exists for portfolio margin traders. Portfolio margining is a risk-based approach to determining margin requirements in a customer’s account, aligning collateral with the overall portfolio risk. Portfolio margining considers offsets between correlated products, calculating margin requirements based on projected losses. This approach may lower margin requirements, allowing for more efficient capital utilization.
As portfolio margin traders, we retain our buying power due to the minimal directional risk associated with box spreads, allocating it to other margin-intensive trades. To illustrate, if such a trader initially invests $100,000 in box spreads, they are left with $0 in cash and $100,000 in buying power available for margin-intensive trades (e.g., synthetic long stock or the purchase of an at-the-money call and simultaneous sale of an at-the-money put). You get your inflation protection while participating 100% in up-and-down market movements. Why not, right?
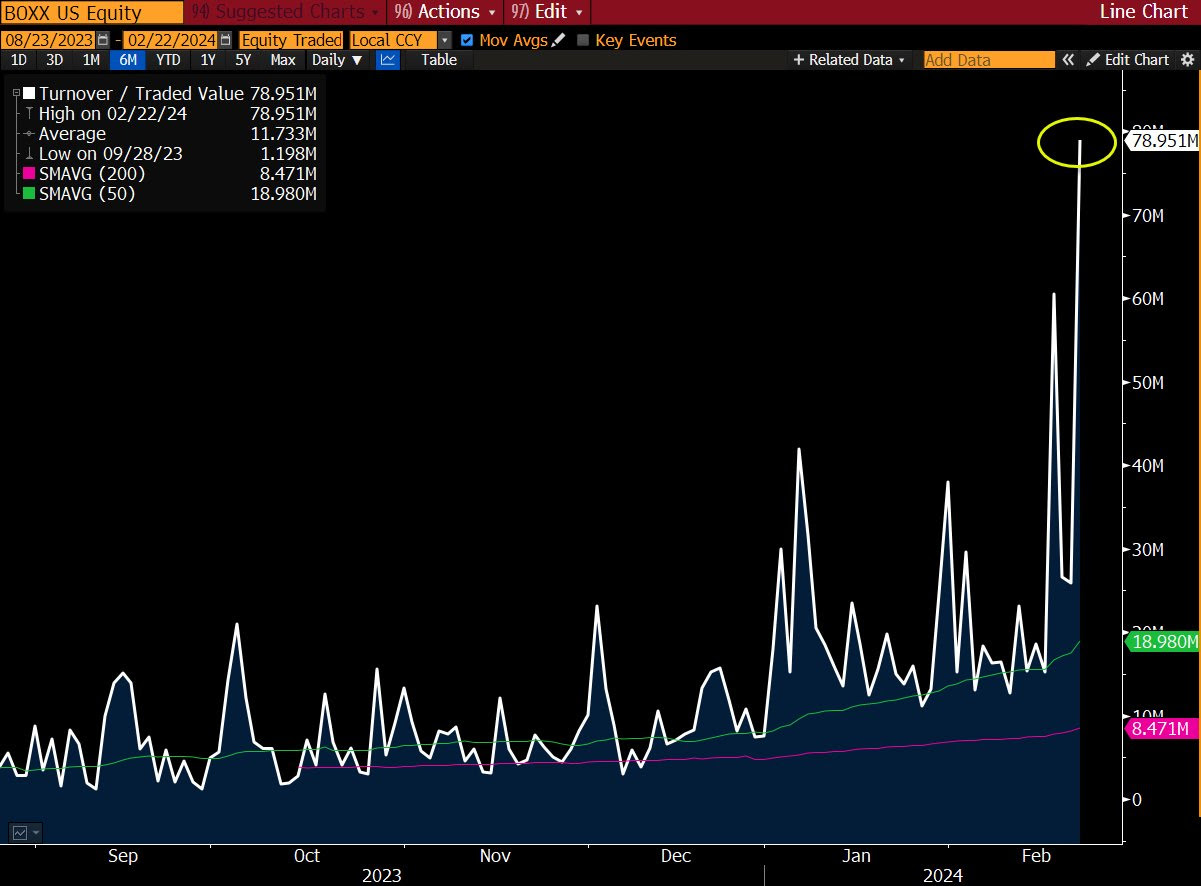
The point of the above passage is that much of what you see online can be done yourself in a tax, margin, and cost-efficient way. Alternatively, you can be hands-off, investing in money markets and CDs or complicated yet cool products like the popularized Alpha Architect 1-3 Month Box ETF (BATS: BOXX), which has grabbed attention for its tax arbitrage through complex strategies and loopholes.
With BOXX, you’re investing in something as safe as short-term Treasury bills, but you can get your money back anytime and enjoy better tax treatment than Treasury bills. Bloomberg’s Matt Levine has an excellent write-up on the mechanics of BOXX, which you can read here.
We digress. You can do more with your unused cash and buying power when following the methods outlined earlier and as we put well in our “Investing In A High Rate World” report published in April 2023. There, we discussed return stacking utilizing Nasdaq call ratio spreads and S&P 500 box spreads, two trades that continue to kill it this year.

We choose these structures, which have limited losses in case of market downside, for the following reasons: There is considerable support for the market, but this support appears fragile. For one, we refer to record-level dispersion trading, which involves the sale of index options and buying options in individual stocks.
It’s the same short volatility exposure Sidial has warned us about. With some stocks realizing substantial differences in movement from the index, this booming trade may have gone too far, setting the stage for a potential market reversal.
The situation resembles the period leading up to Volmageddon when short-volatility strategies backfired. Implied correlations are low, and if a market shock occurs, investors may be forced to close out their trades, which could feed volatility. As was in the case leading up to Volmageddon, however, volatility can cluster and mean-revert for longer.

.