Categories
Commentary

Daily Brief For May 25, 2022

The daily brief is a free glimpse into the prevailing fundamental and technical drivers of U.S. equity market products. Join the 300+ that read this report daily, below!

What Happened

Overnight, equity index futures were steady alongside commodities and bonds. This is ahead of the release of minutes from a Federal Reserve (Fed) policy meeting. 

In the news were advertising and social media firms. Snap Inc (NYSE: SNAP) warned of slower growth and deterioration in the macro-environment. Its peers Meta Platforms Inc (NASDAQ: FB), Alphabet Inc (NASDAQ: GOOGL), and Twitter Inc (NYSE: TWTR) also saw weakness.

China’s COVID Zero commitment likely nudges it off a path to achieve economic targets “by a large margin for the first time ever,” as Bloomberg explains

This is as China and Russia have conducted one of their largest joint air drills “to send their own political, economic and military message to the international community,” much of which is at Davos, Switzerland doing thought exercises.

In a recent podcast, Pippa Malmgren, who is a former White House adviser and economist, well said, particularly in reference to some of the tension abroad, that “autocracy is not working well,” and “[y]ou go to war because … you have a domestic objective.”

Thought it was interesting. Give it a listen, here.

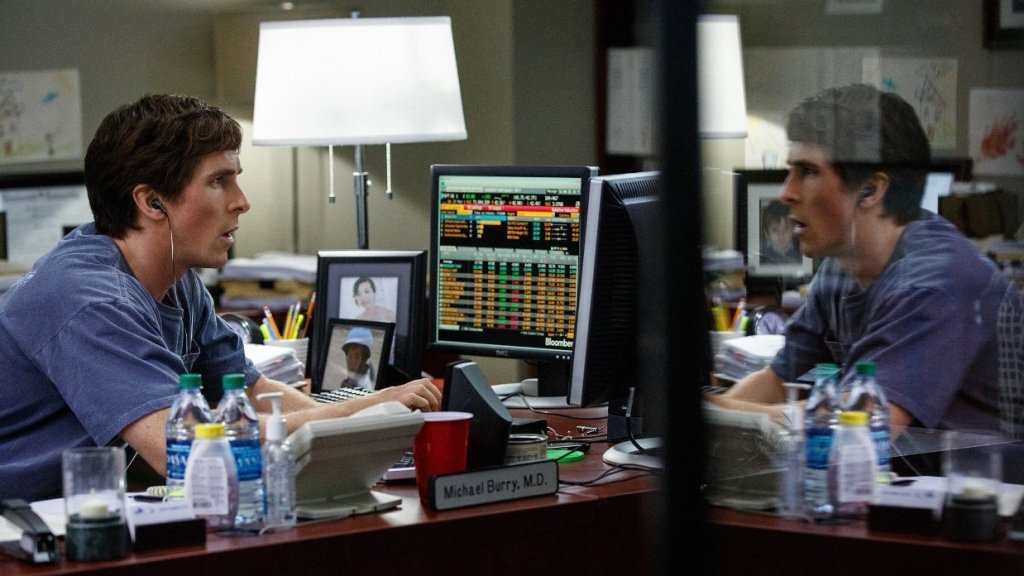
And, finally, Michael Burry of the “Big Short” sent a cryptic tweet alluding to what is likely the risk of another financial collapse. 

Moreover, ahead is data on durable goods and core capital equipment orders (8:30 AM ET). Later, the Fed publishes the minutes of its last policy meeting (2:00 PM ET).
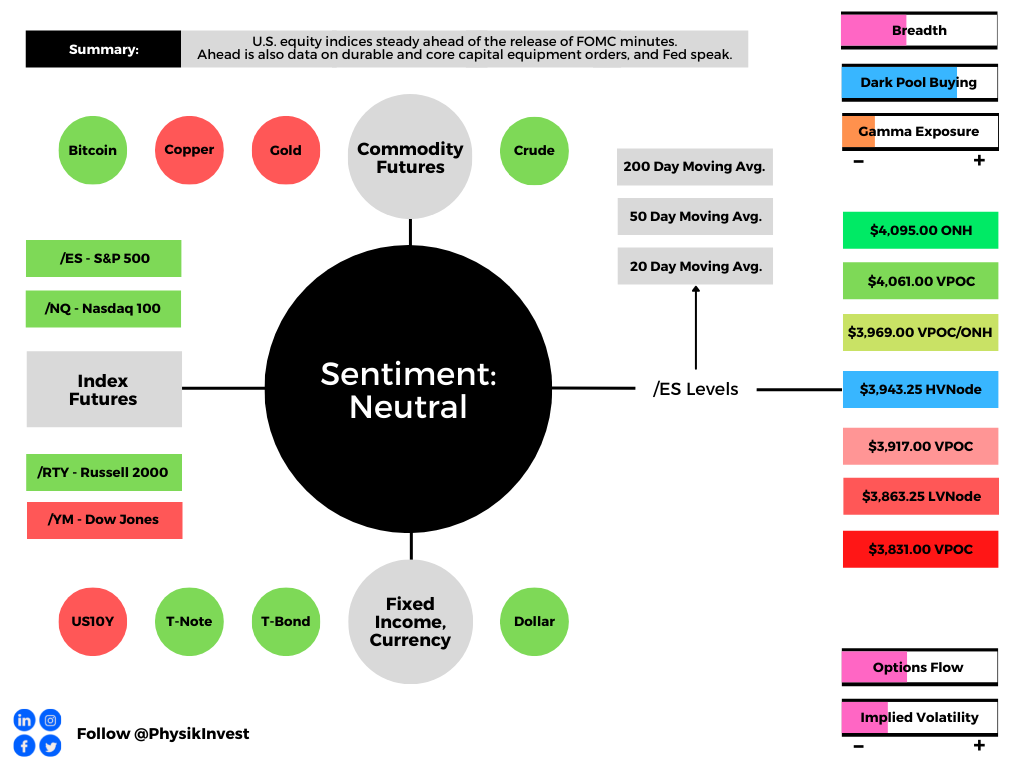
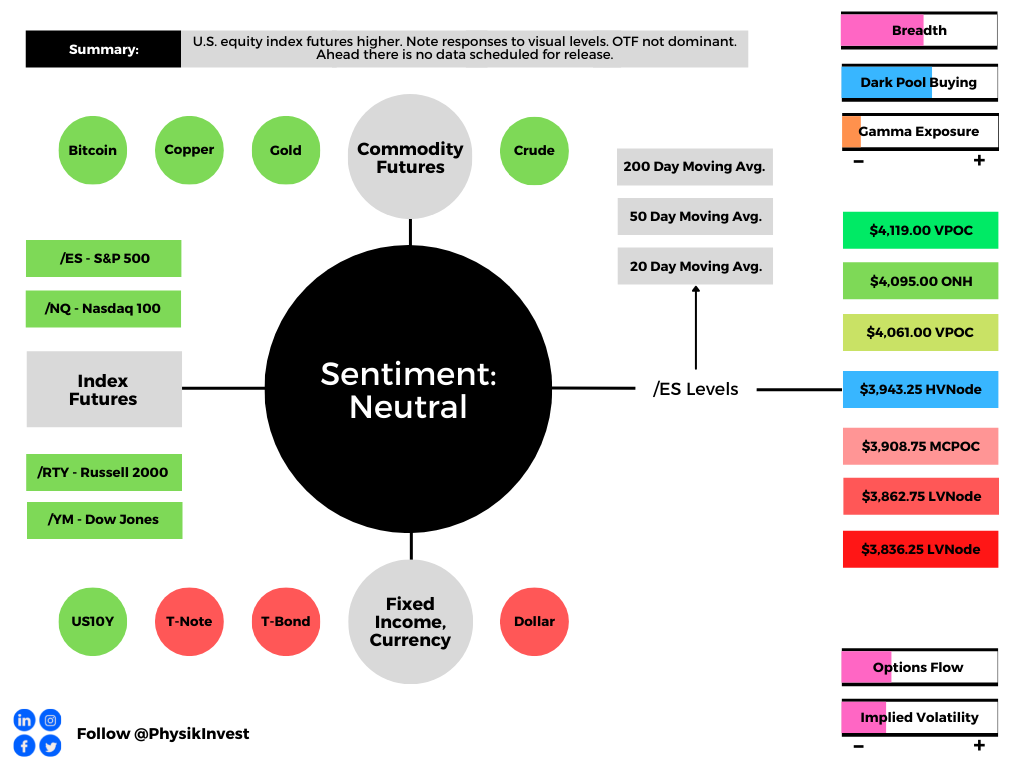
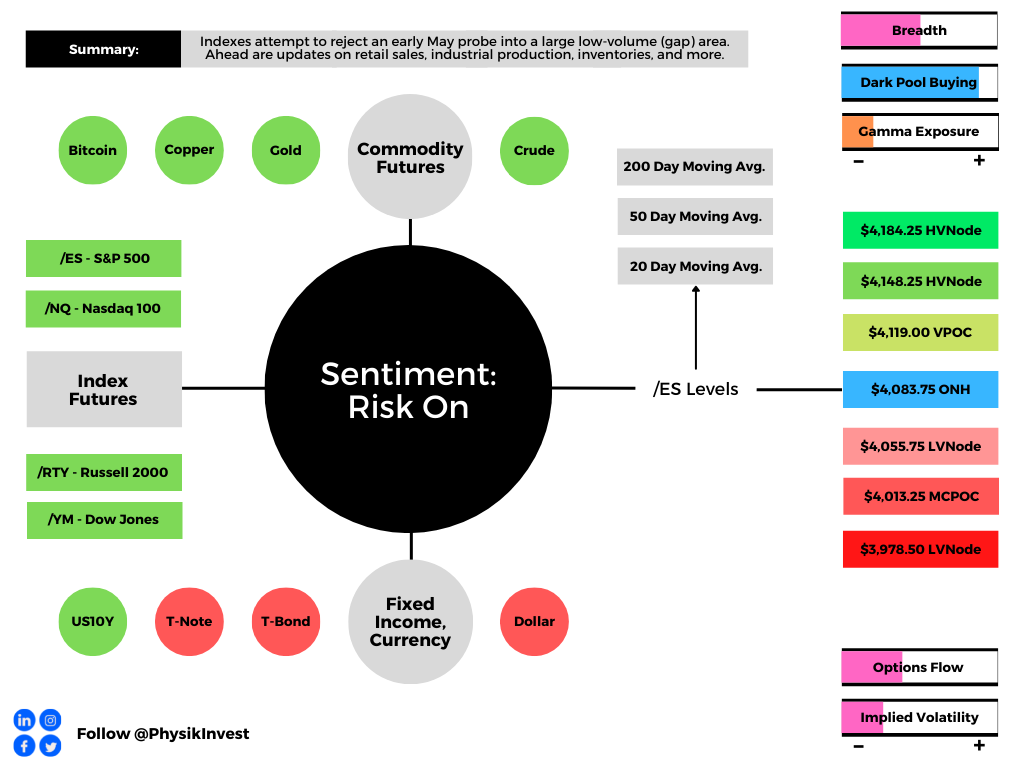
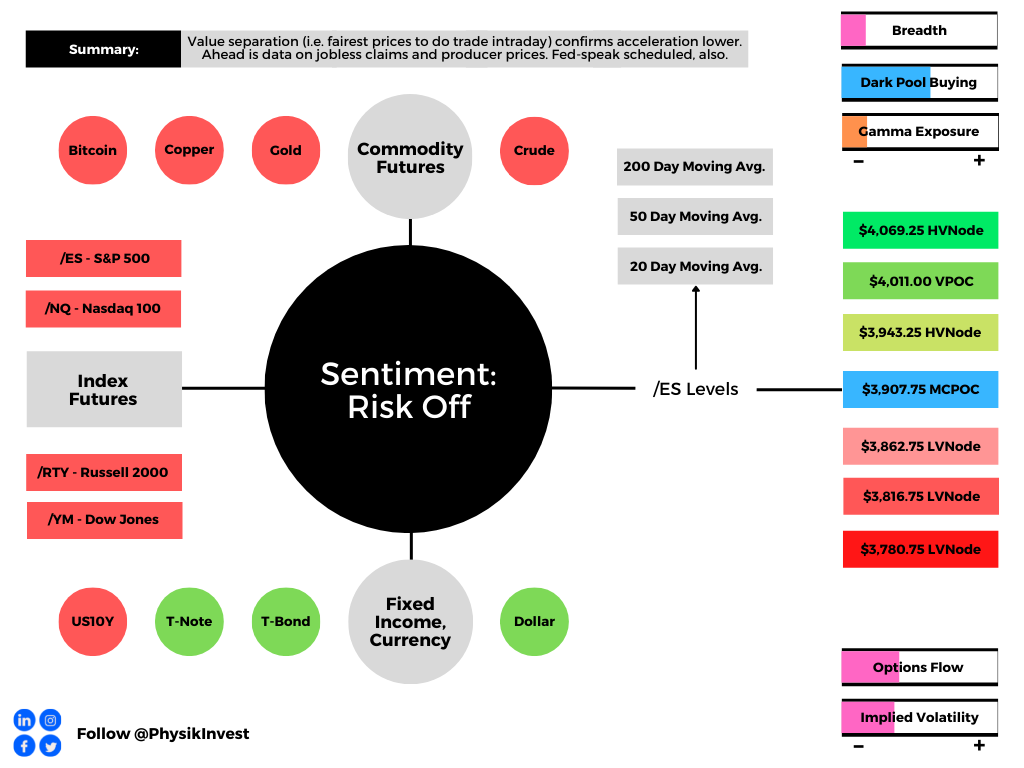
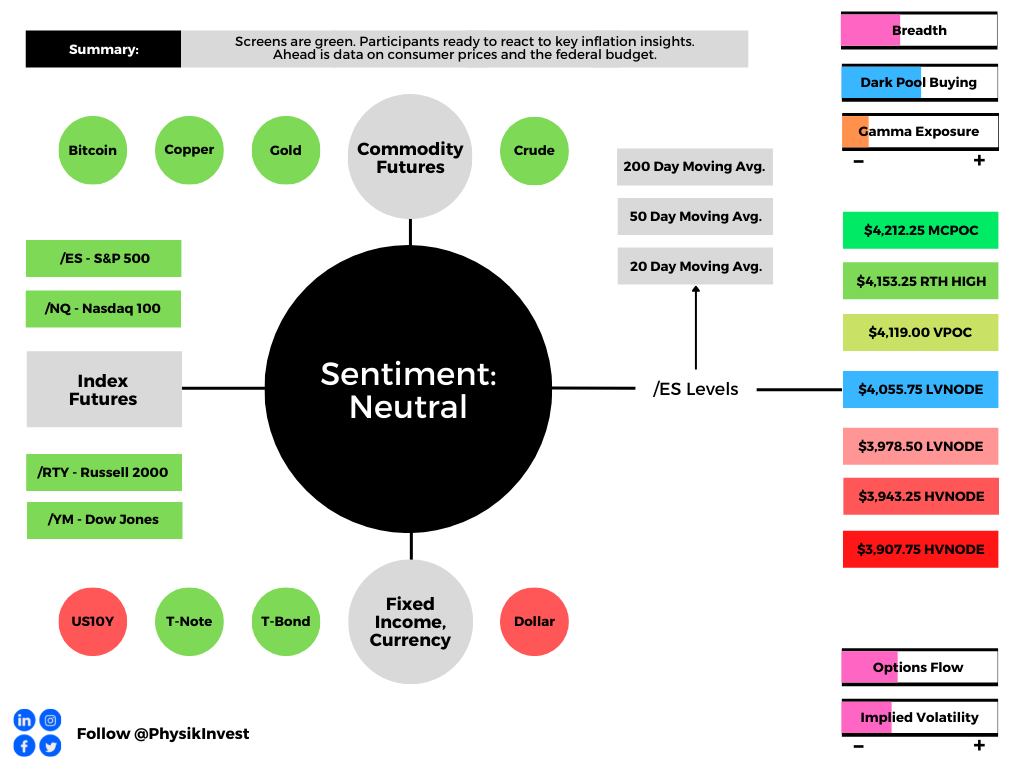
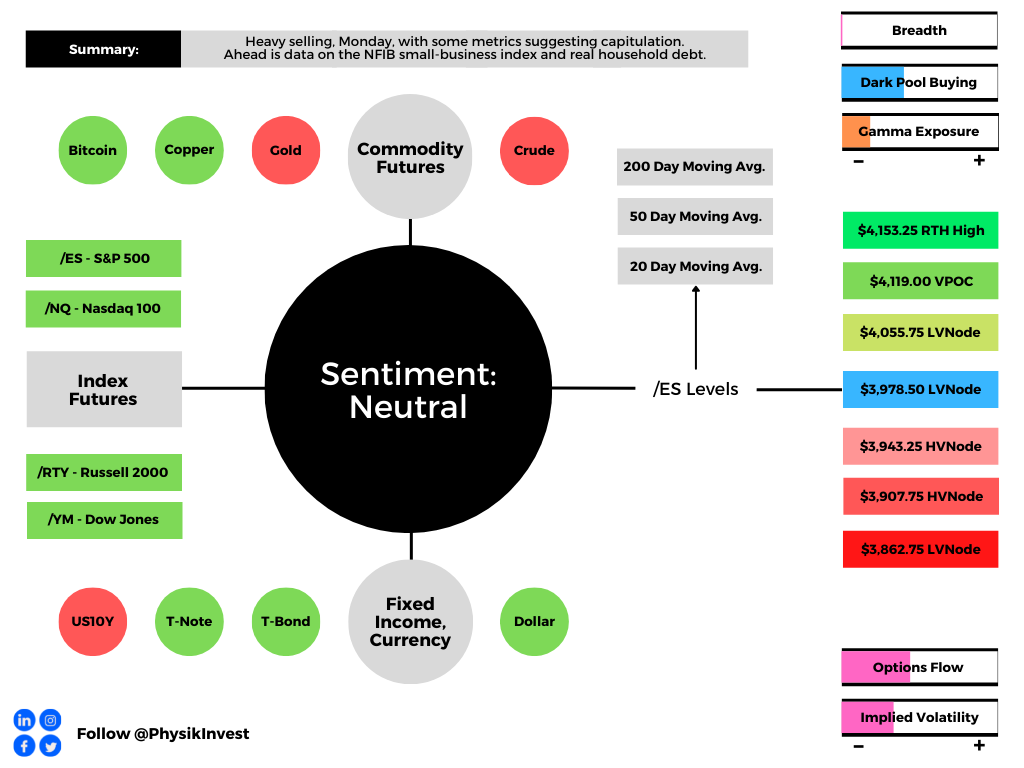
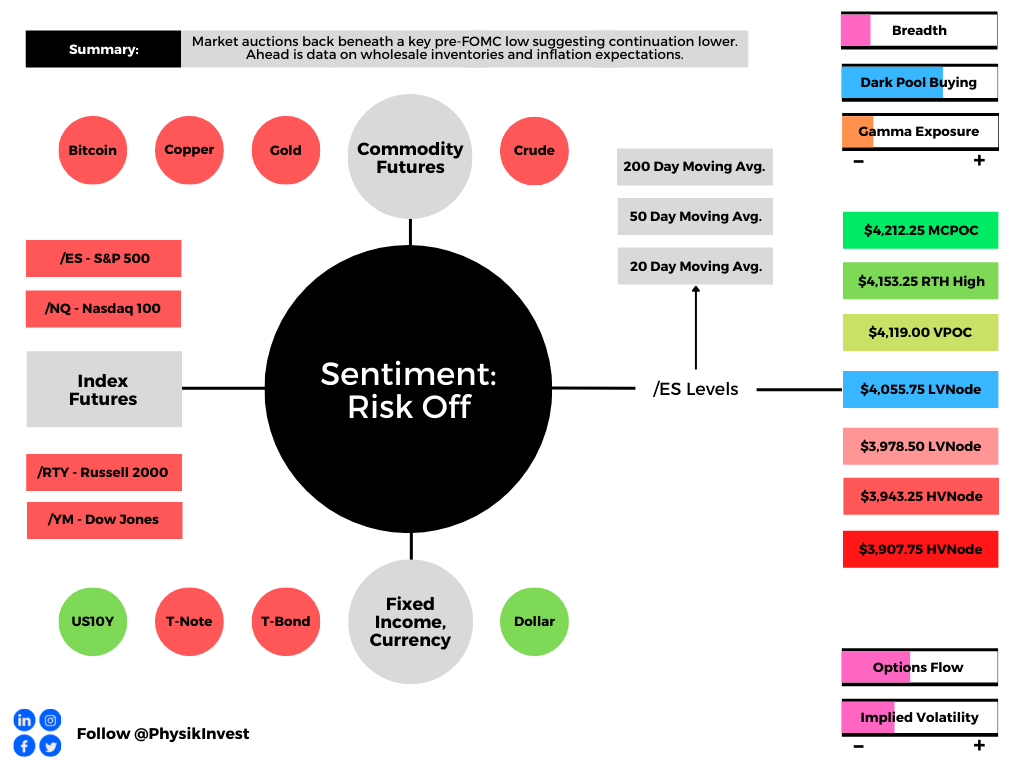
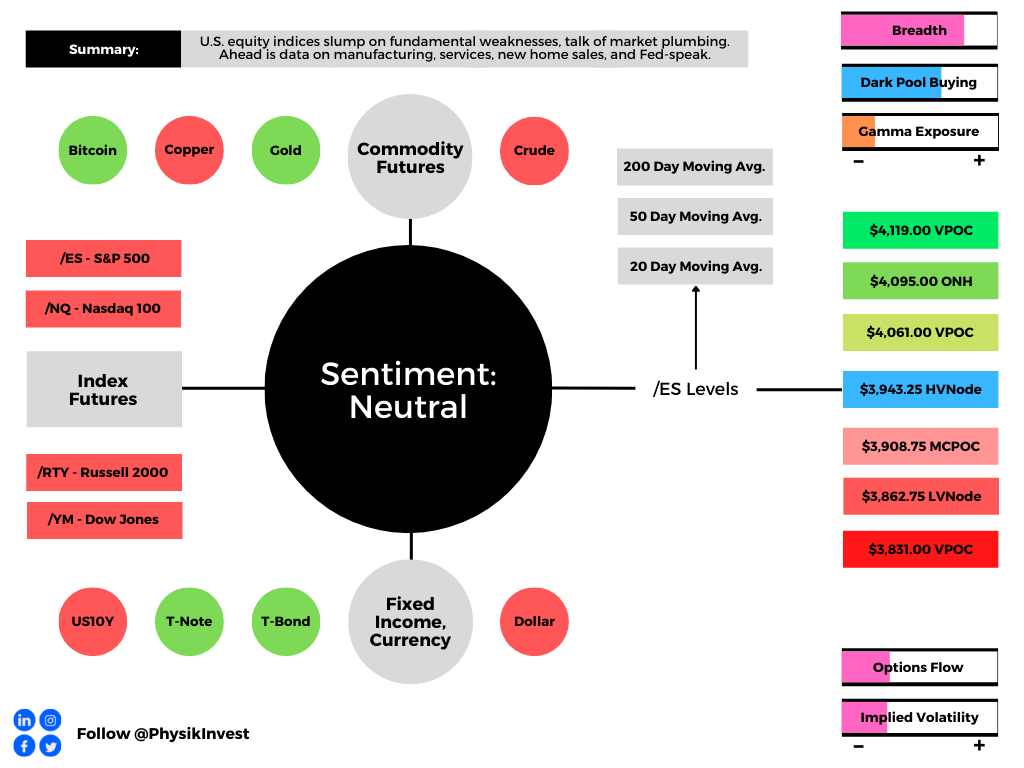
Graphic updated 6:10 AM ET. Sentiment Neutral if expected /ES open is inside of the prior day’s range. /ES levels are derived from the profile graphic at the bottom of the following section. Levels may have changed since initially quoted; click here for the latest levels. SqueezeMetrics Dark Pool Index (DIX) and Gamma (GEX) calculations are based on where the prior day’s reading falls with respect to the MAX and MIN of all occurrences available. A higher DIX is bullish. At the same time, the lower the GEX, the more (expected) volatility. Learn the implications of volatility, direction, and moneyness. SHIFT data used for S&P 500 (INDEX: SPX) options activity. Note that options flow is sorted by the call premium spent; if more positive, then more was spent on call options. Breadth reflects a reading of the prior day’s NYSE Advance/Decline indicator. VIX reflects a current reading of the CBOE Volatility Index (INDEX: VIX) from 0-100.

What To Expect

Fundamental: The Fed will issue policy meeting minutes that may provide clarity with respect to its intent to hike and reduce the size of its balance sheet.

In focus, per ex-Fed insider Ellen Meade, is “the rate path, the expected economic conditions, and what policymakers want to see from the data before they slow the pace of tightening.”

“The minutes may tell us they see the tightening in conditions this time around as greater than in earlier cycles. If that’s the case, then they may judge that they don’t need to raise the funds rate by as much this time around.”
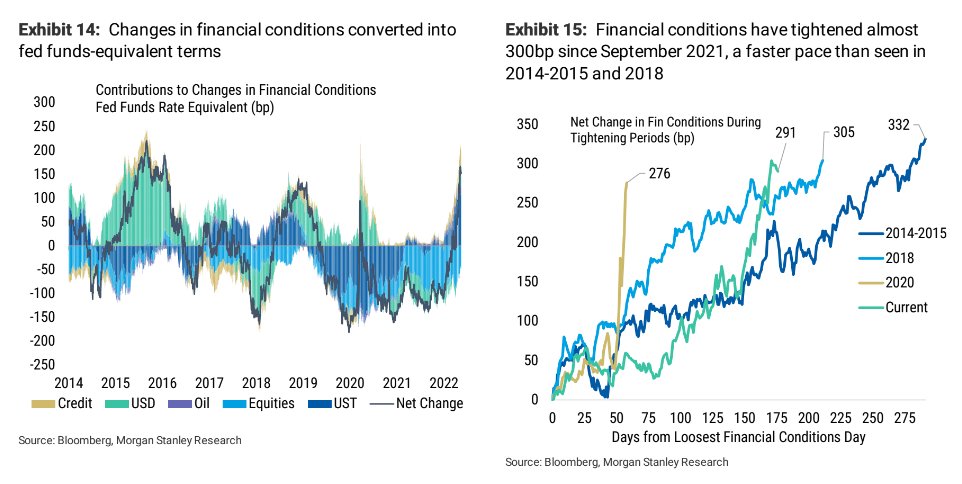
Graphic: Via Morgan Stanley (NYSE: MS) research.

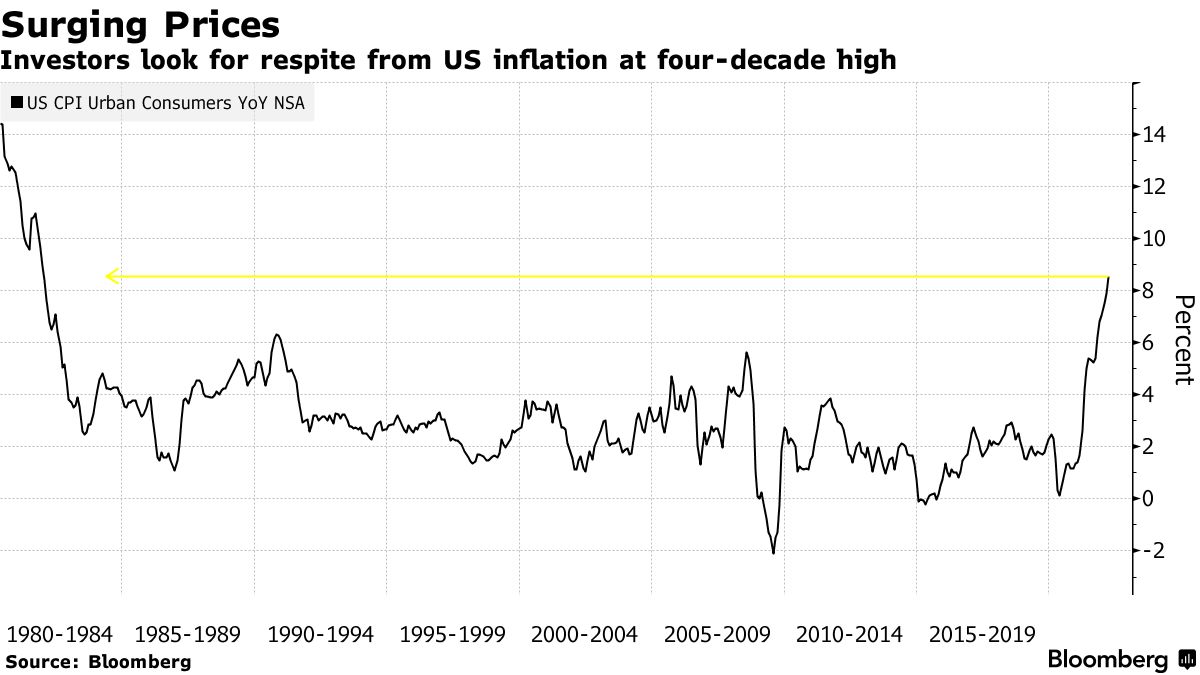
John Authers notes, however, that “inflation tends to move in waves” and it doesn’t, usually, “plateau and stay there.”
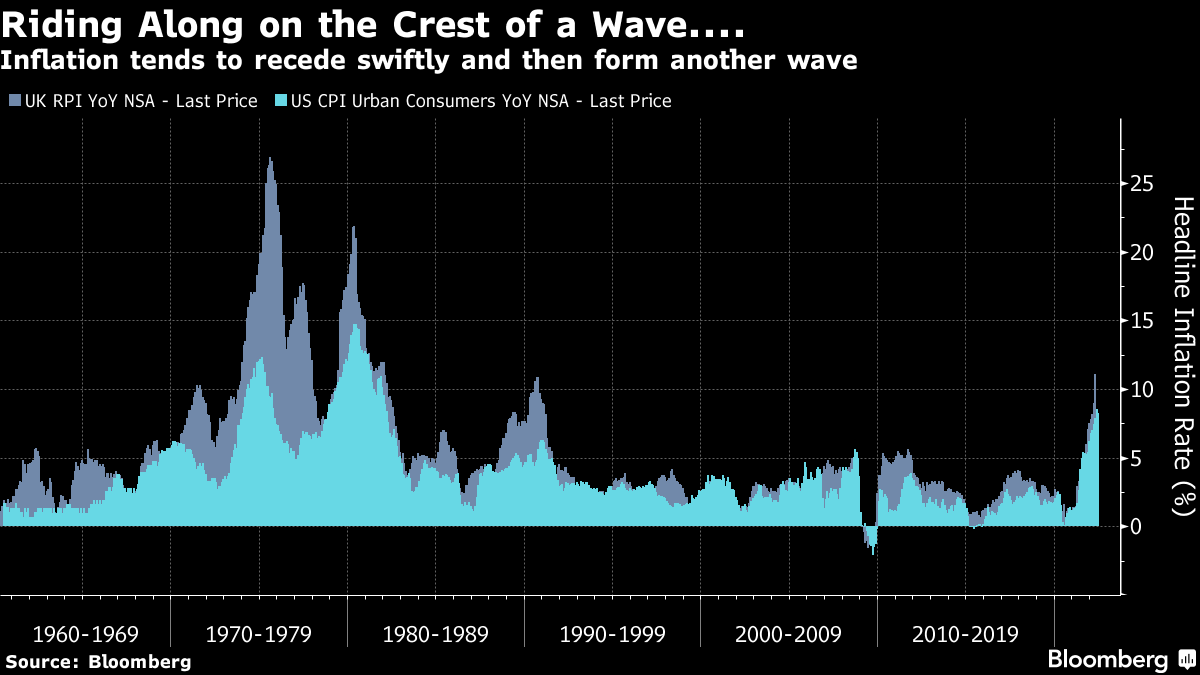
Graphic: Via Bloomberg.

“That suggests that even though the focus is already shifting to whether there is evidence of a growth slowdown,” he added, in a statement echoed by Meade who is betting on slower “GDP growth, below its longer-run rate, and a rise in the unemployment rate, perhaps to its longer-run median rate or slightly above.”
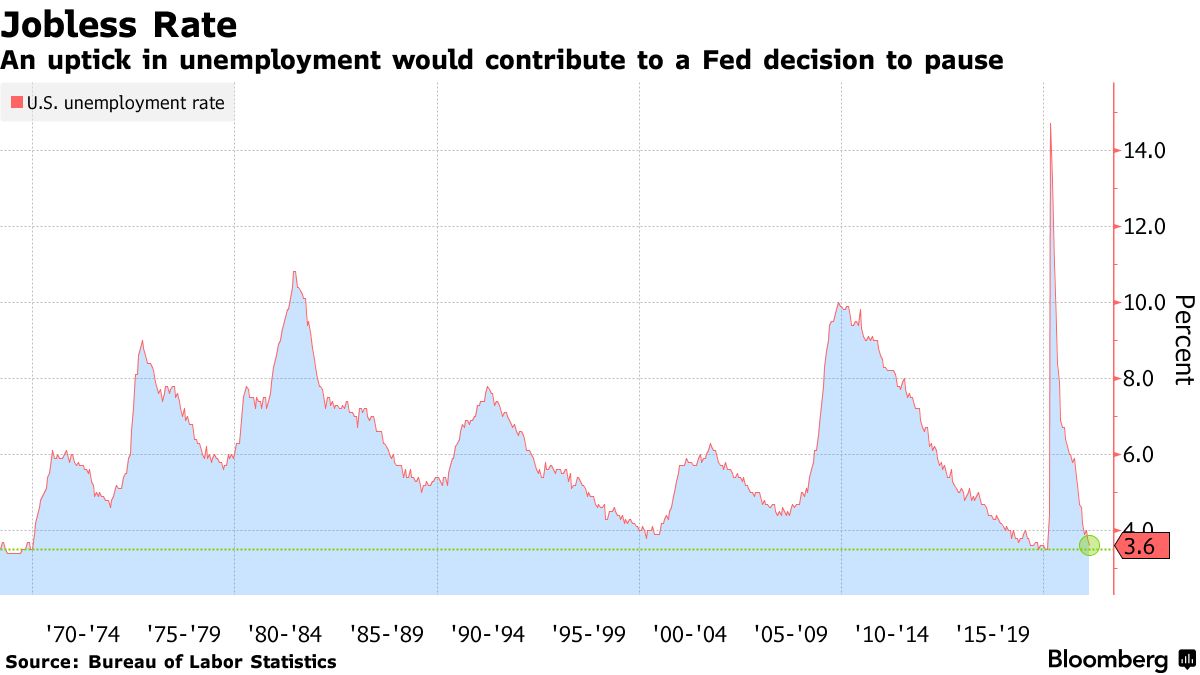
Graphic: Via Bloomberg.

Pursuant to those last remarks, the Fed’s Raphael Bostic is already floating a pause to rate hikes near September if inflation falls more than expected over the summer.

As Diane Swonk of Grant Thorton explains, “Policy works with a lag. The Fed wants to catch up but not outrun the market in its effort to tighten credit market conditions.”
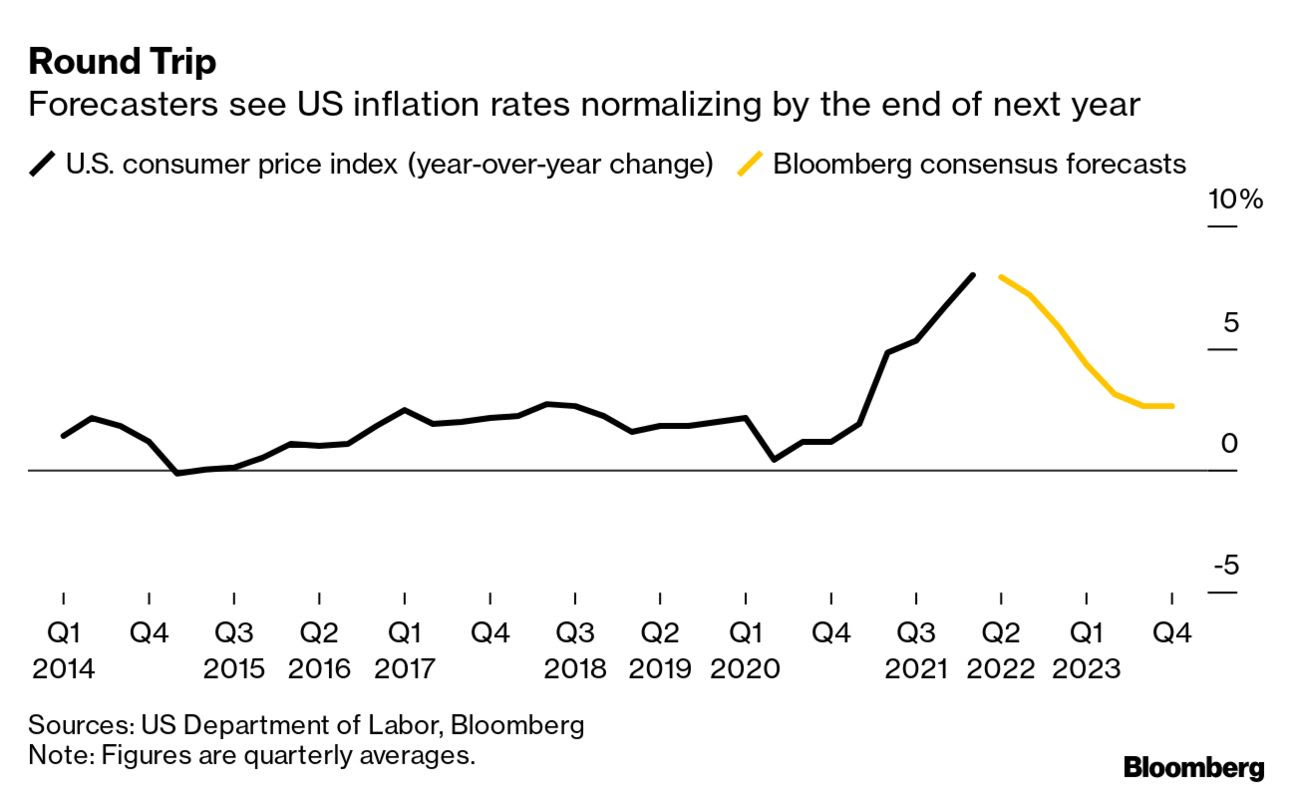
Graphic: Via Bloomberg.

Futures First analyst Rishi Mishra, who is also the author of the “On Another Note” newsletter, suggests the Federal Open Market Committee may, rather, hone in on monthly changes with annual inflation still elevated.

“This brings down inflation expectations into a range where the Fed feels comfortable about de-anchoring risks,” Mishra said.
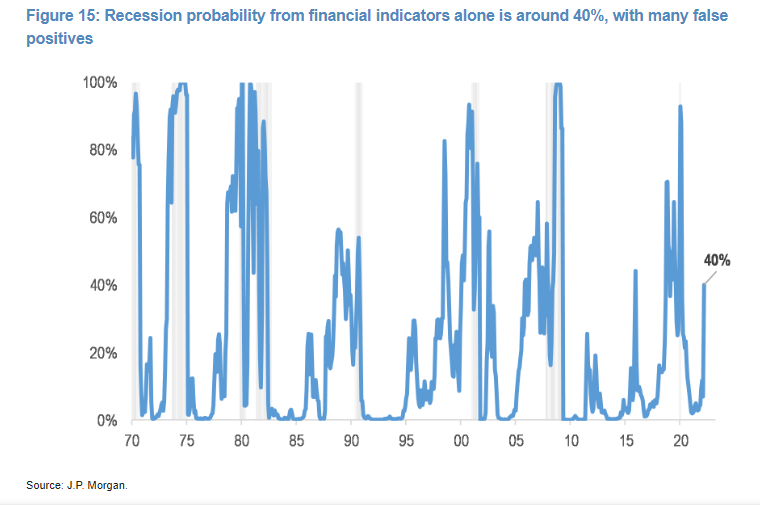
Graphic: Via JPMorgan Chase & Co (NYSE: JPM). Taken from Bloomberg. Though, potentially, “premature,” JPM’s model tracking the S&P 500, credit spreads and yield curve implies a 40% chance of a recession.

JPM’s Marko Kolanovic adds: “We have gone from a situation where both stocks and bonds were sold on the back of de-leveraging, to a situation where bonds rallied as stocks fell, nudging stock/bond correlations toward a more normal (negative) level.”

“We do indeed think this is where things could be gradually heading, but we acknowledge this is not likely to play out in a linear way.”
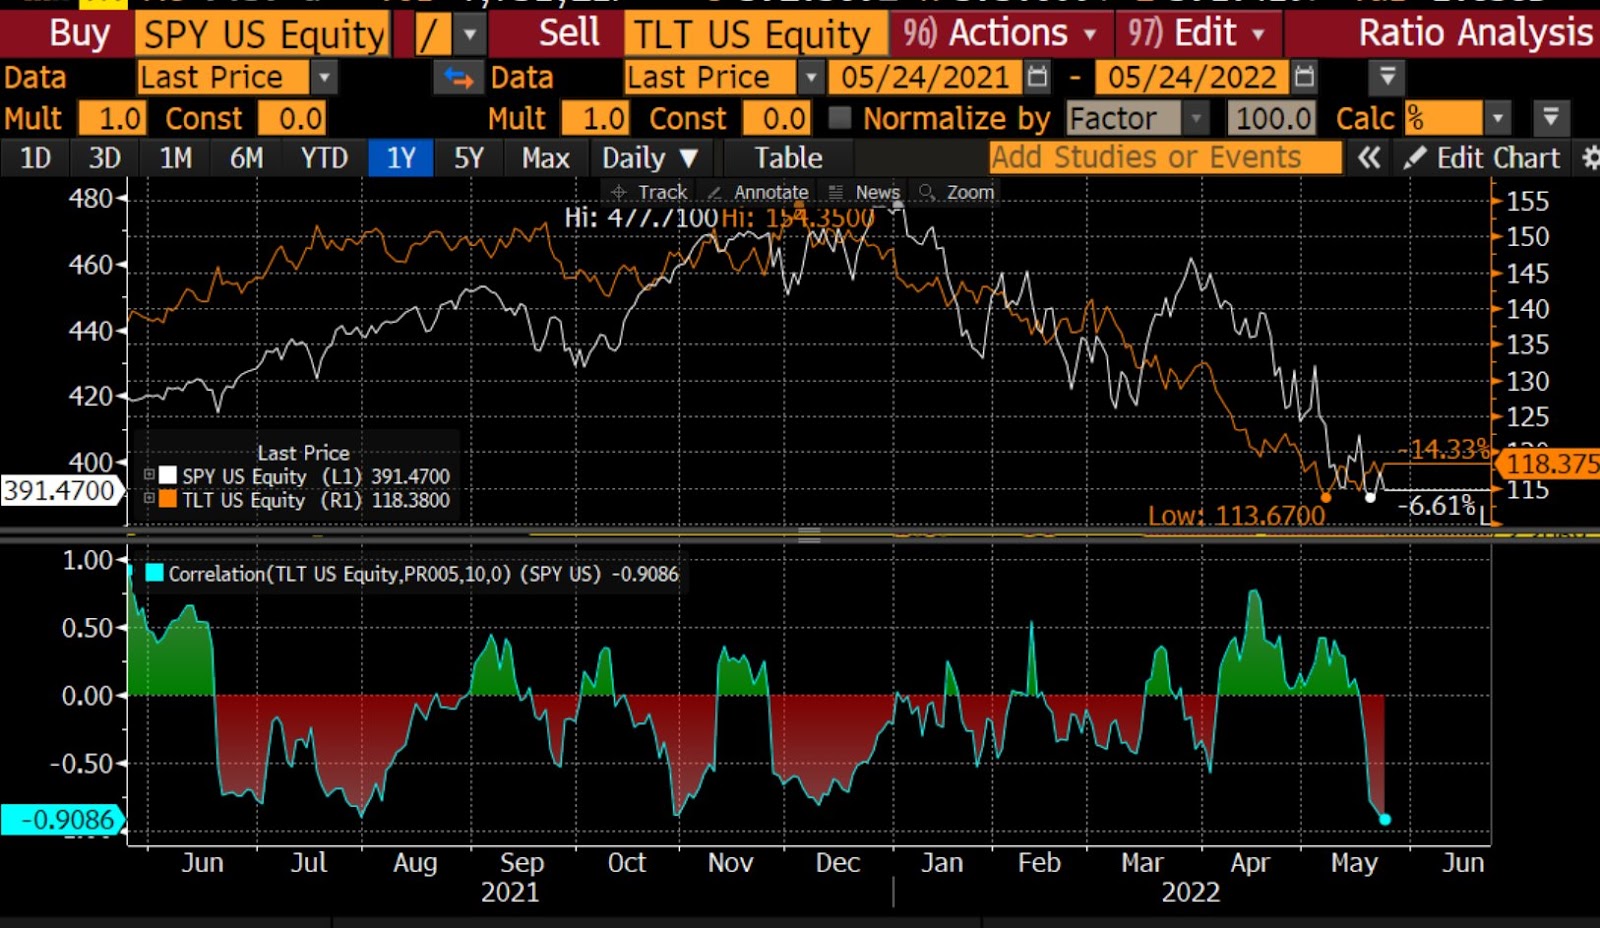
Graphic: Via @MrBlonde_macro. “Stock/bond correlation negative over the last 10 days. Some ‘normalization’ in cross-market relationships can be a source of relief.” The flip happened with 10-year yields at or above 3%.

Positioning: In yesterday’s in-depth write-up, we talked about the underperformance of implied volatility (IVOL), relative to that which is realized (RVOL).

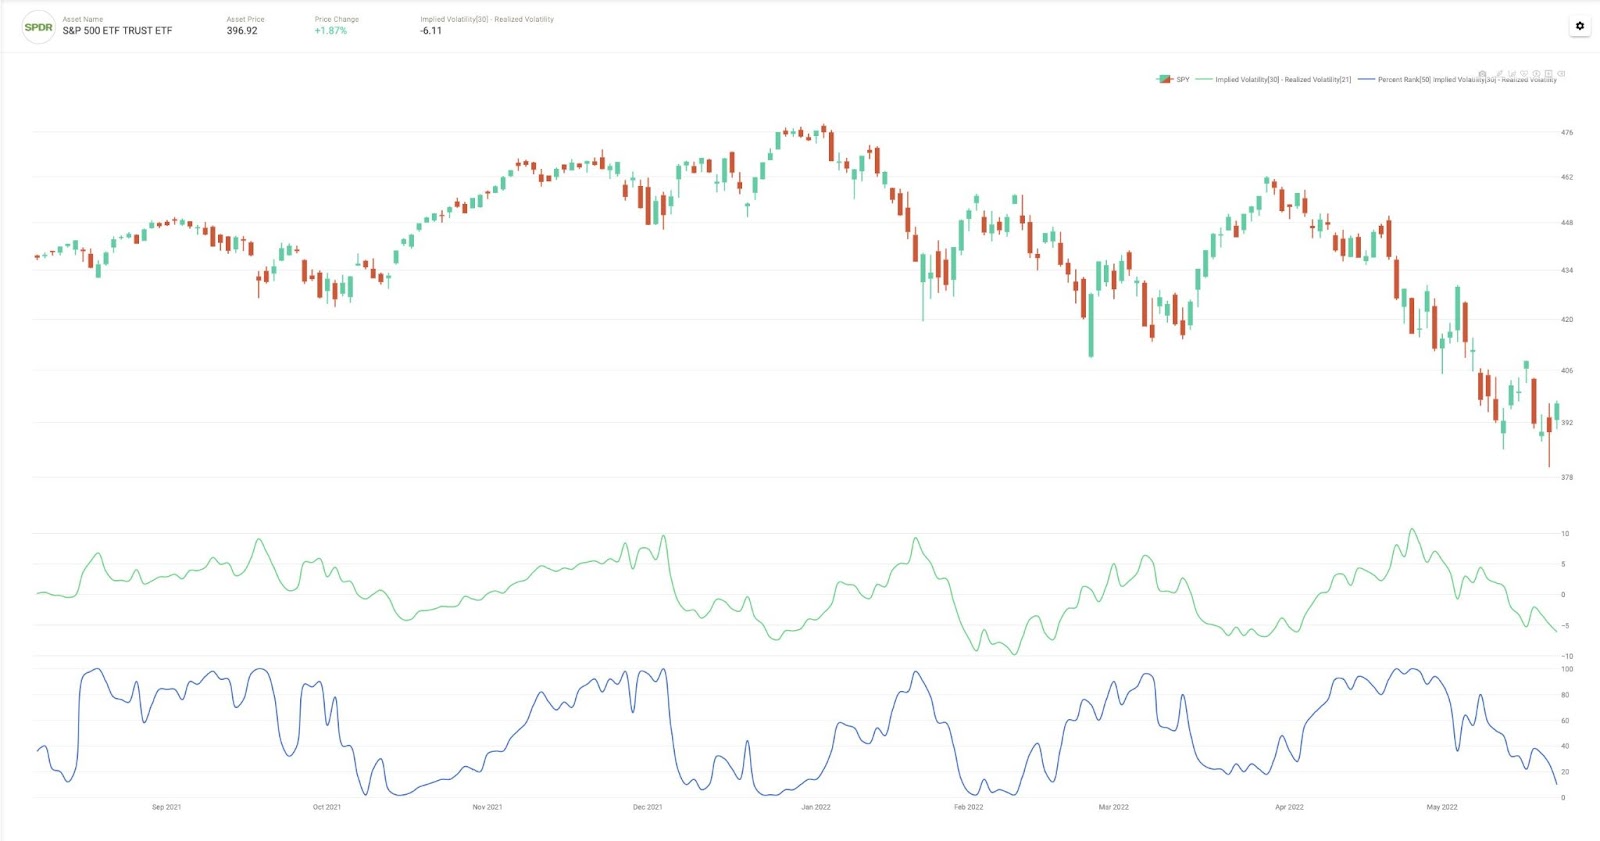
Dennis Davitt of Millbank Dartmoor Portsmouth had explained that the “RVOL of the underlying S&P 500 is above 27% … with IVOL of options trading between 24%-27%,” which translates to a VIX at 30%.
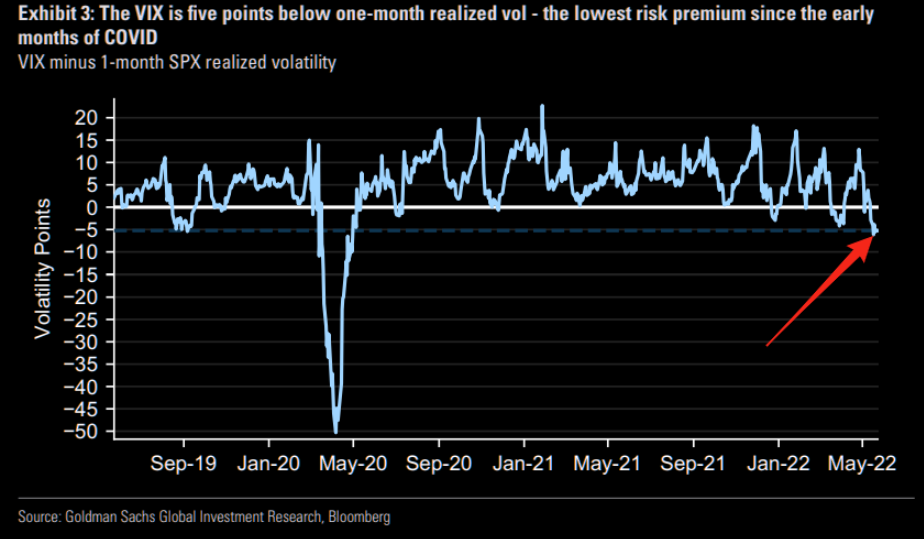
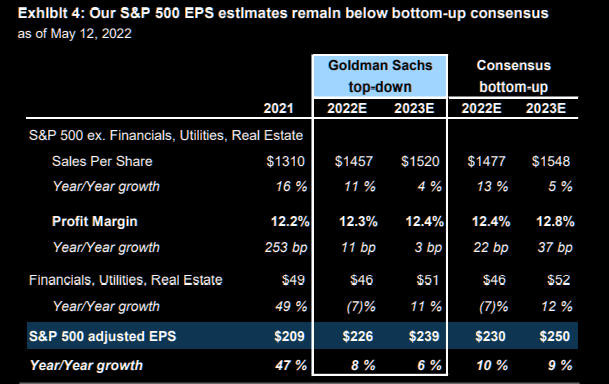
Graphic: Via Goldman Sachs Group Inc (NYSE: GS). Taken from The Market Ear.

So, essentially, it makes more sense to have exposure to underlying markets, synthetically (i.e., own options). 

This, though, merits a bit more clarification (as I do not want it to be construed as if I was buying, systemically, bets on the downside). The opposite, actually.

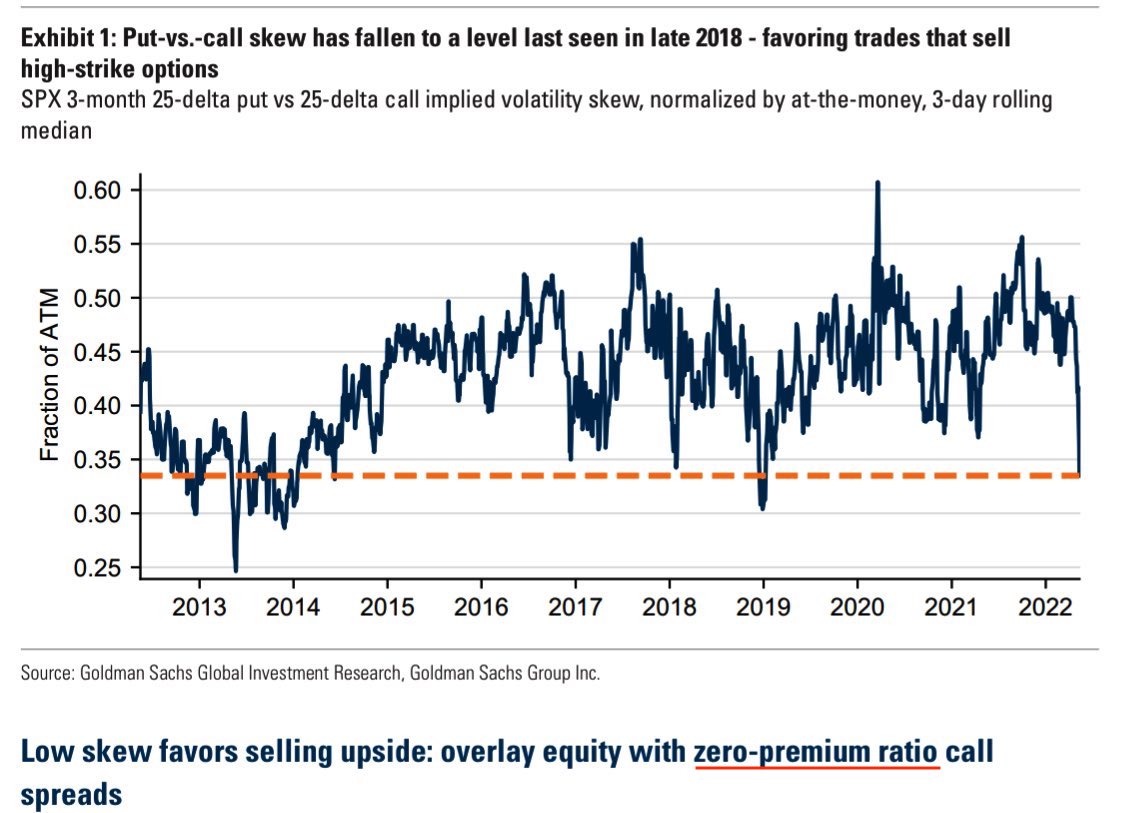
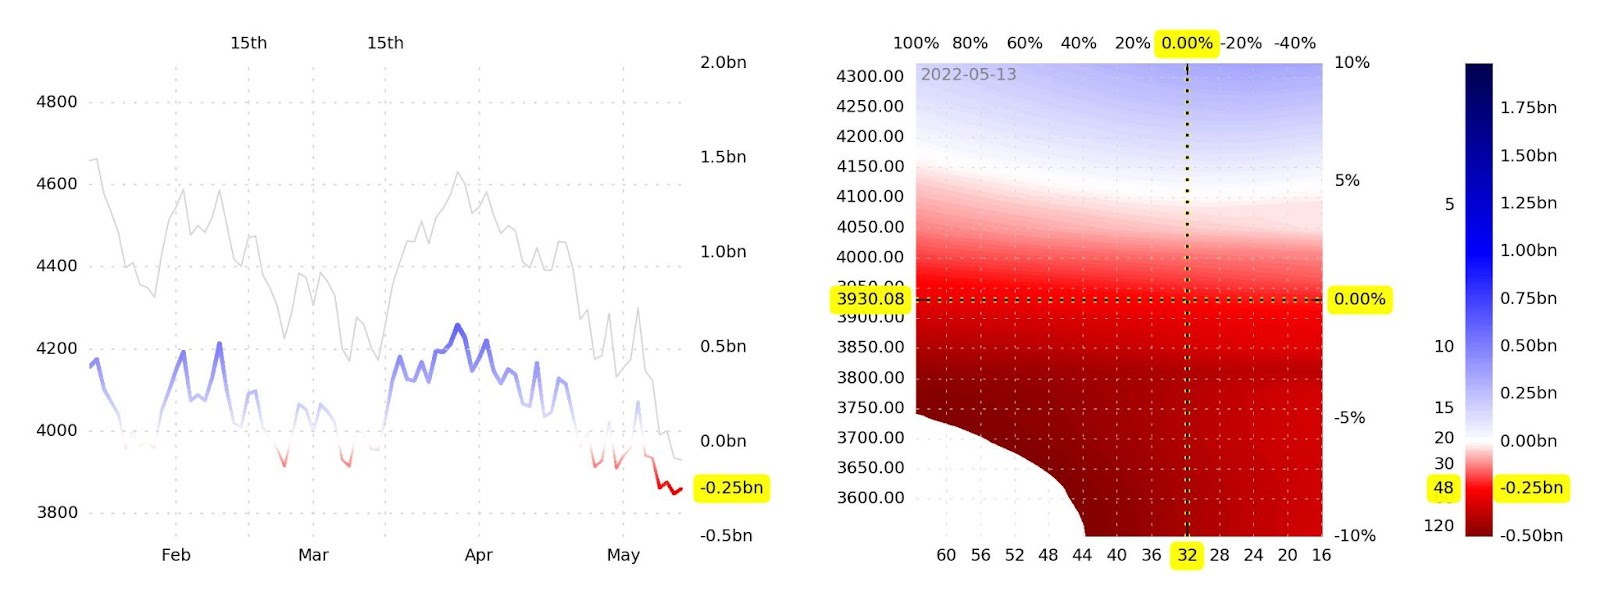
Moreover, this was stated in the context of a market that is “(1) stretched and (2) near a critical inflection which we see at $3,700.00 SPX,” per SpotGamma. Separately, investors are bidding “skew on the call side” amid their “fear of missing on the upside.”

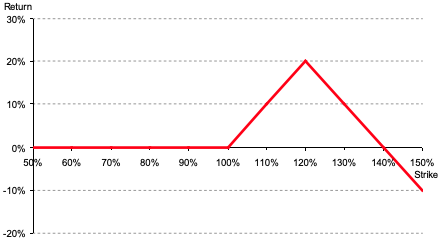
That’s when it makes sense to buy closer to at-the-money (ATM) and sell farther from ATM, or out-of-the-money (OTM). For instance, a margin intensive but low cost call +1 [ATM] x -2 [OTM] ratio spread

Note, however, that width and timing are everything. Too much time or too narrow may result in asymmetric losses when the demand for upside bets further out in price and time bids the skew that you’re short, relative to the at-the-money volatility you own. 

I’m willing to talk through this via email, if interested. Ping me at renato@physikinvest.com. I’m mindful that if I do post actual trade ideas, people may take them without knowing how to size and manage them, accordingly. Big yikes!

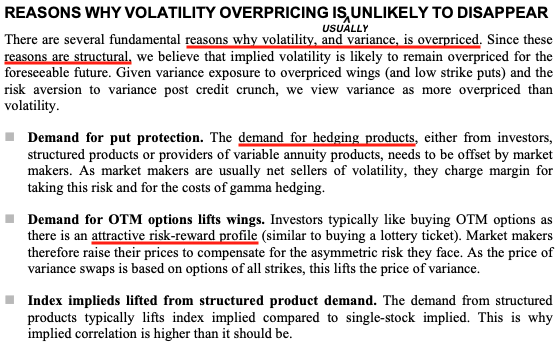
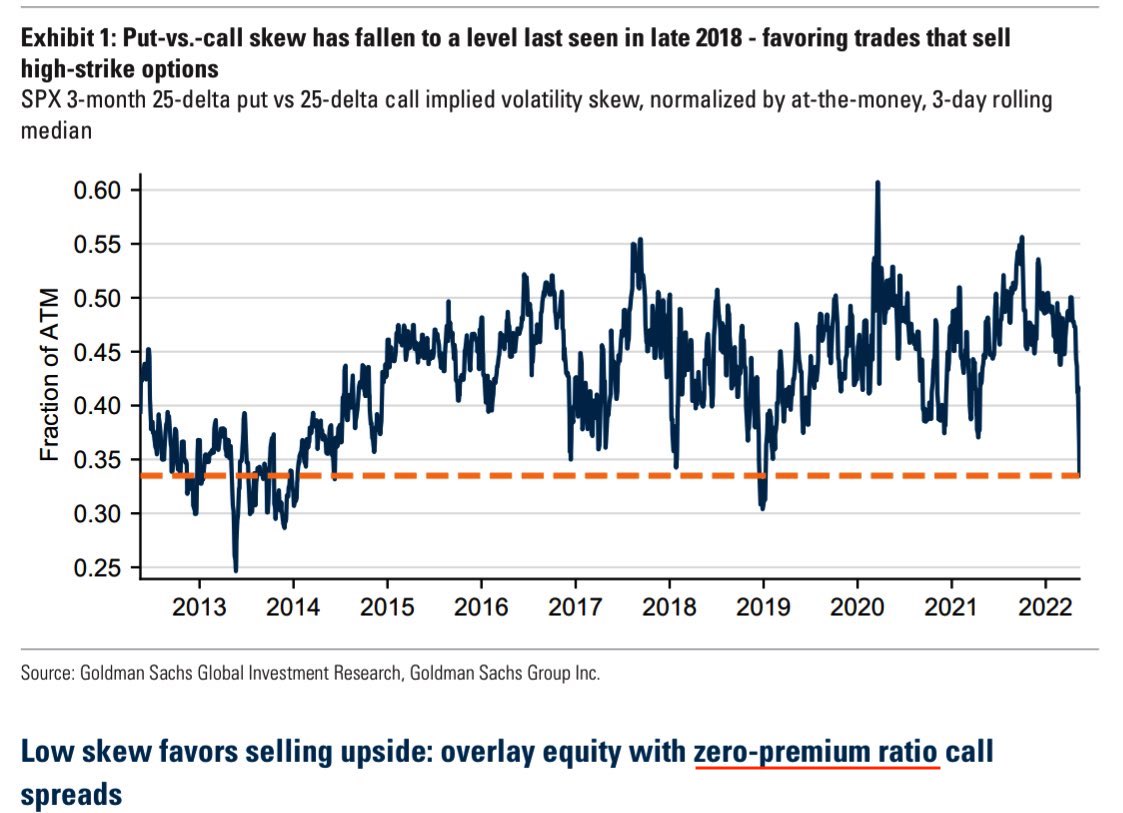
Goldman validates this thesis: “Even though the VIX’s reaction to recent spot downside has been mild, its high starting point leaves vol high overall, and we like strategies with a short volatility bias, including put selling and 1×2 call spread overlays.”
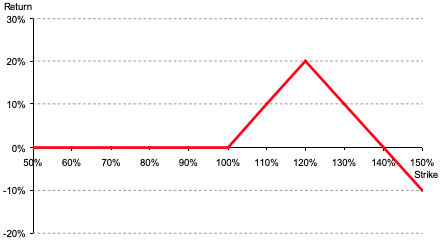
Graphic: Via Banco Santander SA (NYSE: SAN) research, the return profile, at expiry, of a classic 1×2 (long 1, short 2 further away) ratio spread.

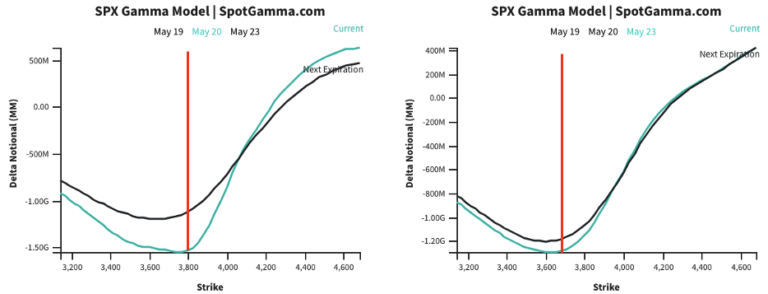
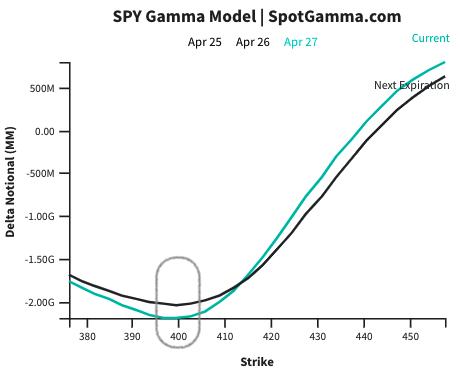
Further, though SpotGamma assigns an edge to lower prices until the June FOMC and OPEX, “markets (which are already ‘fully loaded’ with puts) [are likely] pressured by liquidity providers’ hedging [at most] down to $3,700.00,” the area where that added pressure from hedging cools.
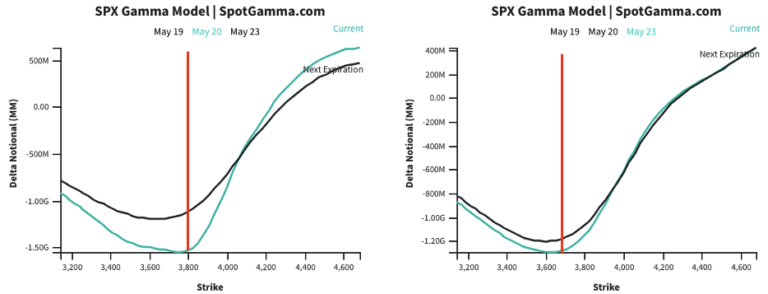
Graphic: Via SpotGamma.

Technical: As of 6:15 AM ET, Wednesday’s regular session (9:30 AM – 4:00 PM ET), in the S&P 500, will likely open in the lower part of a balanced overnight inventory, just inside of prior-range and -value, suggesting a limited potential for immediate directional opportunity.

In the best case, the S&P 500 trades higher; activity above the $3,943.25 HVNode puts in play the $3,969.00 ONH. Initiative trade beyond the ONH could reach as high as the $4,061.00 VPOC and $4,095.00 ONH, or higher.

In the worst case, the S&P 500 trades lower; activity below the $3,943.25 HVNode puts in play the $3,917.00 VPOC. Initiative trade beyond the VPOC could reach as low as the $3,863.25 LVNode and $3,831.00 VPOC, or lower.

Click here to load today’s key levels into the web-based TradingView charting platform. Note that all levels are derived using the 65-minute timeframe. New links are produced, daily.
Graphic: 65-minute profile chart of the Micro E-mini S&P 500 Futures.

Considerations: Push-and-pull, as well as responsiveness near key-technical areas (discernable visually on a chart), suggests technically-driven traders with shorter time horizons are very active.

Such traders often lack the wherewithal to defend retests.

Large participants (who often move by committee) seldom respond to key technical inflections. It is their activity that often results in poor reliability of our technical levels.

Sometimes, the better trade is to wait for the larger participants’ entry and use the expansion of the range as a confirmation of a new trend.

Catalysts to consider include the release of Federal Open Market Committee (FOMC) minutes, Wednesday.

Definitions

Overnight Highs And Lows (ONH and ONL): Typically, there is a low historical probability associated with overnight rally-highs (lows) ending the upside (downside) discovery process.

Volume Areas: A structurally sound market will build on areas of high volume (HVNodes). Should the market trend for long periods of time, it will lack sound structure, identified as low volume areas (LVNodes). LVNodes denote directional conviction and ought to offer support on any test. 

If participants were to auction and find acceptance into areas of prior low volume (LVNodes), then future discovery ought to be volatile and quick as participants look to HVNodes for favorable entry or exit.

POCs: POCs are valuable as they denote areas where two-sided trade was most prevalent in a prior day session. Participants will respond to future value tests as they offer favorable entry and exit.

About

After years of self-education, strategy development, mentorship, and trial-and-error, Renato Leonard Capelj began trading full-time and founded Physik Invest to detail his methods, research, and performance in the markets.

Capelj also develops insights around impactful options market dynamics at SpotGamma and is a Benzinga reporter.

Some of his works include conversations with ARK Invest’s Catherine Wood, investors Kevin O’Leary and John Chambers, FTX’s Sam Bankman-Fried, Kai Volatility’s Cem Karsan, The Ambrus Group’s Kris Sidial, among many others.

Disclaimer

In no way should the materials herein be construed as advice. Derivatives carry a substantial risk of loss. All content is for informational purposes only.

Categories
Commentary

Daily Brief For May 24, 2022

The daily brief is a free glimpse into the prevailing fundamental and technical drivers of U.S. equity market products. Join the 300+ that read this report daily, below!

What Happened

Overnight, equity index futures softened after what appeared to be continued covering of shorts into Monday’s close. Commodities were mixed, bonds higher, and implied volatility higher.

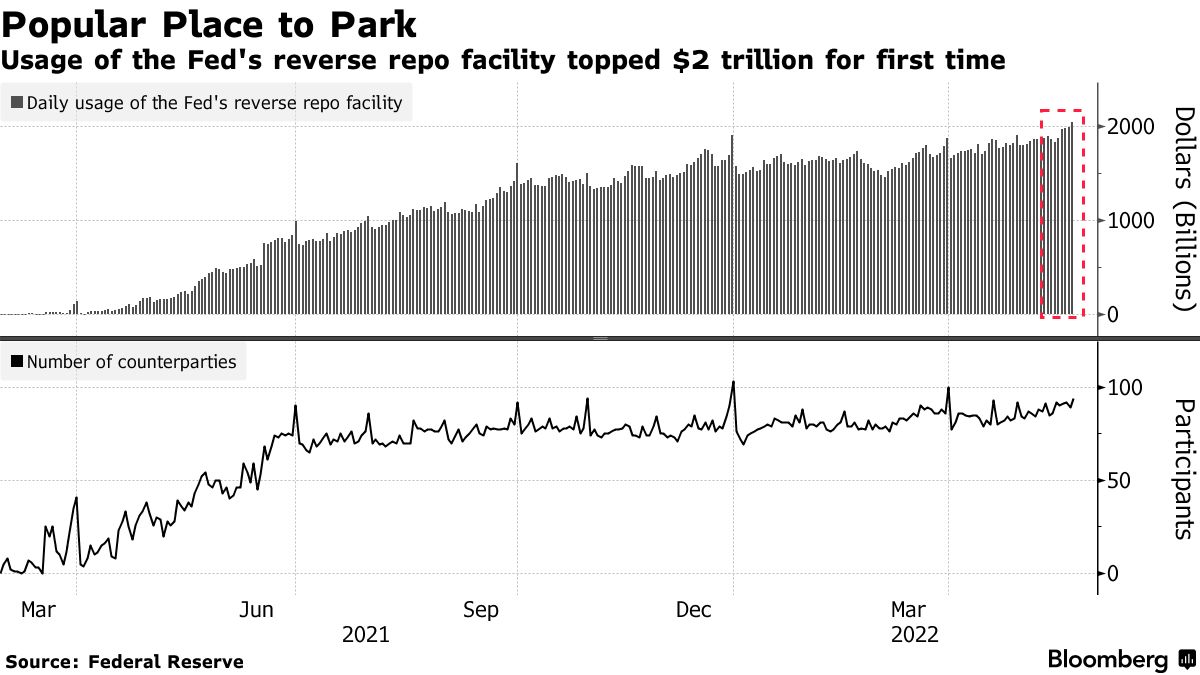
In the news the amount of money parked at major Federal Reserve facilities climbed to another all-time high, passing $2 trillion. JPMorgan Chase & Co’s (NYSE: JPM) CEO Jamie Dimon said recently that the Fed must do quantitative tightening since there’s too much liquidity in the pipes.

Adding, the Fed’s Raphael Bostic said policymakers may hike rates by 0.50 basis points after their next two meetings before pausing in September to allow for observation. This is as banks UBS Group AG (NYSE: UBS) and JPMorgan Chase & Co cut their expectations for growth here and abroad.

Ahead is data on S&P Global Inc (NYSE: SPGI) manufacturing and services (9:45 AM ET). Later, participants get updates on new home sales (10:00 AM ET) and Fed-speak by Chair Jerome Powell. Later this week, on Wednesday, participants will receive minutes of the Fed’s most recent meeting which may provide further insight into the central bank’s intent to tighten.

Graphic updated 6:15 AM ET. Sentiment Neutral if expected /ES open is inside of the prior day’s range. /ES levels are derived from the profile graphic at the bottom of the following section. Levels may have changed since initially quoted; click here for the latest levels. SqueezeMetrics Dark Pool Index (DIX) and Gamma (GEX) calculations are based on where the prior day’s reading falls with respect to the MAX and MIN of all occurrences available. A higher DIX is bullish. At the same time, the lower the GEX, the more (expected) volatility. Learn the implications of volatility, direction, and moneyness. SHIFT data used for S&P 500 (INDEX: SPX) options activity. Note that options flow is sorted by the call premium spent; if more positive, then more was spent on call options. Breadth reflects a reading of the prior day’s NYSE Advance/Decline indicator. VIX reflects a current reading of the CBOE Volatility Index (INDEX: VIX) from 0-100.

What To Expect

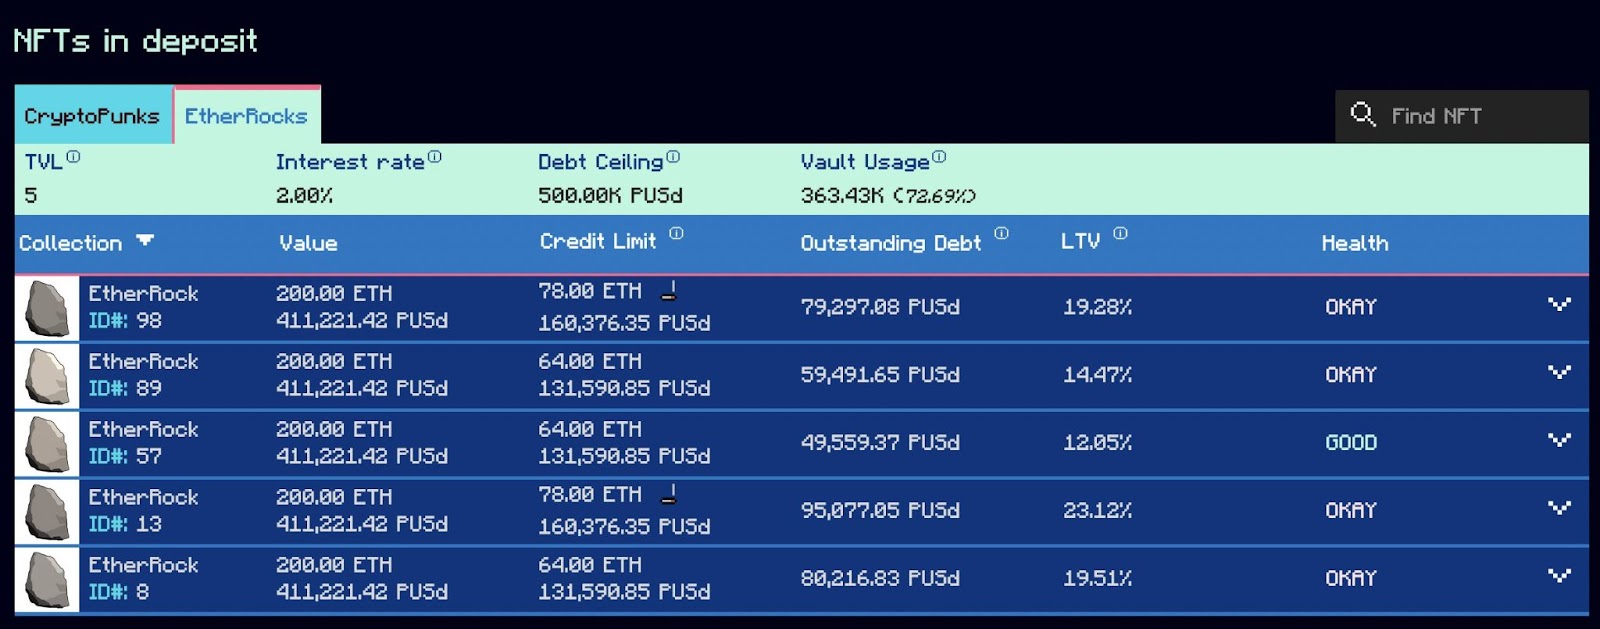
Fundamental: So long as market participants are using JPEG images of rocks as collateral for debt, it is likely we have not reached a more permanent bottom in the broad market. 

Kidding – just trying to lighten the mood, haha! Sorry to my crypto friends! 

For real, though, maybe the destruction of that market is what we’re to watch for.
Graphic: Via Corey Hoffstein. “You call it ‘tulip mania,’ but I’m gonna need to see evidence that the Dutch set up lending markets where they used paintings of rocks as collateral.”

Support of market excesses was liquidity in the financial system, a lot of which is now piling into the Fed’s overnight reverse repurchase agreement facility (RRPs).

Graphic: Via Bloomberg. Per the Federal Reserve Bank of New York: “A reverse repurchase agreement conducted by the Desk, also called a “reverse repo” or “RRP,” is a transaction in which the Desk sells a security to an eligible counterparty with an agreement to repurchase that same security at a specified price at a specific time in the future. The difference between the sale price and the repurchase price, together with the length of time between the sale and purchase, implies a rate of interest paid by the Federal Reserve on the transaction.”

Since the start of the year, however, the anticipation and pricing in of the removal of some of this liquidity have fed into market weaknesses.

Per the Damped Spring Advisors’ Andy Constan, the “Fed will reduce their balance sheet by choosing not to reinvest the proceeds of maturity payments of existing holdings back into the market. The U.S. Treasury will need to find new buyers for the bonds it issues.”

Please read our Daily Brief For May 5, 2022, here, for more on the Federal Reserve’s updates.

On June 1, the Fed will start the process of balance sheet reduction at $47.5 billion ($30B UST and $17.5B MBS) a month for the first three months. This will increase to $95 billion ($60B UST and $35B MBS), after, about double the maximum pace of $50 billion a month in 2017-2019.

Constan adds: “In June, that supply those markets will need to absorb will be $50 billion USD and will grow to $95 billion (of which some will be outright sales of mortgages by the Fed).”

Accordingly, “[j]ust as USD strength occurred as global investors chased U.S. assets, as the U.S. economy led the global economy out of the Covid chasm, the next leg of asset returns is more likely in countries that remain relatively easy and where the economy is still lagging.”

Goldman Sachs Group Inc’s (NYSE: GS) Vickie Chang notes: “Using history as a guide, in order for equities to come off their recent lows (and stop declining), this kind of monetary-tightening induced contraction is most likely to end when the Fed itself shifts.” 

“It may be that the market needs to see signs of the inflation deceleration that our US economists expect in the second half of the year in order to see sustained relief.”

Positioning: Pursuant to comments established last week, Dennis Davitt of Millbank Dartmoor Portsmouth explains that the “realized volatility of the underlying S&P 500 is above 27% … with implied volatility of options trading between 24%-27%,” which translates to a VIX at 30%.

“It is profitable to own options with such an active and volatile cash market. This is the opposite of 2017 where the VIX was at 10% and the realized was 7%,” a trade that leverage poured into and resulted in the spectacular short-volatility ‘Volmageddon’ blow-up in February of 2018.

Graphic: Via Banco Santander SA (NYSE: SAN) research.

What does this mean?

Davitt concludes that “18 months” out there are “elevated option prices which may foretell an increase in the volatility of the equity market through this time next year.”

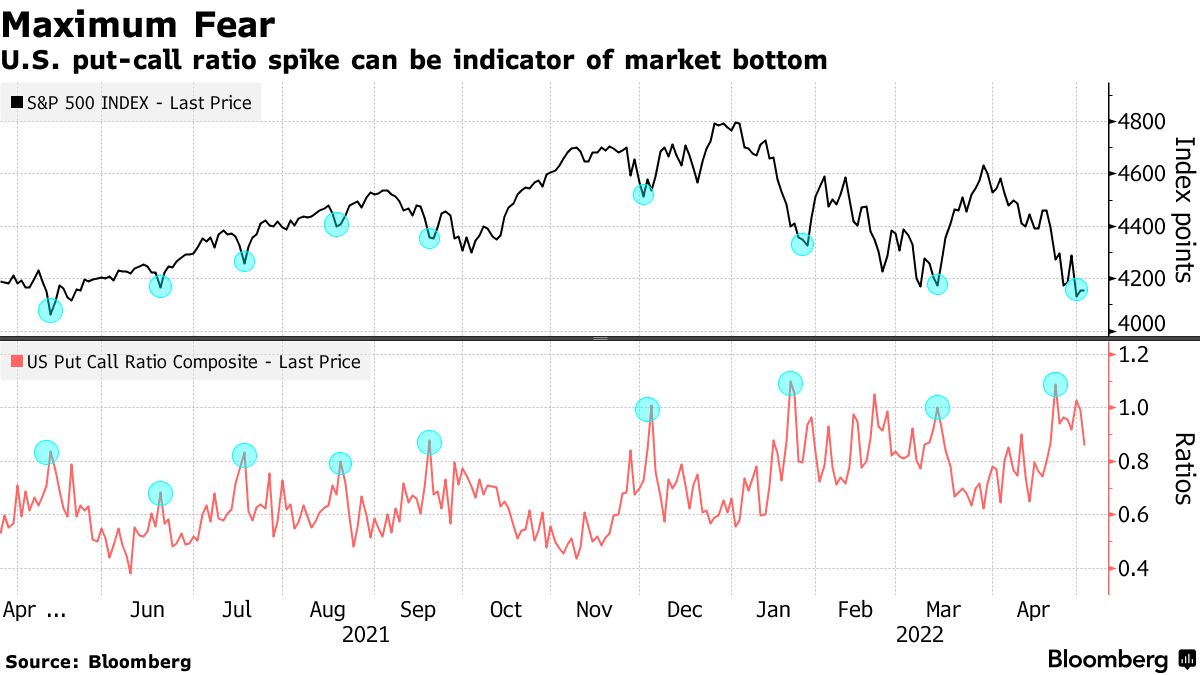
Though the Cboe Volatility Index (INDEX: VIX) may print higher, it is likely that it does not spike and point to an immediate market bottom, all else equal, like it has in the very near past.

Graphic: Via Millbank Dartmoor Portsmouth.

How to play?

It makes more sense to have exposure to underlying markets, synthetically (i.e., own options). This is based on the current relationship between realized and implied volatility.

Graphic: Via Robson Chow, founder at Tradewell. “The spread between IV and RV remains quite low relative to the past 50 trading days and 1st decile in the historical data.  It is printing where, historically, the most forward realized volatility and the weakest relative mean returns over the next 60 days can be expected.”

This is in contrast to the thesis that “long volatility is a poor equity hedge” because, on average, it’s overpriced and has less than a 100% negative correlation with the equity market.

Graphic: Via Banco Santander SA (NYSE: SAN) research.

Given fundamental contexts, many foresee continued weaknesses. Notwithstanding, markets are stretched to the downside and the path of least resistance, based on prior comments, is up.

This is with the caveat that traders should look at the current window of time as a period during which markets have less pressure to rally against. Per SpotGamma, this is due to the put-heavy options expiration (OPEX), Friday. 

Still, the rally into Monday “pulled forward some of the energy from [those] options that were to roll off,” and now, participants are “much less hedged than they were.” Should demand return, that will bid options prices and likely solicit liquidity provider pressures which, all else equal, start to cool into the $3,700.00 S&P 500 area.

Graphic: Via SpotGamma.

Technical: As of 6:15 AM ET, Tuesday’s regular session (9:30 AM – 4:00 PM ET), in the S&P 500, will likely open in the middle part of a negatively skewed overnight inventory, inside of prior-range and -value, suggesting a limited potential for immediate directional opportunity.

In the best case, the S&P 500 trades higher; activity above the $3,943.25 HVNode puts in play the $3,969.00 VPOC. Initiative trade beyond the VPOC could reach as high as the $4,061.00 VPOC and $4,095.00 ONH, or higher.

In the worst case, the S&P 500 trades lower; activity below the $3,943.25 HVNode puts in play the $3,908.75 MCPOC. Initiative trade beyond the MCPOC could reach as low as the $3,862.75 LVNode and $3,831.00 VPOC, or lower.

Click here to load today’s key levels into the web-based TradingView charting platform. Note that all levels are derived using the 65-minute timeframe. New links are produced, daily.
Graphic: 65-minute profile chart of the Micro E-mini S&P 500 Futures.

Considerations: Push-and-pull, as well as responsiveness near key-technical areas (discernable visually on a chart), suggests technically-driven traders with shorter time horizons are very active.

Such traders often lack the wherewithal to defend retests.

Large participants (who often move by committee) seldom respond to key technical inflections. It is their activity that often results in poor reliability of our technical levels.

Sometimes, the better trade is to wait for the larger participants’ entry and use the expansion of the range as a confirmation of a new trend.

Catalysts to consider include the release of Federal Open Market Committee (FOMC) minutes, Wednesday.

Definitions

Overnight Highs And Lows (ONH and ONL): Typically, there is a low historical probability associated with overnight rally-highs (lows) ending the upside (downside) discovery process.

Volume Areas: A structurally sound market will build on areas of high volume (HVNodes). Should the market trend for long periods of time, it will lack sound structure, identified as low volume areas (LVNodes). LVNodes denote directional conviction and ought to offer support on any test. 

If participants were to auction and find acceptance into areas of prior low volume (LVNodes), then future discovery ought to be volatile and quick as participants look to HVNodes for favorable entry or exit.

POCs: POCs are valuable as they denote areas where two-sided trade was most prevalent in a prior day session. Participants will respond to future tests of value as they offer favorable entry and exit.

MCPOCs: POCs are valuable as they denote areas where two-sided trade was most prevalent over numerous day sessions. Participants will respond to future tests of value as they offer favorable entry and exit.

About

After years of self-education, strategy development, mentorship, and trial-and-error, Renato Leonard Capelj began trading full-time and founded Physik Invest to detail his methods, research, and performance in the markets.

Capelj also develops insights around impactful options market dynamics at SpotGamma and is a Benzinga reporter.

Some of his works include conversations with ARK Invest’s Catherine Wood, investors Kevin O’Leary and John Chambers, FTX’s Sam Bankman-Fried, Kai Volatility’s Cem Karsan, The Ambrus Group’s Kris Sidial, among many others.

Disclaimer

In no way should the materials herein be construed as advice. Derivatives carry a substantial risk of loss. All content is for informational purposes only.

Categories
Commentary

Daily Brief For May 20, 2022

The daily brief is a free glimpse into the prevailing fundamental and technical drivers of U.S. equity market products. Join the 300+ that read this report daily, below!

What Happened

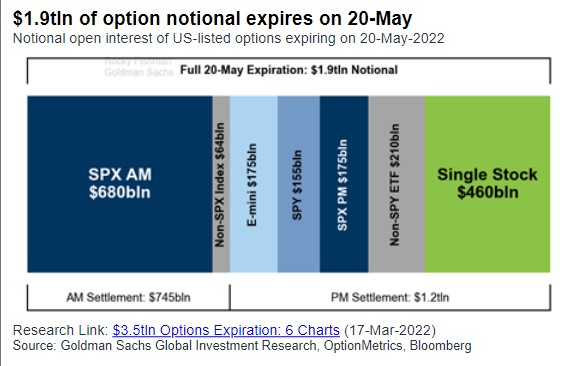
Ahead of a $1.9 trillion options expiration, which we unpack later in the letter, the equity index and commodity futures, as well as yields, were bid.

This activity was on the heels of good news coming from overseas. China lowered prime rates on the five-year by a record to boost mortgages and loans amid an ongoing pandemic slump.

In other news, China warned the U.S. over a ‘dangerous situation’ forming over Taiwan, and the U.S. is set to block Russian debt payments, raising concerns of default. 

This is as Russian forces, per Michael Horowitz of Le Beck Int’l, broke “Ukrainian defenses west of Popasna in the Donbass, … a tactical success for Russia, the first in a very long time.”

Ahead, there is no data scheduled for release. Enjoy your Friday!

Graphic updated 6:30 AM ET. Sentiment Neutral if expected /ES open is inside of the prior day’s range. /ES levels are derived from the profile graphic at the bottom of the following section. Levels may have changed since initially quoted; click here for the latest levels. SqueezeMetrics Dark Pool Index (DIX) and Gamma (GEX) calculations are based on where the prior day’s reading falls with respect to the MAX and MIN of all occurrences available. A higher DIX is bullish. At the same time, the lower the GEX, the more (expected) volatility. Learn the implications of volatility, direction, and moneyness. SHIFT data used for S&P 500 (INDEX: SPX) options activity. Note that options flow is sorted by the call premium spent; if more positive, then more was spent on call options. Breadth reflects a reading of the prior day’s NYSE Advance/Decline indicator. VIX reflects a current reading of the CBOE Volatility Index (INDEX: VIX) from 0-100.

What To Expect

Fundamental: Fundamentally, the narrative remains the same, albeit there has been a rise in concern over global growth given persistent supply chokepoints and a commitment to reducing liquidity and credit.

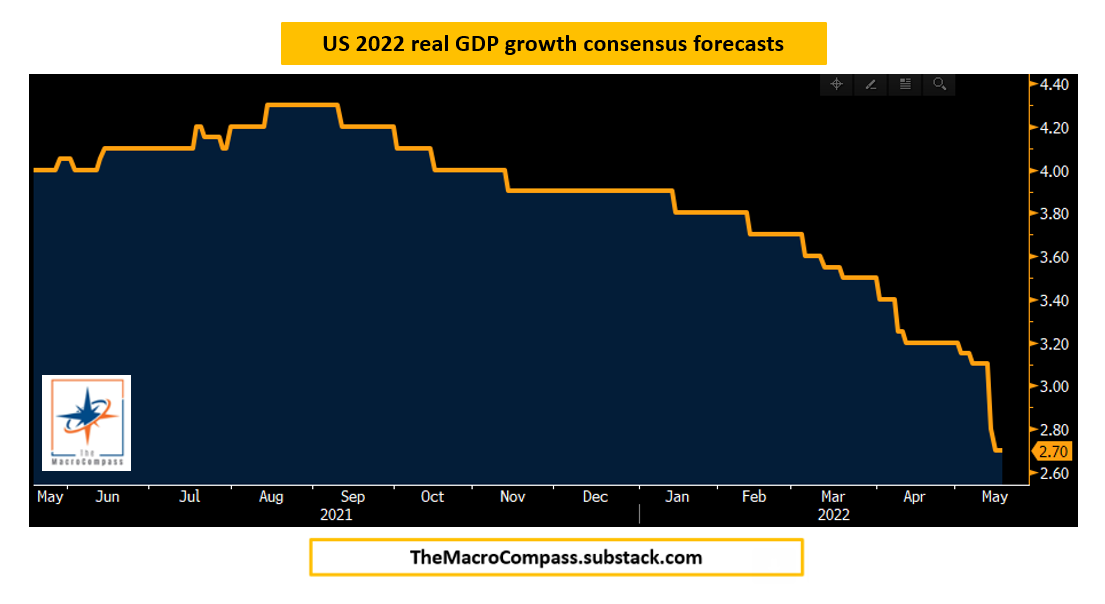
Moody’s Corporation’s (NYSE: MCO) Mark Zandi explains “the odds that the economy will suffer a downturn beginning in the next 12 months at one in three with uncomfortable near-even odds of a recession in the next 24 months.”

Graphic: Via The Macro Compass. “Analyst consensus for the 2022 US real GDP growth has been consistently revised down this year.”

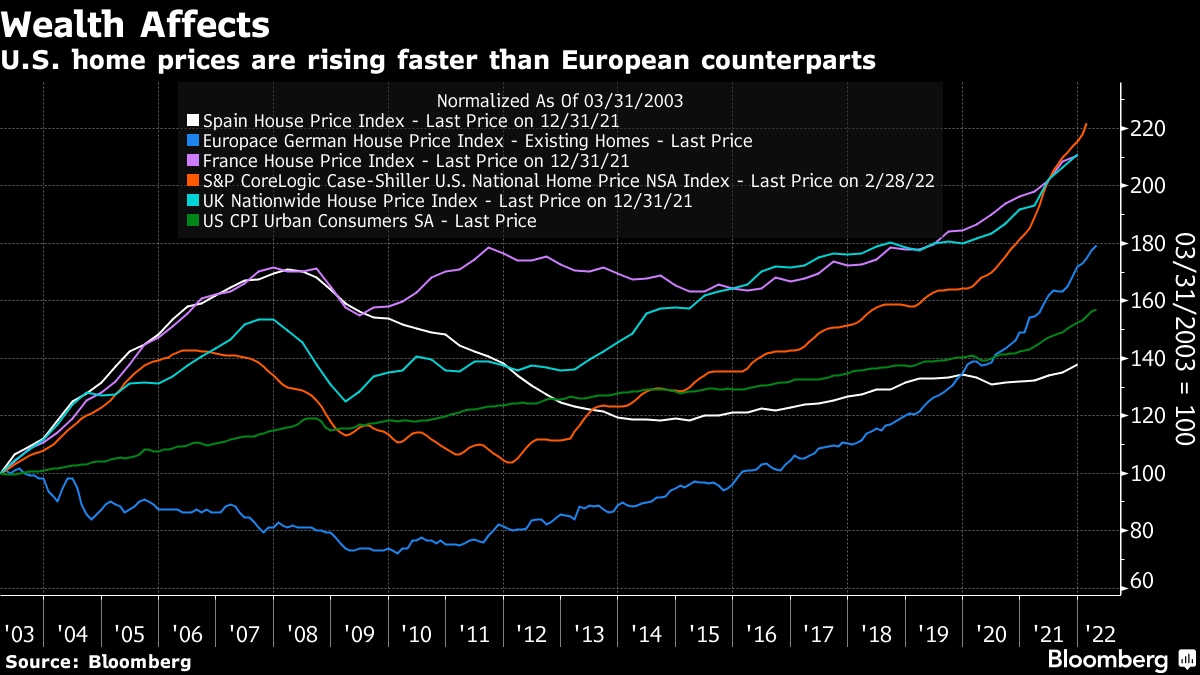
Per Bloomberg’s John Authers, U.S. housing is slowing down in the context of still-heightened sales. Data on home building suggests builders “aren’t running scared” while chokepoints still are feeding into support for house prices.

“Now, with inflation rising, the Fed is more concerned about wealth effects,” Authers explained. 

“The rise in asset prices has made a lot of people wealthier and encouraged them to spend accordingly. It’s also stoked inequality. A fall in home values would be helpful at this point,” and it’s something the Fed is keen on “pursuing,” as talked about in letters earlier this week.

Graphic: Via Bloomberg.

Positioning: Friday marks the roll off of $460 billion of derivatives across single stocks and $855 billion of S&P 500-linked contracts, according to a Bloomberg report quoting Goldman Sachs Group Inc (NYSE: GS) research.

Graphic: Via Goldman Sachs Group Inc. Taken from Bloomberg.

Into this event, participants are hedged and volatility remains well-supplied, due in part to suppressive volatility selling, as well as passive flows supporting the largest index constituents.

Consequently, the market’s descent has been orderly and not exacerbated by the demand for hedges and associated repricings of volatility.

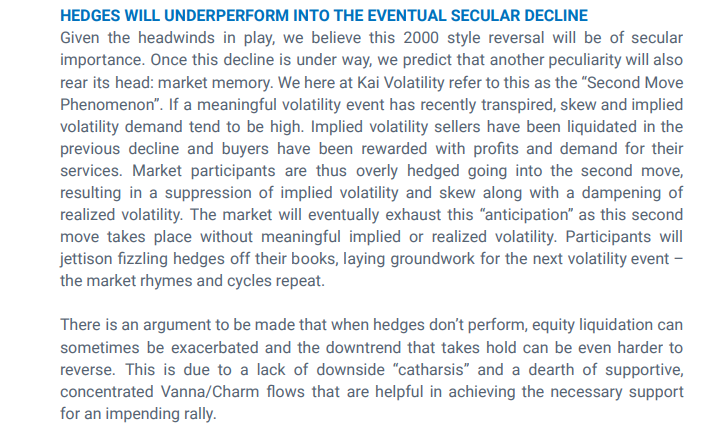
This was expected, per Kai Volatility Cem Karsan’s commentary published in December 2021.

“If a meaningful volatility event has recently transpired [e.g., COVID-19], implied volatility demand tends to be high,” as sellers of it were liquidated in previous declines and “buyers have been rewarded with profits and demand for their services.”

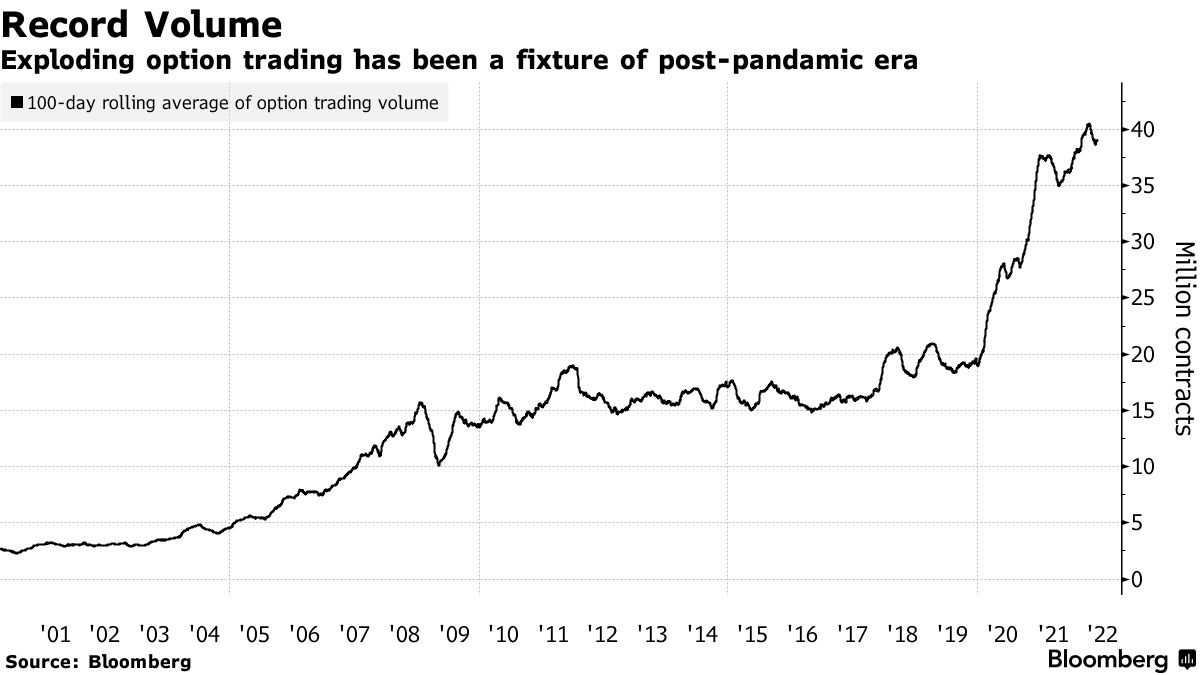
Graphic: Via Bloomberg. “2022 is shaping up to be the busiest year for option trading. Almost 40 million contracts have changed hands daily on average, 6% above last year’s record, data compiled by Bloomberg show.”

“Market participants are thus overly hedged going into the second move, resulting in the suppression of implied volatility and skew along with a dampening of realized volatility.”

Graphic: Commentary published by Kai Volatility.

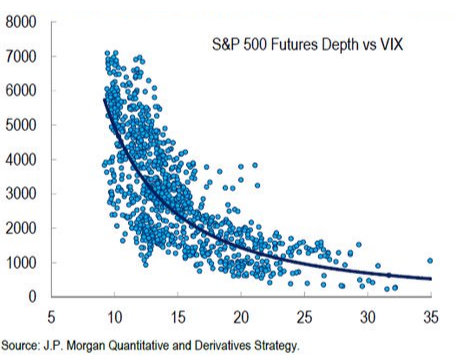
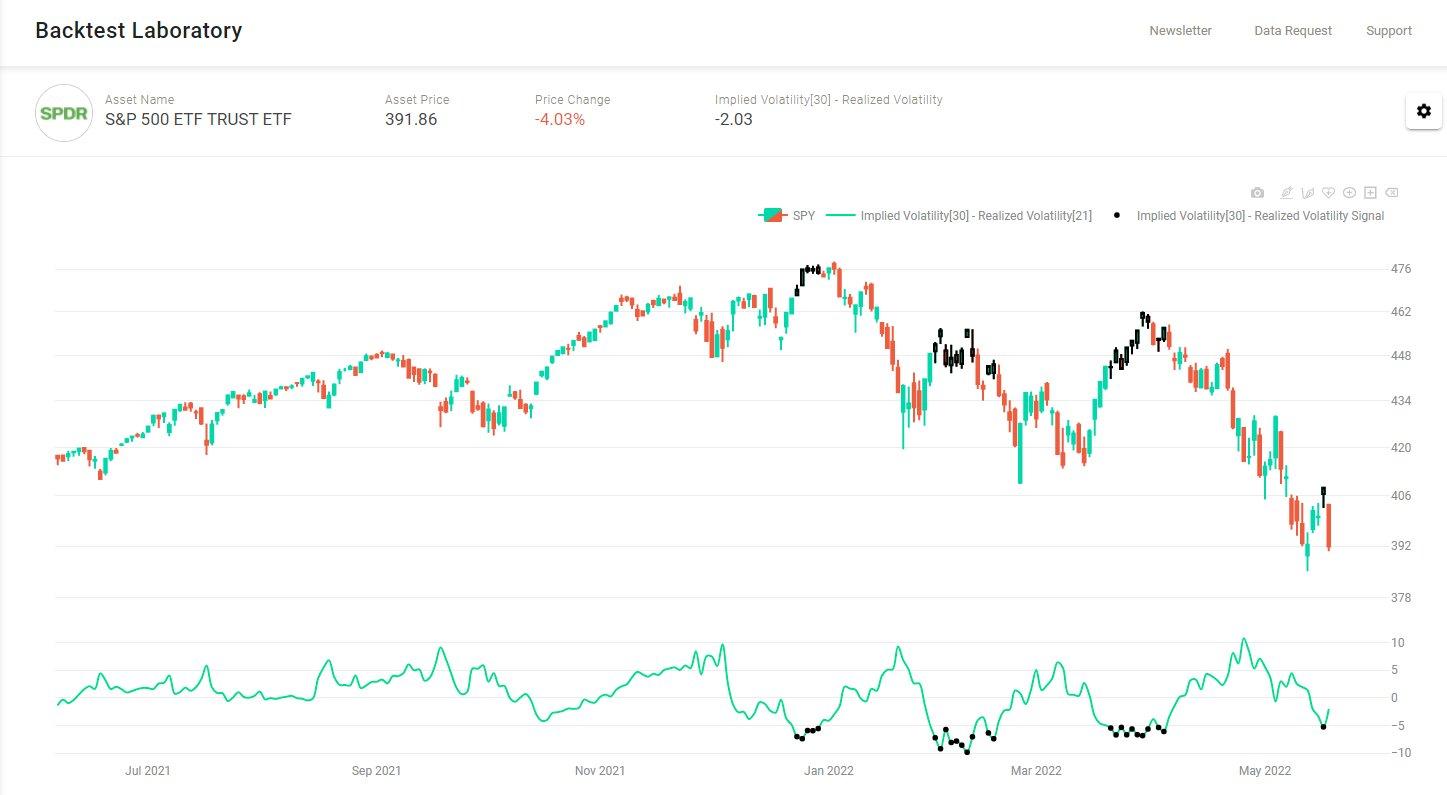
Given the aforementioned supply and demand dynamic, as well as illiquidity, we continue to observe a “divergence in the volatility (movement of underlying equity market up and down) realized, versus that which is implied by options activity,” SpotGamma says.

Graphic: Via @ftx_chris. “The relationship between illiquidity & volatility is a critical market driver for traditional markets now. In simple terms: lower liquidity creates increased volatility.”

“For some of these reasons – tempered measures of implied volatility – the market’s missing a lot of the ‘stored energy’ or ‘vanna fuel’ that’s helped support it in past periods of turmoil.”

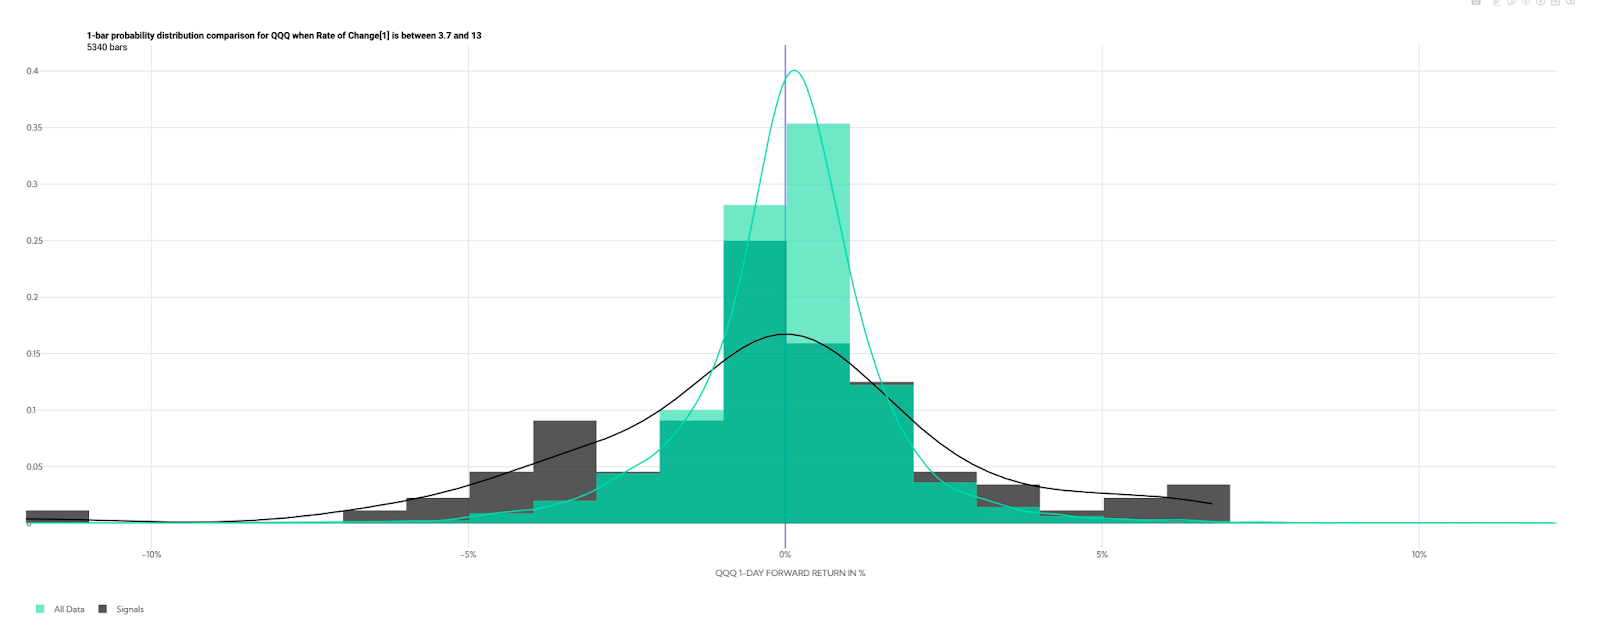
Graphic: Via @HalfersPower. “1 day return distribution when QQQ ROC[1] > 3.7%. Historically you can expect the weakest relative mean forward returns, and second-highest mean realized volatility amongst deciles.”

So, barring changes in fundamentals, the catalysts to a potential rally are few and far between, and we elaborated on this in an earlier commentary.

Graphic: Via SqueezeMetrics. Updated May 13, 2022. “VIX compressing to 30 on a modest pre-market rally with dealer gamma exposure more negative than it’s been in years is not how you get sustained rallies—it’s how you get energy for bigger downside moves.”

Heading into Friday, Bloomberg quotes the $4,000.00 S&P 500 (INDEX: SPX) strike having “93,000 open positions set to run out, … includ[ing] 41,024 calls and 52,269 puts.”

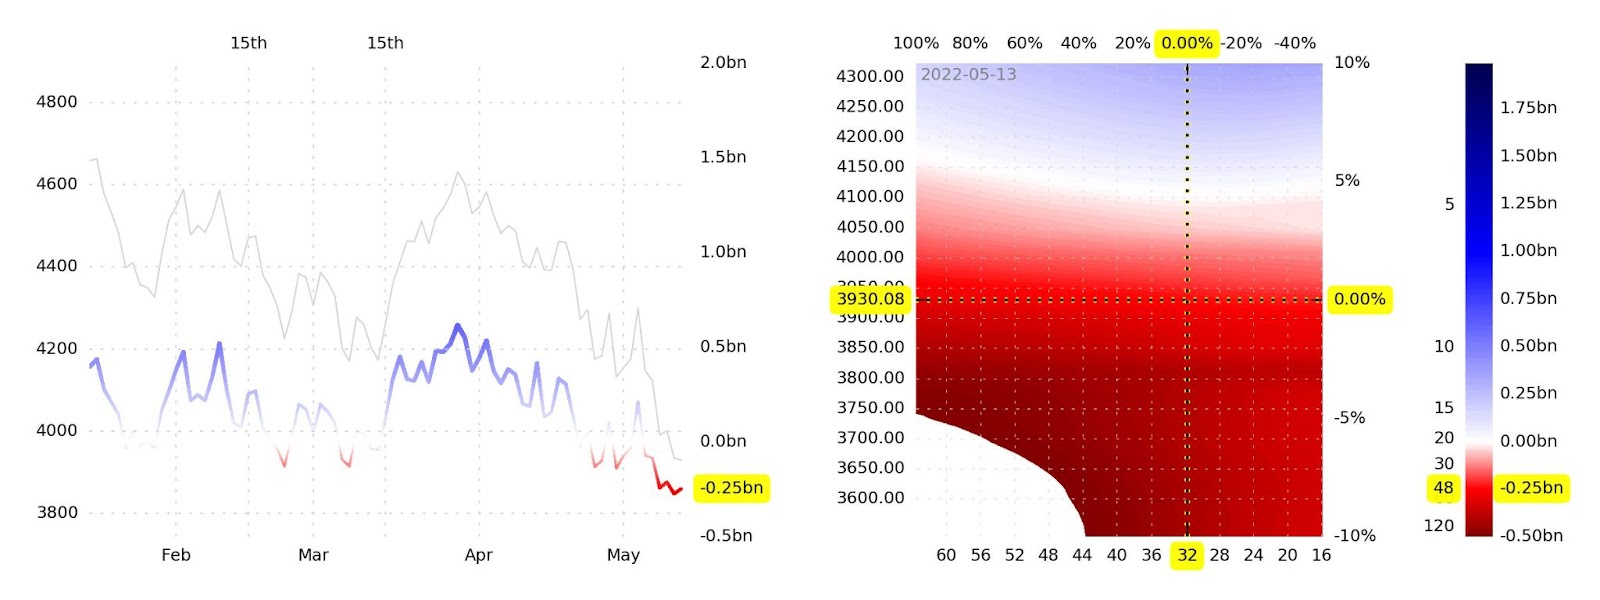
Graphic: Via SpotGamma.

An open well below $4,000.00 means that this expiration will coincide with the removal of a lot of in-the-money put-delta. That means, post-expiration, per SpotGamma, “market makers will be free to buy back stocks to cover the short exposures that are no longer needed.” 

“Any ultimate rally off of Opex, we’d consider to be short covering, and subject to swift reversals into the end of next week.”

Technical: As of 6:30 AM ET, Friday’s regular session (9:30 AM – 4:00 PM ET), in the S&P 500, will likely open in the upper part of a positively skewed overnight inventory, just inside of prior-range and -value, suggesting a limited potential for immediate directional opportunity.

In the best case, the S&P 500 trades higher; activity above the $3,943.25 high volume area (HVNode) puts in play the $4,061.00 untested point of control (VPOC). Initiative trade beyond the VPOC could reach as high as the $4,095.00 overnight high (ONH) and $4,119.00 VPOC, or higher.

In the worst case, the S&P 500 trades lower; activity below the $3,943.25 HVNode puts in play the $3,908.75 micro composite point of control (MCPOC). Initiative trade beyond the MCPOC could reach as low as the $3,862.75 and $3,836.25 low volume areas (LVNodes), or lower.

Click here to load today’s key levels into the web-based TradingView charting platform. Note that all levels are derived using the 65-minute timeframe. New links are produced, daily.
Graphic: 65-minute profile chart of the Micro E-mini S&P 500 Futures.

Considerations: Push-and-pull, as well as responsiveness near key-technical areas (discernable visually on a chart), suggests technically-driven traders with shorter time horizons are (becoming) active.

Such traders often lack the wherewithal to defend retests.

Large participants (who often move by committee) seldom respond to key technical inflections. It is their activity that often results in poor reliability of our technical levels.

Sometimes, the better trade is to wait for the larger participants’ entry and use the expansion of the range as a confirmation of a new trend.

Definitions

Overnight Rally Highs (Lows): Typically, there is a low historical probability associated with overnight rally-highs (lows) ending the upside (downside) discovery process.

Volume Areas: A structurally sound market will build on areas of high volume (HVNodes). Should the market trend for long periods of time, it will lack sound structure, identified as low volume areas (LVNodes). LVNodes denote directional conviction and ought to offer support on any test. 

If participants were to auction and find acceptance into areas of prior low volume (LVNodes), then future discovery ought to be volatile and quick as participants look to HVNodes for favorable entry or exit.

POCs: POCs are valuable as they denote areas where two-sided trade was most prevalent in a prior day session. Participants will respond to future tests of value as they offer favorable entry and exit.

MCPOCs: POCs are valuable as they denote areas where two-sided trade was most prevalent over numerous day sessions. Participants will respond to future tests of value as they offer favorable entry and exit.

About

After years of self-education, strategy development, mentorship, and trial-and-error, Renato Leonard Capelj began trading full-time and founded Physik Invest to detail his methods, research, and performance in the markets.

Capelj also develops insights around impactful options market dynamics at SpotGamma and is a Benzinga reporter.

Some of his works include conversations with ARK Invest’s Catherine Wood, investors Kevin O’Leary and John Chambers, FTX’s Sam Bankman-Fried, Kai Volatility’s Cem Karsan, The Ambrus Group’s Kris Sidial, among many others.

Disclaimer

In no way should the materials herein be construed as advice. Derivatives carry a substantial risk of loss. All content is for informational purposes only.

Categories
Commentary

Daily Brief For May 18, 2022

The daily brief is a free glimpse into the prevailing fundamental and technical drivers of U.S. equity market products. Join the 300+ that read this report daily, below!

What Happened

Overnight, equity indices auctioned lower alongside commodities and bonds. The Cboe Volatility Index (INDEX: VIX) caught a bid ahead of its large expiration this morning.

Fundamentally, the context is the same. To note, Federal Reserve Chair Jerome Powell was at a conference, yesterday, and said the central bank would continue raising rates until there is evidence that inflation is in retreat. 

Until that evidence appears, the Fed could move “more aggressively.” That was hawkish.

Today we receive updates on building permits and housing starts (8:30 AM ET). Later, Philadelphia Fed President Patrick Harker speaks (4:00 PM ET).

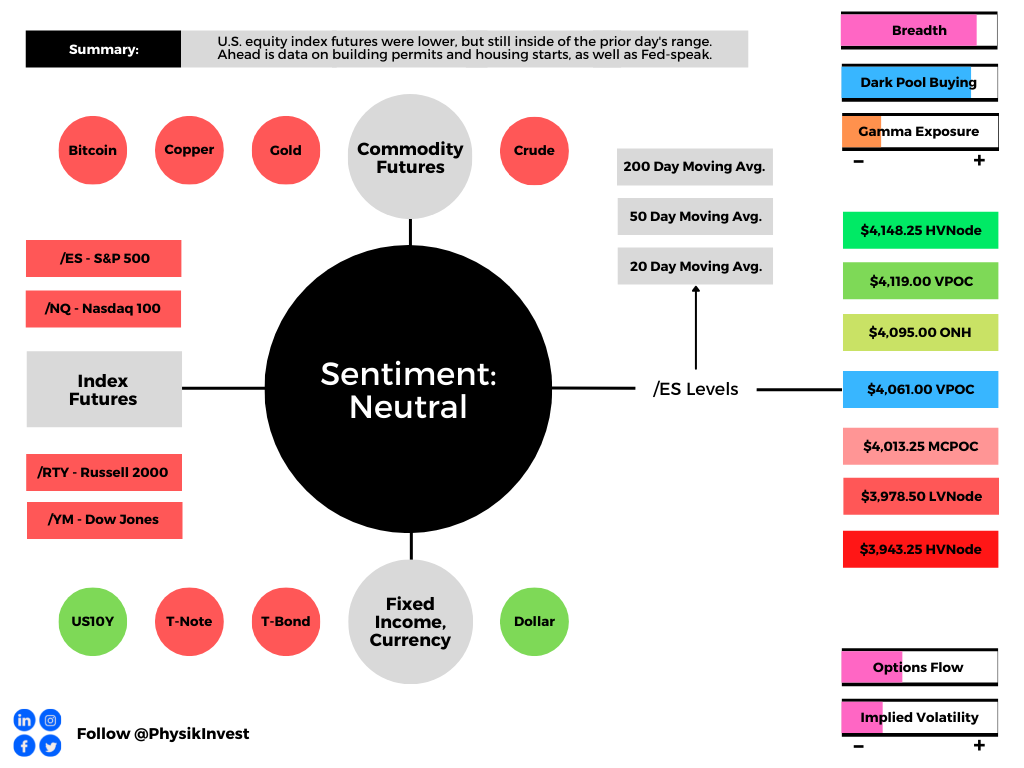
Graphic updated 6:45 AM ET. Sentiment Neutral if expected /ES open is inside of the prior day’s range. /ES levels are derived from the profile graphic at the bottom of the following section. Levels may have changed since initially quoted; click here for the latest levels. SqueezeMetrics Dark Pool Index (DIX) and Gamma (GEX) calculations are based on where the prior day’s reading falls with respect to the MAX and MIN of all occurrences available. A higher DIX is bullish. At the same time, the lower the GEX, the more (expected) volatility. Learn the implications of volatility, direction, and moneyness. SHIFT data used for S&P 500 (INDEX: SPX) options activity. Note that options flow is sorted by the call premium spent; if more positive, then more was spent on call options. Breadth reflects a reading of the prior day’s NYSE Advance/Decline indicator. VIX reflects a current reading of the CBOE Volatility Index (INDEX: VIX) from 0-100.

What To Expect

Fundamental: If you have not already, check out Tuesday’s letter which discussed, in-depth, some of the implications of changing monetary policies, and their impact on markets.

Today’s letter will add to our narrative.

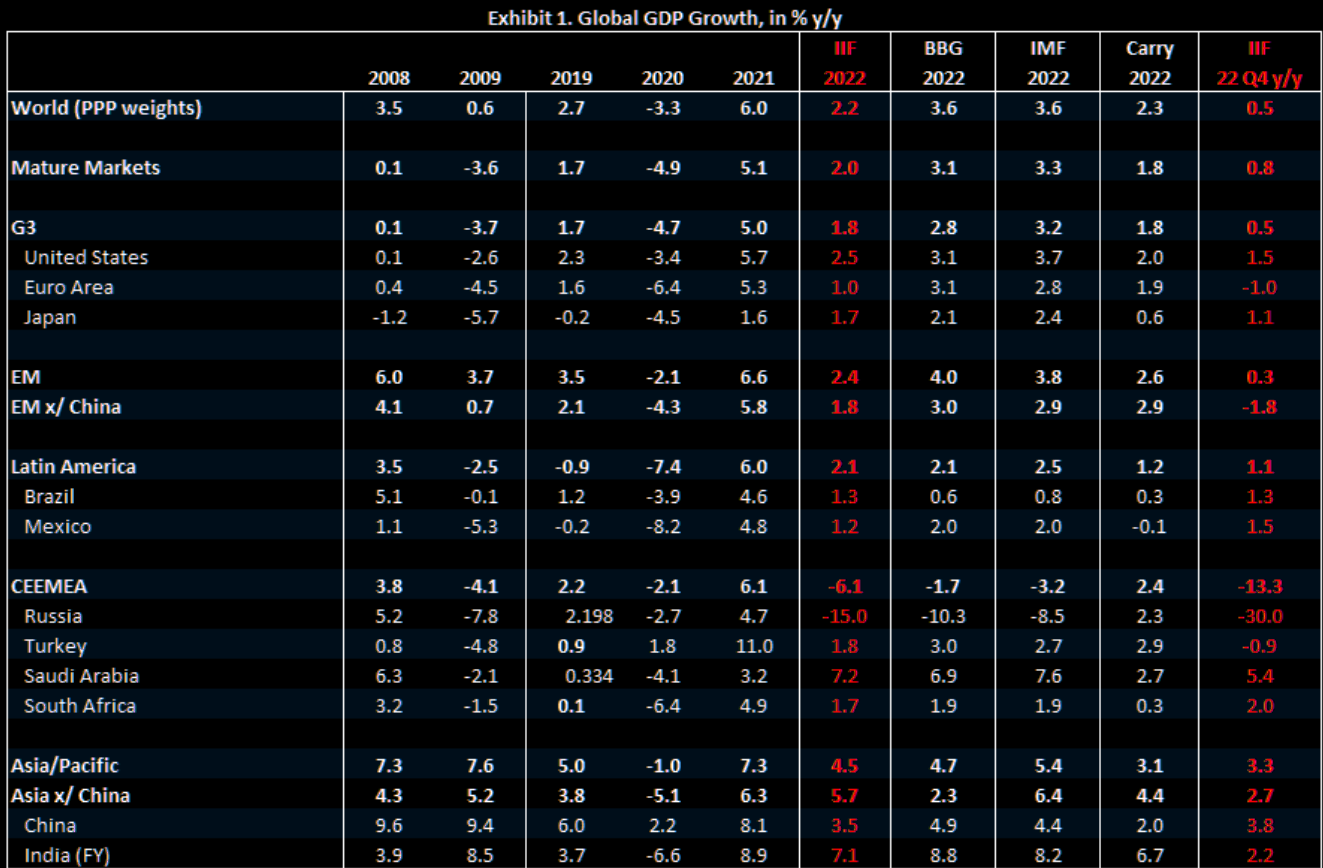
Over the course of a month or so, markets traded marginally lower while research houses have upped their calls for a slowing in the economy or, even, the prospect of a global recession.

So, in the span of a month, the tone changed to “[w]e’re on the brink of global recession.”

Graphic: Via Robin Brooks. Taken from The Market Ear. “Global GDP is flatlining.”

Let’s try to work through some narrative and theory, here.

On March 31, 2022, we unpacked what carry trades are (i.e., the act of borrowing at low rates and investing where there are higher rates to make money so long as nothing [bad] happens), and the implications of their unwind.

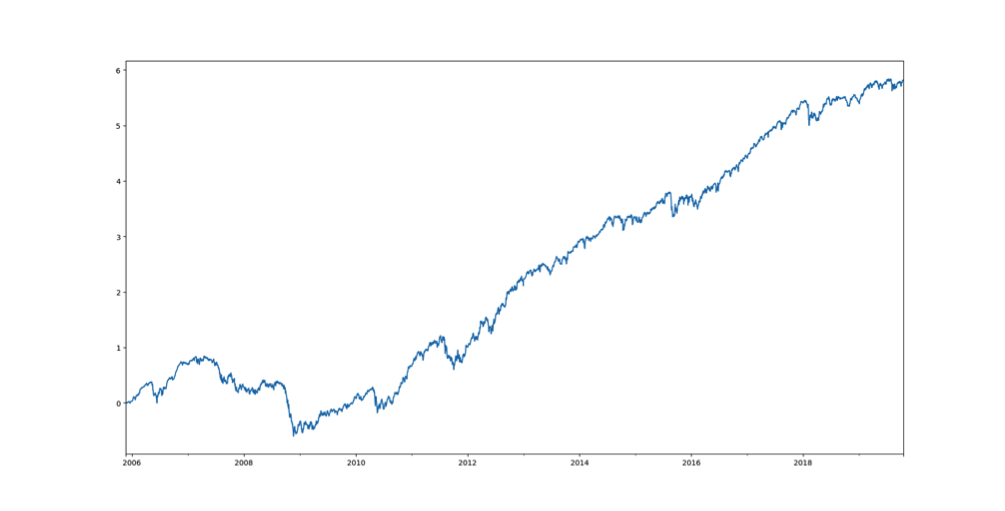
Such strategies are characterized by a sawtooth wave returns pattern (i.e., steady positive returns followed by sharp drops).

Graphic: Via Risky Finance. “Cumulative log returns from shorting the VIX future, a common carry strategy. Notice the poor returns in 2008 and other market crises.”

A great book on this – “The Rise of Carry: The Dangerous Consequences of Volatility Suppression and the New Financial Order of Decay Growth and Recurring Crisis – discusses many of the different forms of carry, their attractiveness, and the implications of their failure.

Further discussed is global monetary policy feeding into the growth and the reinforcement of carry, which has become embedded (or a core force of financial conditions).

Let’s elaborate.

Carry trades often involve leverage and, to avoid losses, these strategies force traders to close positions when positions move against them, buying strength and selling weakness. 

By that token, expansion of carry plays into increased liquidity, which is related to the ease with which credit is obtained and available in the economy, a driver of economic growth and what we talked about yesterday – Planet Palo Alto – over recent business cycles.

Moreover, over the last four decades, monetary policy was a go-to for supporting the economy. Money was sent to capital and that promoted innovation and, by that token, deflation, ultimately creating “a disinterest and unimportance to cash flows.”

In other words, prevailing monetary policies made it easier to borrow and make longer duration bets on ideas with a lot of promise in the future. Central banks underwrote losses of this regime (e.g., post-1998 easing after widening of credit spreads), encouraging continued growth (and innovation). 

Now, there’s a strong commitment to reducing liquidity and credit. 

This has consequences on the real economy and asset prices, accordingly, which rose and kept deflationary pressures at bay.

What we’re getting to basically is the distinction between the economy and financial markets. 

This distinction has blurred. 

As the book explains, U.S. market liquidity, as well as the U.S. dollar’s role as a global reserve currency, makes the U.S. markets and S&P 500 at the center of the global carry regime.

A stock market drop is both a recession and a direct reflection of the unwind of carry. It is the manifestation of a deflationary shock, and today’s sentiment reflects this.

Graphic: Via Bloomberg. “[M]ore fund managers are worried about systemic financial risks than at any previous time in the survey’s history — which stretches back to before the GFC.”

So, what? 

Yesterday, we quoted Elon Musk saying the U.S. was facing a tough recession. This is on the heels of a large “misallocation of capital,” he says, by the government printing “a zillion amount of more money than it had,” which ultimately played into price instabilities we’re seeing today.

“The Fed has a mandate, which is completely unreasonable — to control price stability,” Kai Volatility’s Cem Karsan explains.

“With supply-side economics, the only way that they can control this ultimately is to pull back. And slow capital markets decrease via the wealth effect. Ultimately, there’s a significant lag, so they are not in a position to ultimately control inflation without bringing down markets.”

Graphic: Via Bloomberg. Taken from the Weekly S&P 500 ChartStorm. “Financial conditions are rapidly and drastically tightening (= bad [for] stocks).” 

“Unfortunately for the Fed, the U.S. economic growth rate is already decelerating,” Lyn Alden of Lyn Alden Investment Strategy adds. To cut inflation, the Fed must reduce demand for goods, and this is recessionary (just as “Walmart Inc [NYSE: WMT] and Target Corporation [NYSE: TGT] are feeling the effect of the stretched consumer,” per Bloomberg).

Graphic: Via Andreas Steno Larsen. “Demand destruction in one chart. Retail sales before and after inflation adjustments.”

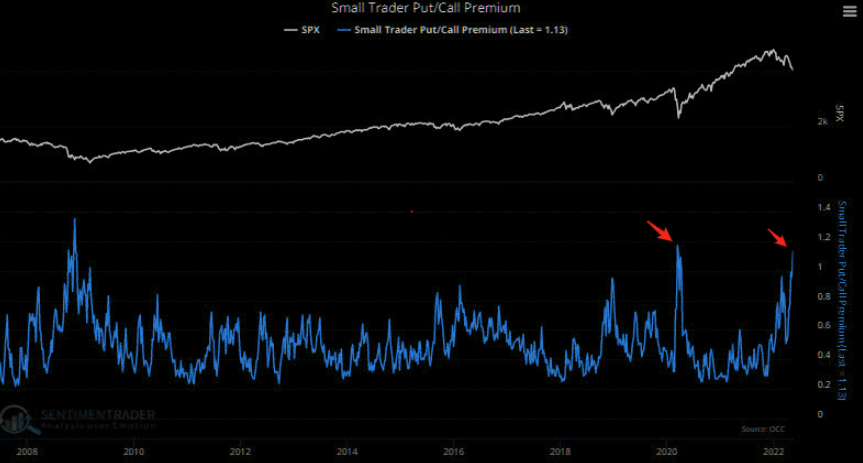
Positioning: Participants legged into protective put options.

Graphic: Via Sentimentrader. Taken from The Market Ear.

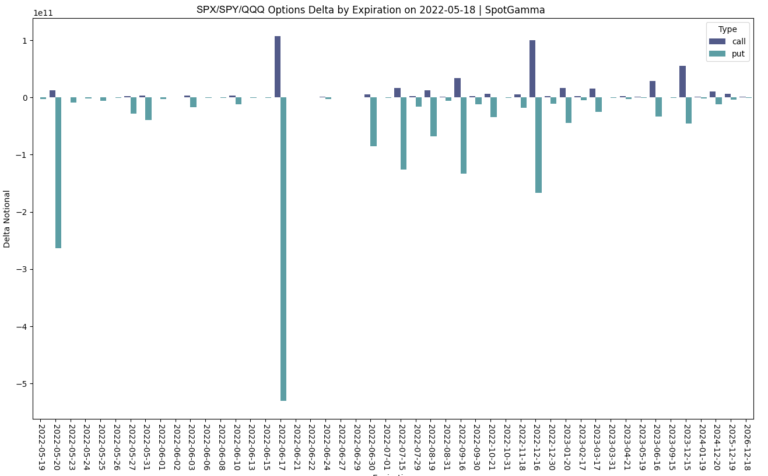
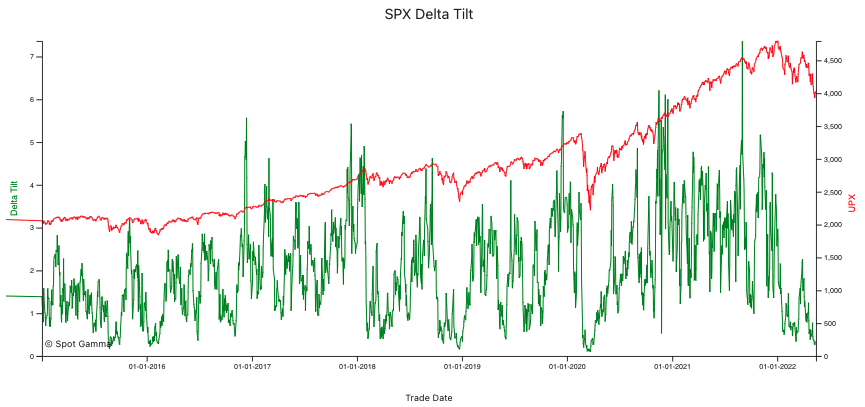
As talked about before, with this stretched positioning, liquidity providers had a lot of synthetic exposure to the upside (positive delta) and asymmetric losses to the downside (negative gamma). To hedge, underlyings were sold. 

Graphic: Via SpotGamma. Total call delta to put delta for all expirations. Participants are concentrated in puts.

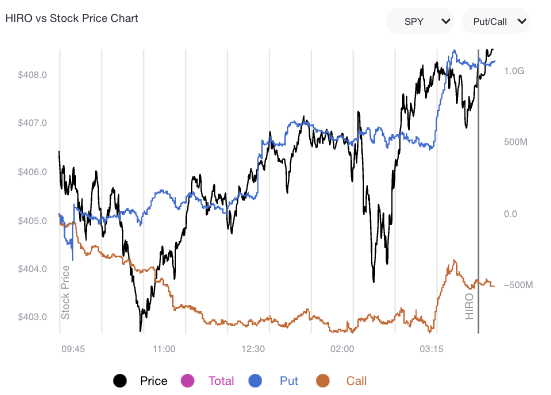
As markets rise, and that particular options exposure decays, the pressure these liquidity providers must add, softens. That’s what we’ve been seeing over the past few sessions.

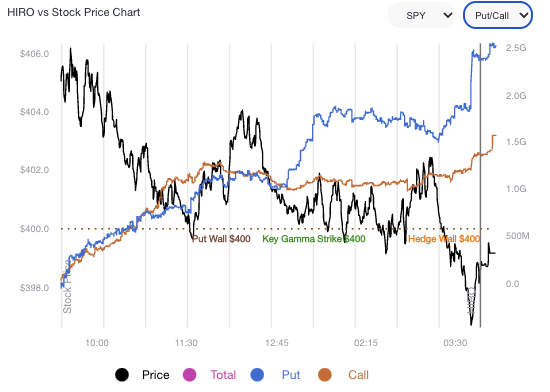
Graphic: Via SpotGamma’s Hedging Impact of Real-Time Options (HIRO) indicator for the SPDR S&P 500 ETF Trust (NYSE: SPY) reveals strong put selling and light call selling. This plays into a reduction in the liquidity providers’ negative gamma exposure and is a positive.

If participants were to continue trading in this manner, that may offer markets additional support. Notwithstanding, this activity likely does little to disrupt the balance of trade heading into and around the May 2022 options expiration (OPEX). 

Into that event, we expect delta hedging flows with respect to changes in time (charm), mainly, and volatility (vanna) to provide an added boost. However, with volatility coming in from lower levels, SpotGamma says, there’s not as much “stored energy to catalyze a rally.”

Instead, SpotGamma adds, “[o]ur fear, here, is that, fundamentally, markets are weak and the May OPEX opens the door for lower lows as some of the ‘max put’ positioning is cleared and markets succumb to the remaining negative gamma positioning.”

Technical: As of 6:30 AM ET, Wednesday’s regular session (9:30 AM – 4:00 PM ET), in the S&P 500, will likely open in the lower part of a negatively skewed overnight inventory, inside of prior-range and -value, suggesting a limited potential for immediate directional opportunity.

In the best case, the S&P 500 trades higher; activity above the $4,061.00 untested point of control (VPOC) puts in play the $4,095.00 overnight high (ONH). Initiative trade beyond the ONH could reach as high as the $4,119.00 VPOC and $4,148.25 high volume area (HVNode), or higher.

In the worst case, the S&P 500 trades lower; activity below the  $4,061.00 VPOC puts in play the $4,013.25 micro composite point of control (MCPOC). Initiative trade beyond the MCPOC could reach as low as the $3,978.50 low volume area (LVNode) and $3,943.25 HVNode, or lower.

Click here to load today’s key levels into the web-based TradingView charting platform. Note that all levels are derived using the 65-minute timeframe. New links are produced, daily.
Graphic: 65-minute profile chart of the Micro E-mini S&P 500 Futures.

Definitions

Overnight Rally Highs (Lows): Typically, there is a low historical probability associated with overnight rally-highs (lows) ending the upside (downside) discovery process.

Volume Areas: A structurally sound market will build on areas of high volume (HVNodes). Should the market trend for long periods of time, it will lack sound structure, identified as low volume areas (LVNodes). LVNodes denote directional conviction and ought to offer support on any test. 

If participants were to auction and find acceptance into areas of prior low volume (LVNodes), then future discovery ought to be volatile and quick as participants look to HVNodes for favorable entry or exit.

POCs: POCs are valuable as they denote areas where two-sided trade was most prevalent in a prior day session. Participants will respond to future tests of value as they offer favorable entry and exit.

MCPOCs: POCs are valuable as they denote areas where two-sided trade was most prevalent over numerous day sessions. Participants will respond to future tests of value as they offer favorable entry and exit.

About

After years of self-education, strategy development, mentorship, and trial-and-error, Renato Leonard Capelj began trading full-time and founded Physik Invest to detail his methods, research, and performance in the markets.

Capelj also develops insights around impactful options market dynamics at SpotGamma and is a Benzinga reporter.

Some of his works include conversations with ARK Invest’s Catherine Wood, investors Kevin O’Leary and John Chambers, FTX’s Sam Bankman-Fried, Kai Volatility’s Cem Karsan, The Ambrus Group’s Kris Sidial, among many others. 

Disclaimer

In no way should the materials herein be construed as advice. Derivatives carry a substantial risk of loss. All content is for informational purposes only.

Categories
Commentary

Daily Brief For May 17, 2022

The daily brief is a free glimpse into the prevailing fundamental and technical drivers of U.S. equity market products. Join the 300+ that read this report daily, below!

What Happened

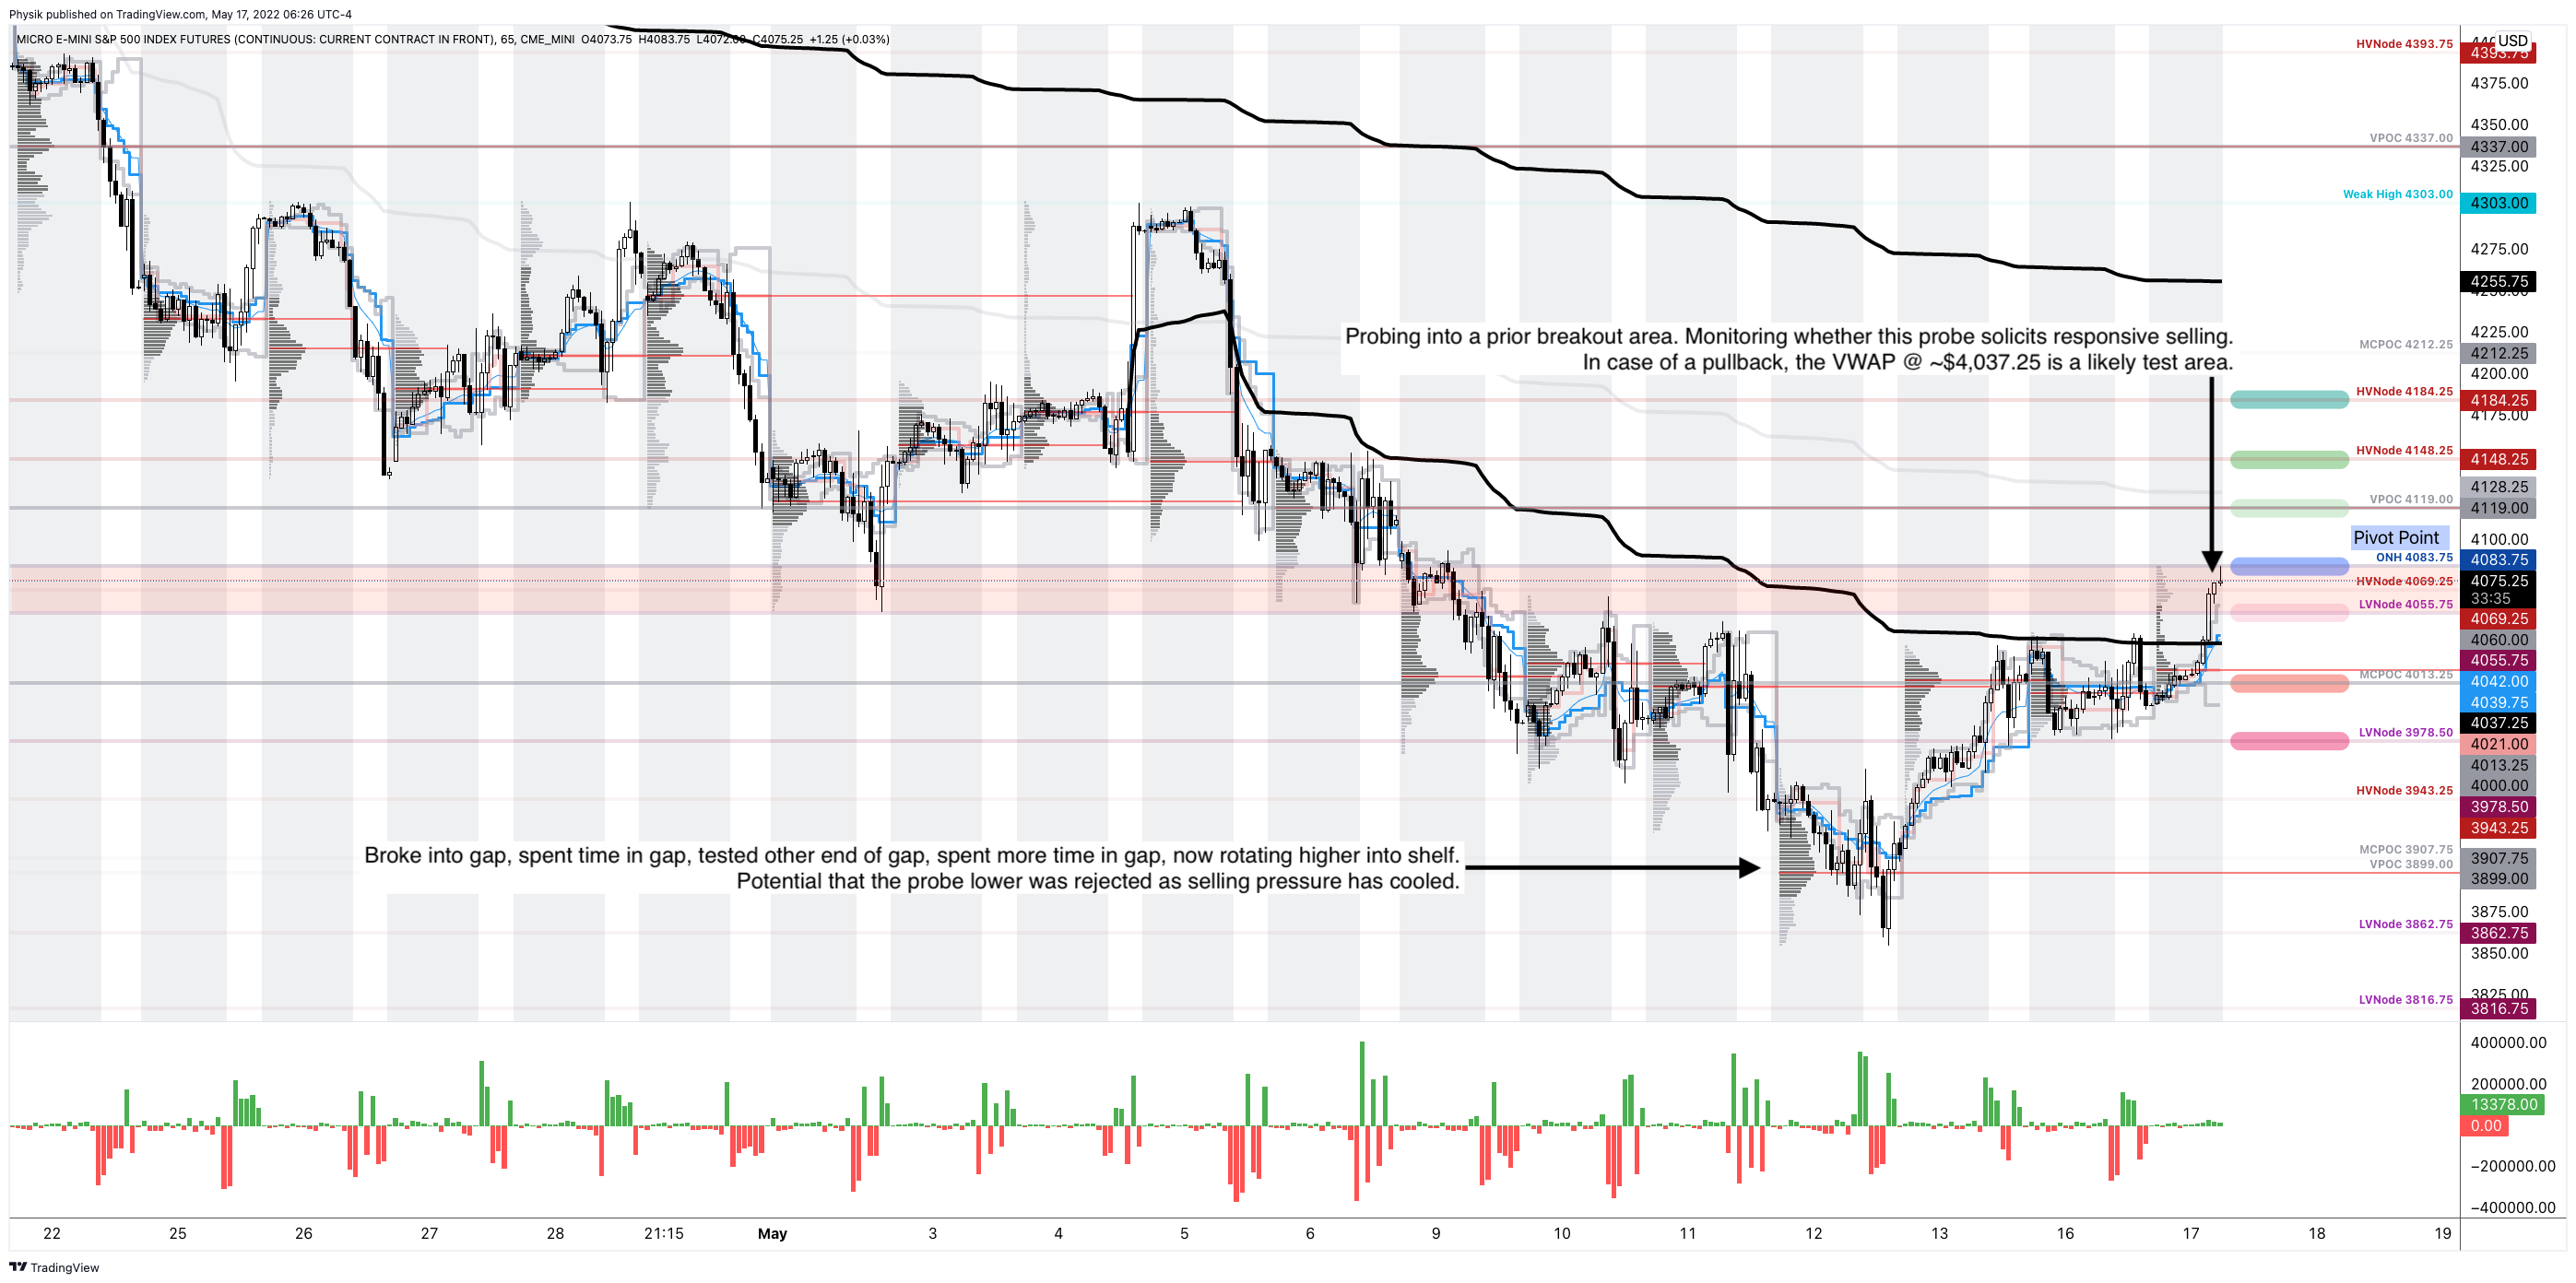
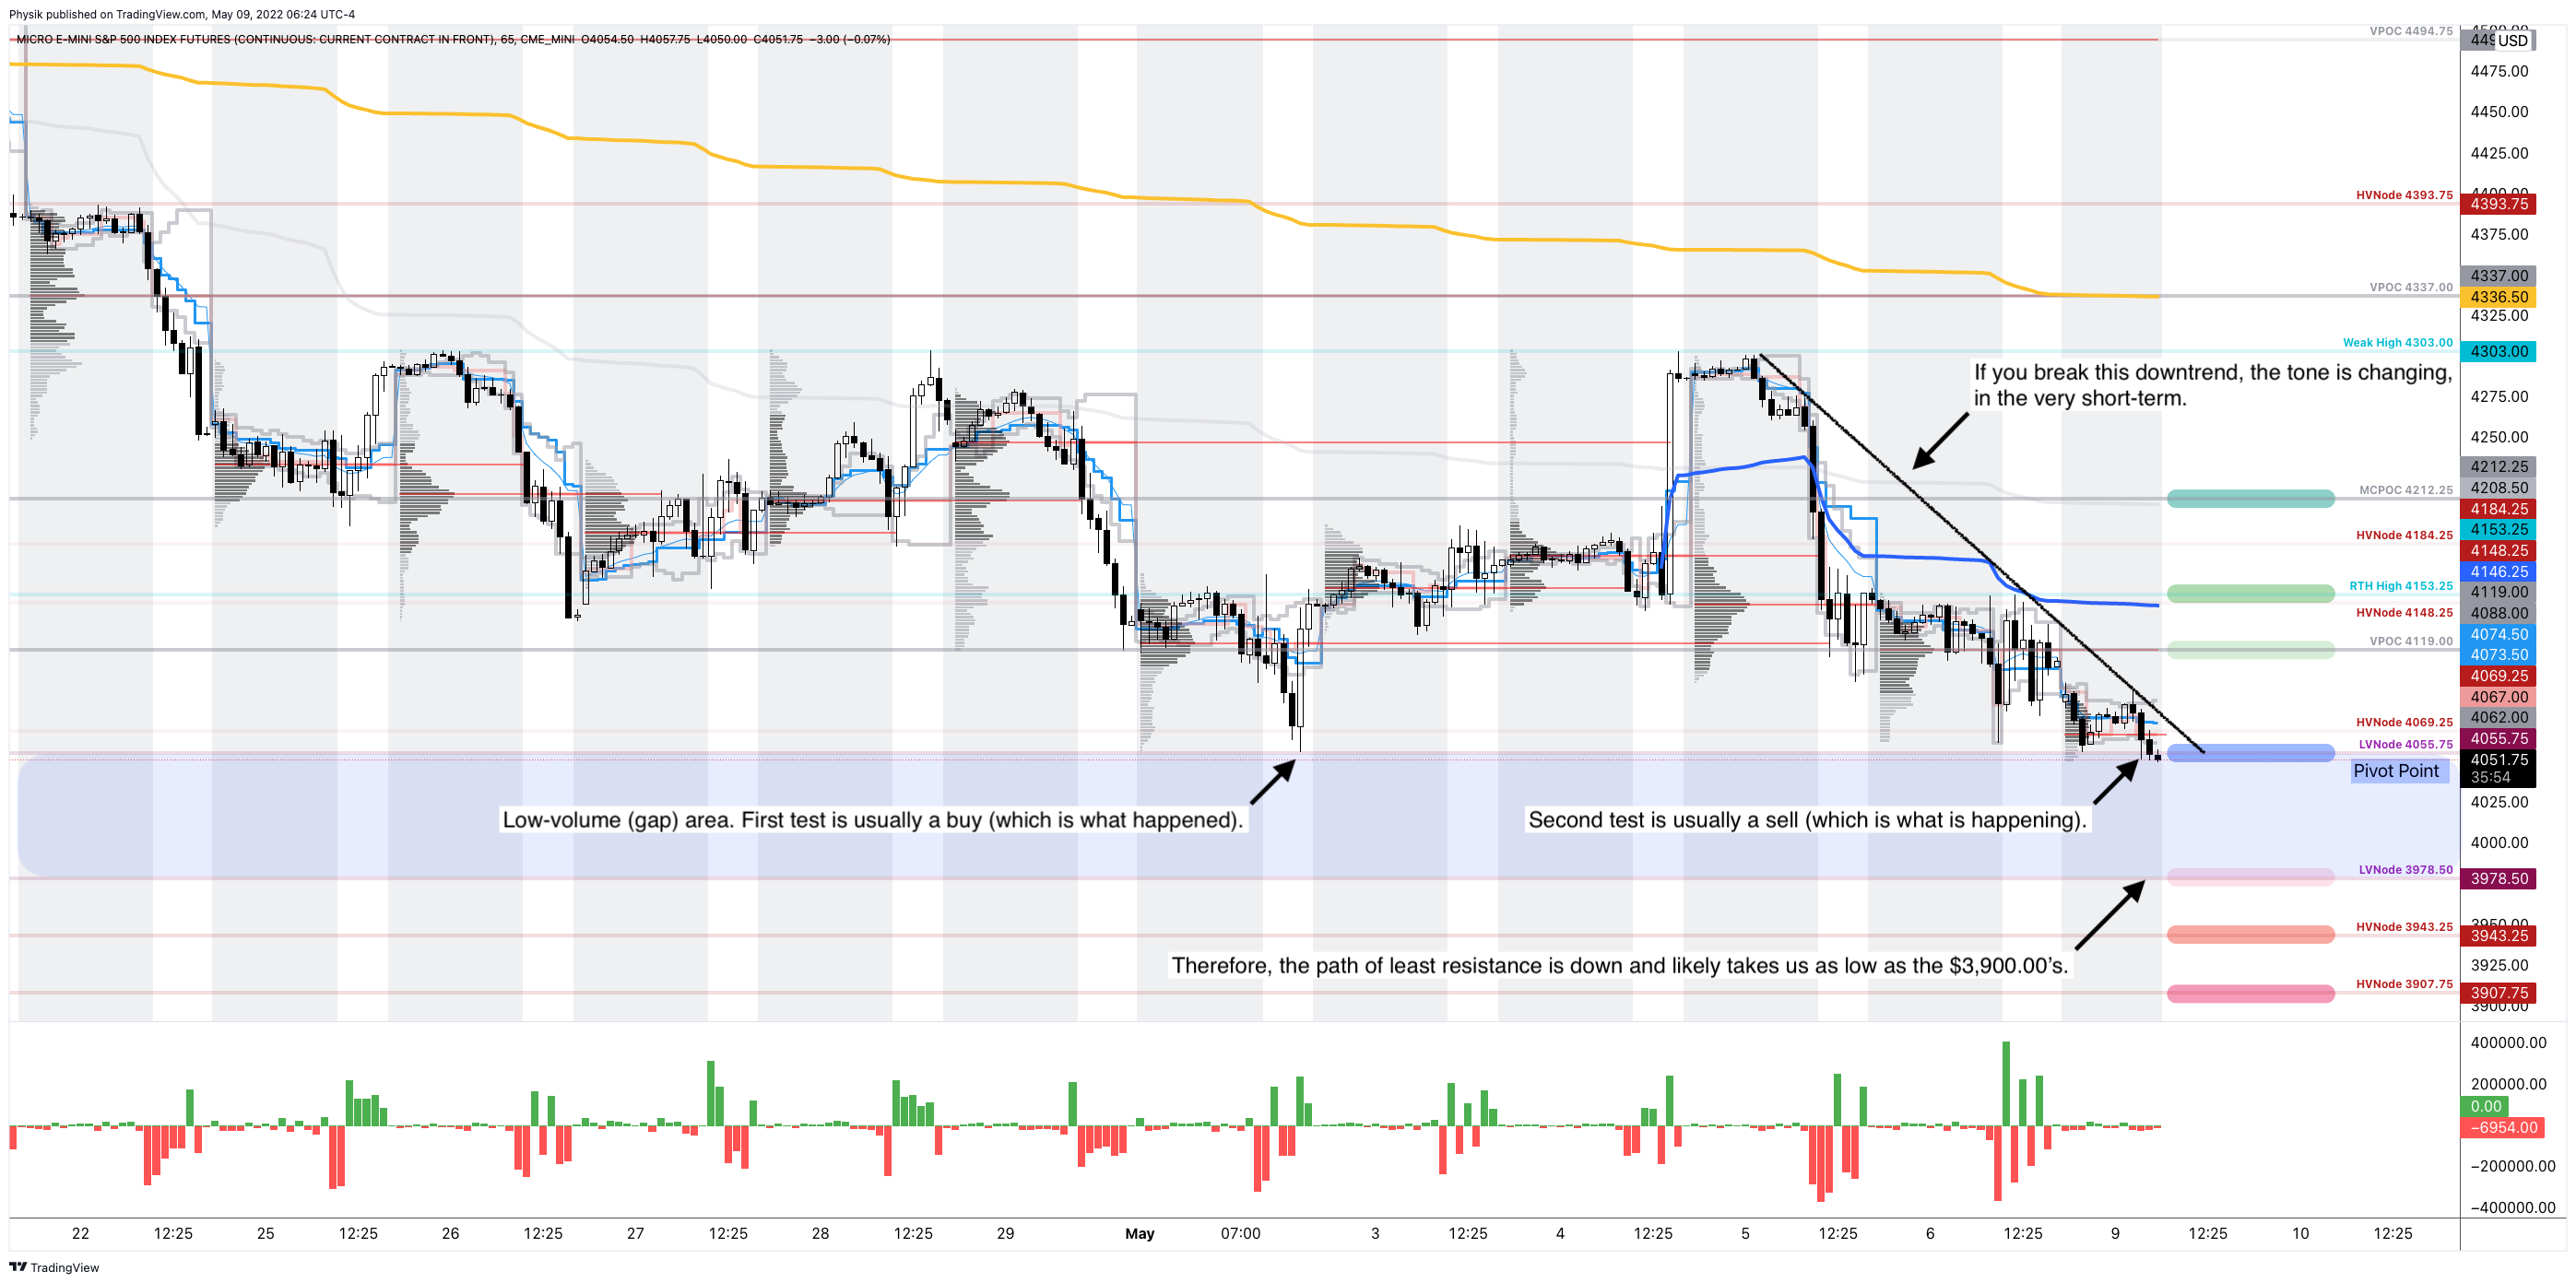
Overnight, equity index futures were higher. The S&P 500, in particular, probed the high end of the low-volume (gap) area it broke into on May 9, 2022.

The key is to monitor whether the S&P 500 is able to sustain the prices it discovered overnight. If so, then the odds that participants are, indeed, hammering out a bottom are heightened.

Ahead is data on retail sales (8:30 AM ET), industrial production and capacity utilization (9:15 AM ET), the NAHB home builders’ index, and business inventories (10:00 AM ET).

Fed-speak is scattered. At 9:15 AM ET, the Philadelphia Fed’s Patrick Harker speaks on health care. At 2:00 PM ET, Fed Chair Jerome Powell is interviewed by the WSJ. At 2:30 PM ET, the Cleveland Fed’s Loretta Mester talks at an inflation conference. And, lastly, at 6:45 PM ET, the Chicago Fed’s Charles Evans speaks.

Graphic updated 6:50 AM ET. Sentiment Risk-On if expected /ES open is above the prior day’s range. /ES levels are derived from the profile graphic at the bottom of the following section. Levels may have changed since initially quoted; click here for the latest levels. SqueezeMetrics Dark Pool Index (DIX) and Gamma (GEX) calculations are based on where the prior day’s reading falls with respect to the MAX and MIN of all occurrences available. A higher DIX is bullish. At the same time, the lower the GEX, the more (expected) volatility. Learn the implications of volatility, direction, and moneyness. SHIFT data used for S&P 500 (INDEX: SPX) options activity. Note that options flow is sorted by the call premium spent; if more positive, then more was spent on call options. Breadth reflects a reading of the prior day’s NYSE Advance/Decline indicator. VIX reflects a current reading of the CBOE Volatility Index (INDEX: VIX) from 0-100.

What To Expect

Fundamental: Out of all the news, it was noteworthy when Elon Musk broke with the prevailing opinion to declare the U.S. was facing a tough recession that would last up to 18 months. 

This is on the heels of a large “misallocation of capital,” he says, caused by the government printing “a zillion amount of more money than it had.”

Musk cautioned companies to watch their costs and cash flows, the latter of which we talked on the importance of in cycles where monetary conditions are tighter and there is less money to be had for corporates who are taking “the long view” and “competing on eyeballs and growth,” per Kai Volatility’s Cem Karsan who this letter’s writer spoke with last summer.

As Karsan puts it, over the last four decades, monetary policy was a go-to for supporting the economy. Money was sent to capital and that promoted deflation, ultimately creating “a disinterest and unimportance to cash flows.”

“Monetary policy has a velocity of almost zero, it goes directly to ‘Planet Palo Alto,’ and Palo Alto creates new technologies,” Moontower’s Kris Abdelmesih puts well in a summary of Karsan’s macro thesis.

“They’re sophisticated, futuristic people. They provide new self-driving cars and things getting delivered to your doorstep. They create supply … [and] does not increase demand. And so it is deflationary.”

Over the last years, in light of talk to address increasing inequality, money was sent to labor, so to speak, and that promoted inflation.

Moreover, today’s contractionary monetary policy is a blunt tool and is not equipped to “address the main problem which is a lack of supply to absorb the demand.”

Please read Moontower’s full write-up, here.

That’s sort of in accordance with comments we quoted Credit Suisse Group AG’s (NYSE: CS) Zoltan Pozsar making, yesterday. Essentially, “the Fed is pursuing demand destruction through negative wealth effects,” as the “central banks can only deal with nominal” chokepoints.

By that token, we must “[c]onsider at least the possibility that the extreme volatility and lack of liquidity [we] see in markets is by design, and the Fed will not be deterred by it, but rather that it will be emboldened by it in its singular pursuit of price stability.”

With even President Biden endorsing the closure of the “wealth window,” Karsan believes corporations will have to worry about making money again.

“These cycles are a lot shorter than the monetary supply-side cycles but they tend to be very bad for multiples and great for economic growth.”

With that in mind, there is no escape. Even the traditional bond-stock relationship – the 60/40 framework – is at risk of being upended.

Graphic: Via Andy Constan of Damped Spring Advisors. “Zero rate hikes in 2023. Clearly, a recession is being priced in.” Per Bloomberg, a Bank of America Corporation (NYSE: BAC) survey puts the Fed put (a pivot) at $3,529.00 in the S&P 500.

Positioning: Measures of implied volatility came in. That’s significant since participants have a lot of exposure to put options.

Further, we see liquidity providers being short those puts. As volatility continues to come in, the exposure of those options to direction (delta) compresses. 

As a result, liquidity providers will taper some of their negative delta short stock and futures hedges to that positive delta put position.

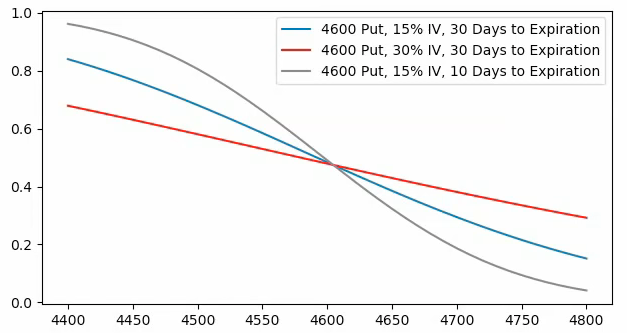
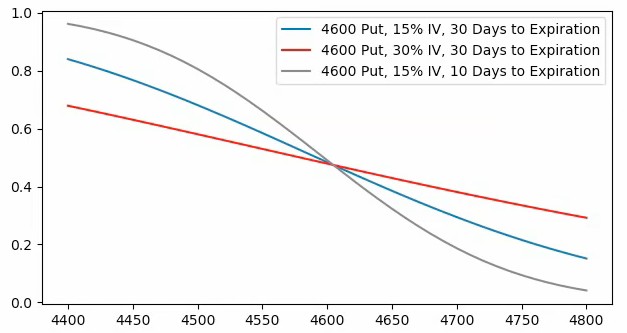
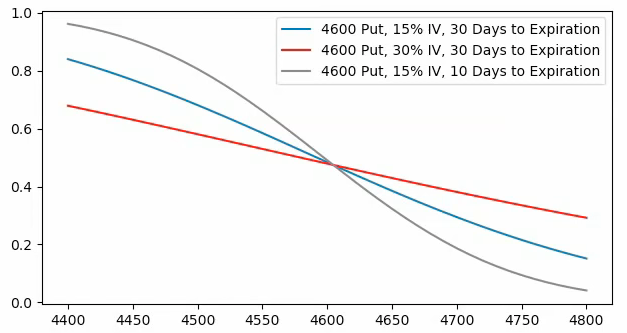
Graphic: Via SpotGamma. “SPX prices X-axis. Option delta Y-axis. When the factors of implied volatility and time change, hedging ratios change. For instance, if SPX is at $4,700.00 and IV jumps 15% (all else equal), the dealer may sell an additional 0.2 deltas to hedge their exposure to the addition of a positive 0.2 delta. The graphic is for illustrational purposes, only.”

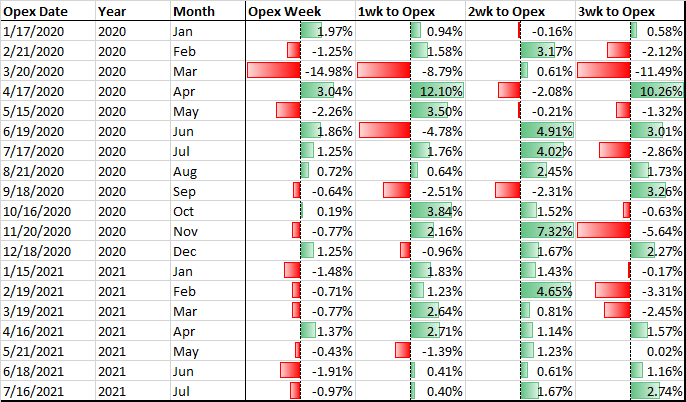
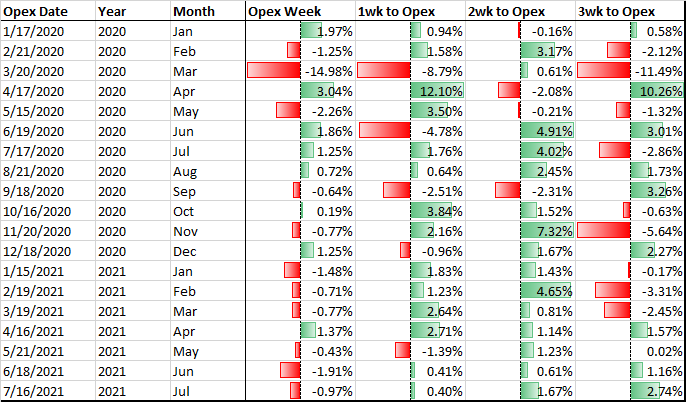
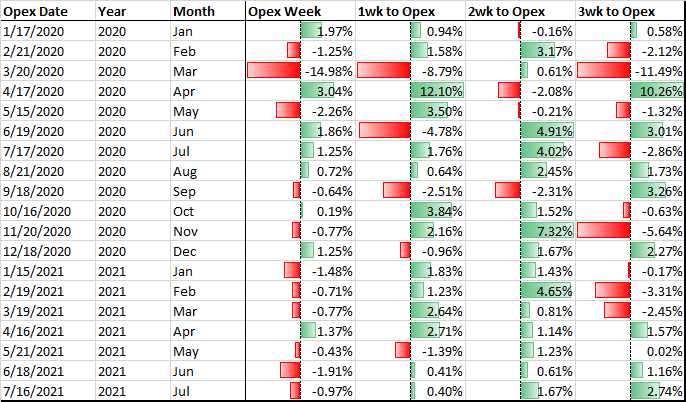
Those delta hedging flows with respect to changes in volatility (vanna) are on top of what has historically been a front-running of the bullish flow associated with the delta decay of options, particularly with respect to time (charm), into options expirations (OPEX). 

Graphic: @pat_hennessy breaks down returns for the S&P 500, categorized by the week relative to OPEX. 

Notwithstanding, though proxies for buying and this hedging of existing options positioning, at the surface, appear to point to positively (skewed) forward returns, we have concern over the level at which from implied volatility is dropping from, and the general divergence between the volatility realized and implied, talked about yesterday.

Basically, as SpotGamma says, there’s not as much “stored energy to catalyze a rally.” 

SqueezeMetrics adds

The Cboe Volatility Index (INDEX: VIX) compressing, while dealer gamma exposure is “more negative than it’s been in years is not how you get sustained rallies–it’s how you get energy for bigger downside moves.”

Therefore, we continue to focus on participating in upside with as little debit risk as possible, via the use of complex strategies, further validated by quoted research.

Graphic: Via Goldman Sachs Group Inc. The VIX’s “high starting point leaves vol high overall, and we like strategies with a short volatility bias, including put selling and 1×2 call spread overlays.”

Technical: As of 6:30 AM ET, Tuesday’s regular session (9:30 AM – 4:00 PM ET), in the S&P 500, will likely open in the upper part of a positively skewed overnight inventory, outside of prior-range and -value, suggesting a potential for immediate directional opportunity.

In the best case, the S&P 500 trades higher; activity above the $4,083.75 overnight high (ONH) puts in play the $4,119.00 untested point of control (VPOC). Initiative trade beyond the VPOC could reach as high as the $4,148.25 and $4,184.25 high volume nodes (HVNodes), or higher.

In the worst case, the S&P 500 trades lower; activity below the $4,083.75 ONH puts in play the $4,055.75 low volume area (LVNode). Initiative trade beyond the LVNode could reach as low as the $4,013.25 micro composite point of control (MCPOC) and $3,978.50 LVNode, or lower.

Click here to load today’s key levels into the web-based TradingView charting platform. Note that all levels are derived using the 65-minute timeframe. New links are produced, daily.
Graphic: 65-minute profile chart of the Micro E-mini S&P 500 Futures.

Considerations: A push-and-pull between the largest of S&P 500 weights.

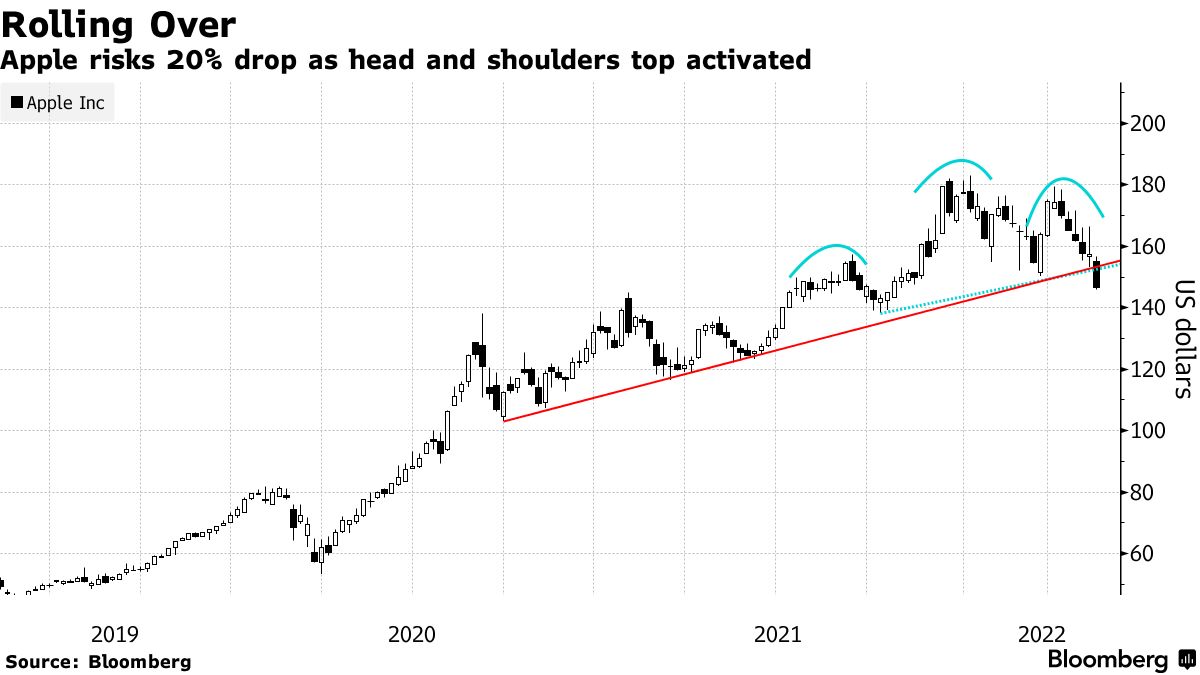
For instance, Apple Inc (NASDAQ: AAPL) is clinging to its prior trend.

Graphic: Via Bloomberg.

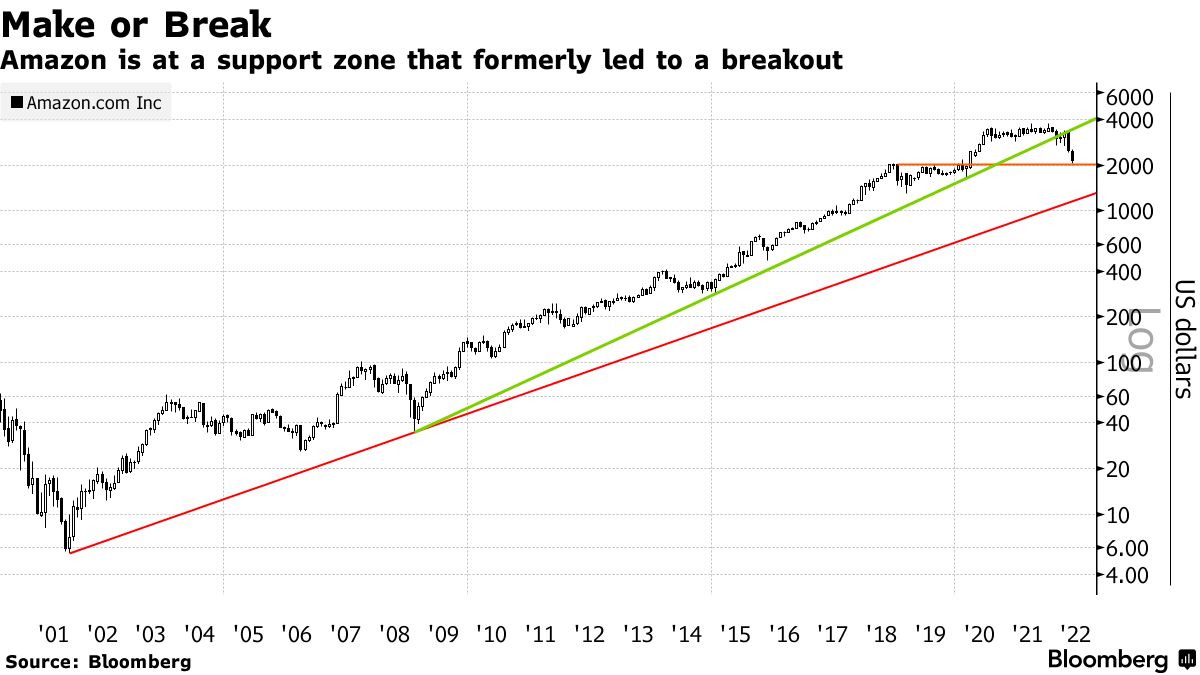
All the while products like Amazon Inc (NASDAQ: AMZN), are trading into key supports.

Graphic: Via Bloomberg.

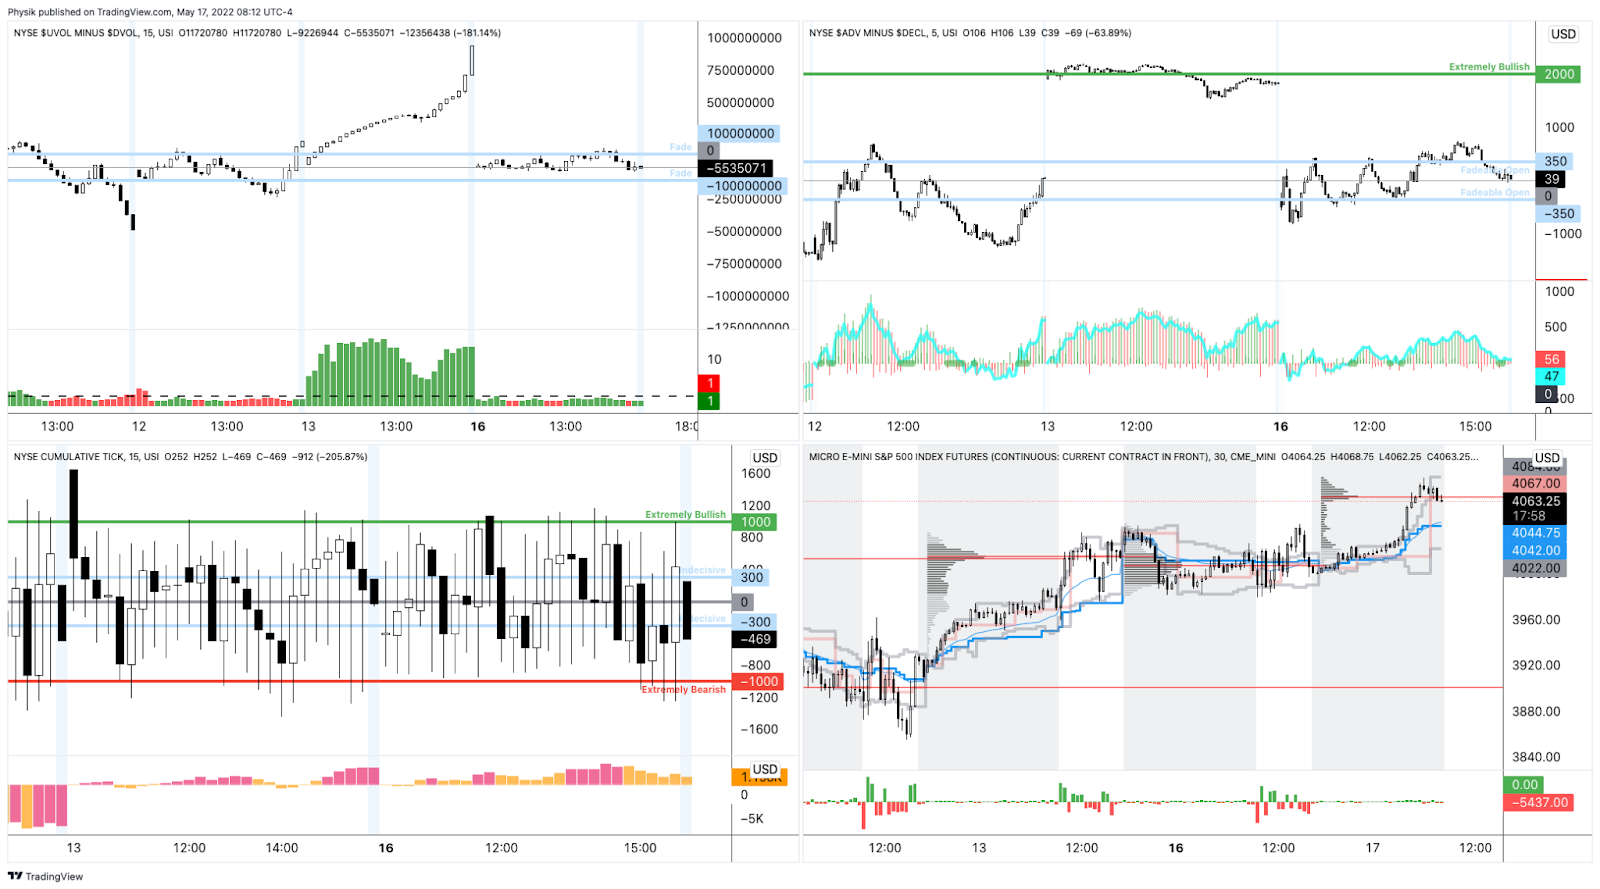
We continue to monitor our market internals and (large) changes in positioning (e.g., open interest builds at higher prices further out in time) that will provide further validation to this most recent S&P 500 reversal.

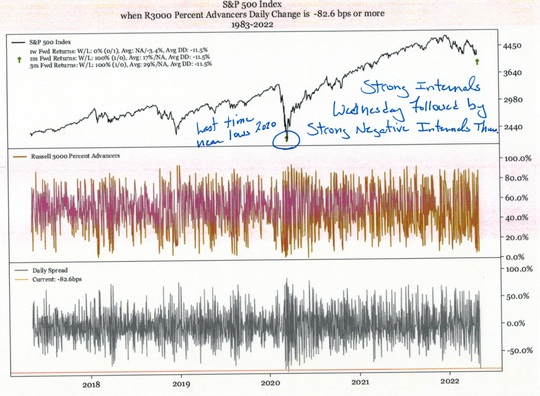
Graphic: Market Internals as pioneered by (a mentor of mine) Peter Reznicek. Current reads of breadth (top charts), in particular, are uninspiring. An advance you do not short has an advance-decline line that’s pegged at +2,000, coupled with a Tick (bottom left) that has trouble closing below 0 for nearly the entirety of a session. Caution.

What People Are Saying

Definitions

Overnight Rally Highs (Lows): Typically, there is a low historical probability associated with overnight rally-highs (lows) ending the upside (downside) discovery process.

Volume Areas: A structurally sound market will build on areas of high volume (HVNodes). Should the market trend for long periods of time, it will lack sound structure, identified as low volume areas (LVNodes). LVNodes denote directional conviction and ought to offer support on any test. 

If participants were to auction and find acceptance into areas of prior low volume (LVNodes), then future discovery ought to be volatile and quick as participants look to HVNodes for favorable entry or exit.

POCs: POCs are valuable as they denote areas where two-sided trade was most prevalent in a prior day session. Participants will respond to future tests of value as they offer favorable entry and exit.

MCPOCs: POCs are valuable as they denote areas where two-sided trade was most prevalent over numerous day sessions. Participants will respond to future tests of value as they offer favorable entry and exit.

About

After years of self-education, strategy development, mentorship, and trial-and-error, Renato Leonard Capelj began trading full-time and founded Physik Invest to detail his methods, research, and performance in the markets.

Capelj also develops insights around impactful options market dynamics at SpotGamma and is a Benzinga reporter.

Some of his works include conversations with ARK Invest’s Catherine Wood, investors Kevin O’Leary and John Chambers, FTX’s Sam Bankman-Fried, Kai Volatility’s Cem Karsan, The Ambrus Group’s Kris Sidial, among many others.

Disclaimer

In no way should the materials herein be construed as advice. Derivatives carry a substantial risk of loss. All content is for informational purposes only.
Categories
Commentary

Daily Brief For May 16, 2022

The daily brief is a free glimpse into the prevailing fundamental and technical drivers of U.S. equity market products. Join the 300+ that read this report daily, below!

What Happened

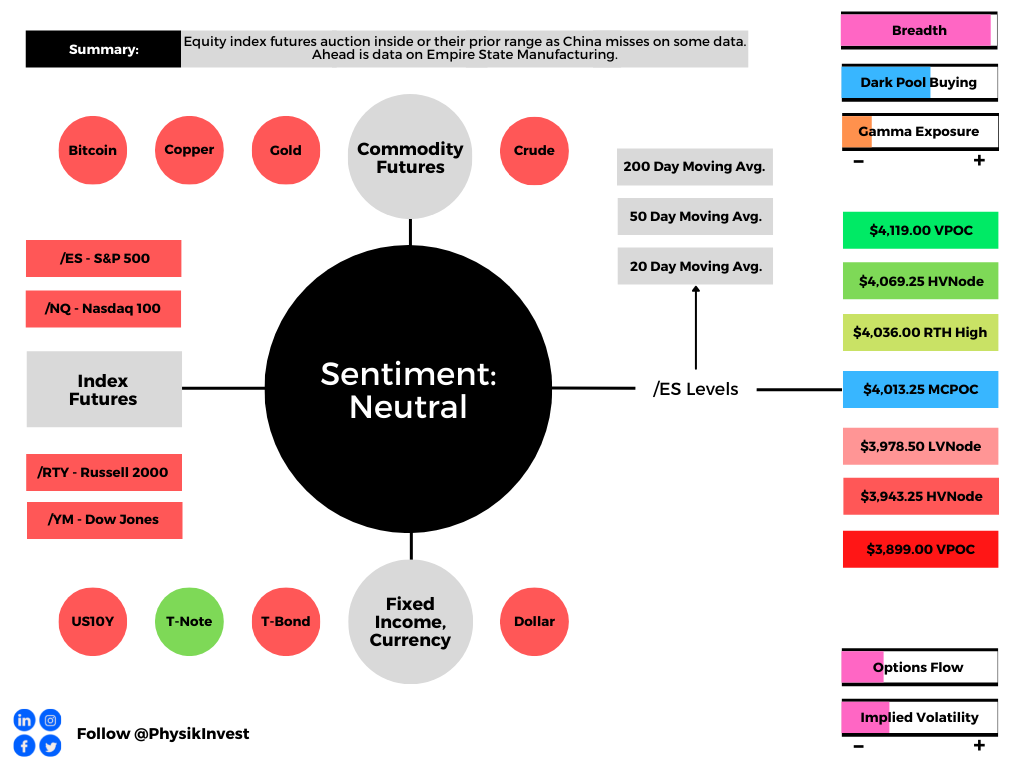
Overnight, equity index futures auctioned lower after a failed attempt to solicit strong buying on a break of Friday’s regular trade high. 

Coincidentally, after a test of an anchored volume-weighted average price level, some measures from China had traders concerned about global growth, and that fed into a risk-off sentiment and probe further into Friday’s range.

Moreover, ahead is data on Empire State Manufacturing (8:30 AM ET).

Today, we add light context to our narratives with an aim to elaborate further in letters later this week. Take care!

Graphic updated 6:45 AM ET. Sentiment Neutral if expected /ES open is inside of the prior day’s range. /ES levels are derived from the profile graphic at the bottom of the following section. Levels may have changed since initially quoted; click here for the latest levels. SqueezeMetrics Dark Pool Index (DIX) and Gamma (GEX) calculations are based on where the prior day’s reading falls with respect to the MAX and MIN of all occurrences available. A higher DIX is bullish. At the same time, the lower the GEX, the more (expected) volatility. Learn the implications of volatility, direction, and moneyness. SHIFT data used for S&P 500 (INDEX: SPX) options activity. Note that options flow is sorted by the call premium spent; if more positive, then more was spent on call options. Breadth reflects a reading of the prior day’s NYSE Advance/Decline indicator. VIX reflects a current reading of the CBOE Volatility Index (INDEX: VIX) from 0-100.

What To Expect

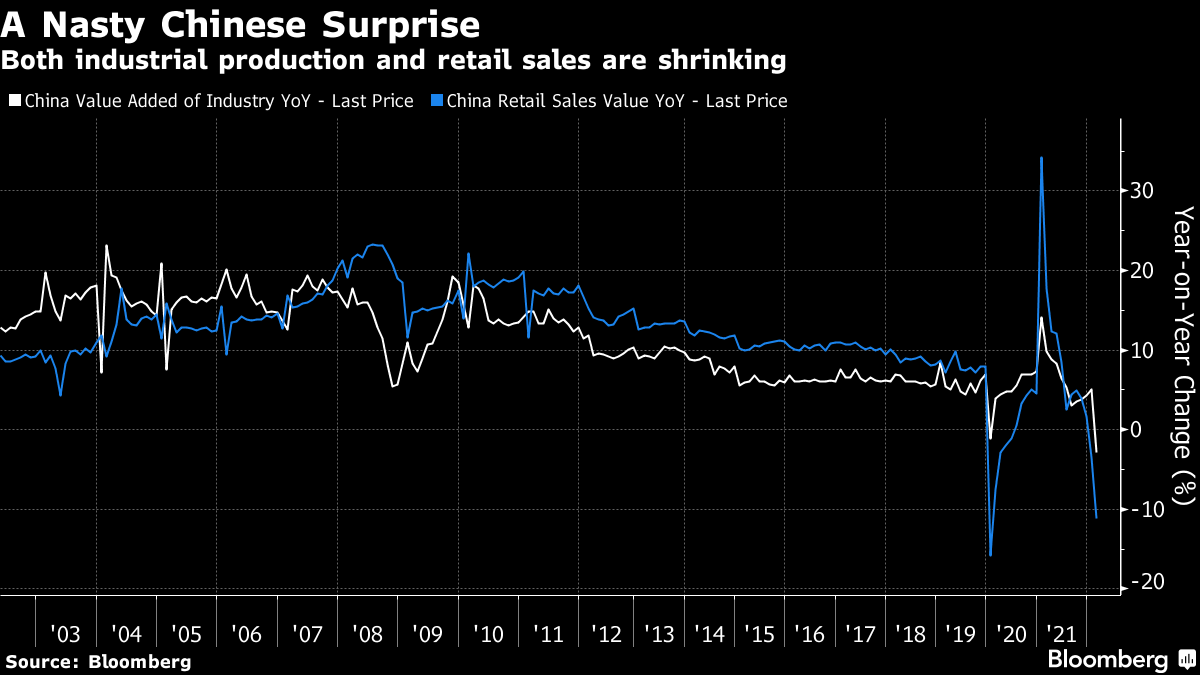
Fundamental: Data from China shows contraction in light of COVID-19 troubles.

Graphic: Via Bloomberg

Bloomberg’s John Authers explains that a contracting China “would be a deflationary force for the rest of the world.”

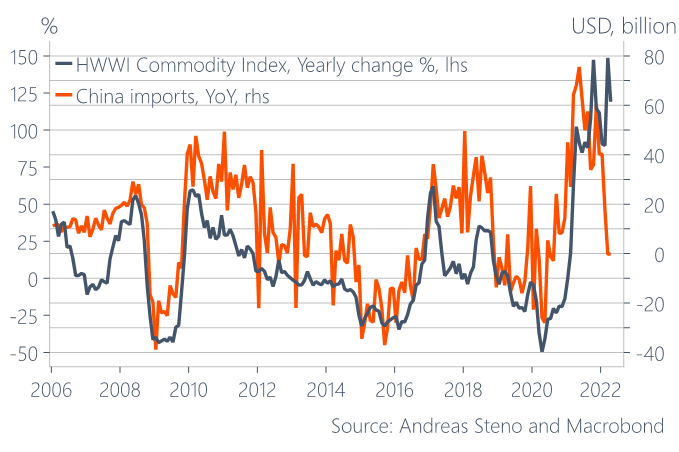
Graphic: Via Stenos Signals. “China imports vs. Commodities – the most important macro chart in the world right now.”

Andreas Steno Larsen, of the Stenos Signals letter, recently talked about this “lack of economic activity in China,” as well as “slowing demand in the West,” both of which are to “lead inflation expectations lower.”

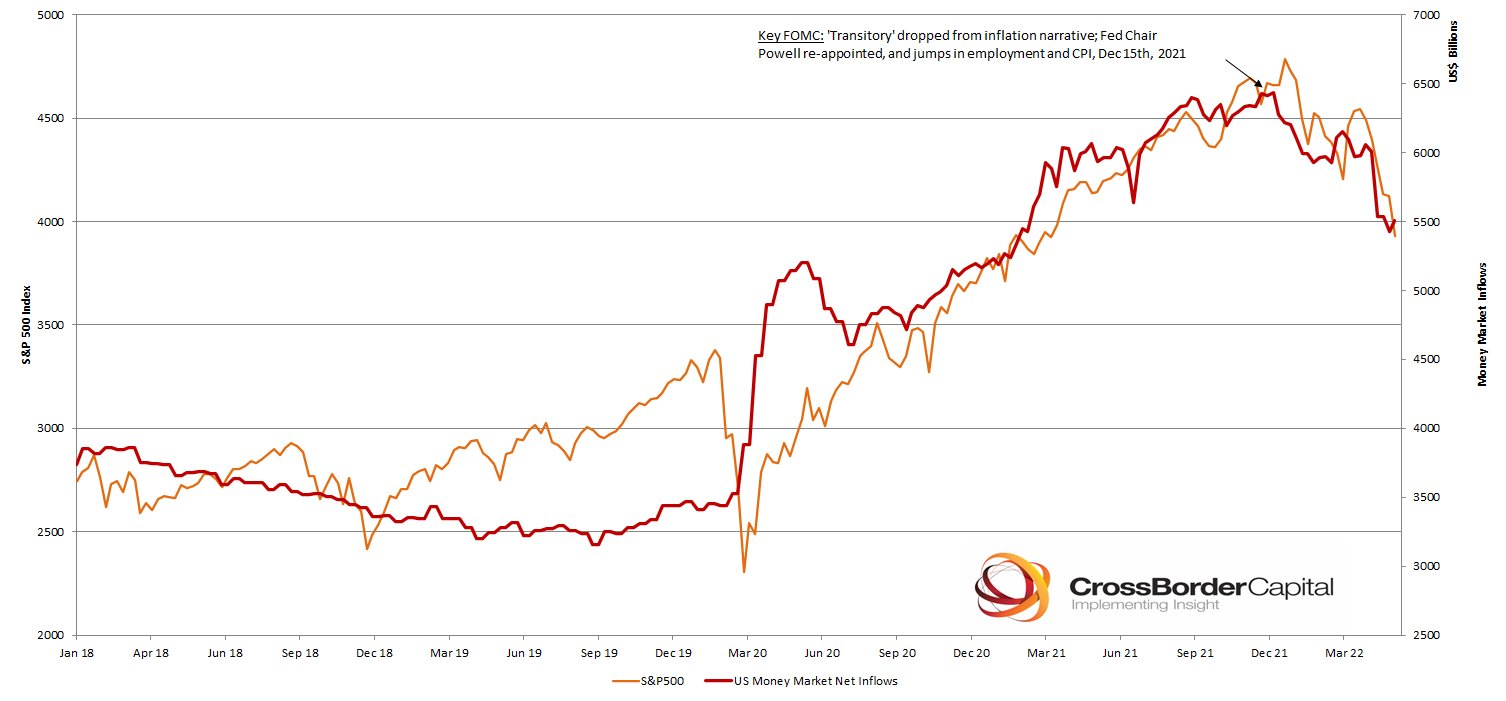
Graphic: Via CrossBorder Capital. “Latest weekly Fed liquidity injections and the S&P 500. Bigger the bull, the harder they fall? Fed trying to crash [the] economy to kill inflation [and] Wall Street is the victim.”

Notwithstanding, the Federal Reserve (Fed) remains on track “to deliver substantial QT and rate hiking,” all the while investors “hold a relatively risk-friendly position in equities and credits.”

Graphic: Via Societe Generale SA (OTC: SCGLY). Taken from The Market Ear.

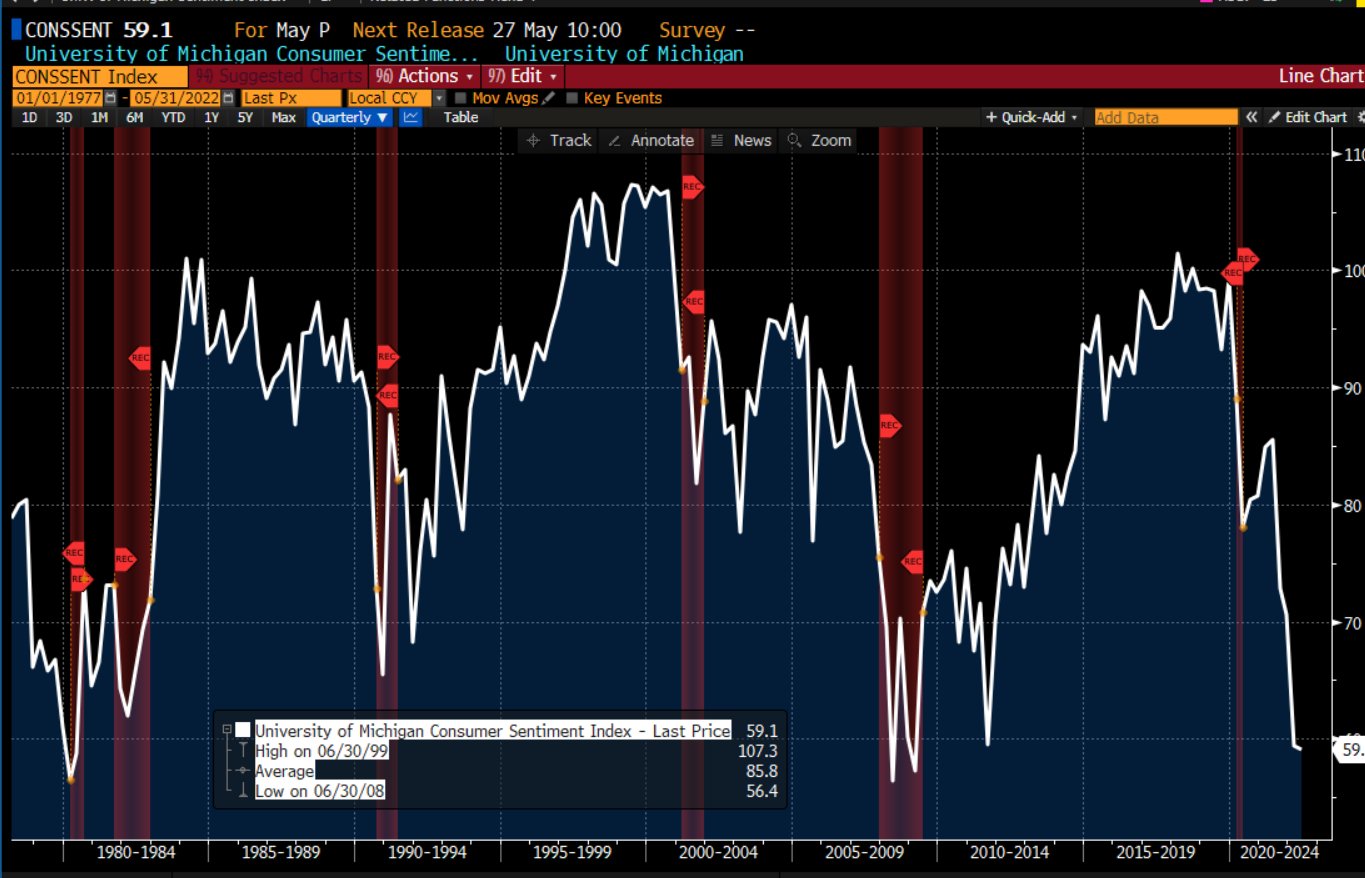
Steno Larsen explains: “That disconnect [between sentiment and exposure to risk] will have to wane before I truly dare to re-add risk asset exposure to my list of recommendations.”

Graphic: Via @TheBondFreak. University of Michigan Sentiment.

Pursuant to that remark, Authers notes that the latest Chinese data emboldens the risks of a recession which Credit Suisse Group AG’s (NYSE: CS) Zoltan Pozsar explains is not enough.

“[T]he risk of recession, whether it is real or merely implied by an inversion of the yield curve, won’t deter the Fed from hiking rates higher faster or from injecting more volatility to build up negative wealth effects, and signs of a recession might not mean immediate rate cuts to ramp demand back up.”

“Rallies could beget more forceful pushback from the Fed – the new game.”

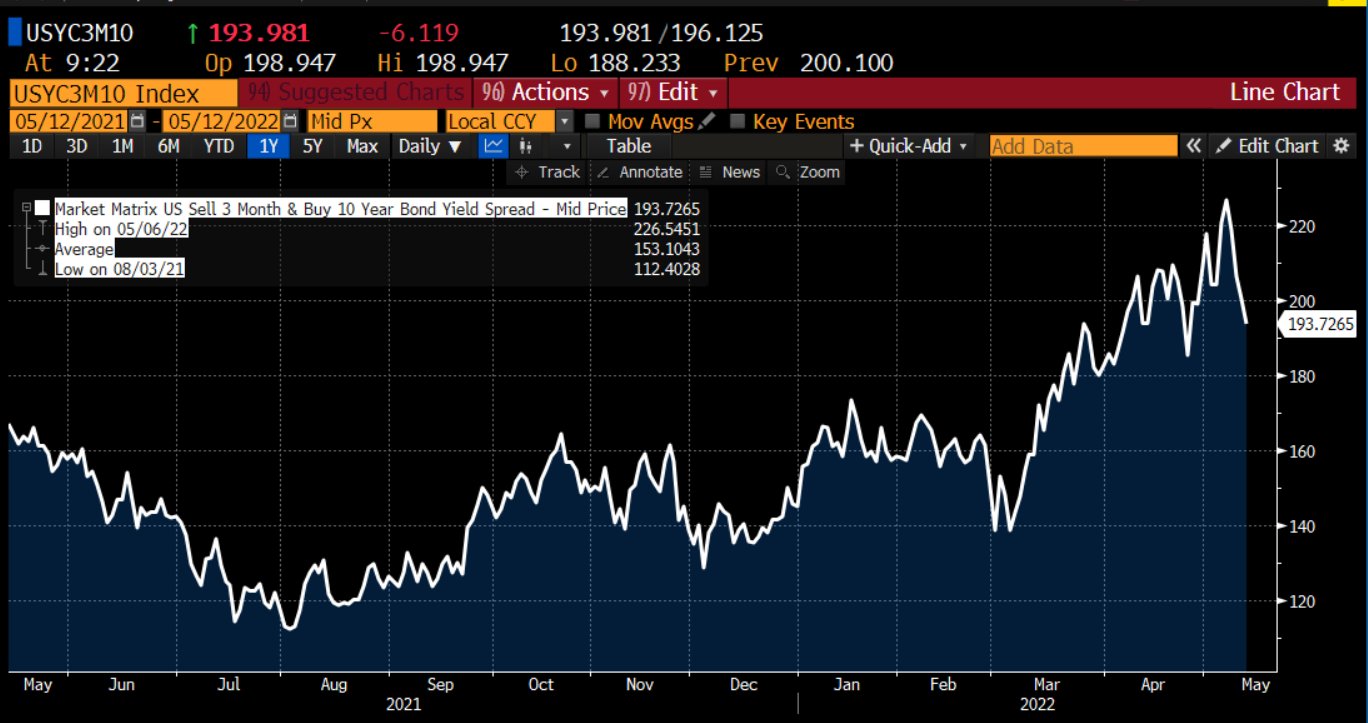
Graphic: Via @TheBondFreak. “2/10s spread has delivered its message. The long end is beginning to trend lower. NOW…it’s time to start watching the 3m/10yr spread, which will likely invert as the Fed continues with its rate hikes to kill demand, cause a recession, but “us” from inflation.”

Per Goldman Sachs Group Inc (NYSE: GS), baseline forecasts assume “no recession” and imply the S&P 500’s P/E ends unchanged at 17x. 

“A recession would see the index fall by 11% to $3,600.00 as the P/E drops to 15x.”

Graphic: Via Goldman Sachs Group Inc. Taken from The Market Ear. A recession brings S&P 500 to $3,600.00.

Positioning: Early on Friday morning, we approached trade too optimistically but, to our credit, we focused on participating with as little risk as possible, via the use of complex strategies, as validated by quoted research.

Graphic: Via Goldman Sachs Group Inc. The VIX’s “high starting point leaves vol high overall, and we like strategies with a short volatility bias, including put selling and 1×2 call spread overlays.”

Heading into Monday’s regular trade, little has changed and indexes are holding well, relative to some constituents.

This is as participants are hedged and volatility markets remain well-supplied, due in part to suppressive volatility selling, as well as passive flows supporting the largest index constituents.

Kai Volatility’s Cem Karsan hypothesizes: “If a meaningful [volatility] event has happened within the last year, participants are more likely to be prepared for the move. So the ‘2nd event’ dramatically underperforms [implied volatility] skew expectations.”

“Take Jan/Feb 2016, Oct-Dec 2018, &…Sep 2020? All these ‘2nd Events’ ended up being as meaningful as their 1st events, if not more, for markets, but were much more orderly [and] accompanied by poor [volatility] performance.”

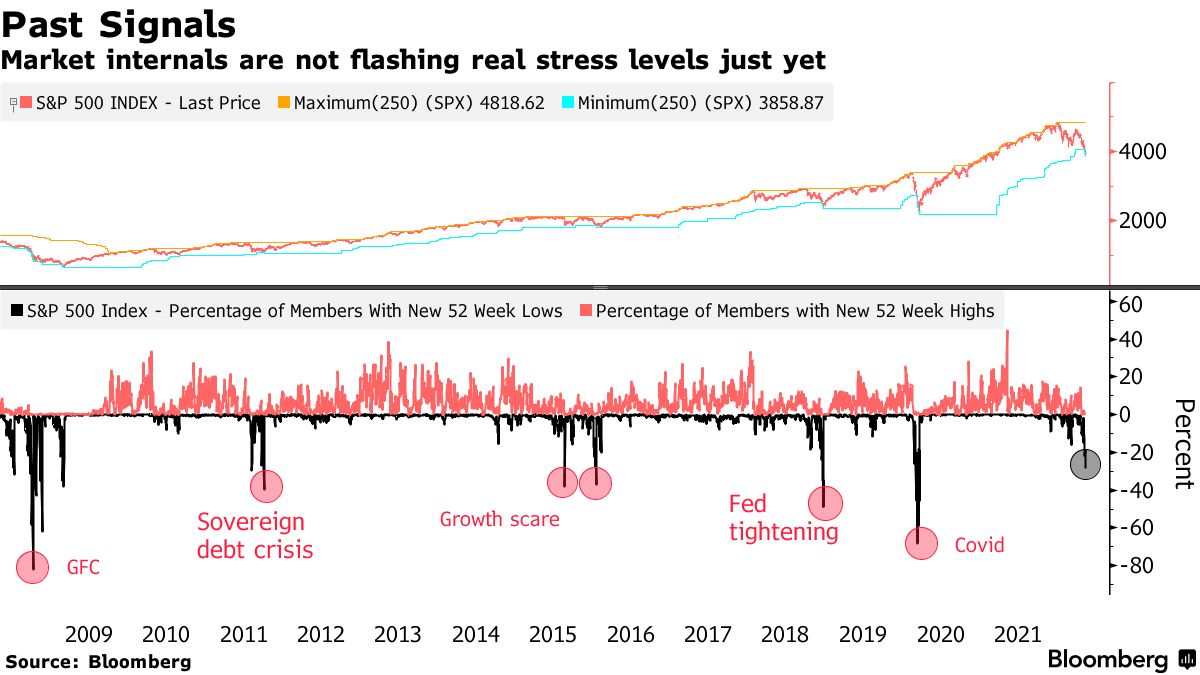
Graphic: Via Bloomberg. “For all the recent declines — the S&P 500 is down more than 13% from its high on March 29 — stress indicators also aren’t at levels seen during comparable slumps. Fewer than 30% of the benchmark’s members have hit a one-year low, compared with nearly 50% during the growth scare in 2018 and 82% during the global financial crisis in 2008.”

Given the aforementioned supply and demand dynamic, we continue to observe “divergence in the volatility (movement of underlying equity market up and down) realized, versus that which is implied by options activity,” SpotGamma says. 

Graphic: Via @HalfersPower. “1 day return distribution when QQQ ROC[1] > 3.7%. Historically you can expect the weakest relative mean forward returns, and second-highest mean realized volatility amongst deciles.”

For “divergences in volatility realized and implied to resolve, it would likely take forced selling. Liquidity providers’ response to demand for protection would, then, likely exacerbate the move and aid in the repricing of volatility to levels where there would be more stored energy to catalyze a rally.”

All else equal, SpotGamma adds, there is no catalyst to rally until the May 20, 2022 options expiration (OPEX). Till then, rallies are subject to failure.

Graphic: Via SqueezeMetrics. Updated May 13, 2022. “VIX compressing to 30 on a modest pre-market rally with dealer gamma exposure more negative than it’s been in years is not how you get sustained rallies—it’s how you get energy for bigger downside moves.”

Technical: As of 6:30 AM ET, Monday’s regular session (9:30 AM – 4:00 PM ET), in the S&P 500, will likely open in the middle part of a negatively skewed overnight inventory, inside of prior-range and -value, suggesting a limited potential for immediate directional opportunity.

In the best case, the S&P 500 trades higher; activity above the $4,013.25 micro composite point of control (MCPOC) puts in play the $4,036.00 regular trade high (RTH High). Initiative trade beyond the $4,069.25 high volume area (HVNode) could reach as high as the HVNode and $4,119.00 untested point of control (VPOC), or higher.

In the worst case, the S&P 500 trades lower; activity below the $4,013.25 MCPOC puts in play the $4,3978.50 low volume area (LVNode). Initiative trade beyond the LVNode could reach as low as the $3,943.25 HVNode and $3,899.00 VPOC, or lower.

Click here to load today’s key levels into the web-based TradingView charting platform. Note that all levels are derived using the 65-minute timeframe. New links are produced, daily.
Graphic: 65-minute profile chart of the Micro E-mini S&P 500 Futures.

Definitions

Volume Areas: A structurally sound market will build on areas of high volume (HVNodes). Should the market trend for long periods of time, it will lack sound structure, identified as low volume areas (LVNodes). LVNodes denote directional conviction and ought to offer support on any test. 

If participants were to auction and find acceptance into areas of prior low volume (LVNodes), then future discovery ought to be volatile and quick as participants look to HVNodes for favorable entry or exit.

POCs: POCs are valuable as they denote areas where two-sided trade was most prevalent in a prior day session. Participants will respond to future tests of value as they offer favorable entry and exit.

MCPOCs: POCs are valuable as they denote areas where two-sided trade was most prevalent over numerous day sessions. Participants will respond to future tests of value as they offer favorable entry and exit.

Volume-Weighted Average Prices (VWAPs): A metric highly regarded by chief investment officers, among other participants, for quality of trade. Additionally, liquidity algorithms are benchmarked and programmed to buy and sell around VWAPs.

About

After years of self-education, strategy development, mentorship, and trial-and-error, Renato Leonard Capelj began trading full-time and founded Physik Invest to detail his methods, research, and performance in the markets.

Capelj also develops insights around impactful options market dynamics at SpotGamma and is a Benzinga reporter.

Some of his works include conversations with ARK Invest’s Catherine Wood, investors Kevin O’Leary and John Chambers, FTX’s Sam Bankman-Fried, Kai Volatility’s Cem Karsan, The Ambrus Group’s Kris Sidial, among many others.

Disclaimer

In no way should the materials herein be construed as advice. Derivatives carry a substantial risk of loss. All content is for informational purposes only.
Categories
Commentary

Daily Brief For May 12, 2022

The daily brief is a free glimpse into the prevailing fundamental and technical drivers of U.S. equity market products. Join the 300+ that read this report daily, below!

What Happened

Overnight, equity index futures auctioned lower, mostly, alongside most commodities and crypto.

Notable is how orderly the selling has been, particularly in the equity space. That’s due in part to suppressive volatility selling, as well as passive flows supporting the largest index constituents.

The fundamental narrative has changed little. Chief among participants’ worries are growth and inflation, the monetary response to the two, as well as chokepoints not limited to supply chains.

Ahead is data on jobless claims and the producer price index (8:30 AM ET), as well as Fed-speak by Mary Daly (4:00 PM ET).

Graphic updated 7:15 AM ET. Sentiment Risk-Off if expected /ES open is below the prior day’s range. /ES levels are derived from the profile graphic at the bottom of the following section. Levels may have changed since initially quoted; click here for the latest levels. SqueezeMetrics Dark Pool Index (DIX) and Gamma (GEX) calculations are based on where the prior day’s reading falls with respect to the MAX and MIN of all occurrences available. A higher DIX is bullish. At the same time, the lower the GEX, the more (expected) volatility. Learn the implications of volatility, direction, and moneyness. SHIFT data used for S&P 500 (INDEX: SPX) options activity. Note that options flow is sorted by the call premium spent; if more positive, then more was spent on call options. Breadth reflects a reading of the prior day’s NYSE Advance/Decline indicator. VIX reflects a current reading of the CBOE Volatility Index (INDEX: VIX) from 0-100.

What To Expect

Fundamental: In Wednesday’s morning letter, we talked about the expectations for annual inflation to have peaked and month-on-month inflation to have risen a small amount.

Per Bloomberg, “the broader CPI rose 0.3% from the prior month and 8.3% on an annual basis, a slight cooling but still among the highest readings in decades.”

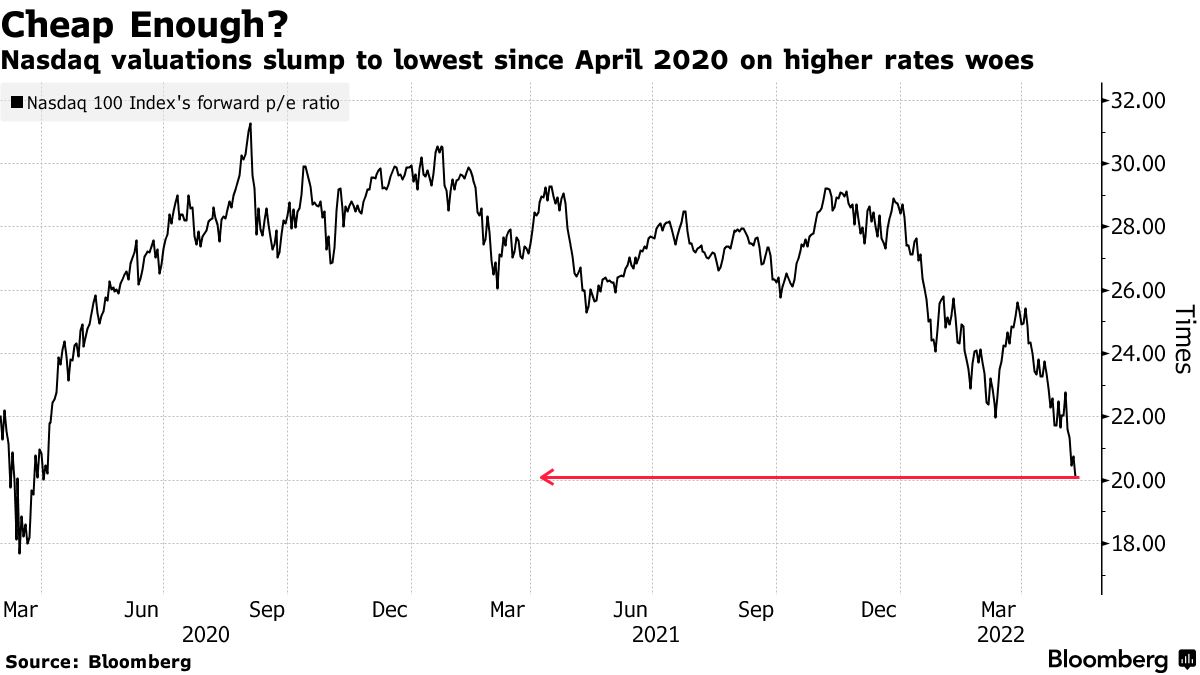
Stocks were sold, after, on the limited change to the broader fundamental outlook. The hardest hit was growth and technology, including cryptocurrency. 

“Now that central banks are unwinding monetary support, growth stocks’ valuations have further to fall,” Citigroup Inc (NYSE: C) strategists including Robert Buckland said

Notwithstanding, “any stabilization in nominal yields should eventually help to stabilize real yields and hence equity valuations.” 

This is because higher rates play into bigger discounts on future profit.

Graphic: Via Bloomberg.

Positioning: Orderly selling continues.

Despite falling about the same distance (peak to present low) during the equity market rout of 2020, selling, this time around is steady and there is no panic, and that’s partly the result of there being “plenty of put-buyers, but nearly as many sellers,” according to SqueezeMetrics.

Accordingly, using off-exchange short sales as a proxy for buying activity, we see implicit buying support, and that’s due in part to “passive flows” which ultimately end up “supporting the largest stocks,” hence the index’s strength versus smaller (and much weaker) constituents.

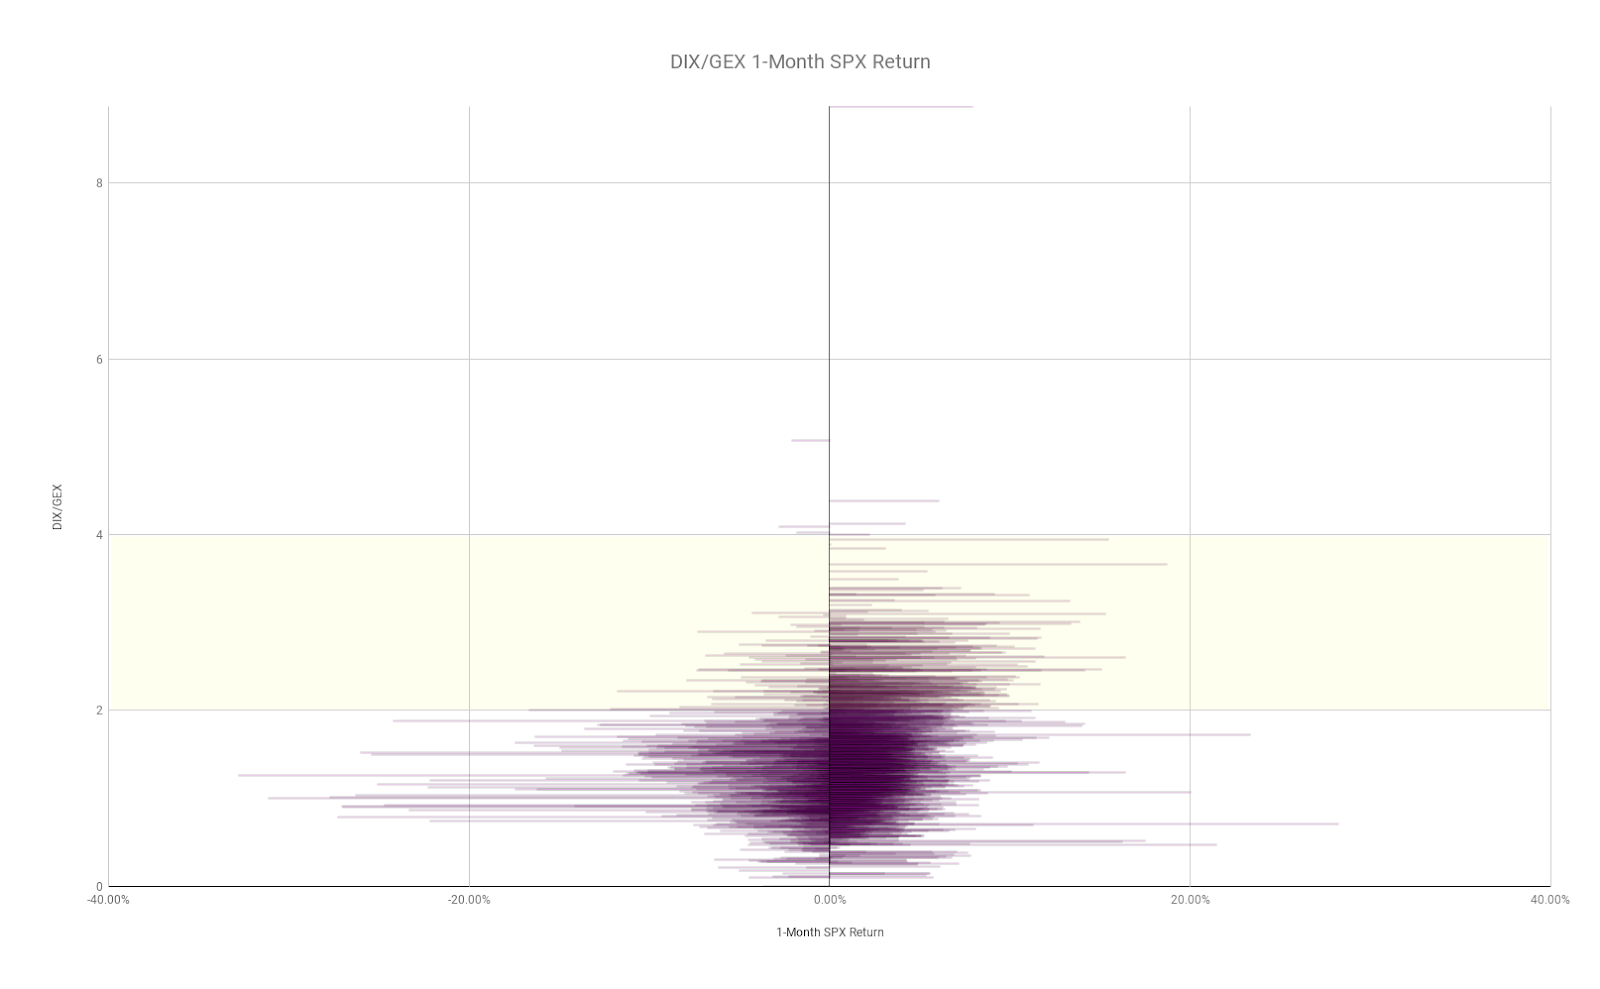
Taken together, some metrics this letter often looks to for insight into the potential distribution of future returns, carry less weight; it’s odds and when the largest stocks succumb to fundamental weaknesses, for lack of a better way of expressing it, that likely takes the indexes with it.

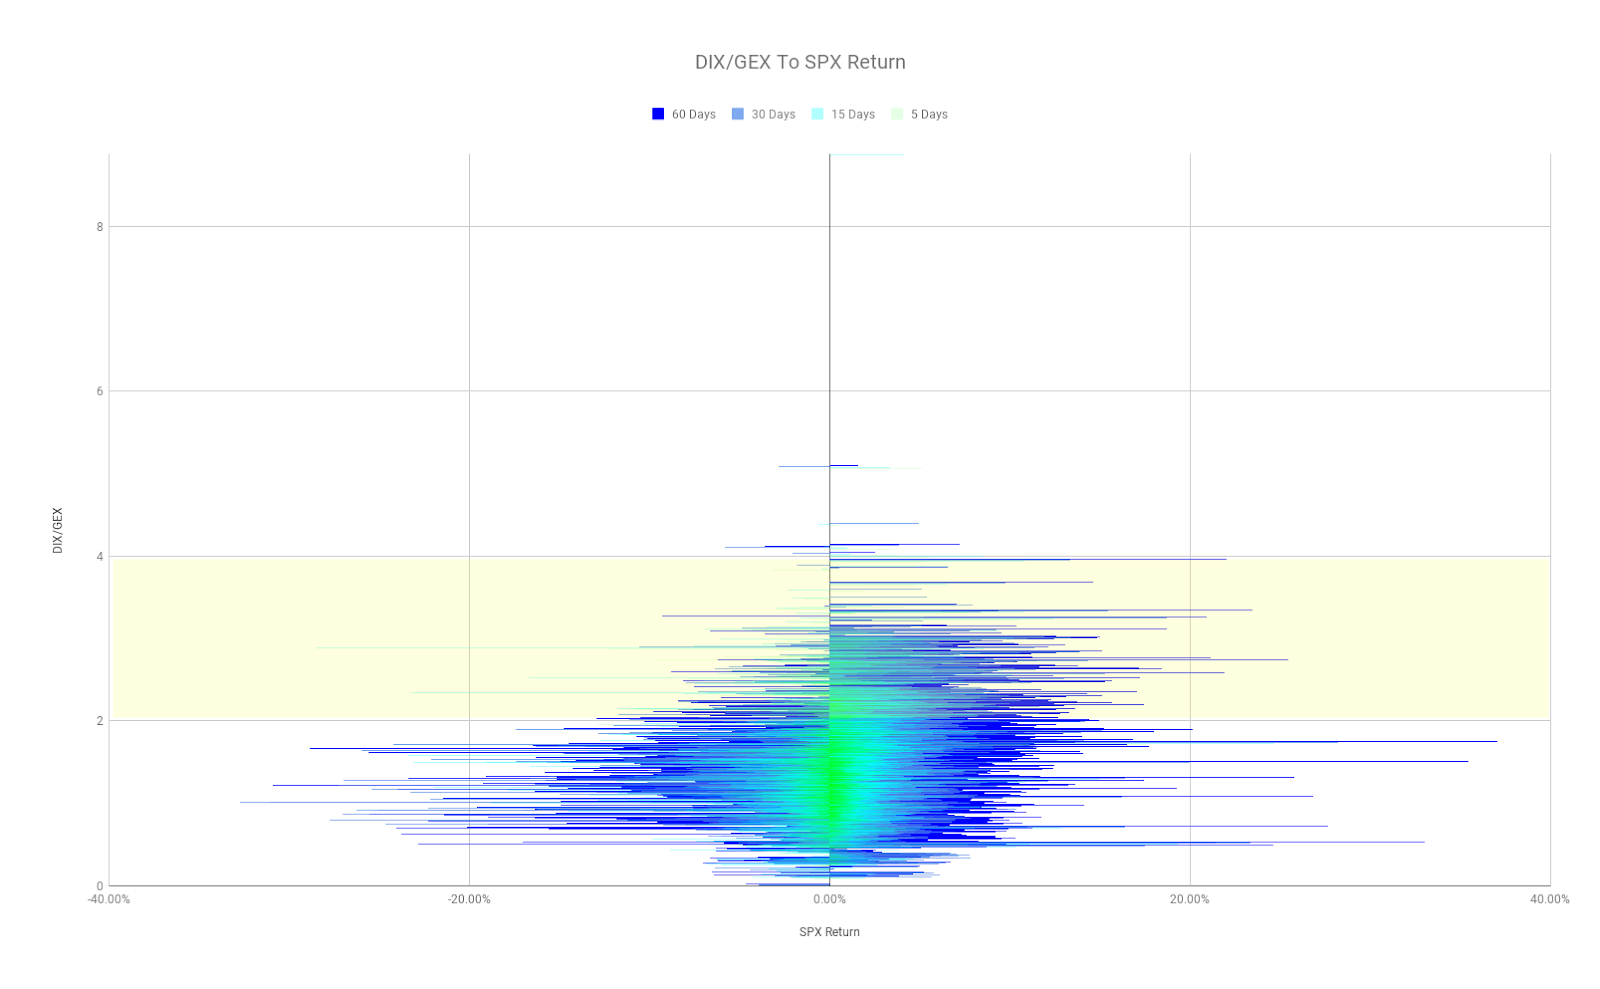
Graphic: Via Physik Invest. Data retrieved from SqueezeMetrics. A higher DIX/GEX ratio has historically been associated with S&P 500 outperformance in the subsequent month. A very low DIX/GEX ratio has historically been associated with positive S&P 500 performance in the subsequent month, though there are many more negative outliers.

Moreover, with the S&P 500’s break of $4,000.00, an area around which there is a lot of open interest, particularly on the put side, “increases capitulation risk” in the case participants start reaching for protection and indirectly taking from market liquidity as liquidity providers sell into weakness to hedge.

Notwithstanding, later this month is a large options expiration (OPEX), and expected is the roll-off of a large amount of put-heavy negative gamma. Per Pat Hennessy of IPS Strategic Capital, returns one to two weeks prior are skewed bullish.

Ways to participate in upside, while limiting downside, markedly, were discussed on May 10. Making money is one thing. Not losing money is another.

Lose less when wrong. Make more when right.
Graphic: @pat_hennessy breaks down returns for the S&P 500, categorized by the week relative to OPEX. 

Technical: As of 6:45 AM ET, Thursday’s regular session (9:30 AM – 4:00 PM ET), in the S&P 500, will likely open in the lower part of a negatively skewed overnight inventory, outside of prior-range and -value, suggesting a potential for immediate directional opportunity.

In the best case, the S&P 500 trades higher; activity above the $3,907.75 micro composite point of control (MCPOC) puts in play the $3,943.25 high volume area (HVNode). Initiative trade beyond the $3,943.25 HVNode could reach as high as the $4,011.00 untested point of control (VPOC) and $4,069.25 HVNode, or higher.

In the worst case, the S&P 500 trades lower; activity below the $3,907.75 MCPOC puts in play the $3,862.75 LVNode. Initiative trade beyond the $3,862.75 LVNode could reach as low as the $3,816.75 and $3,780.75 LVNodes, or lower.

Click here to load today’s key levels into the web-based TradingView charting platform. Note that all levels are derived using the 65-minute timeframe. New links are produced, daily.
Graphic: 65-minute profile chart of the Micro E-mini S&P 500 Futures.

What People Are Saying

Definitions

Volume Areas: A structurally sound market will build on areas of high volume (HVNodes). Should the market trend for long periods of time, it will lack sound structure, identified as low volume areas (LVNodes). LVNodes denote directional conviction and ought to offer support on any test. 

If participants were to auction and find acceptance into areas of prior low volume (LVNodes), then future discovery ought to be volatile and quick as participants look to HVNodes for favorable entry or exit.

POCs: POCs are valuable as they denote areas where two-sided trade was most prevalent in a prior day session. Participants will respond to future tests of value as they offer favorable entry and exit.

MCPOCs: POCs are valuable as they denote areas where two-sided trade was most prevalent over numerous day sessions. Participants will respond to future tests of value as they offer favorable entry and exit.

About

After years of self-education, strategy development, mentorship, and trial-and-error, Renato Leonard Capelj began trading full-time and founded Physik Invest to detail his methods, research, and performance in the markets.

Capelj also develops insights around impactful options market dynamics at SpotGamma and is a Benzinga reporter.

Some of his works include conversations with ARK Invest’s Catherine Wood, investors Kevin O’Leary and John Chambers, FTX’s Sam Bankman-Fried, Kai Volatility’s Cem Karsan, The Ambrus Group’s Kris Sidial, among many others.

 Disclaimer

In no way should the materials herein be construed as advice. Derivatives carry a substantial risk of loss. All content is for informational purposes only.
Categories
Commentary

Daily Brief For May 11, 2022

The Daily Brief is a free glimpse into the prevailing fundamental and technical drivers of U.S. equity market products. Join the 200+ that read this report daily, below!

What Happened

Overnight, index and commodity futures were bid while yields and the Cboe Volatility Index (INDEX: VIX) came in, little.

In the news was continued crypto market turmoil. The TerraUSD stablecoin maintained its break with the U.S. dollar, trading as low as ~0.25. Shanghai reported a drop in new COVID-19 cases.

Key, today, is data on consumer prices (8:30 AM ET). If Wednesday’s print shows price pressures continuing to mount, traders will put more weight on the potential for larger hikes.

Later, is some Fed speak (12:00 PM ET) and federal budget updates (2:00 PM ET).

Graphic updated 6:45 AM ET. Sentiment Neutral if expected /ES open is inside of the prior day’s range. /ES levels are derived from the profile graphic at the bottom of the following section. Levels may have changed since initially quoted; click here for the latest levels. SqueezeMetrics Dark Pool Index (DIX) and Gamma (GEX) calculations are based on where the prior day’s reading falls with respect to the MAX and MIN of all occurrences available. A higher DIX is bullish. At the same time, the lower the GEX, the more (expected) volatility. Learn the implications of volatility, direction, and moneyness. SHIFT data used for S&P 500 (INDEX: SPX) options activity. Note that options flow is sorted by the call premium spent; if more positive, then more was spent on call options. Breadth reflects a reading of the prior day’s NYSE Advance/Decline indicator. VIX reflects a current reading of the CBOE Volatility Index (INDEX: VIX) from 0-100.

What To Expect

Fundamental: Shortened commentary, today.

Participants expect inflation to have peaked. This would be confirmed by the annual CPI printing 8.1%, down from 8.5% in March.

Graphic: Via Bloomberg.

“Perhaps the tightest questions will concern core inflation (excluding food and fuel, which continue to be roiled by the situation in Ukraine),” says Bloomberg’s John Authers. 

“Now, if the economists polled by Bloomberg are correct, core month-on-month inflation is going to rise a bit. That does not help the narrative that the peak is in. If this particular number comes in below expectations, we can expect that to be taken very, very positively on the markets.”

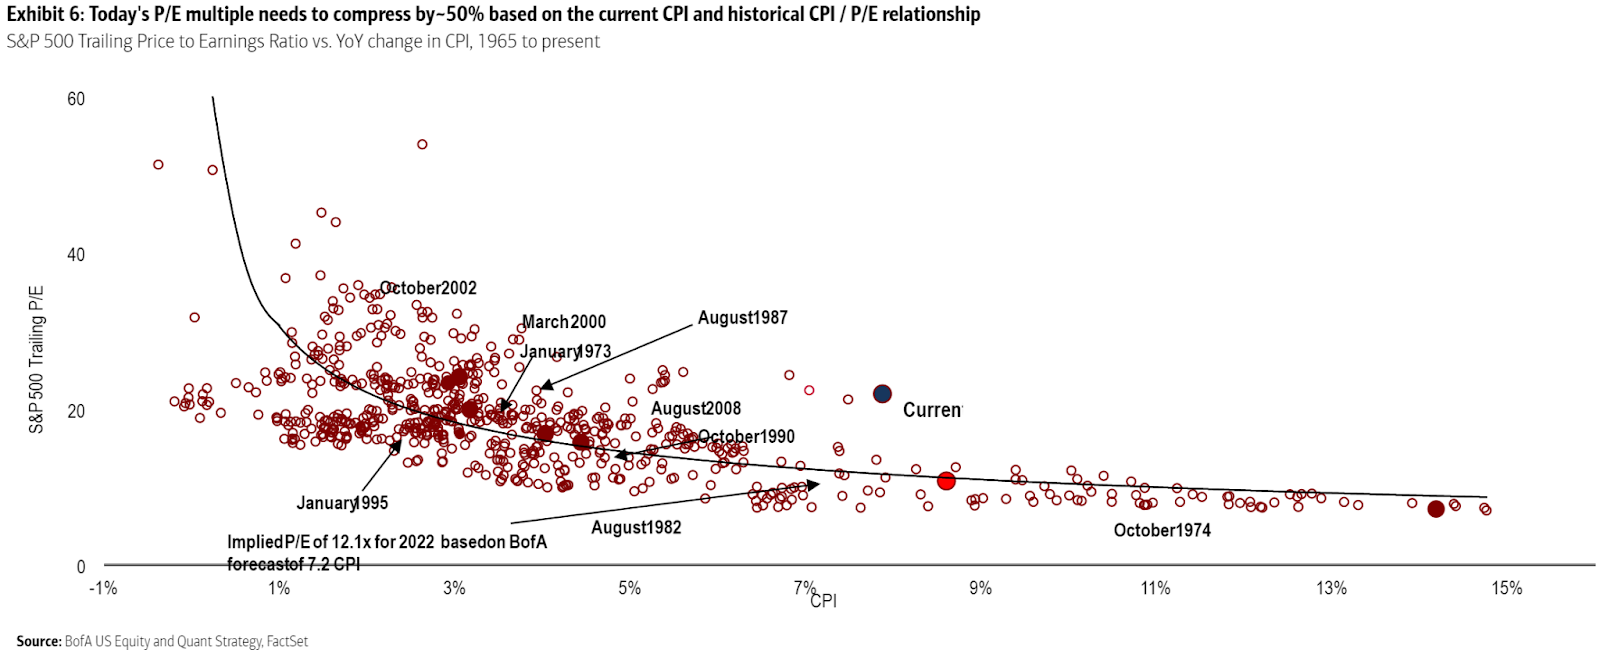
Graphic: Via Bank of America Corporation (NYSE: BAC). Taken from Bloomberg. “It’s straightforward common sense that higher inflation would lead to paying a lower multiple of earnings because you expect future earnings to be eaten into by inflation. And common sense is borne out empirically; all else equal, higher inflation does indeed tend to mean lower earnings multiples.”

Positioning: Participants are most concerned and hedging against aggressive monetary policy action and economic chokepoints.

Investors will get clarity on some of these issues in the coming sessions.

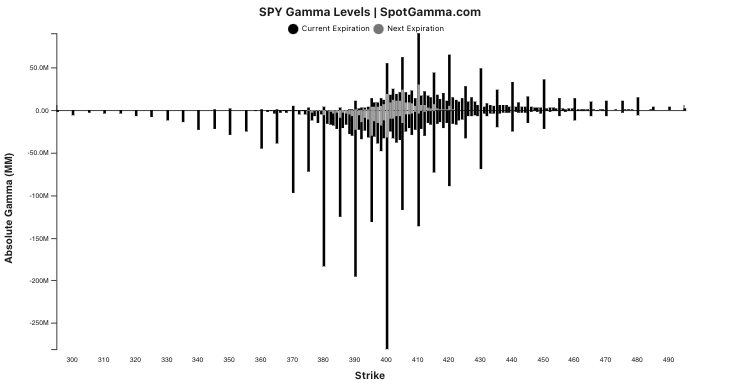
Graphic: Via SpotGamma, the estimated gamma for calls by strike as a positive number and puts as a negative number on the S&P 500 ETF, the SPY. Notice the weight on the put side.

Barring a worst-case scenario, if markets do not perform to the downside (i.e., do not trade lower), those highly-priced (often very short-dated) bets on direction will continue to decay (i.e., removal of event premiums).

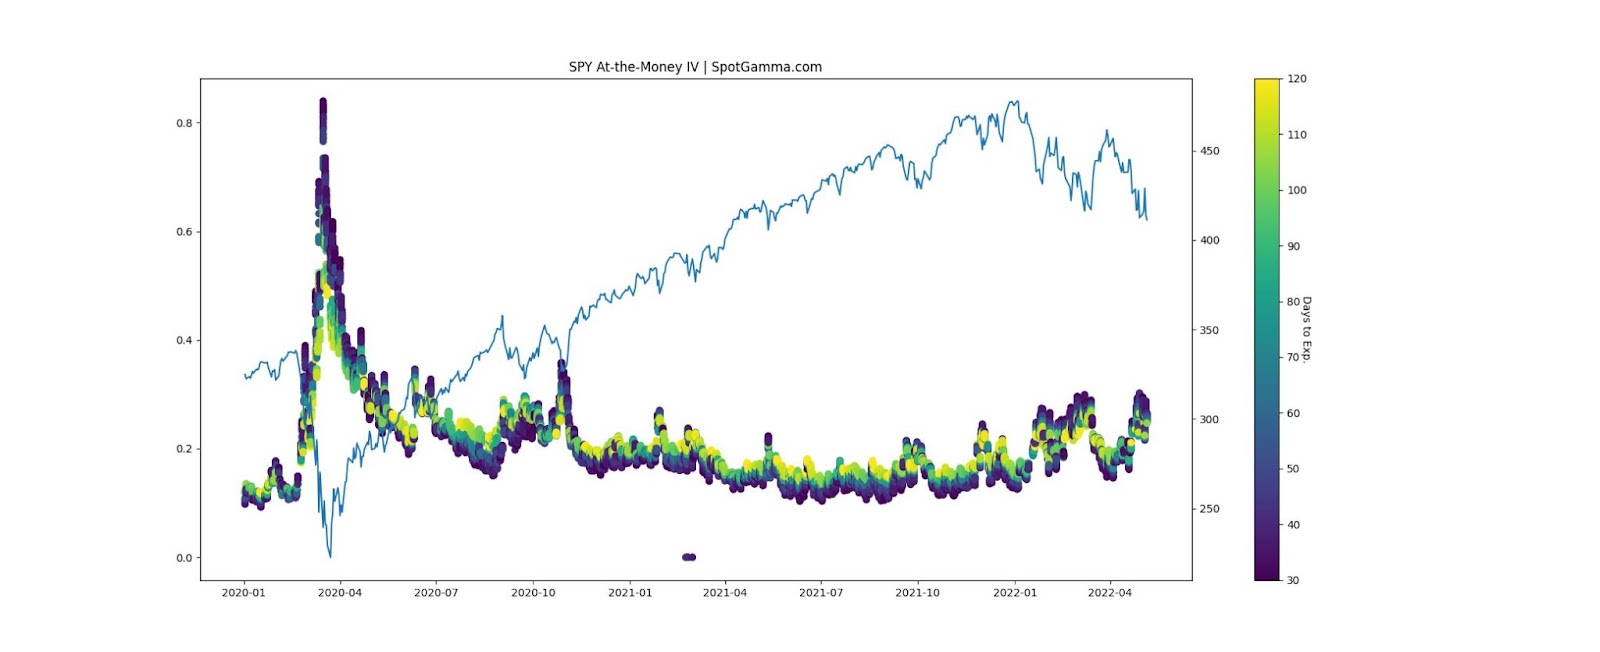
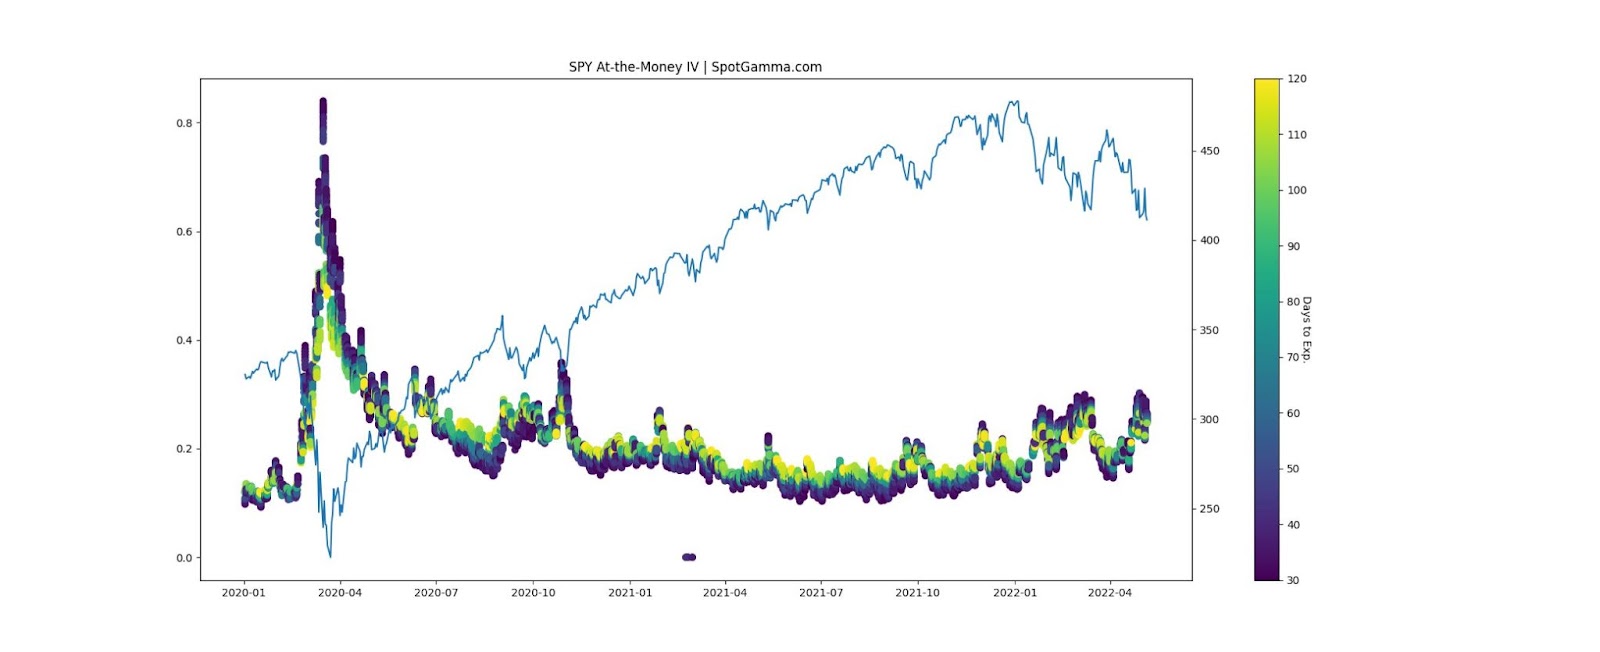
Graphic: Via SpotGamma. At-the-money implied volatility is backwardated given the heightened demand for shorter-dated protection, relative to that which is longer-dated.

Accordingly, hedging flows with respect to time and volatility may, then, bolster sharp rallies.

Graphic: Via SpotGamma. “SPX prices X-axis. Option delta Y-axis. When the factors of implied volatility and time change, hedging ratios change. For instance, if SPX is at $4,700.00 and IV jumps 15% (all else equal), the dealer may sell an additional 0.2 deltas to hedge their exposure to the addition of a positive 0.2 delta. The graphic is for illustrational purposes, only.”

The alternative is that participants’ fears for whatever matter are not assuaged. In case of an imbalance, demand for protection may kick off a repricing of volatility, particularly that which is further away from current prices (i.e., skew), depressed by strong supply.

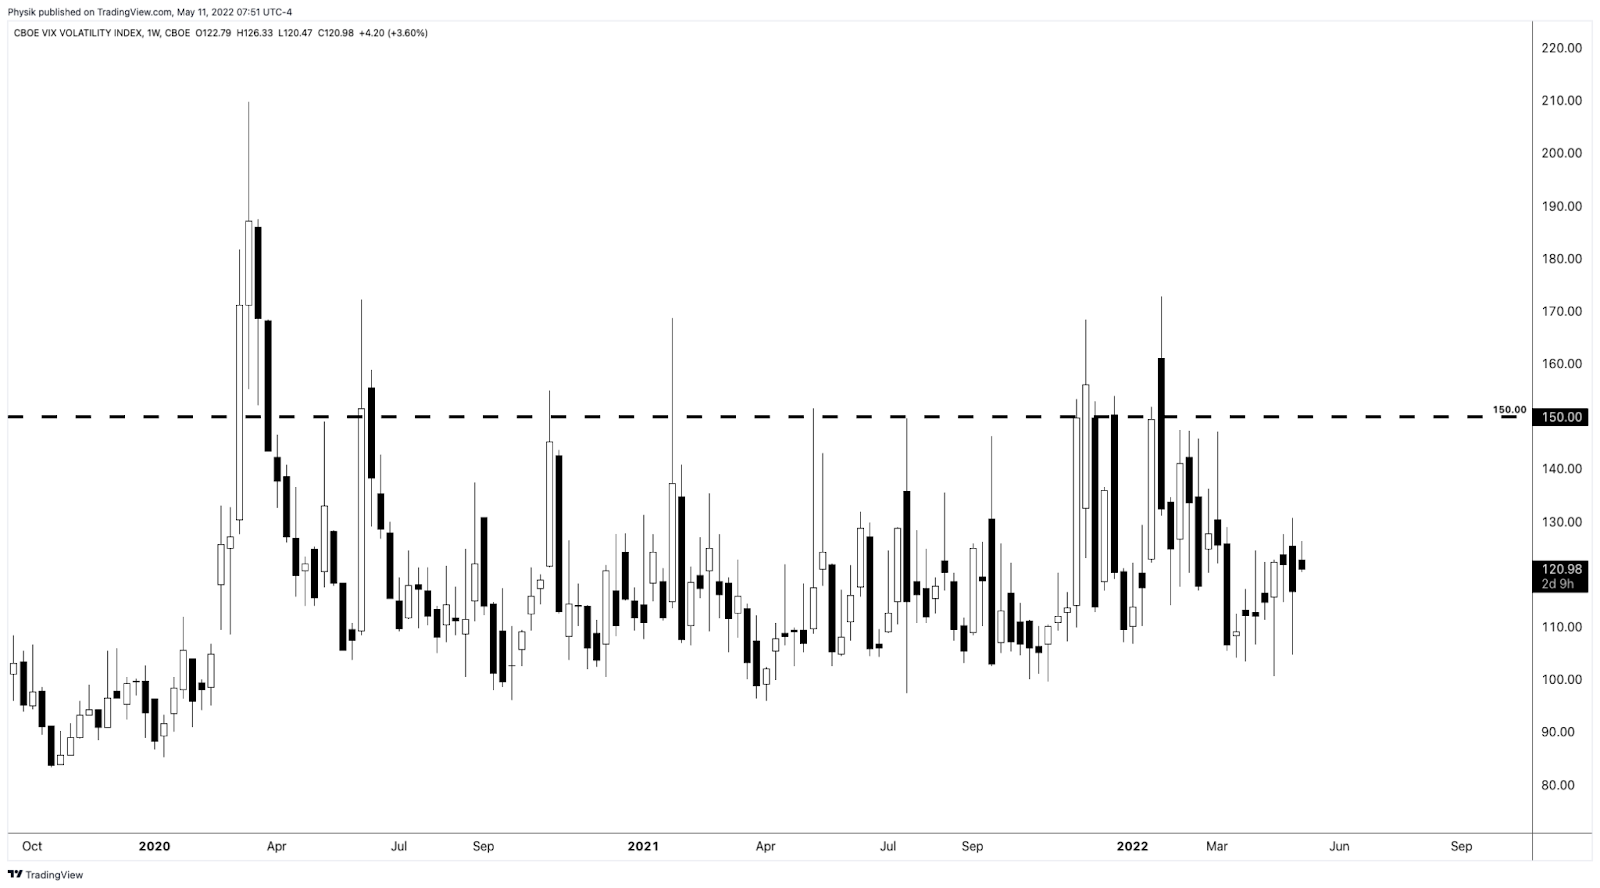
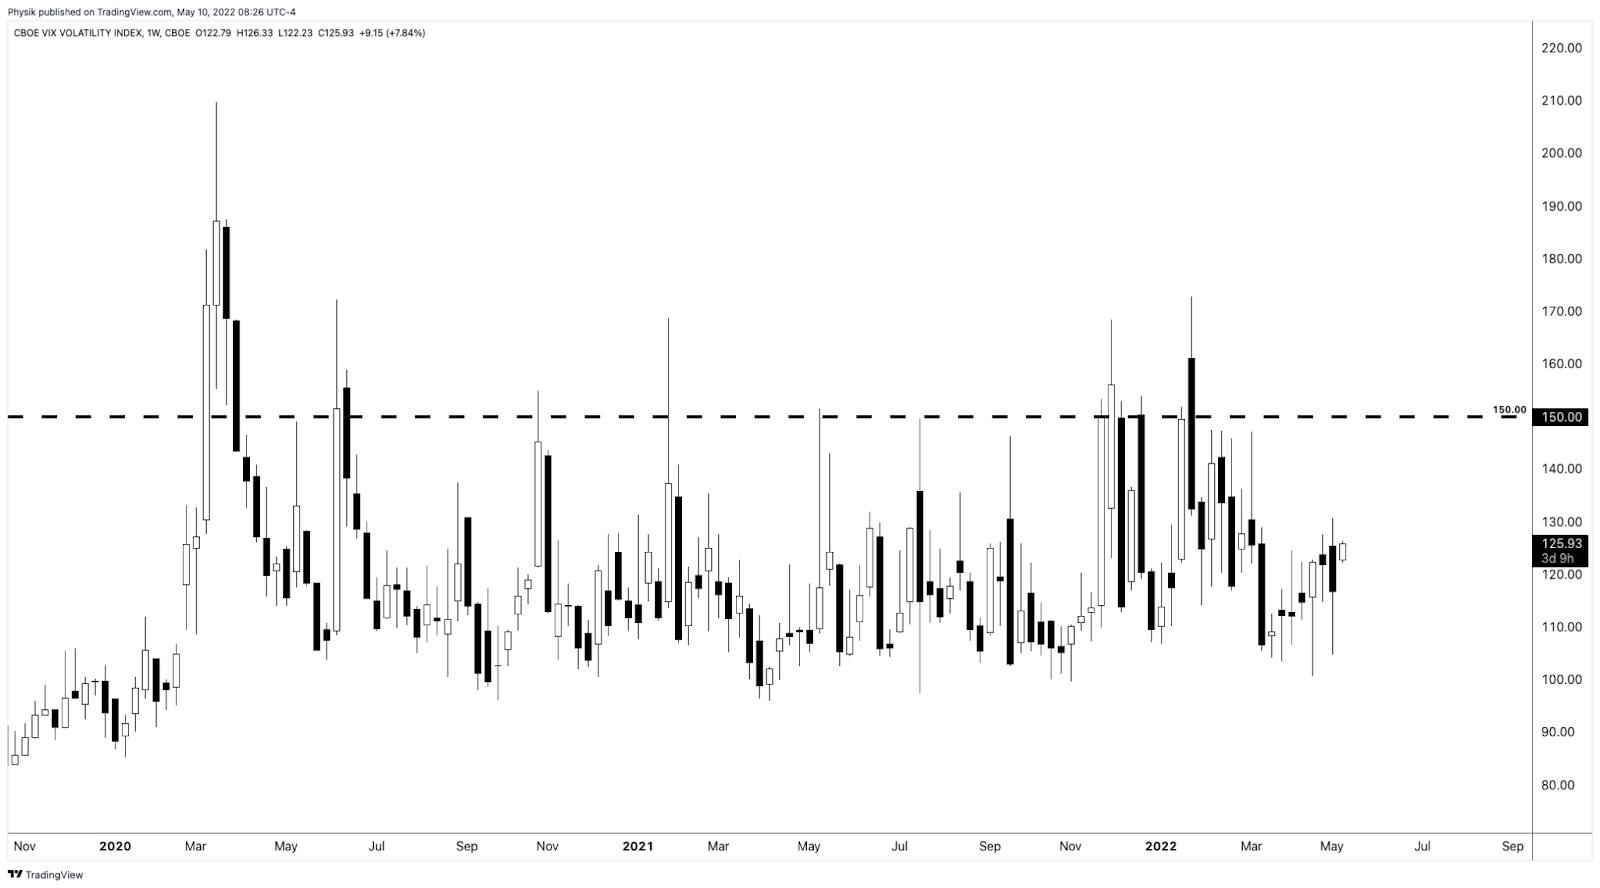
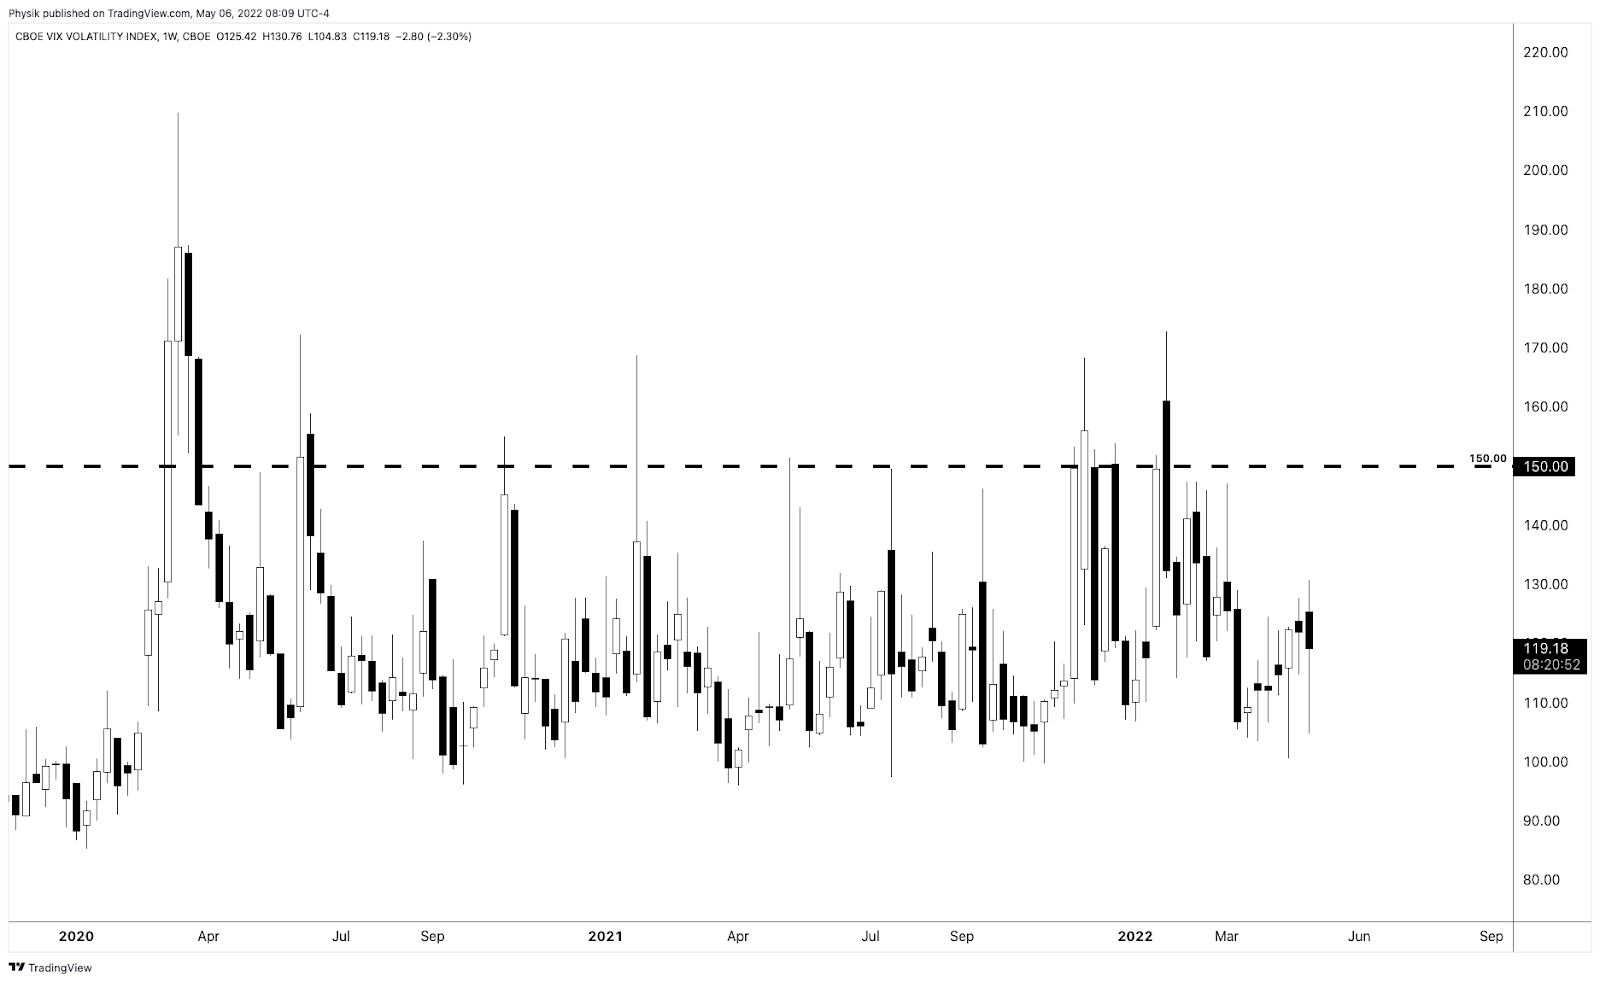
Graphic: Updated May 10, 2022. The VVIX via Physik Invest. Cboe VVIX Index (INDEX: VVIX), or the volatility of volatility, has a mean below 100 and a high correlation with the Cboe Volatility Index (INDEX: VIX) during times of stress. When realized volatility is as high as it has been, the VVIX typically trades closer to 150.

Whether any price rise kicks off a sustained reversal depends on what the fundamental situation is, then.

Presently, some of the largest index constituents (e.g., Apple Inc [NASDAQ: AAPL]) are starting to succumb to the fundamental situation, if we will, and that may feed into the indexes which are pinned due to passive and hedging flows.

In other words, fundamentals will trump this talk of positioning (i.e., it is only in the short-term does this positioning we’ve talked about have greater implications).

Graphic: Via Physik Invest. Data retrieved from SqueezeMetrics. A higher DIX/GEX ratio has historically been associated with S&P 500 outperformance in the subsequent month. A very low DIX/GEX ratio has historically been associated with positive S&P 500 performance in the subsequent month, though there are many more negative outliers.

Technical: As of 6:30 AM ET, Wednesday’s regular session (9:30 AM – 4:00 PM ET), in the S&P 500, will likely open in the upper part of a positively skewed overnight inventory, inside of prior-range and -value, suggesting a limited potential for immediate directional opportunity.

In the best case, the S&P 500 trades higher; activity above the $4,055.75 low volume node (LVNode) puts into play the $4,119.00 untested point of control (VPOC). Initiative trade beyond the VPOC could reach as high as the $4,153.25 regular trade high (RTH High) and $4,212.25 micro composite point of control (VPOC), or higher.

In the worst case, the S&P 500 trades lower; activity below the $4,055.75 LVNode puts into play the $3,978.50 LVNode. Initiative trade beyond the $3,978.50 LVNode could reach as low as the $3,943.25 and $3,907.75 high volume areas (HVNode), or lower.

Click here to load today’s key levels into the web-based TradingView charting platform. Note that all levels are derived using the 65-minute timeframe. New links are produced, daily.
Graphic: 65-minute profile chart of the Micro E-mini S&P 500 Futures.

Definitions

Volume Areas: A structurally sound market will build on areas of high volume (HVNodes). Should the market trend for long periods of time, it will lack sound structure, identified as low volume areas (LVNodes). LVNodes denote directional conviction and ought to offer support on any test. 

If participants were to auction and find acceptance into areas of prior low volume (LVNodes), then future discovery ought to be volatile and quick as participants look to HVNodes for favorable entry or exit.

POCs: POCs are valuable as they denote areas where two-sided trade was most prevalent in a prior day session. Participants will respond to future tests of value as they offer favorable entry and exit.

MCPOCs: POCs are valuable as they denote areas where two-sided trade was most prevalent over numerous day sessions. Participants will respond to future tests of value as they offer favorable entry and exit.

Volume-Weighted Average Prices (VWAPs): A metric highly regarded by chief investment officers, among other participants, for quality of trade. Additionally, liquidity algorithms are benchmarked and programmed to buy and sell around VWAPs.

About

After years of self-education, strategy development, mentorship, and trial-and-error, Renato Leonard Capelj began trading full-time and founded Physik Invest to detail his methods, research, and performance in the markets.

Capelj also develops insights around impactful options market dynamics at SpotGamma and is a Benzinga reporter.

Some of his works include conversations with ARK Invest’s Catherine Wood, investors Kevin O’Leary and John Chambers, FTX’s Sam Bankman-Fried, Kai Volatility’s Cem Karsan, The Ambrus Group’s Kris Sidial, among many others.

Disclaimer

In no way should the materials herein be construed as advice. Derivatives carry a substantial risk of loss. All content is for informational purposes only.
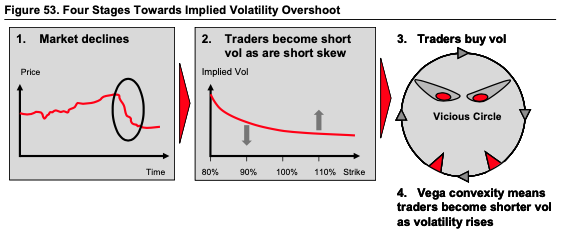
Categories
Commentary

Daily Brief For May 10, 2022

The Daily Brief is a free glimpse into the prevailing fundamental and technical drivers of U.S. equity market products. Join the 200+ that read this report daily, below!

What Happened

Overnight, equity index futures auctioned sideways to higher, inside of the prior day’s range. Most other commodity and bond futures were bid while implied volatility metrics came in a bit.

Notable was the depth and breadth of Monday’s decline. Though the indexes were tame, some of which is attributable to suppressive hedging, single stocks expanded their ranges, greatly, to the downside, and this points to potential capitulation.

On the news front, a U.S. central bank report found that “the risk of a sudden significant deterioration [in liquidity] appears higher than normal” and stablecoin use to meet margin requirements in crypto trades makes them “vulnerable to runs.”

This is just as some algorithmic stablecoins have lost their peg (e.g., UST/USD ~$0.60).

Additionally, the report found elevated inflation, as well as the reaction to that “could negatively affect domestic economic activity, asset prices, credit quality, and financial conditions.”

Ahead is data on real household debt (11:00 AM ET).

Graphic updated 6:25 AM ET. Sentiment Neutral if expected /ES open is inside of the prior day’s range. /ES levels are derived from the profile graphic at the bottom of the following section. Levels may have changed since initially quoted; click here for the latest levels. SqueezeMetrics Dark Pool Index (DIX) and Gamma (GEX) calculations are based on where the prior day’s reading falls with respect to the MAX and MIN of all occurrences available. A higher DIX is bullish. At the same time, the lower the GEX, the more (expected) volatility. Learn the implications of volatility, direction, and moneyness. SHIFT data used for S&P 500 (INDEX: SPX) options activity. Note that options flow is sorted by the call premium spent; if more positive, then more was spent on call options. Breadth reflects a reading of the prior day’s NYSE Advance/Decline indicator. VIX reflects a current reading of the CBOE Volatility Index (INDEX: VIX) from 0-100.

What To Expect

Context: We continue to build out the narrative.

A market-wide drop, Monday, pointed to signs of capitulation as “small-time investors offloaded a net of about $1 billion in equities, the most aggressive selling in 14 months,” per JPMorgan Chase & Co (NYSE: JPM).

Graphic: Via @TaviCosta. “Nasdaq has already declined almost as much as it did during the March 2020 crash. Back then, the Fed was all about saving the stock market and the economy. Today, it’s all about how much more they are going to hike rates.

Notwithstanding, the volatility divergences this letter has pointed to, in the face of pronounced realized volatility, continue.

Graphic: Via Topdown Charts. Wednesday (FOMC) price rise (right) versus Thursday (post-FOMC) liquidation.

As Pat Hennessy of IPS Strategic Capital explains, at-the-money implied volatility is high and term structure is in backwardation, which are reflections of uncertainty and demand for hedges.

Graphic: Via SpotGamma. At-the-money implied volatility is backwardated given the heightened demand for shorter-dated protection, relative to that which is longer-dated.

“It’s just rare to see wingy short-dated puts like this so cheap relative to ATM.”

As explained in Monday’s letter (and in greater detail, Friday), a measure like the Cboe VVIX Index (INDEX: VVIX), or the volatility of volatility, has a mean below 100 and a high correlation with the Cboe Volatility Index (INDEX: VIX) during times of stress.

When realized volatility is as high as it is, today, the VVIX typically trades closer to 150.

To quote Benn Eifert of QVR Advisors: “Skew goes up if vol outperforms the skew curve a lot on  a selloff.”

Graphic: Updated May 9, 2022. The VVIX via Physik Invest.

What’s going on? 

There is really negative sentiment and emotion, both of which are playing into market weaknesses and realized volatility. However, that realized volatility is not priced in.

There are “plenty of put-buyers, but nearly as many sellers,” SqueezeMetrics explains

You “don’t have to protect what you don’t own. Some investors de-grossed. Short momo (e.g., CTA) wants to bet on a bleed (a la 2000), but not on a crash. Put underwriting! No carry trades elsewhere. Sell SPX vol!”

Graphic: Via SpotGamma’s Hedging Impact of Real-Time Options (HIRO) indicator, the SPDR S&P 500 ETF Trust (NYSE: SPY) was a recipient of heavy put selling and call buying on 5/9/22.

Why does this matter?

When you think there is to be an outsized move in the underlying, relative to what is priced, you buy options (positive exposure to gamma) so that you may have gains that are potentially amplified in case of directional movement.

When you think there is to be an outsized move in the implied volatility, relative to what is priced, you buy options (positive exposure to volga) so that you may have gains that are potentially amplified in case of implied volatility repricing.

So, in all, it is a question of whether the reward is worth the risk (see below “How To Play”).

Based on stretched positioning, equity markets are positioned for upside. Notwithstanding, the potential for large negative outliers, remains. In the case of an outlier, the consequent repricing of volatility may increase the reward, relative to the risk, for selling options, particularly puts.

As The Ambrus Group’s Kris Sidial sums well: 

With an S&P 500 below $4,000.00, “I would expect more of an aggressive reach for hedges … that spot- vol correlation break (weakness) would not be as present.”

“Spot- vol correlation has sucked recently, but vol relative strength should kick in.”

How I’m Playing: Borrowing from May 3’s letter, here.

Presently, the market is stretched to the downside and, as SpotGamma says, “traders are underpricing right-tail risk,” which opens the window for unique ways to play a returns distribution that continues to be skewed positive (albeit with large negative outliers).

This letter’s author is concentrated on zero- and low-cost bets ($0.00-$1.00 debit to open) that deliver asymmetric payouts (sometimes in excess of $10.00 credit to close) in case of violent and short-lived reversals.

This letter’s author is structured positive delta and gamma in the Nasdaq 100 (INDEX: NDX) via ratios spread (1×2) and butterfly (1x2x1) structures.

Graphic: Via Banco Santander SA (NYSE: SAN) research, the return profile, at expiry, of a classic 1×2 (long 1, short 2 further away) ratio spread.

The concern with these strategies is the width and time to expiry. Should either of those be wrong, then spreads initially positive gamma turn negative, meaning losses are amplified.

For instance, in the Nasdaq 100, to put in short, 500-1000 points wide ratio spreads (buy the closer leg, sell two of the farther legs) expiring in ten to fifteen days work well.

For those spreads that are not zero cost, debits can be offset with credit sales (on the put side) in products that have shown relative strength like the S&P 500 (INDEX: SPX). This, inherently, carries more risk, and, as explained, the risk has yet to meet the reward.

Read more about these strategies, here. The above is NOT a trade recommendation or advice.

Technical: As of 6:30 AM ET, Tuesday’s regular session (9:30 AM – 4:00 PM ET), in the S&P 500, will likely open in the middle part of a balanced overnight inventory, inside of prior-range and -value, suggesting a limited potential for immediate directional opportunity.

In the best case, the S&P 500 trades higher; activity above the $3,978.50 low volume area (LVNode/gap boundary) puts in play the $4,055.75 LVNode/gap boundary. Initiative trade beyond the $4,055.75 could reach as high as the $4,119.00 untested point of control (VPOC) and $4,153.25 regular trade high (RTH High), or higher.

In the worst case, the S&P 500 trades lower; activity below the $3,978.50 LVNode/gap boundary puts in play the $3,943.25 high volume area (HVNode). Initiative trade beyond the $3,943.25 could reach as low as the $3,907.75 HVNode and $3,862.75 LVNode, or lower.

Click here to load today’s key levels into the web-based TradingView charting platform. Note that all levels are derived using the 65-minute timeframe. New links are produced, daily.
Graphic: 65-minute profile chart of the Micro E-mini S&P 500 Futures.

Definitions

Cave-Fill Process: Widened the area deemed favorable to transact at by an increased share of participants. This is a good development.

Volume Areas: A structurally sound market will build on areas of high volume (HVNodes). Should the market trend for long periods of time, it will lack sound structure, identified as low volume areas (LVNodes). LVNodes denote directional conviction and ought to offer support on any test. 

If participants were to auction and find acceptance into areas of prior low volume (LVNodes), then future discovery ought to be volatile and quick as participants look to HVNodes for favorable entry or exit.

Gamma: Gamma is the sensitivity of an option to changes in the underlying price.

Vanna: The rate at which the delta of an option changes with respect to volatility.

Charm: The rate at which the delta of an option changes with respect to time.

Options: If an option buyer was short (long) stock, he or she would buy a call (put) to hedge upside (downside) exposure. Option buyers can also use options as an efficient way to gain directional exposure.

POCs: POCs are valuable as they denote areas where two-sided trade was most prevalent in a prior day session. Participants will respond to future tests of value as they offer favorable entry and exit.

MCPOCs: POCs are valuable as they denote areas where two-sided trade was most prevalent over numerous day sessions. Participants will respond to future tests of value as they offer favorable entry and exit.

Options Expiration (OPEX): Reduction of dealer gamma exposure.

Volume-Weighted Average Prices (VWAPs): A metric highly regarded by chief investment officers, among other participants, for quality of trade. Additionally, liquidity algorithms are benchmarked and programmed to buy and sell around VWAPs.

About

After years of self-education, strategy development, mentorship, and trial-and-error, Renato Leonard Capelj began trading full-time and founded Physik Invest to detail his methods, research, and performance in the markets.

Capelj also develops insights around impactful options market dynamics at SpotGamma and is a Benzinga reporter.

Some of his works include conversations with ARK Invest’s Catherine Wood, investors Kevin O’Leary and John Chambers, FTX’s Sam Bankman-Fried, Kai Volatility’s Cem Karsan, The Ambrus Group’s Kris Sidial, among many others.

Disclaimer

In no way should the materials herein be construed as advice. Derivatives carry a substantial risk of loss. All content is for informational purposes only.
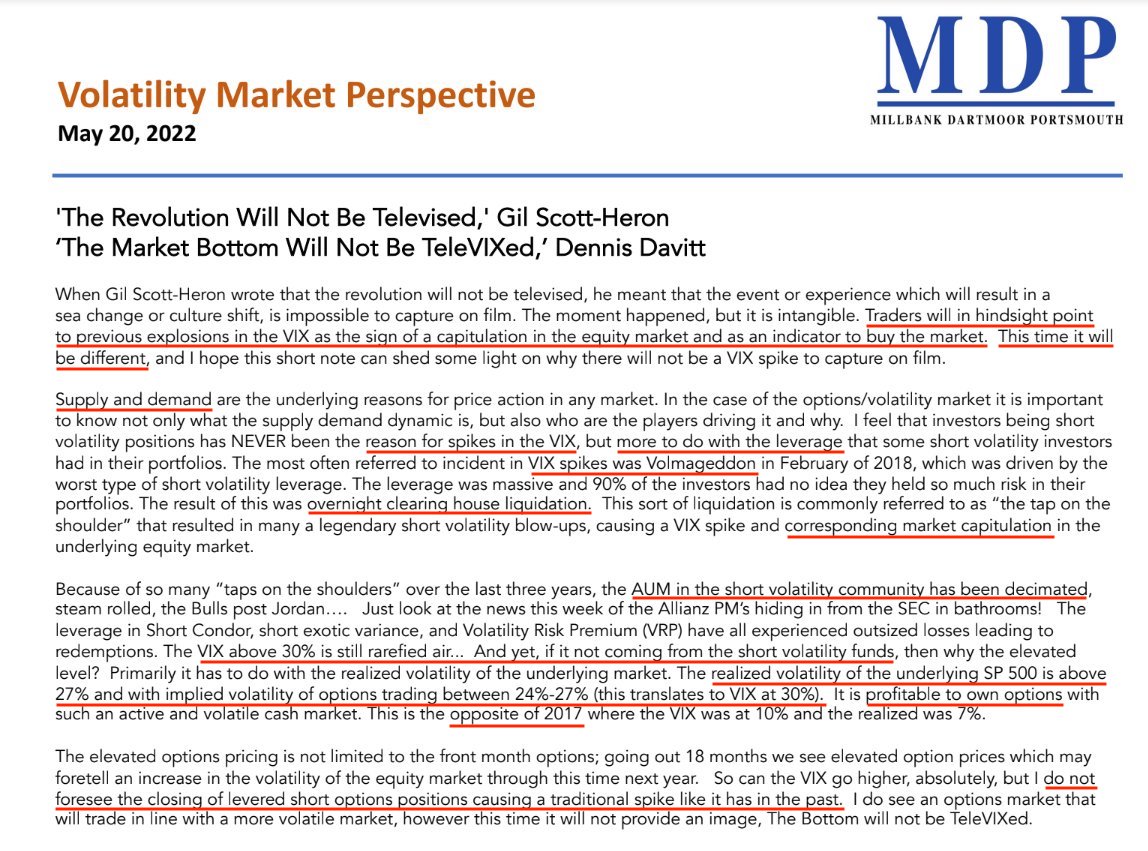
Categories
Commentary

Daily Brief For May 9, 2022

The Daily Brief is a free glimpse into the prevailing fundamental and technical drivers of U.S. equity market products. Join the 200+ that read this report daily, below!

What Happened

Overnight, equity index, commodity, and bond futures were all lower while yields, and implied volatility metrics we monitor were bid.

This is as new fundamental data did little to disrupt the Federal Reserve’s (Fed’s) course to hike rates and reduce the size of its balance sheet, as well as the odds of further slowing as a result of actions to curb the spread of COVID-19 abroad, and geopolitical conflict.

Goldman Sachs Group Inc (NYSE: GS), among others, cut their equity market forecasts. Presently, they see an economic contraction playing into the S&P 500’s test of $3,600.00.

Notable is the market’s retest of a very key technical area ($4,055.75 in the E-mini S&P 500). This area, last week, likely solicited responsive buying by technically-driven market participants who often lack the wherewithal to defend retests, just days before the Fed’s decision on policy.

Now, the market is set to open below those key technical areas and that is the worst outcome.

Ahead is data on wholesale inventories (10:00 AM ET), as well as inflation (11:00 AM ET).

Graphic updated 6:35 AM ET. Sentiment Risk-Off if expected /ES open is below the prior day’s range. /ES levels are derived from the profile graphic at the bottom of the following section. Levels may have changed since initially quoted; click here for the latest levels. SqueezeMetrics Dark Pool Index (DIX) and Gamma (GEX) calculations are based on where the prior day’s reading falls with respect to the MAX and MIN of all occurrences available. A higher DIX is bullish. At the same time, the lower the GEX, the more (expected) volatility. Learn the implications of volatility, direction, and moneyness. SHIFT data used for S&P 500 (INDEX: SPX) options activity. Note that options flow is sorted by the call premium spent; if more positive, then more was spent on call options. Breadth reflects a reading of the prior day’s NYSE Advance/Decline indicator. VIX reflects a current reading of the CBOE Volatility Index (INDEX: VIX) from 0-100.

What To Expect

Positioning: Last week’s letters went in-depth on the implications of volatility divergences, the post-Fed rally, responses to key technical levels, and beyond.

On Friday, May 6, 2022, this letter essentially remarked the following:

Based on stretched positioning, equity markets are positioned for upside. Notwithstanding, the potential for large negative outliers, remains. In the case of an outlier, the consequent repricing of volatility may increase the reward, relative to the risk, for selling options.

Graphic: Via MarketWatch. “[B]ack-to-back swings in the internals on the scale seen this week are rare, with the last one occurring close to the COVID lows in stocks of March 2020. Indeed, investors had never seen a swing in internals as severe as Thursday’s before the financial crisis of 2008-09.”

How do you know whether the risk is worth the reward? 

A naive measure like the Cboe VVIX Index (INDEX: VVIX), which measures the volatility of volatility, has a mean below 100 and a high correlation with the Cboe Volatility Index (INDEX: VIX) during times of stress.

When realized volatility is as high as it is, today, the VVIX typically trades closer to 150.

Graphic: Updated May 6, 2022. The VVIX via Physik Invest.

We’re not there yet and the market remains well-hedged, as SpotGamma explains well:

“From an options perspective, participants would have to demand en masse protection (buy puts, sell calls) for liquidity providers to further take from market liquidity (sell into weakness) and that volatility skew to, essentially, blowout (e.g., Corona crisis, Meme mania, and the like).”

Pursuant to those remarks, SpotGamma sees markets reaching a lower limit near the $4,000.00 SPX area. At that juncture, the rate at which liquidity providers add pressure in their hedging activities flattens as they, too, have hedges.

Graphic: Via SpotGamma. Updated April 27, 2022.

“In turn, dealers may be able to advantageously reduce delta hedging (sell less), and supply markets with more liquidity (buy more stock). This could serve to reduce volatility.”

Noting, later this month is a large options expiration (OPEX), and expected is the roll-off of a large amount of put-heavy negative gamma.

Per Pat Hennessy of IPS Strategic Capital, returns one to two weeks prior are skewed bullish.

Graphic: @pat_hennessy breaks down returns for the S&P 500, categorized by the week relative to OPEX. 

This is amid what is a front-running of the bullish flow associated with the delta decay of options with respect to changes in volatility (vanna) and time (charm), among other factors.

In other words, it is participants’ increased awareness of the implications of options and OPEX that has resulted in a front running. According to SqueezeMetrics, “People didn’t know about the OpEx week effect (in this case, largely charm). Now everyone and their mother knows about it.’”

So what?

Charm is a measure of an options delta’s change with respect to the passage of time. As time passes, delta “bleeds” as options decay. 

Graphic: Via SpotGamma. “SPX prices X-axis. Option delta Y-axis. When the factors of implied volatility and time change, hedging ratios change. For instance, if SPX is at $4,700.00 and IV jumps 15% (all else equal), the dealer may sell an additional 0.2 deltas to hedge their exposure to the addition of a positive 0.2 delta. The graphic is for illustrational purposes, only.”

As most participants, at least at the index level, own protection, the counterparties to this trade are short protection. These counterparties, therefore, have positive exposure to delta (i.e., as index falls [rises], position loses [makes] money) and negative exposure to gamma, or delta (directional) sensitivity to underlying price changes (i.e., as the index moves against short option exposure, losses are multiplied). 

Moreover, given the growth of options volumes, participants’ heavy demand for protection matters more, to put simply. Counterparties, in light of this recent drop, pressured markets with their hedging. The decay (and eventual expiry) of this protection marks options deltas down.
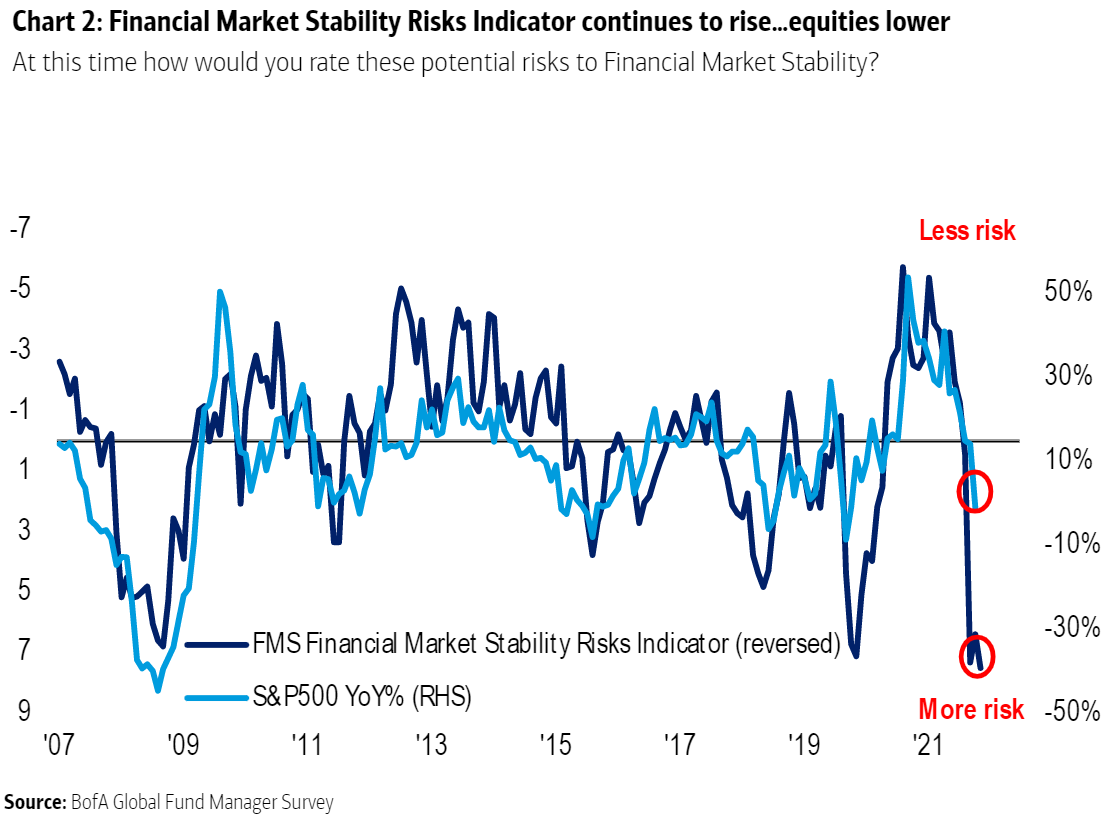
Graphic: Via Bloomberg. Rising put volumes coincide with early 2022 market sell-off.

To re-hedge, counterparties buy back short stock and futures hedges. This supportive action is what has been front-run. The bullishness of the event can happen in the days and weeks prior.

Technical: As of 6:35 AM ET, Monday’s regular session (9:30 AM – 4:00 PM ET), in the S&P 500, will likely open in the lower part of a negatively skewed overnight inventory, outside of prior-range and -value, suggesting a potential for immediate directional opportunity.
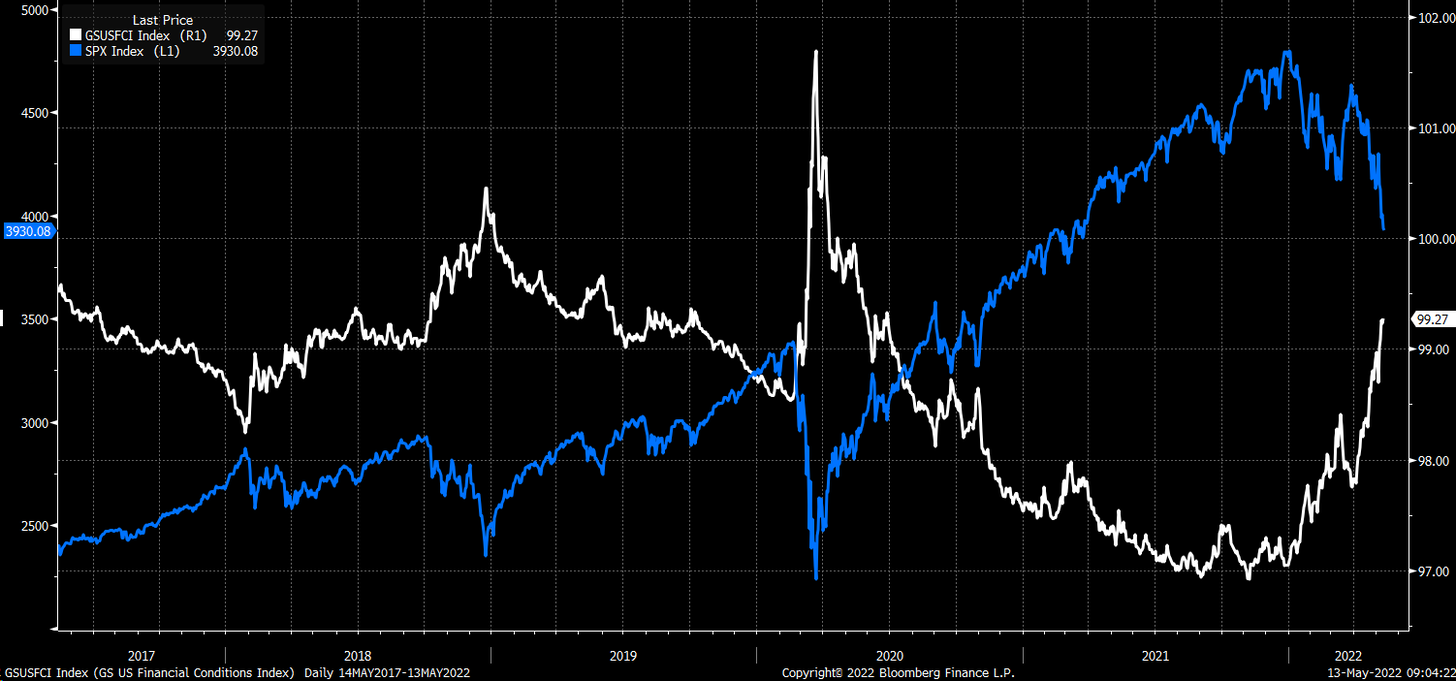
In the best case, the S&P 500 trades higher; activity above the $4,055.75 low volume area (LVNode/gap boundary) puts in play the $4,119.00 untested point of control (VPOC). Initiative trade beyond the VPOC could reach as high as the $4,153.25 regular trade high (RTH High) and $4,212.25 micro composite point of control (MCPOC), or higher.
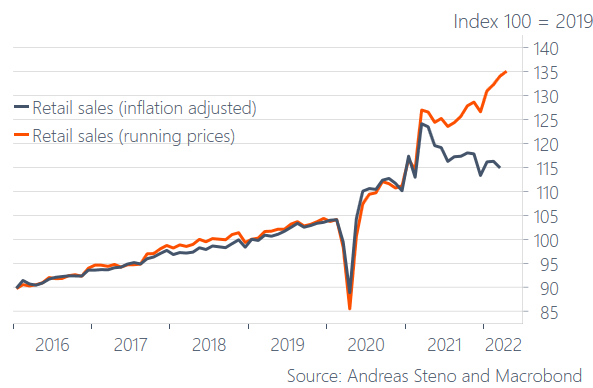
In the worst case, the S&P 500 trades lower; activity below the $4,055.75 LVNode/gap boundary puts in play the $3,978.50 LVNode/gap boundary. Initiative trade beyond the LVNode/gap boundary could reach as low as the $3,943.25 and $3,907.75 high volume areas (HVNodes), or lower.

Click here to load today’s key levels into the web-based TradingView charting platform. Note that all levels are derived using the 65-minute timeframe. New links are produced, daily.

Graphic: 65-minute profile chart of the Micro E-mini S&P 500 Futures.

Considerations: Last Tuesday, we discussed the response to a key technical level ($4,055.75).

Specifically, the E-mini S&P 500 probed $4,056.00 before staging a sharp reversal and closing higher. This was noteworthy as it told us a lot about who was gaining the upper hand.

Push-and-pull, as well as responsiveness near key-technical areas (discernable visually on a chart), suggests technically-driven traders with shorter time horizons are (becoming) active.

Such traders often lack the wherewithal to defend retests.

Moreover, heading into last week’s Federal Open Market Committee (FOMC) event, large participants (who often move by committee) de-grossed and hedged resulting in poor reliability of our technical levels.

In the days leading up to the event, these larger had little to do with respect to repositioning. 

The market’s tests of key technical areas solicited responsive buying by these short-term traders, and this played into a rally that continued through FOMC. Post-FOMC, the market quickly succumbed to the initiative selling by longer time frame participants.

All else equal, Monday’s regular trade is expected to start somewhere below a key technical area that solicited strong responsive buying by shorter timeframes. 

Given capital constraints and tolerances, shorter timeframes may fuel an acceleration of the prevailing downtrend.

What People Are Saying

Definitions

Volume Areas: A structurally sound market will build on areas of high volume (HVNodes). Should the market trend for long periods of time, it will lack sound structure, identified as low volume areas (LVNodes). LVNodes denote directional conviction and ought to offer support on any test. 

If participants were to auction and find acceptance into areas of prior low volume (LVNodes), then future discovery ought to be volatile and quick as participants look to HVNodes for favorable entry or exit.

POCs: POCs are valuable as they denote areas where two-sided trade was most prevalent in a prior day session. Participants will respond to future tests of value as they offer favorable entry and exit.

MCPOCs: POCs are valuable as they denote areas where two-sided trade was most prevalent over numerous day sessions. Participants will respond to future tests of value as they offer favorable entry and exit.

Volume-Weighted Average Prices (VWAPs): A metric highly regarded by chief investment officers, among other participants, for quality of trade. Additionally, liquidity algorithms are benchmarked and programmed to buy and sell around VWAPs.

About

After years of self-education, strategy development, mentorship, and trial-and-error, Renato Leonard Capelj began trading full-time and founded Physik Invest to detail his methods, research, and performance in the markets.

Capelj also develops insights around impactful options market dynamics at SpotGamma and is a Benzinga reporter.

Some of his works include conversations with ARK Invest’s Catherine Wood, investors Kevin O’Leary and John Chambers, FTX’s Sam Bankman-Fried, Kai Volatility’s Cem Karsan, The Ambrus Group’s Kris Sidial, among many others.

 Disclaimer

In no way should the materials herein be construed as advice. Derivatives carry a substantial risk of loss. All content is for informational purposes only.