Categories
Commentary

Daily Brief For November 9, 2022

The daily brief is a free glimpse into the prevailing fundamental and technical drivers of U.S. equity market products. Join the 1,200+ that read this report daily, below!

Graphic updated 8:45 AM ET. Sentiment Neutral if expected /ES open is inside of the prior day’s range. /ES levels are derived from the profile graphic at the bottom of the following section. Levels may have changed since initially quoted; click here for the latest levels. SqueezeMetrics Dark Pool Index (DIX) and Gamma (GEX) calculations are based on where the prior day’s reading falls with respect to the MAX and MIN of all occurrences available. A higher DIX is bullish. At the same time, the lower the GEX, the more (expected) volatility. Learn the implications of volatility, direction, and moneyness. Breadth reflects a reading of the prior day’s NYSE Advance/Decline indicator. VIX reflects a current reading of the CBOE Volatility Index (INDEX: VIX) from 0-100.

Fundamental

A crypto-market leader and a lender of last resort – FTX – co-founded by Sam Bankman-Fried (SBF) was little questioned by many. It appears, however, that the company had growing pain points.

Events are developing quickly, too add. Here is a note that SBF issued to investors after entering into a nonbinding agreement with Binance.

Graphic: Retrieved from @gurgavin on Twitter. Read the story on The Block.

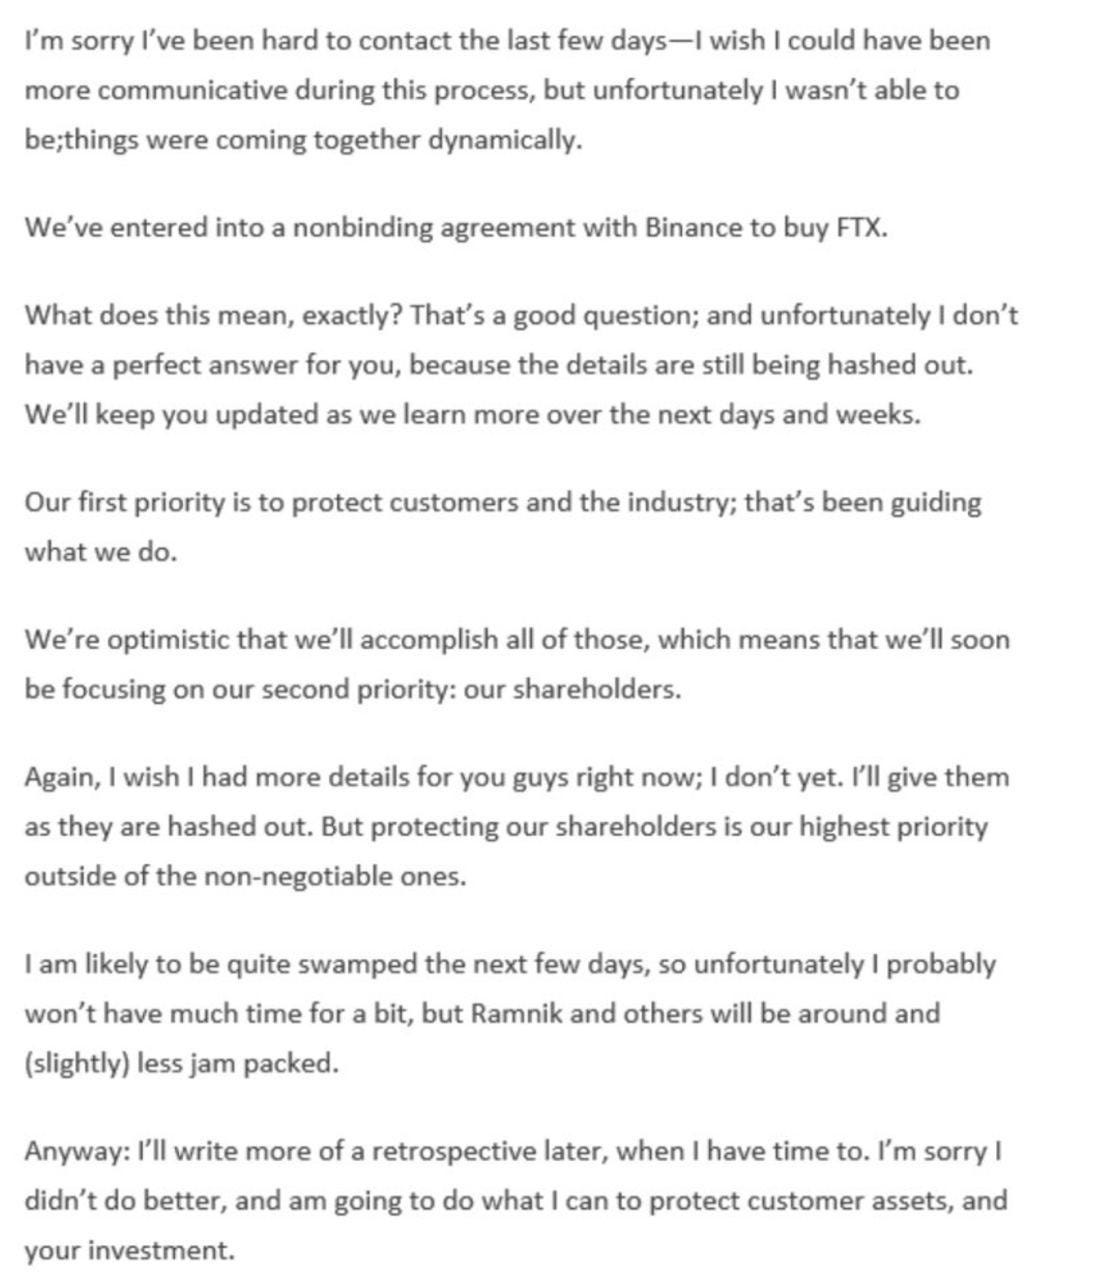
In short, there’s little substance.

Let’s go through the motions and start unpacking this debacle. Should we have loose ends, we’ll address those in the coming days.

In late December of 2021, I spoke with SBF regarding his background and aims with FTX. The resulting work was published on Benzinga.com, where I continue to work part-time as a writer and project lead.

Graphic: Retrieved from Renato Leonard Capelj. On the top is Renato Leonard Capelj. On the bottom is SBF.

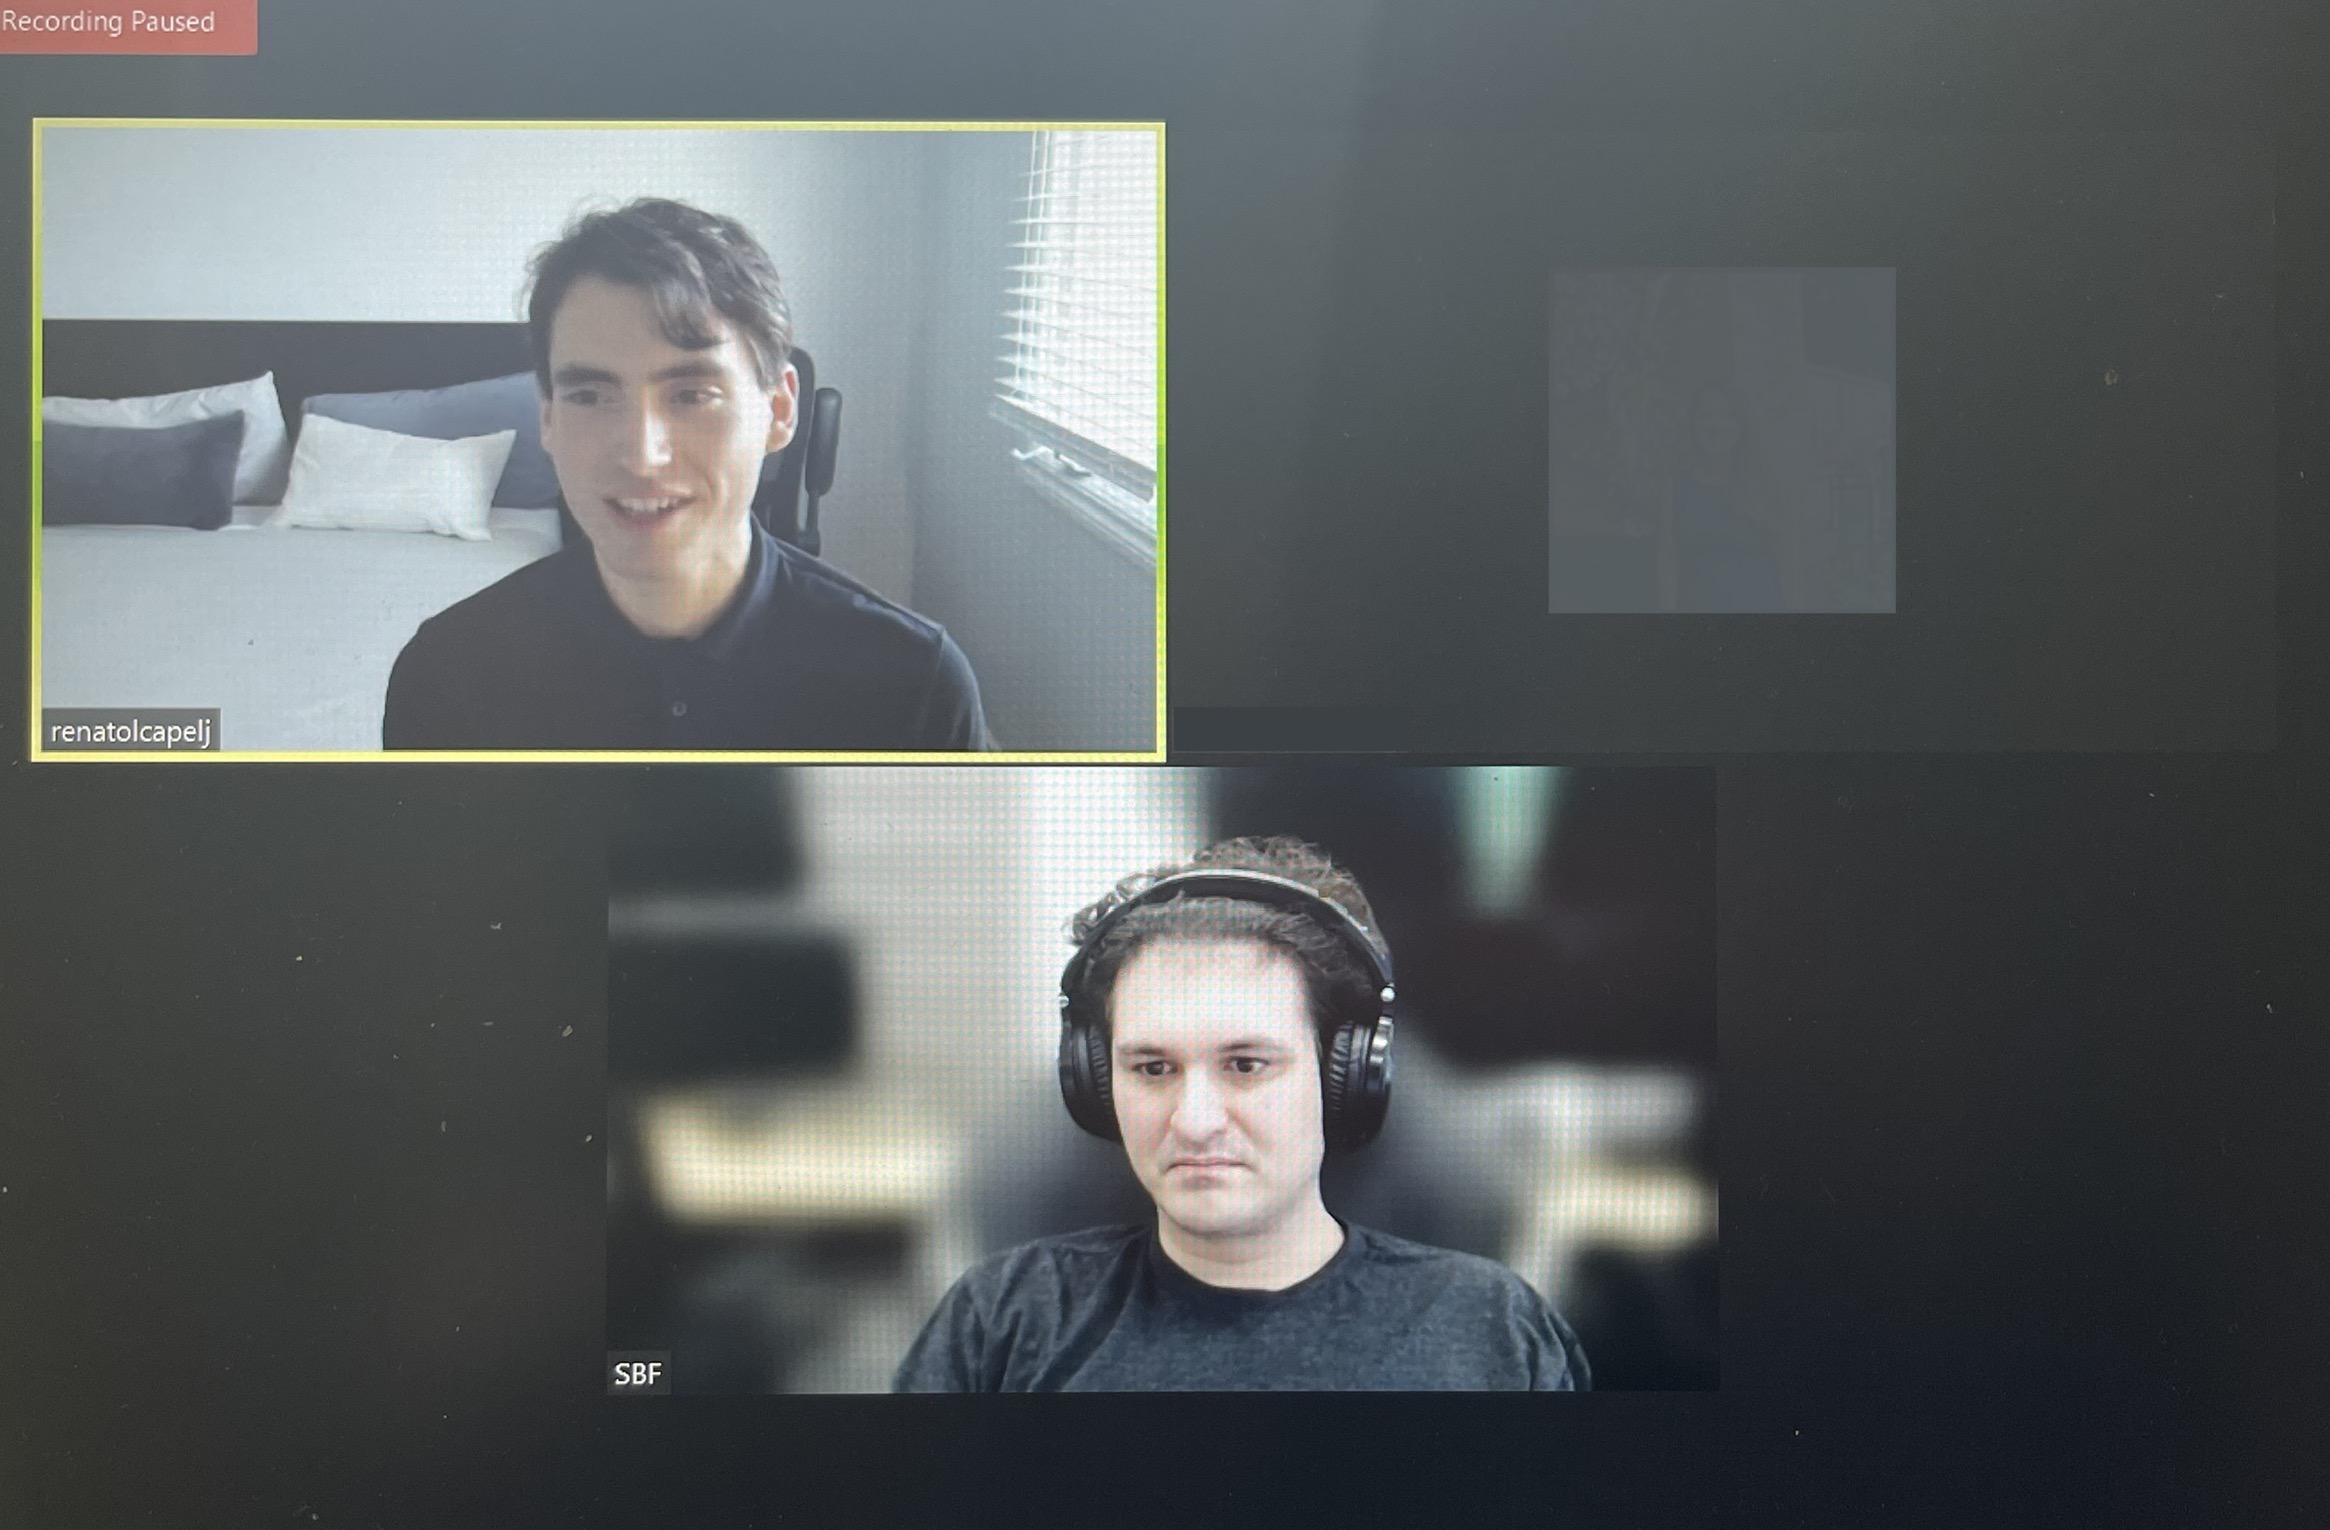
In short, SBF is an MIT alumnus who started in finance at Jane Street, a trading firm and liquidity provider. Eventually, he saw an opportunity elsewhere; there were spot price inconsistencies across cryptocurrency exchanges.

SBF then founded the firm Alameda Research in 2017. A focus, there, was to extract premiums to spot via arbitrage. SBF et al would purchase Bitcoin (CRYPTO: BTC) domestically, send it to foreign exchanges to sell at higher prices, and, then, convert and wire the funds back. 

​​“You do have to put together this incredibly sophisticated global corporate framework in order to be able to actually do this trade,” SBF said in one conversation. “That’s the real task, the real hard part.”

In light of some frustration with existing exchange offers, SBF founded FTX.com and FTX.US parent FTX Trading Ltd. As late as September 2022, FTX was seeking $1 billion at a value of $32 billion. The firm was looking to become a one-stop-shop for retail and institutional market participants such as FTX brand ambassador and spokesperson Kevin O’Leary who I talked to just prior to my interview with SBF.

“If you’re being compliant internally and also with regulators in each jurisdiction you operate in, you don’t have the option to be off-sides,” O’Leary explained to me on FTX building one of the larger infrastructures institutions’ compliance departments could easily “work with and external auditors can audit.”

Eventually, the exchange grew to become a major player.

FTX was a top-five exchange, adding market share through acquisitions of players like Blockfolio and LedgerX, as well as building a reputation of transparency, or so it appeared, through its work with regulators.

Adding, SBF said to me he wanted FTX to cater to other asset classes and “become a global liquidity venue across the board.” In mid-to-late this year, FTX added stock trading via no-fee brokerage accounts, a follow-through on his vision.

The expansion narrative cooled, however. There was the collapse of the TerraUSD stablecoin, Celsius Network, Three Arrows Capital, and Voyager Digital, which FTX’s subsidiary in the US, FTX.US, won assets to in an auction this year.

At the surface, it appeared FTX was “seemingly untouchable,” as Immutable Holdings’ Jordan Fried explained online. Check out my last chat with Jordan Fried, here.

However, “cracks started to appear [and] people in crypto were taking notice”; the CEOs of both Alameda Research and FTX.US stepped down. Fried added that the situation worsened when Alameda Research’s balance sheet was leaked.

The firm had $14.6 billion in assets (nearly $4 billion in FTT, which is FTX’s utility token, and about $2 billion in FTT token collateral) against $8 billion in liabilities.

“Binance owns a bunch of FTT themselves and, two days ago, Changpeng Zhao (CZ) [who is the] founder of Binance, [said] that SBF … could be lobbying to get regulators to help out FTX more than Binance.” In response, CZ was to “dump all $2 billion of FTT” Binance was holding.

This coincided with a large selling pressure on the FTX utility token. With Alameda Research having ~50% of their assets in FTT, Fried says, “they were dead in the water”. A run appeared likely and, with FTX and Alameda Research’s dealings so intertwined, “the failure of one meant the failure of another.”

On the heels of billions in withdrawals, users weren’t “getting their cash” and, ultimately, in SBF seeking to protect users’ assets, FTX entered into a strategic transaction with Binance.

The follow-on impacts of this week’s events, during which SBF saw a ~90% wipeout of his wealth, can be speculated on. Apparent losers include SoftBank Group Corporation’s (OTC: SFTBY) Vision Fund, the Ontario Teachers’ Pension Plan, and Tiger Global Management.

Some, including Arthur Breitman of Tezos (CRYPTO: XTZ), mulled the impact of FTX’s potential divestment from Solana (CRYPTO: SOL) which “took a drubbing Tuesday,” along with just about every other crypto token including Bitcoin.

Graphic: Retrieved from Bloomberg.

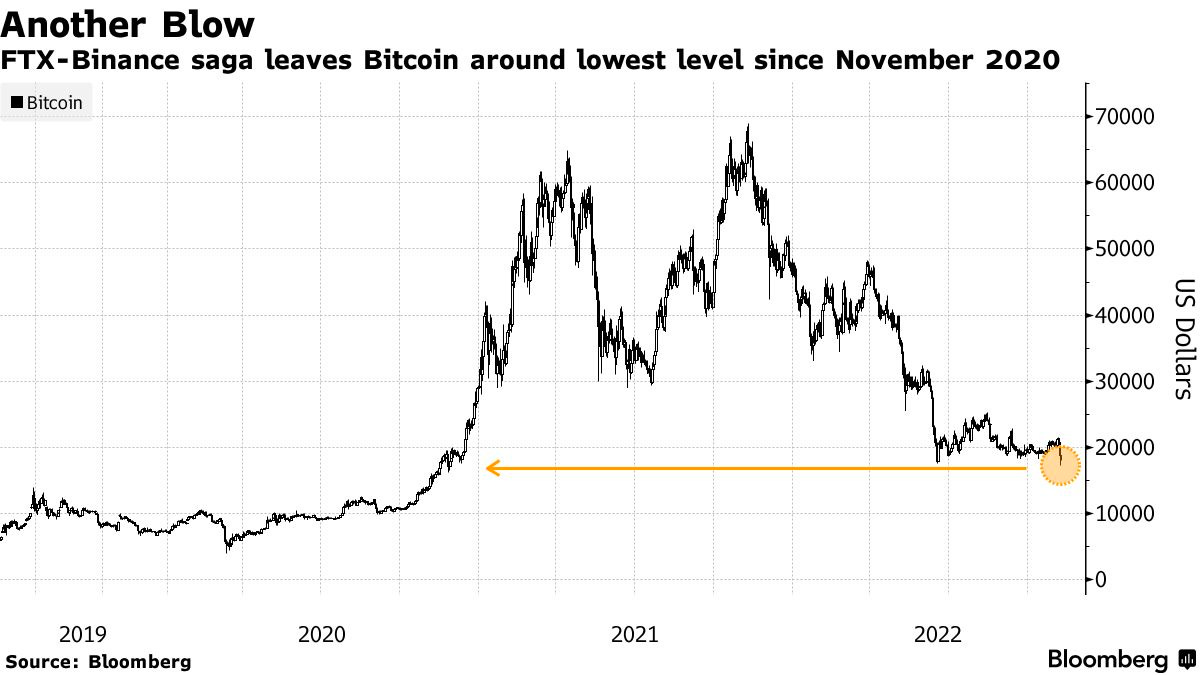
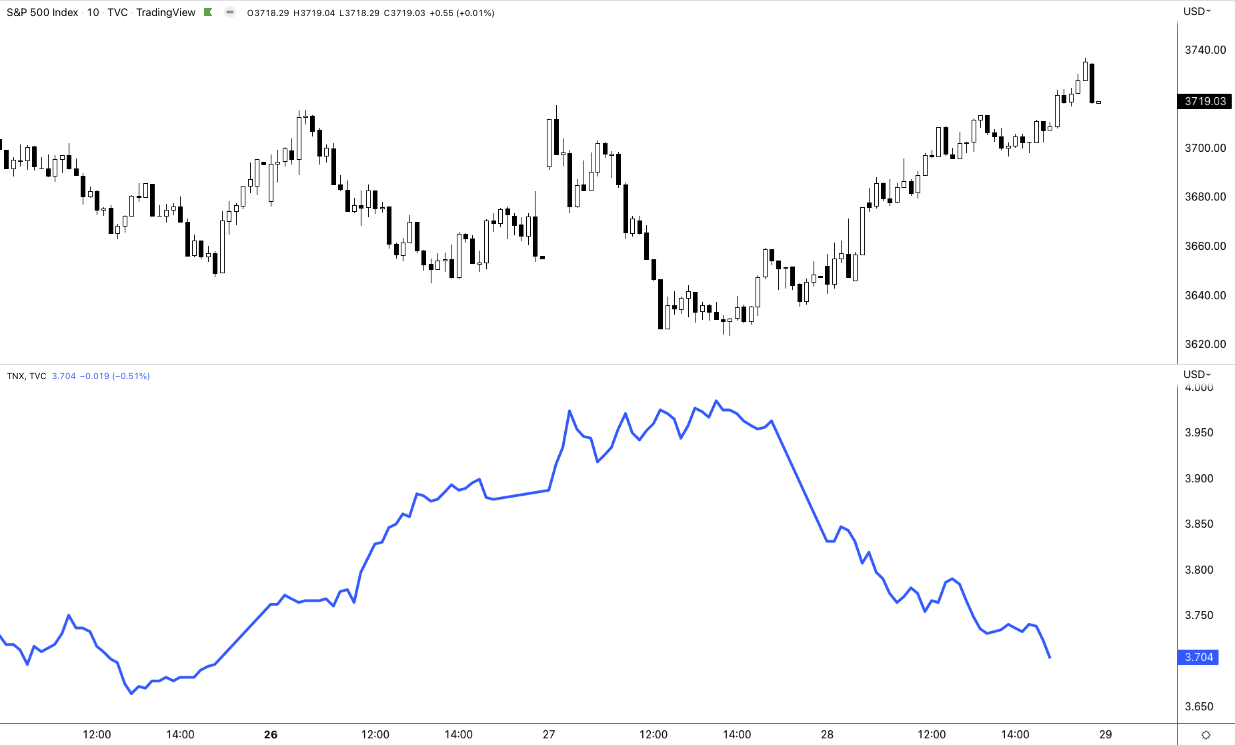
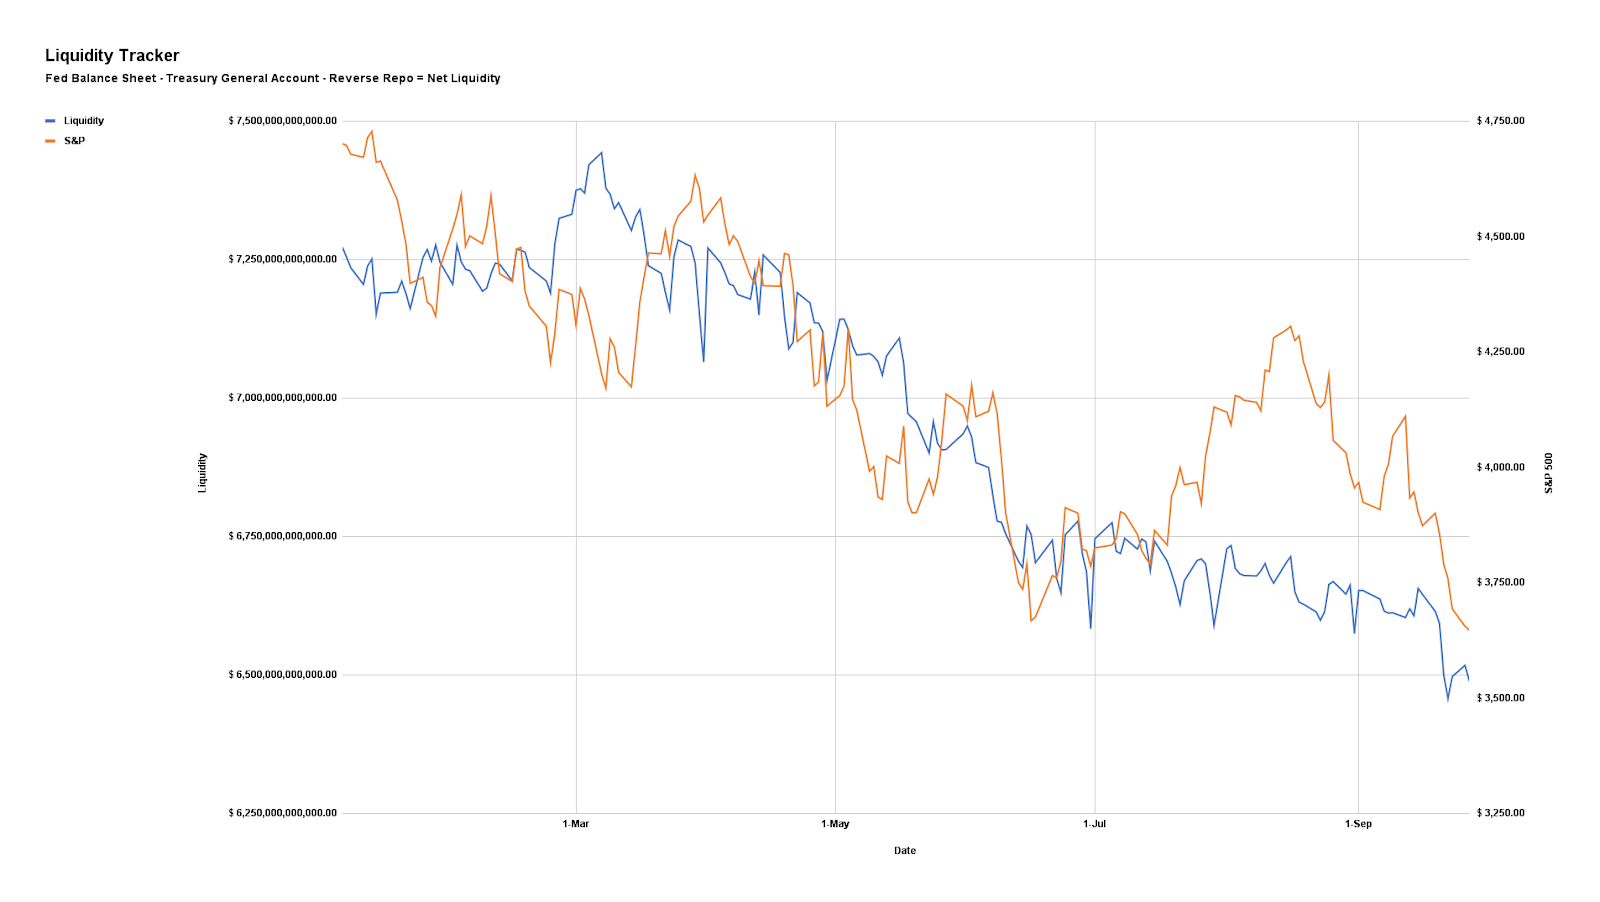
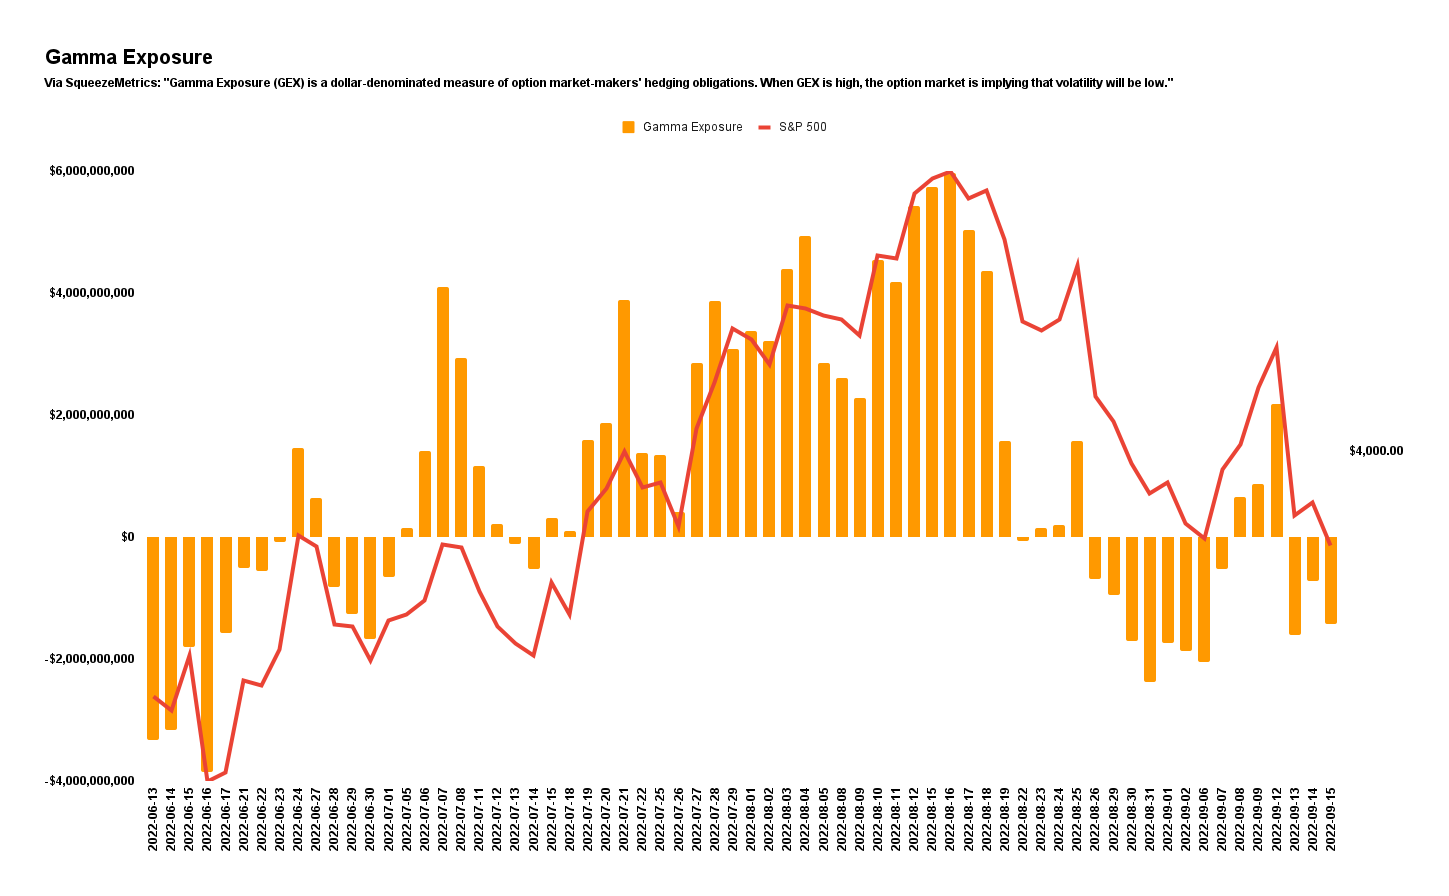
Noteworthy are the impacts of this crypto-market turmoil in equities. As I stated in a note to SpotGamma subscribers yesterday, following “news of a liquidity crunch at FTX, when the selling accelerated in FTT [] and Bitcoin, so did the selling in the S&P 500.”

“The bottom, in all three products, happened at 2:30 PM ET.”

Graphic: Retrieved by Physik Invest from TradingView.

I add that these products – S&P 500 (INDEX: SPX) and Bitcoin – have traded in sync and held positive correlations.

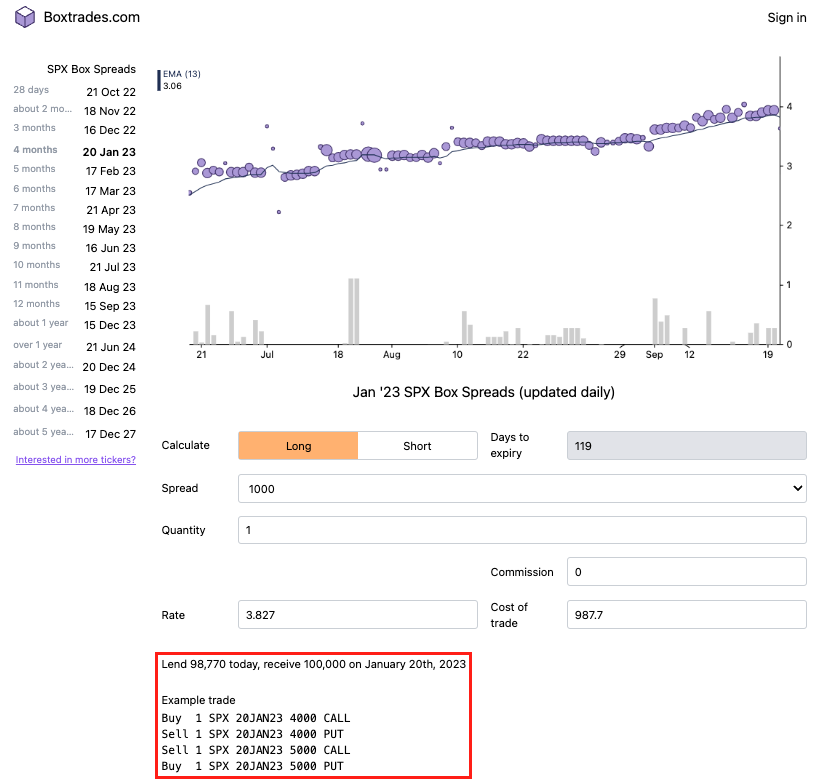
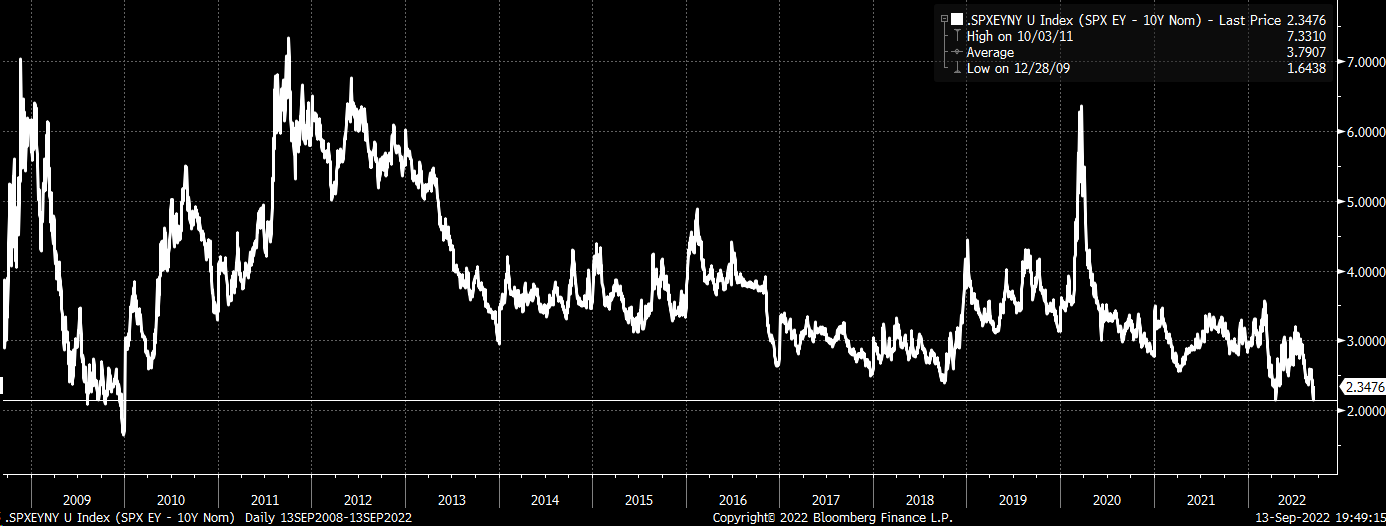
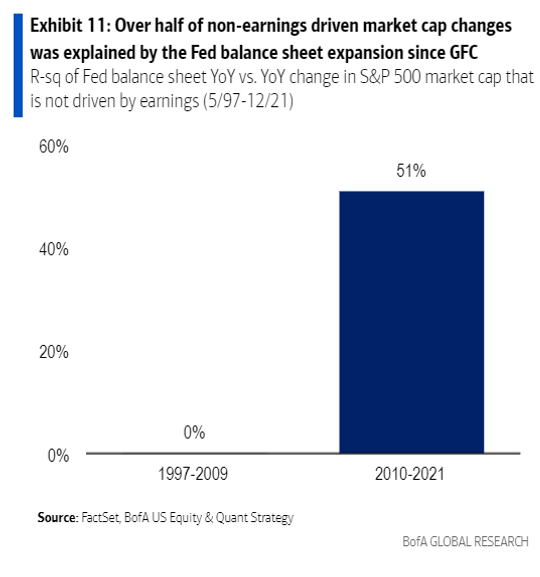
In short, both are recipients of the same risk-on and -off flows. Easy monetary policies cut financial asset volatility and pushed market participants into riskier investments. In short, it was easier to borrow and make longer-duration bets on ideas (e.g., crypto and Ponzi-like DeFi, growth, risky private equity investments) with a lot of promise in the future. 

Financial asset investments were more attractive. That’s, in part, why we saw asset inflation early on in 2020 when policymakers embarked on historic interventions.

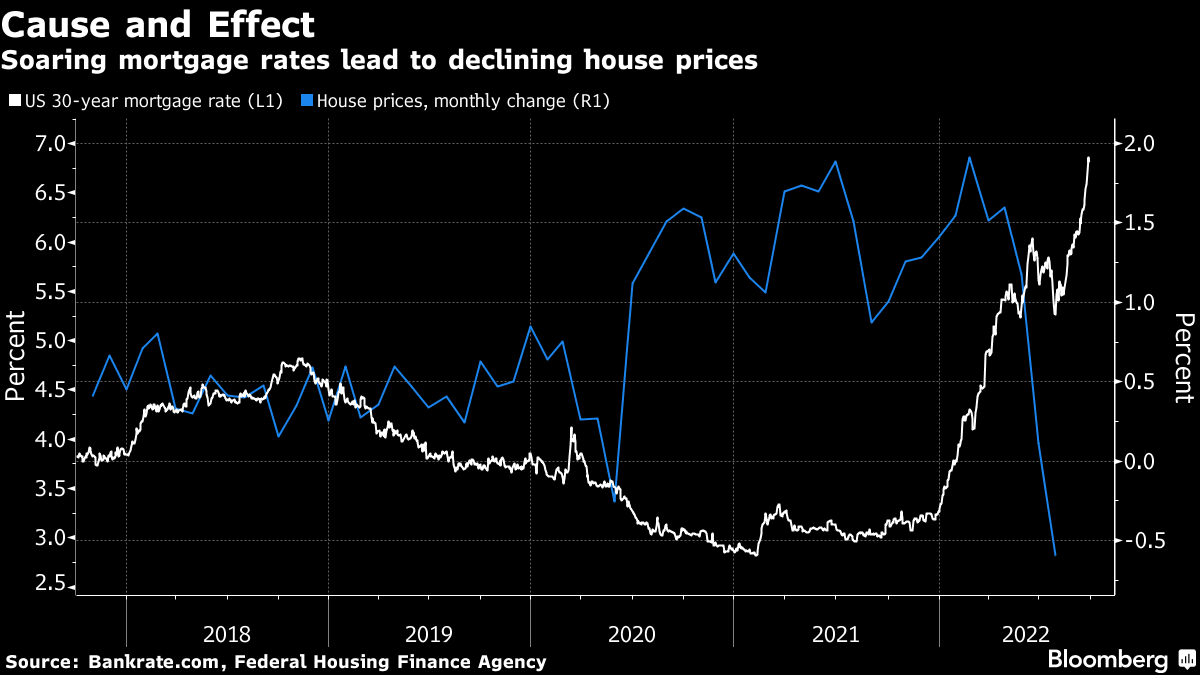
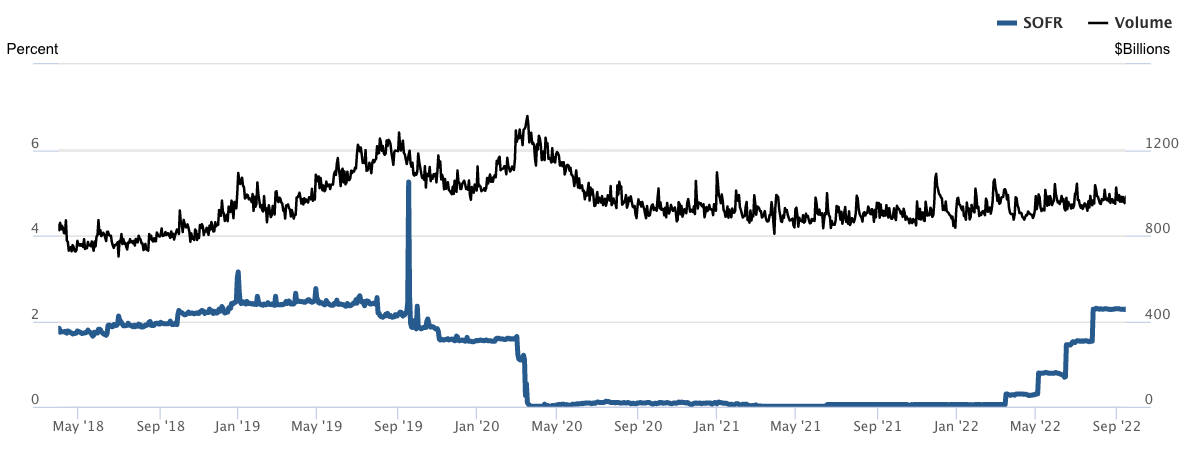
Monetary authorities cut interest rates and bought bonds, all the while money was sent to people. Risk assets were the first to respond. Then, as the economy reopened, demand picked up, supply chains tightened, and prices in the real economy inflated.

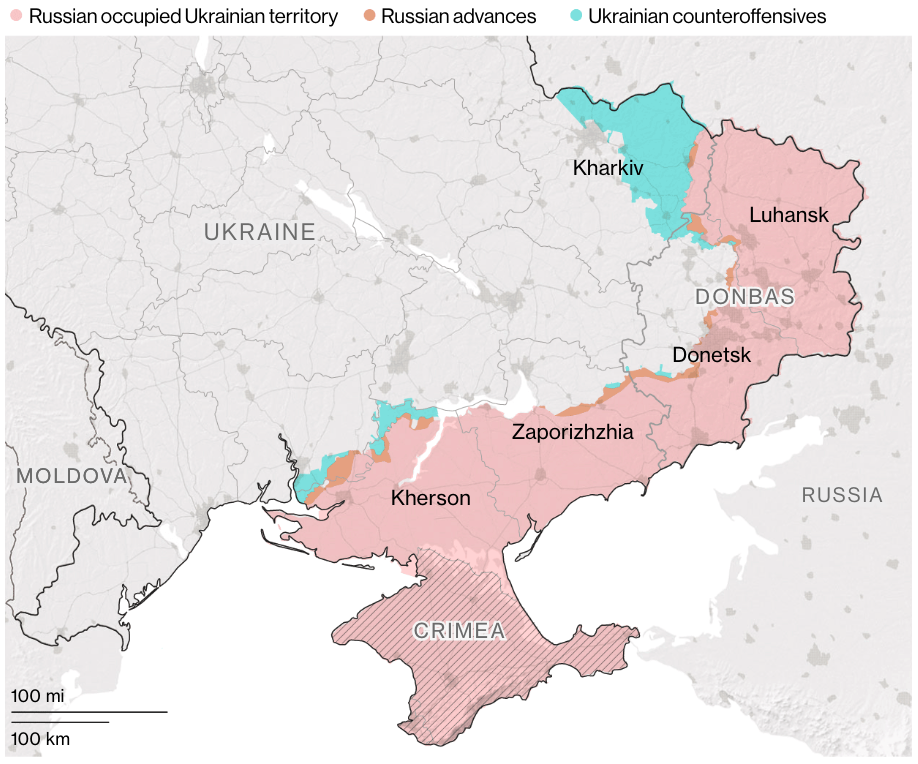
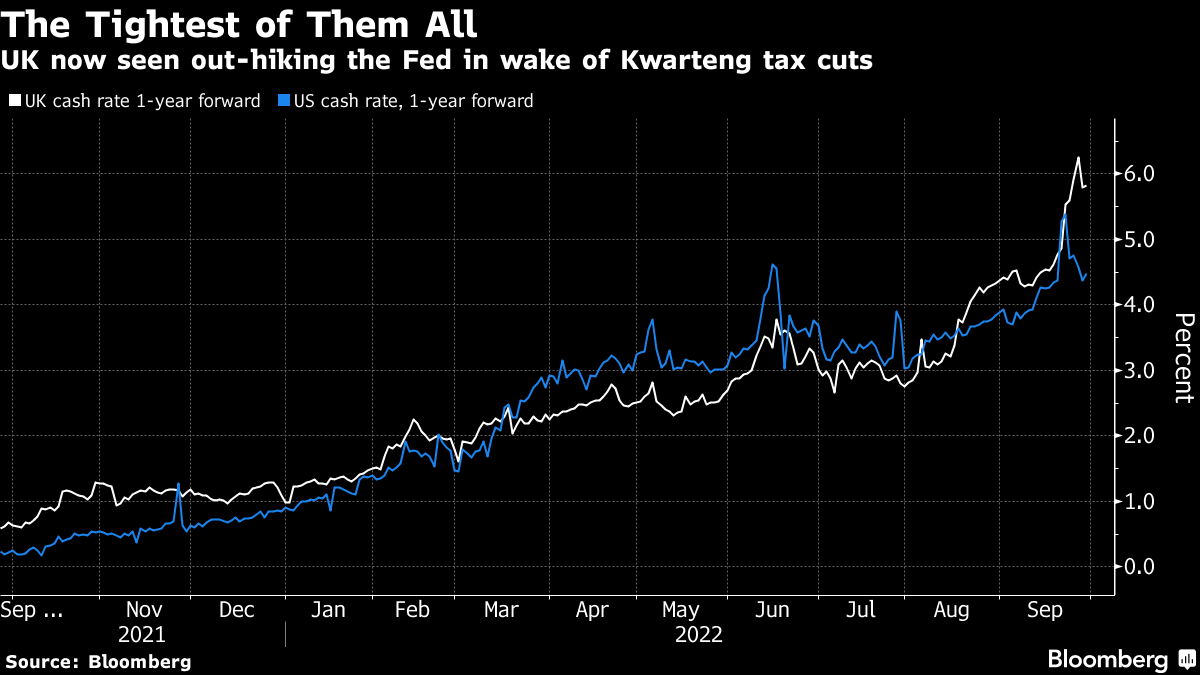
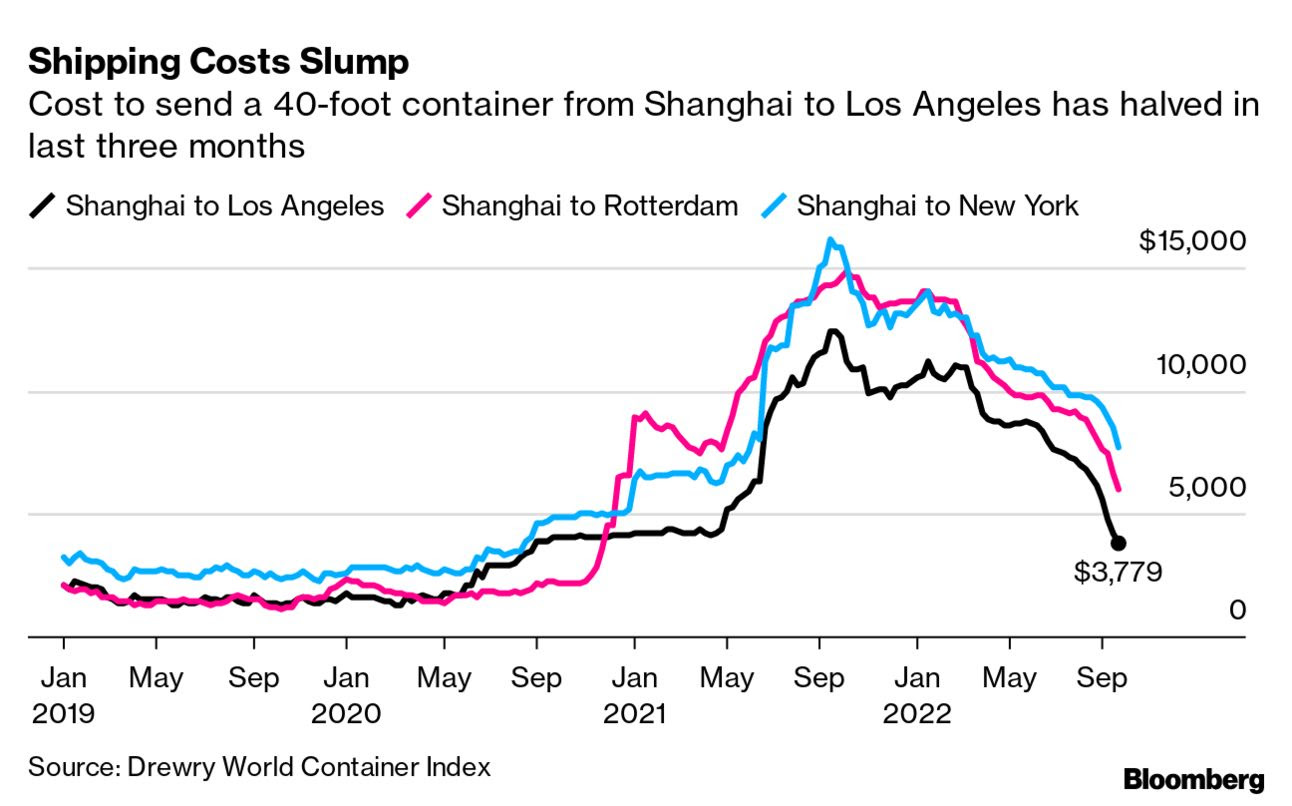
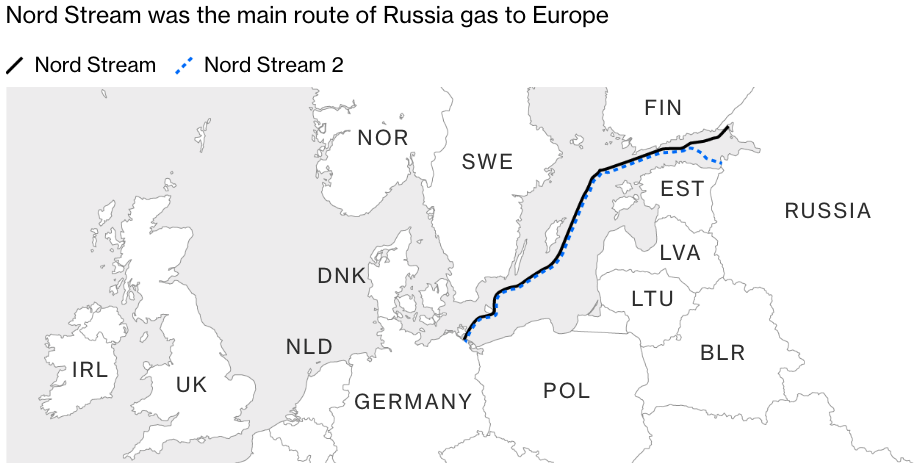
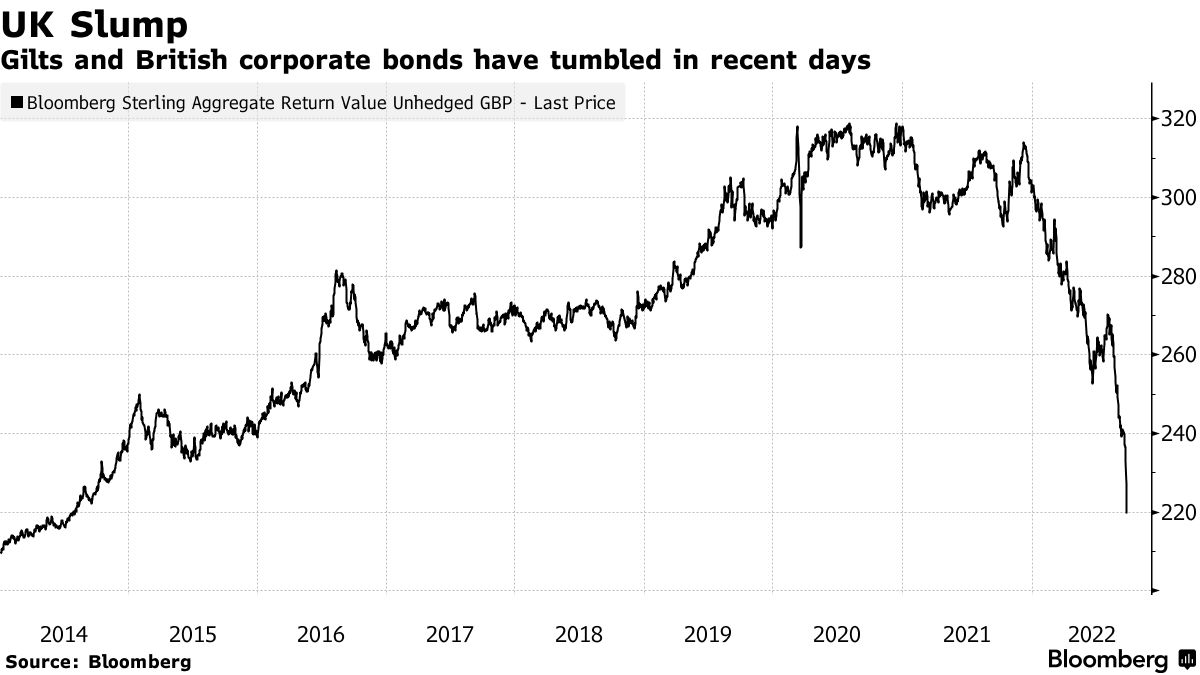
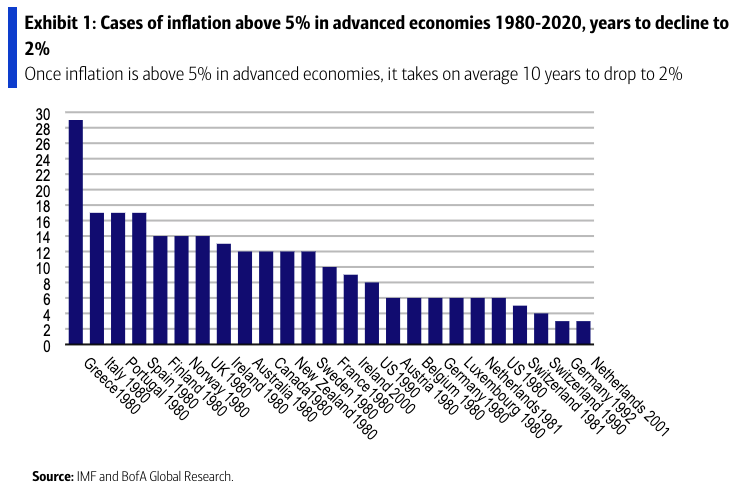
As we added on Monday, de-globalization and persistent supply chokepoints (e.g., Ukraine and Russia) have done little to help. Inflation remains a problem and investors are seeking safety amid Fed intervention. 

Financial assets are in less demand while real assets are in more demand. A disruption (or reversal) in these policies puts at risk the prevailing carry regime. A stock and crypto market drop is, in part, the result of an unwind in carry. 

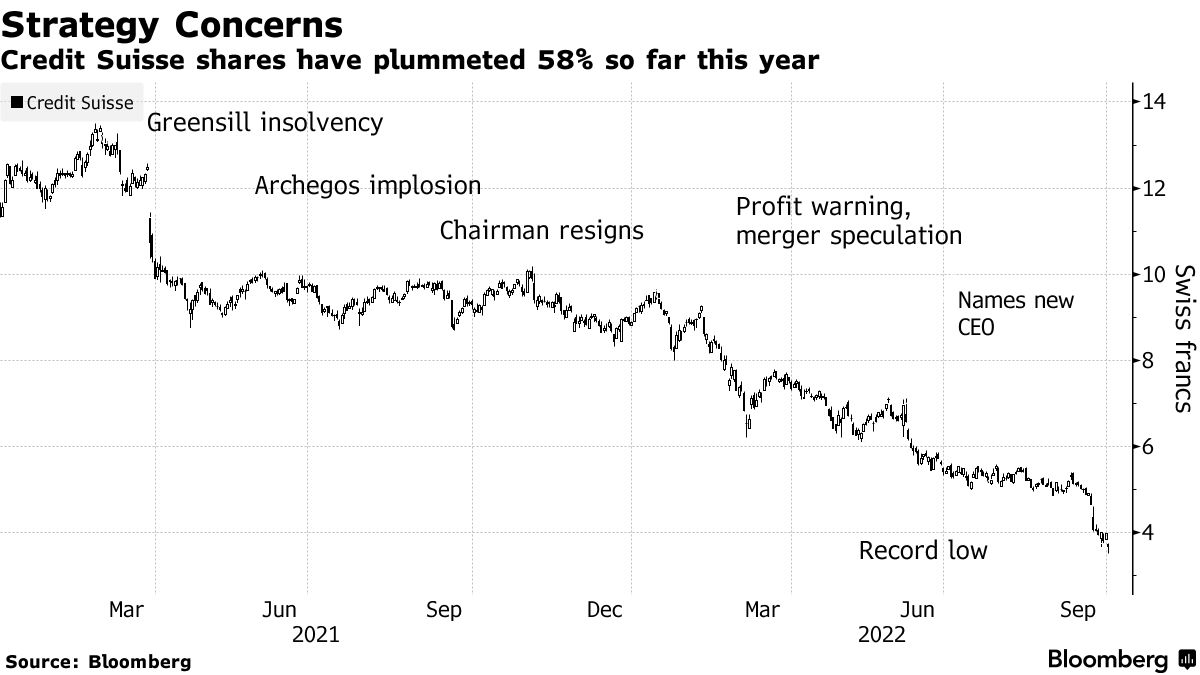
The drop is a deflationary shock, precisely what policymakers are seeking, per Credit Suisse Group AG’s (NYSE: CS) Zoltan Pozsar who says inflation is a structural issue, and “we [have] to generate a round of negative wealth effects to lower demand such that it becomes more in line with the new realities of supply.” 

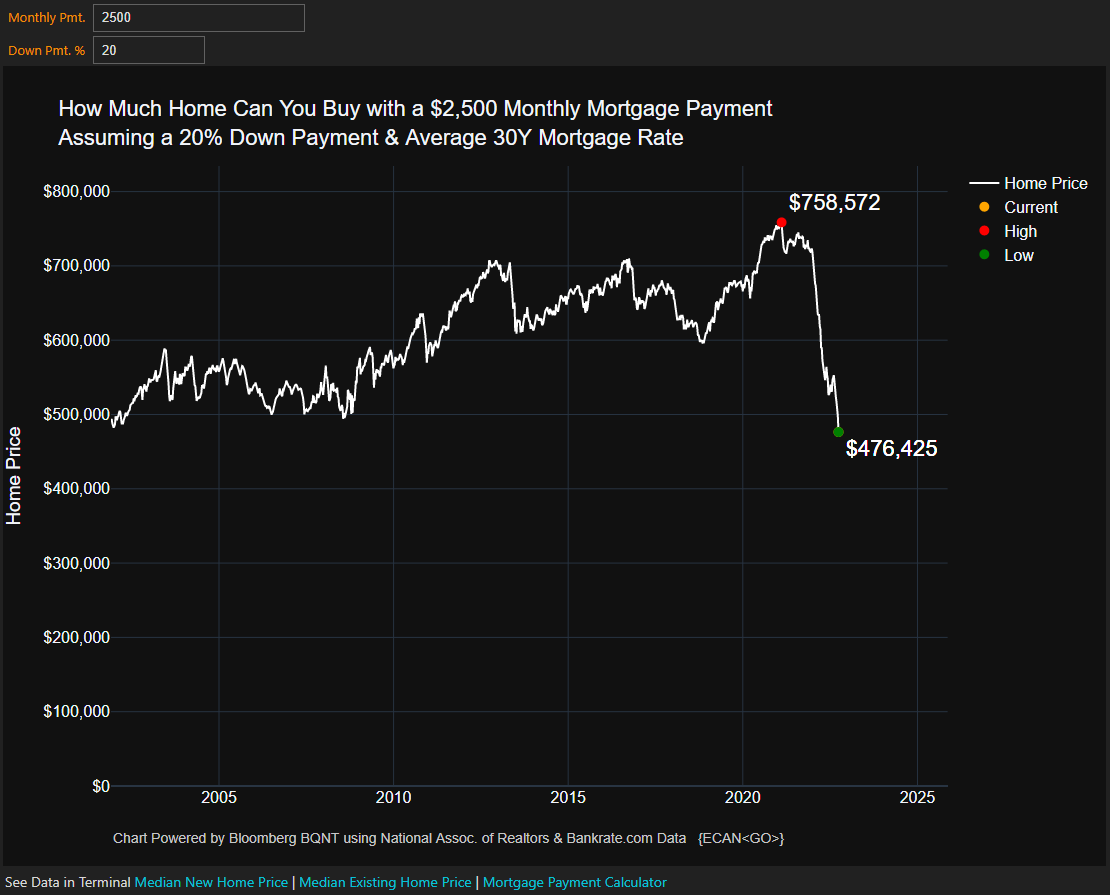
As we established on Monday, that invokes “collateral damage to the US economy,” S&P Global Inc (NYSE: SPGI) economists have put forth “as households and businesses pull back spending and investment.” 

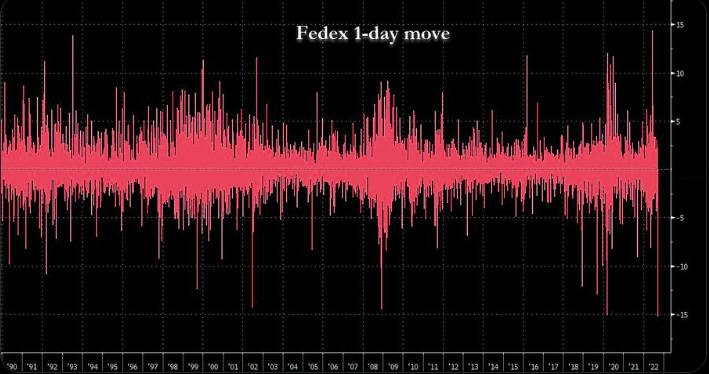
For example, just announced today, Meta Platforms Inc (NASDAQ: META), which became wrapped up in the speculativeness of the early 2020s reaching beyond the crypto markets, hence the name change from Facebook Inc, is seeking to cut 11,000 jobs.

Per Bloomberg, “the macroeconomic downturn, increased competition, and ads signal loss have caused [] revenue to be much lower than expected.”

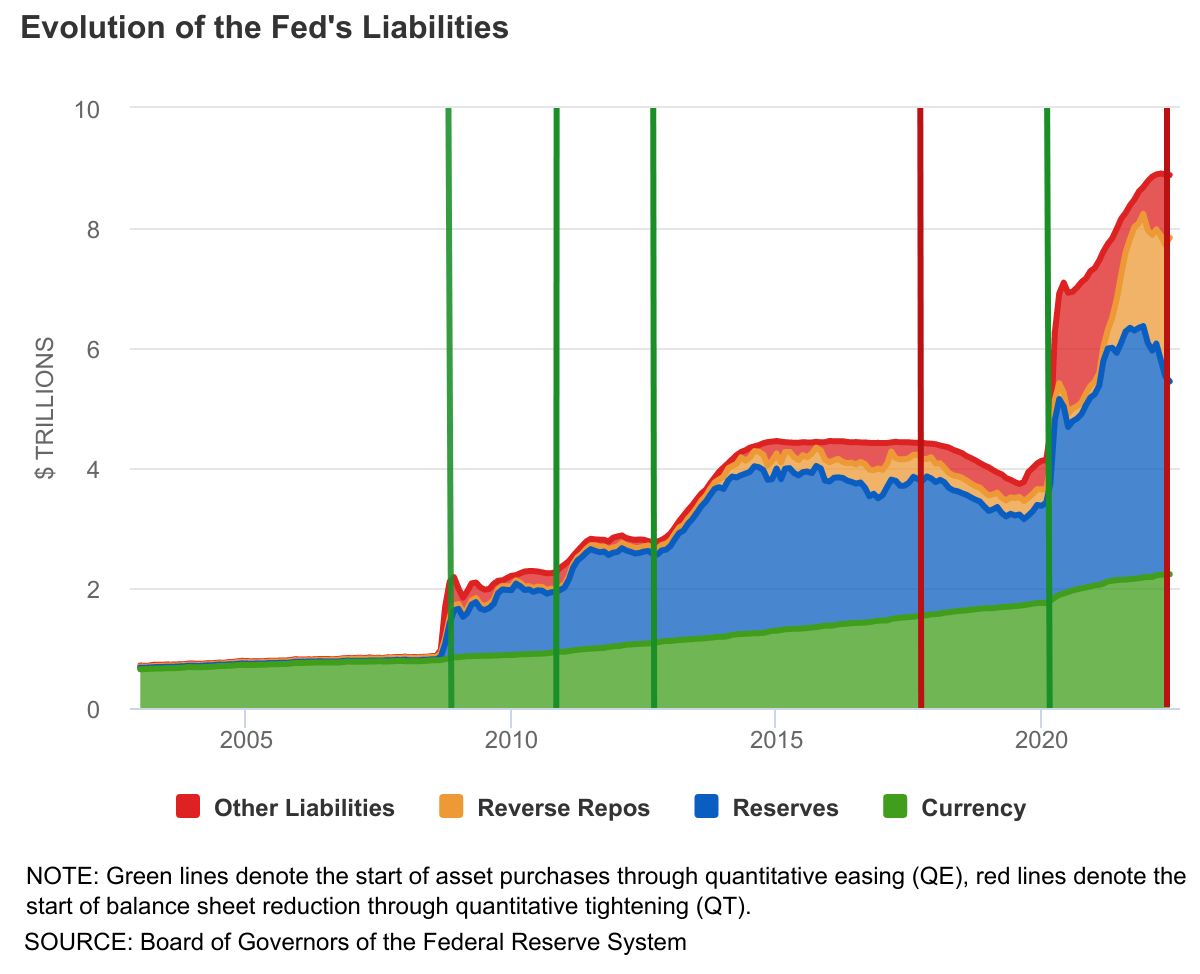
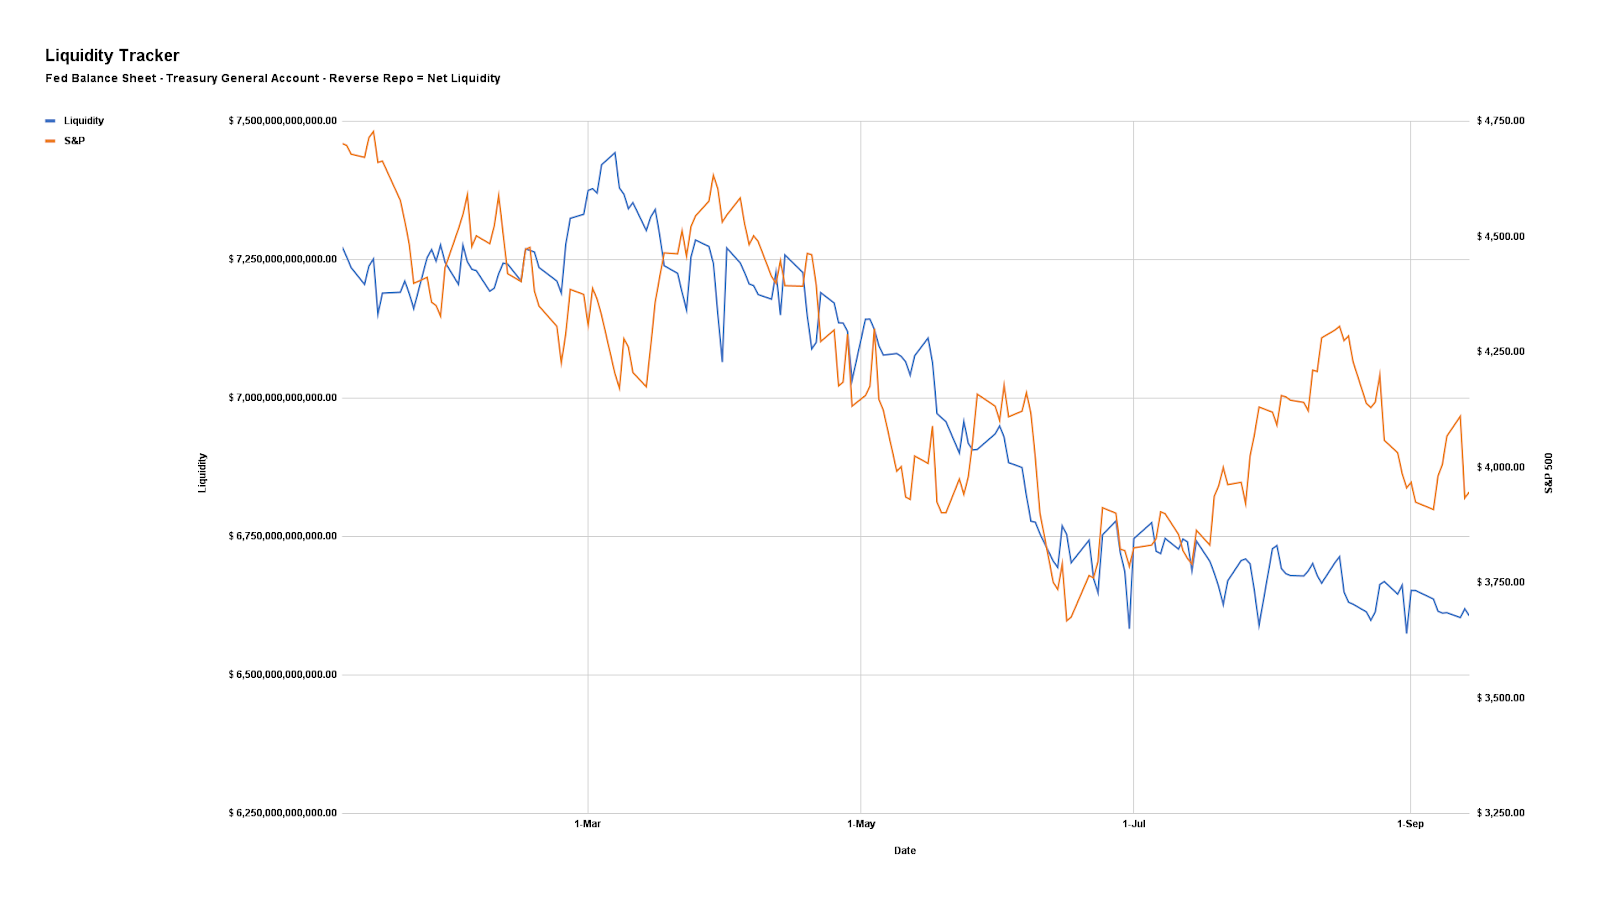
Ultimately, a deflationary pulse manifesting disinflation in consumer prices may prompt the policymakers to reverse on rates and efforts like quantitative tightening (QT), the (out)flow of capital from capital markets.

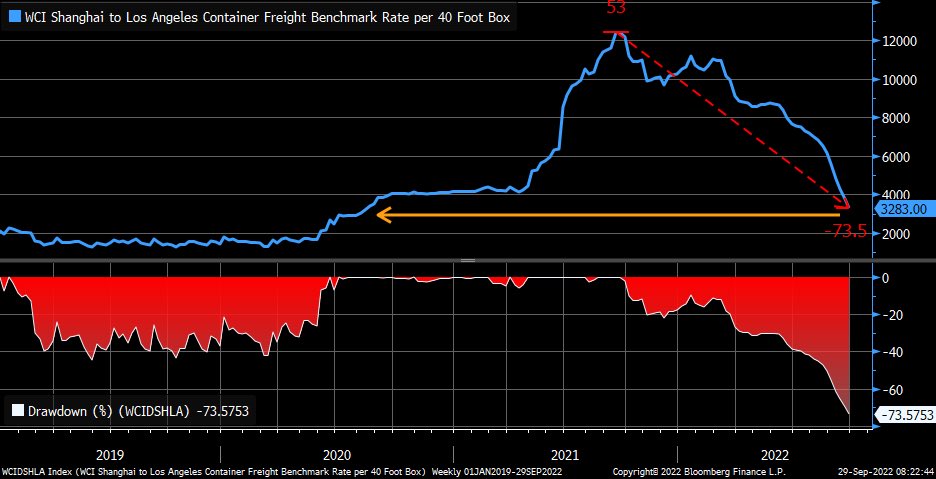
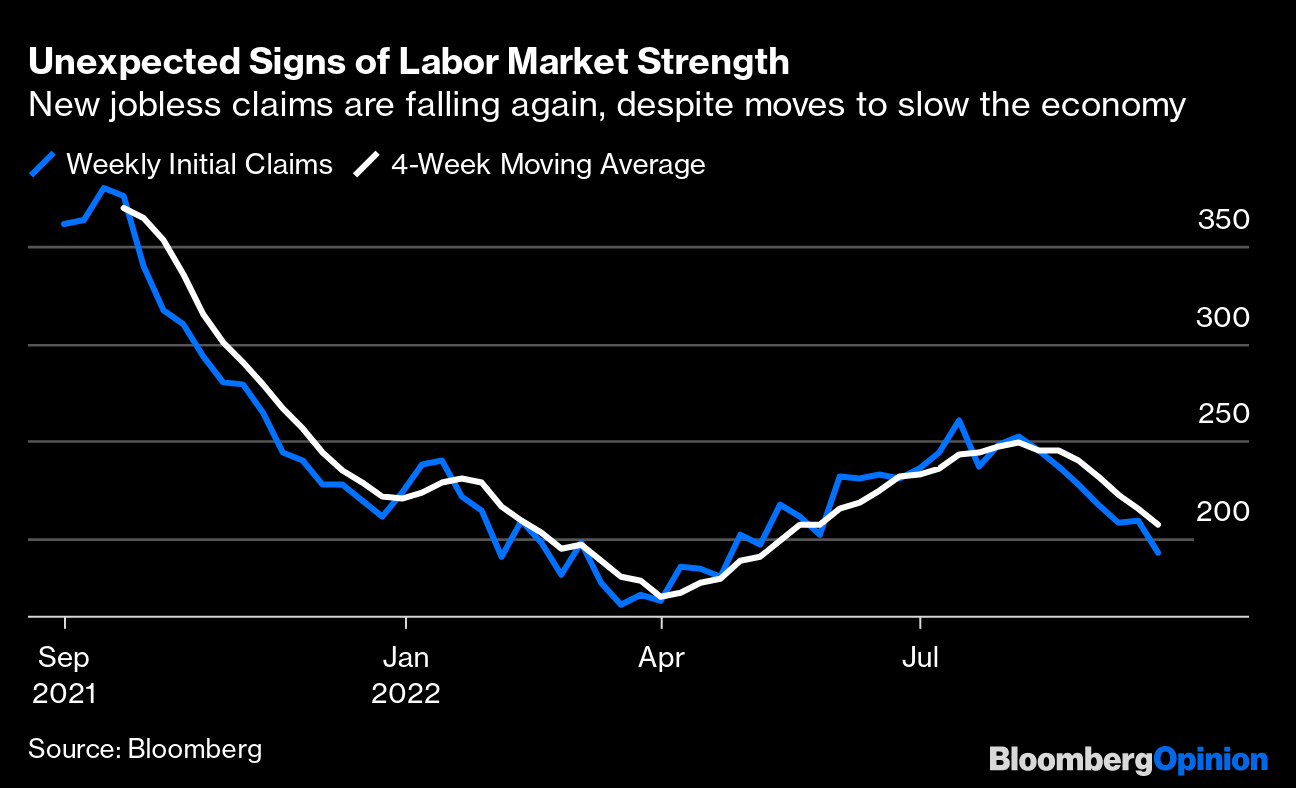
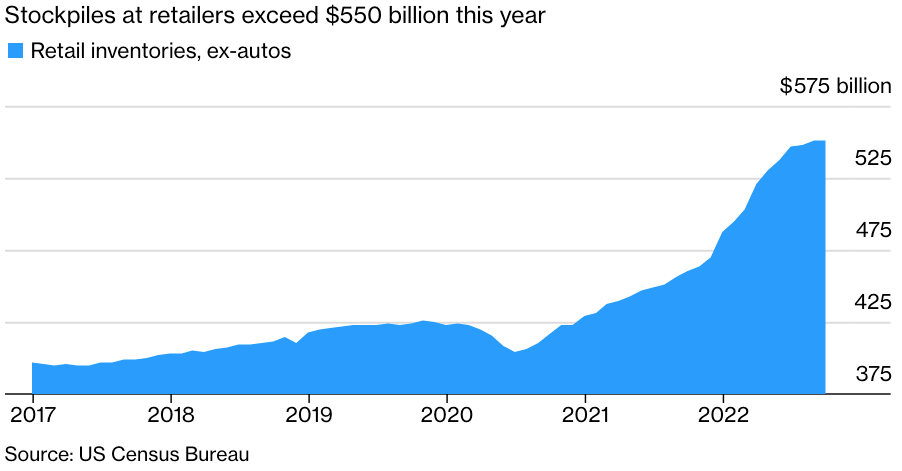
We’re seeing demand erode and many businesses starting to suffer the effects of a switch to “just-in-case” from “just-in-time,” according to S&P Global Inc. Inventories (which are to be sold at a loss) are piling up and workers are needed less.

That’s a recession.

Graphic: Retrieved from Bloomberg. “The overhang is leading to canceled orders, a sharp slowdown in global trade growth and stagnating factory activity. On one hand, it’s good that logistics networks are seeing relief from the logjams that plagued the start of 2022 — ocean-shipping rates have tumbled close to pre-pandemic levels and delivery times are shortening.”

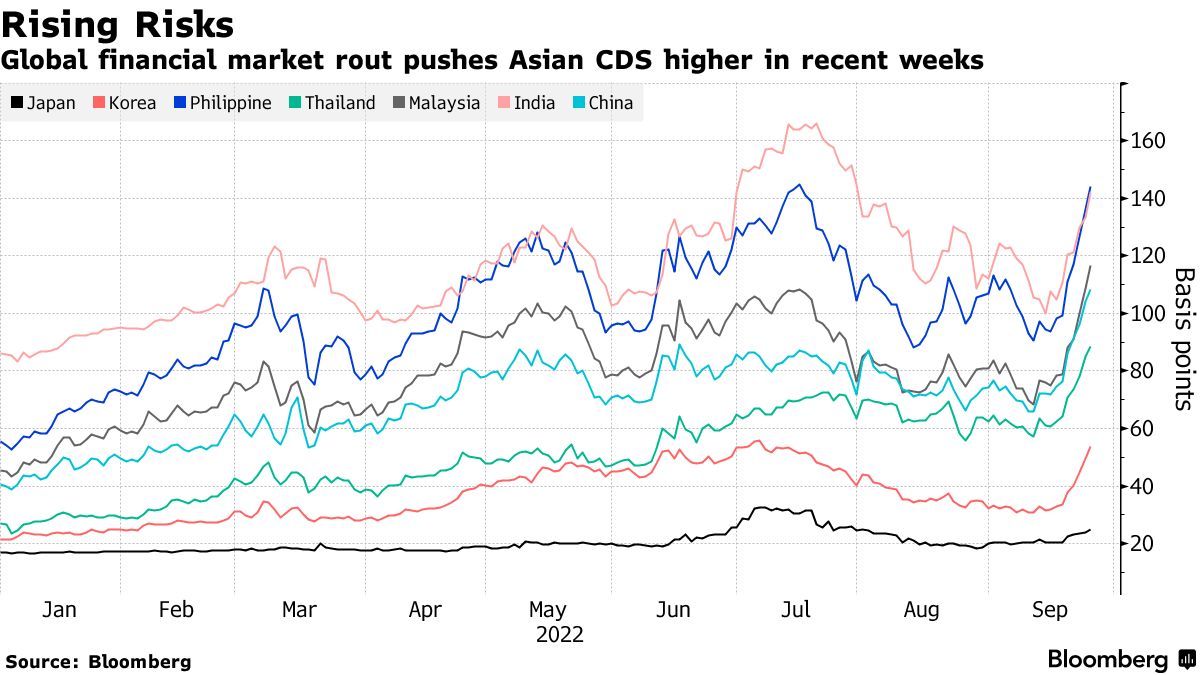
This said, the “risk of recession, whether it is real or merely implied by an inversion of the yield curve, won’t deter the Fed from hiking rates higher faster or from injecting more volatility to build up negative wealth effects.”

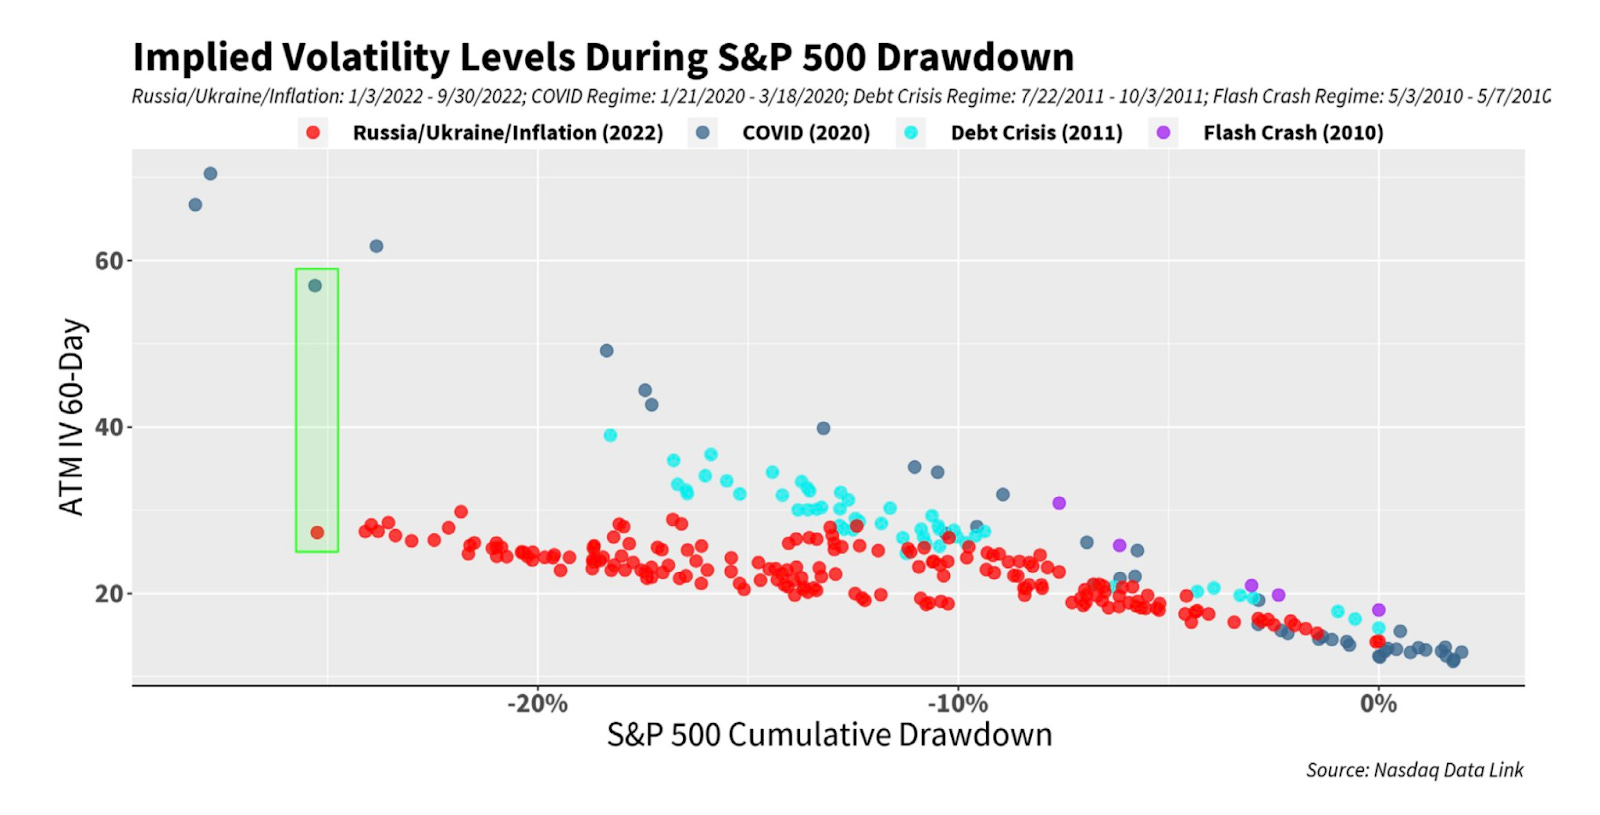
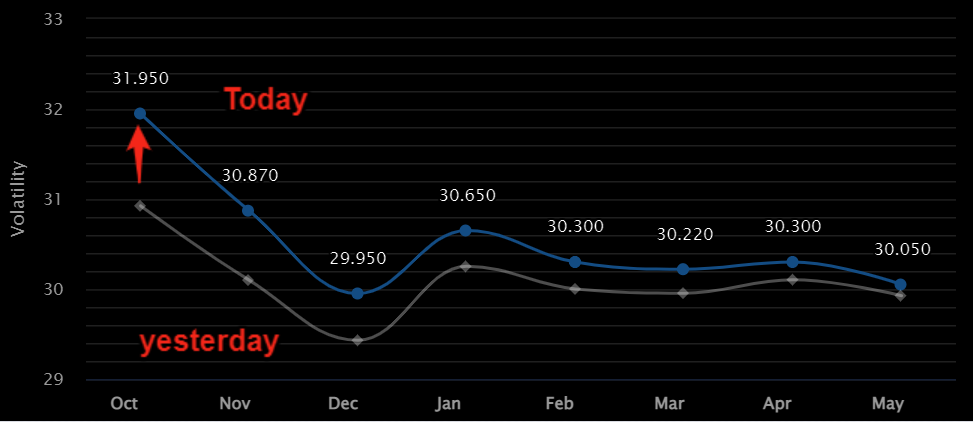
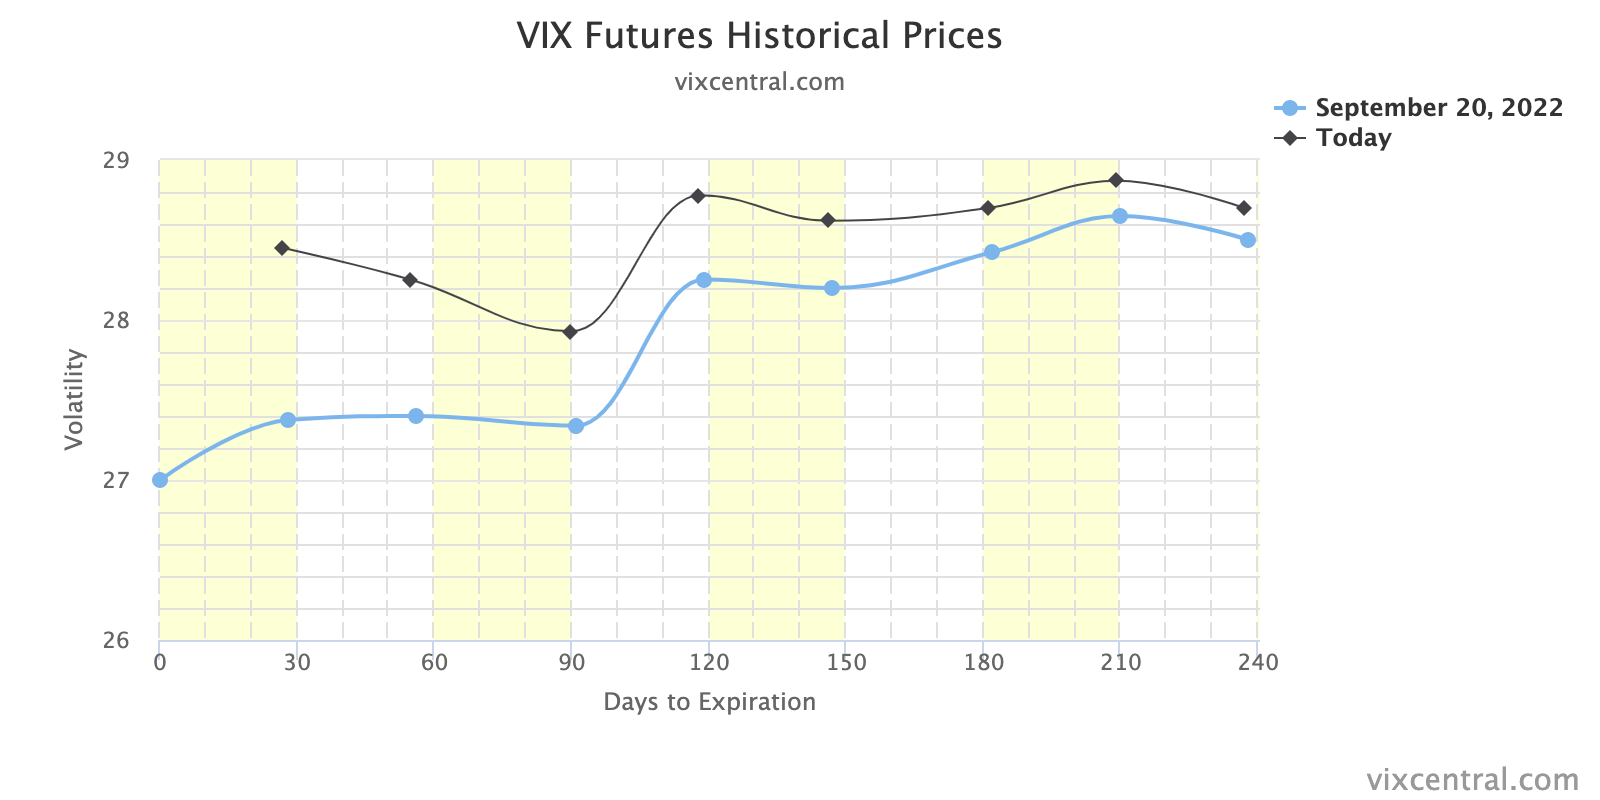
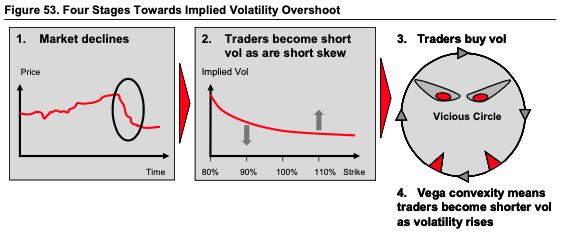
“Rallies could beget more forceful pushback from the Fed,” which is a concern given the poor performance in implied volatility (IVOL) that’s resulted in participants’ disinterest in maintaining their hedges this year; equities’ left tail is growing.

Graphic: Retrieved from Bloomberg. Initially created by QVR Advisors. “When shares drop, demand for fresh protection remains subdued given the unusually thin positioning among big money. At the same time, put owners quickly book profits, often leading to a drop in implied vol.

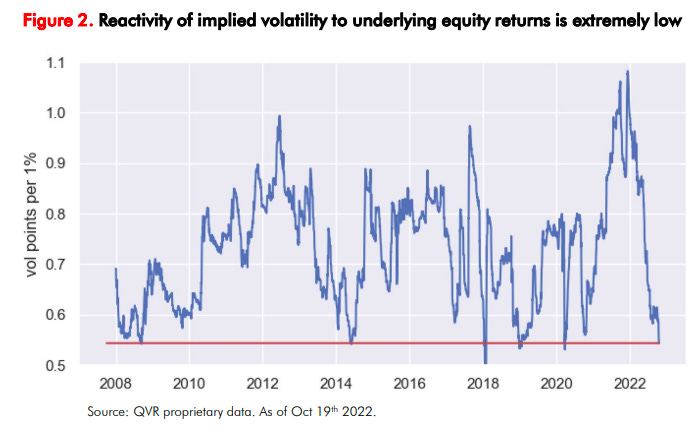
In summary, there’s no longer “a disinterest and unimportance to cash flows.” The commitment to reducing liquidity and credit has consequences on the real economy and asset prices which rose and kept the deflationary pressure of policies at bay.  

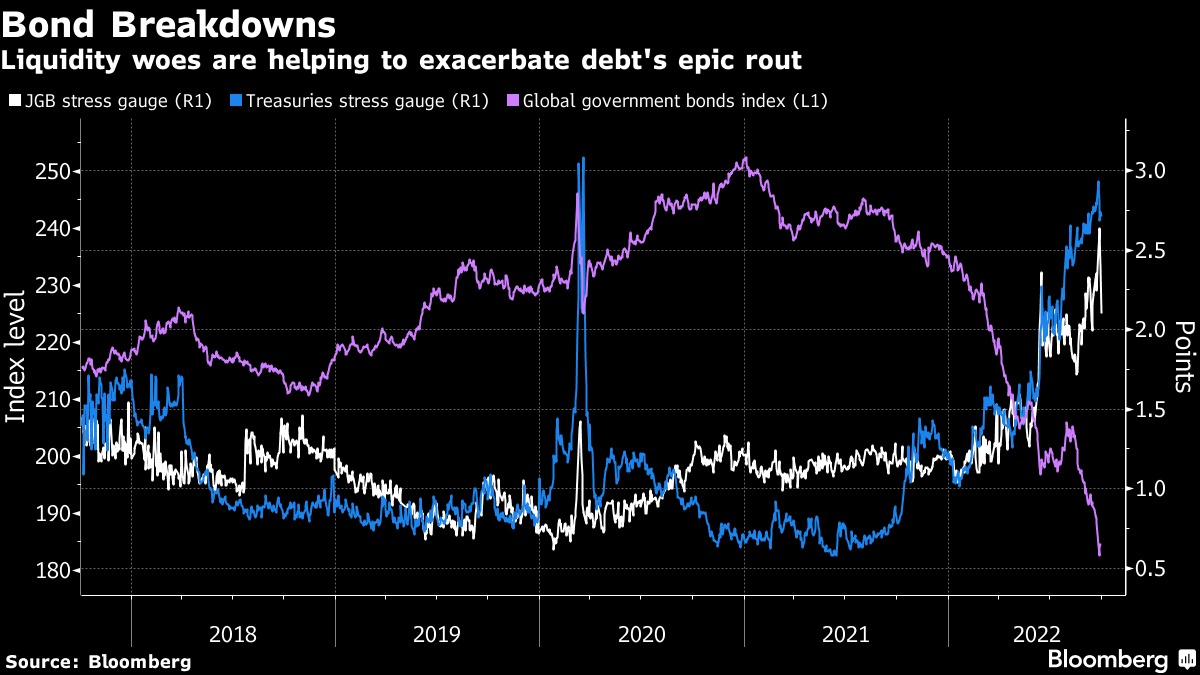
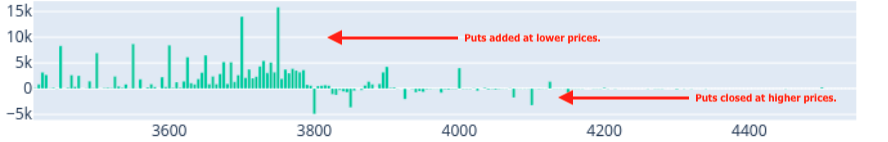
It is elevated volatility and persistent declines that are to prompt investors to lower their selling prices in risk(ier) assets (e.g., options bets, metals, cryptocurrency and stablecoins, equities, bonds), and compete for cash.
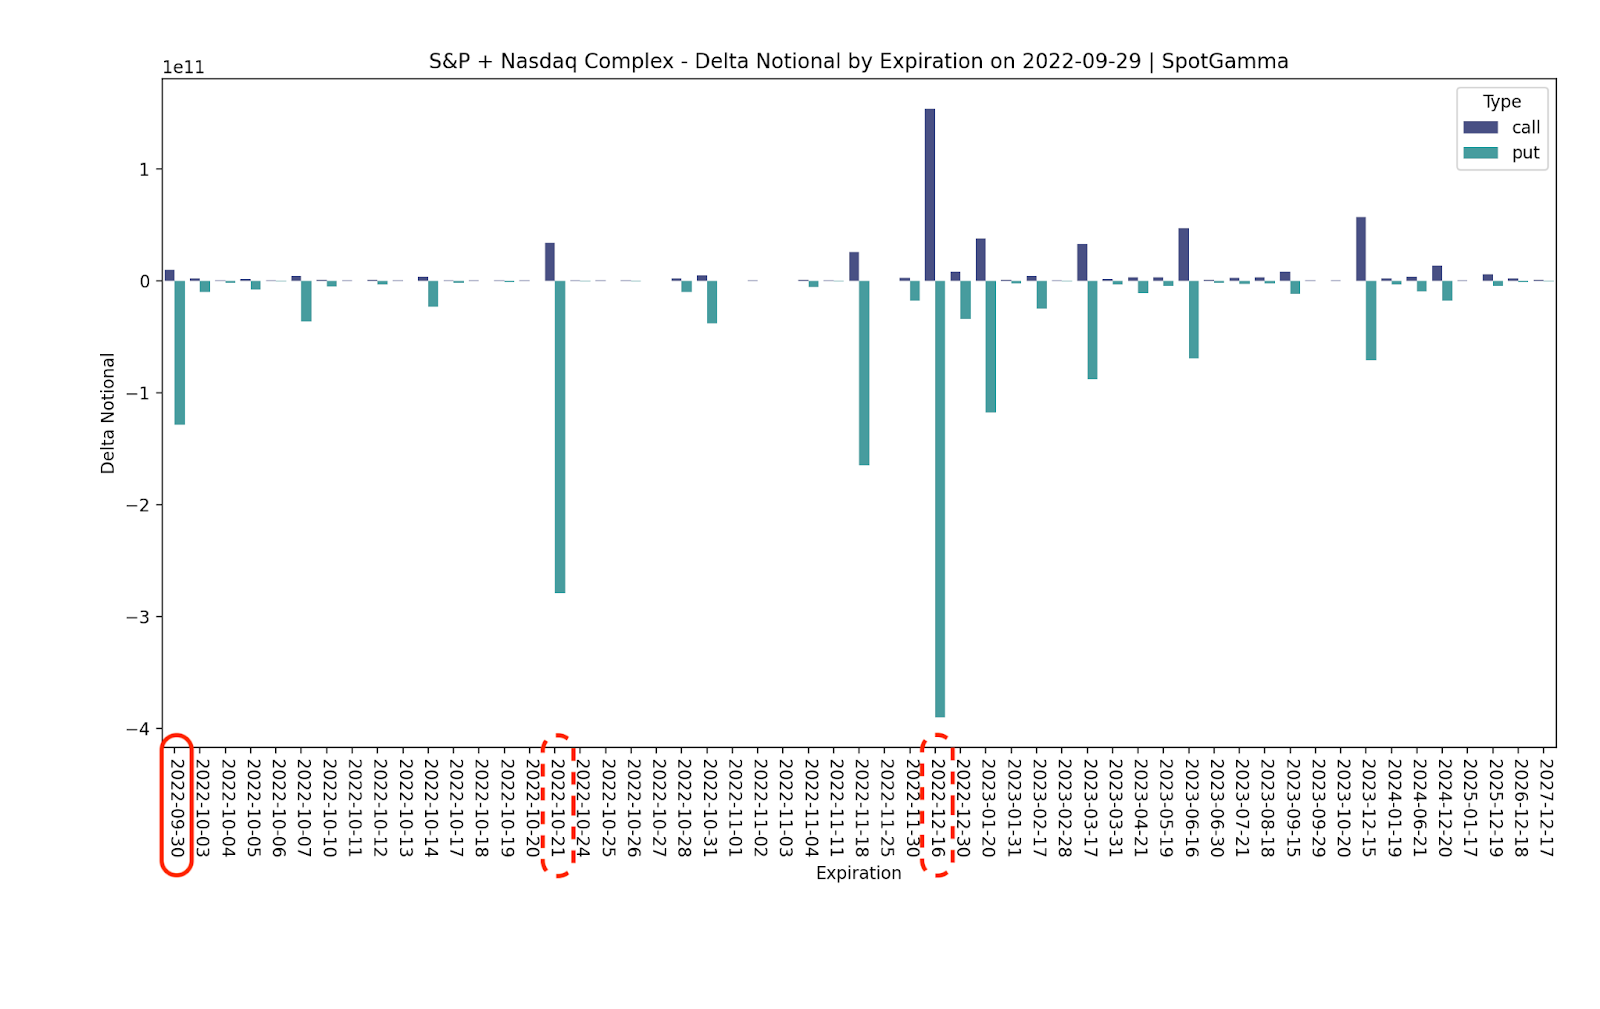
Positioning

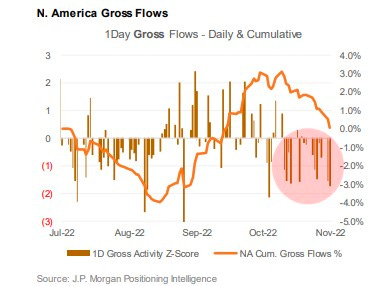
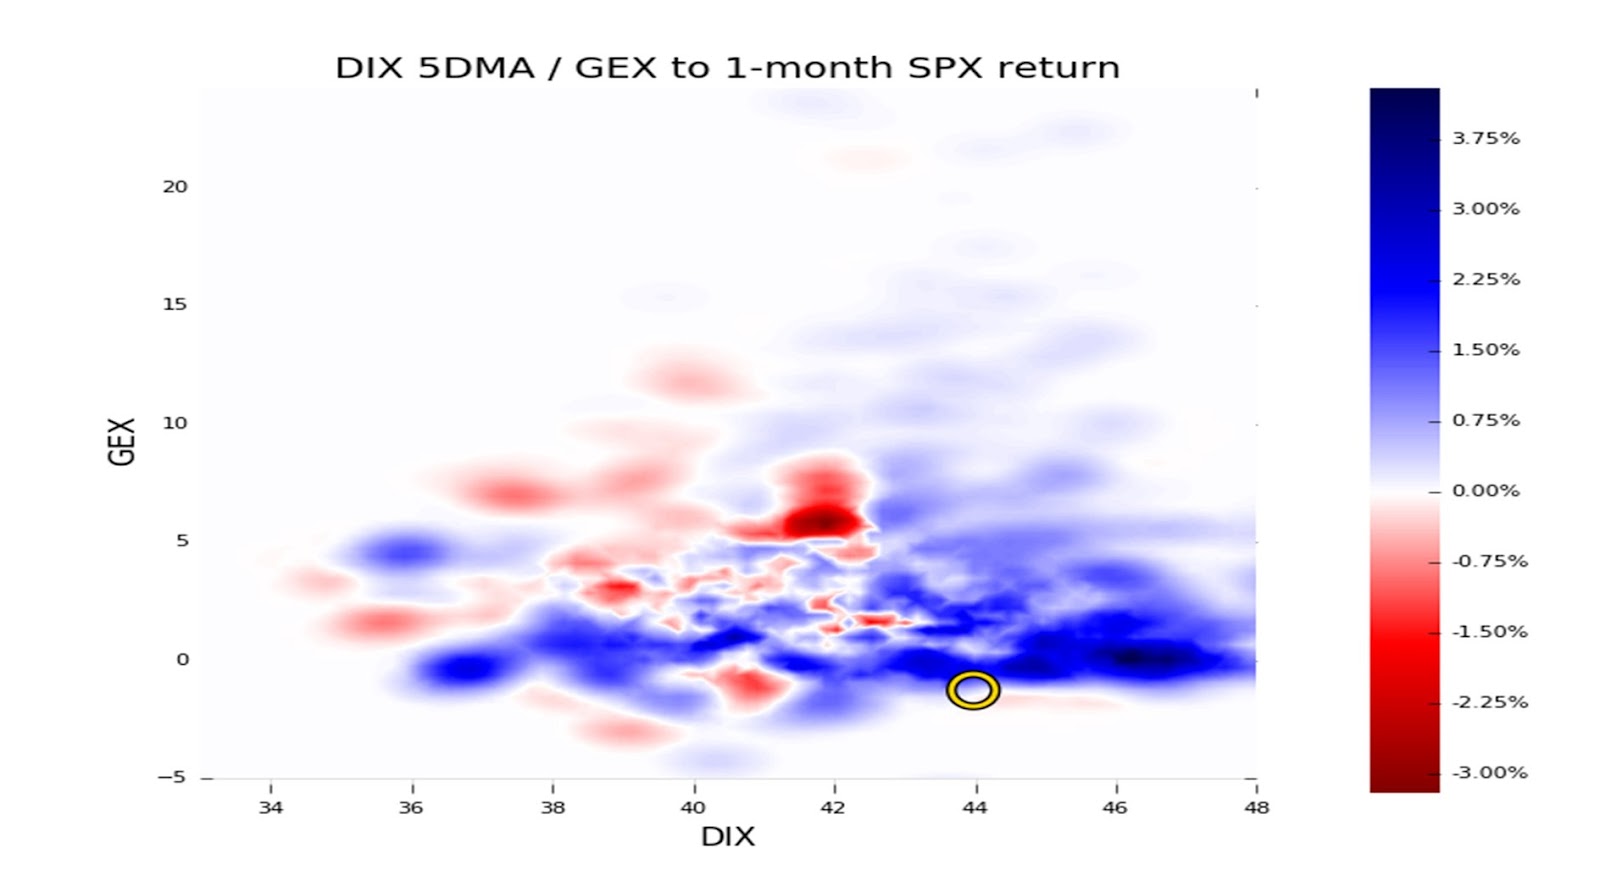
Based on traders’ current positioning, the market, absent exogenous shocks, is more so prone to sharp upside reversals and a slow(er) grind lower.

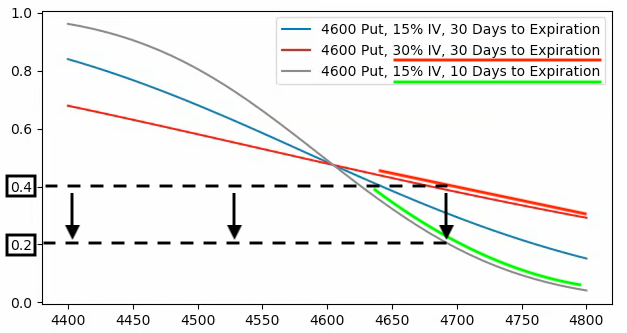
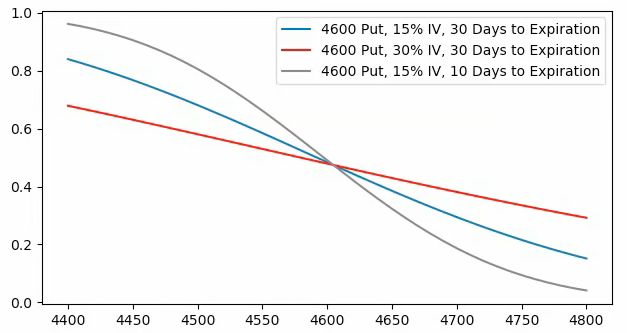
As the former Bridgewater Associate Andy Constan explained to me once, therefore, you “want Deltas and leverage” via options trades that are defined risk and two-to-four months out in maturity.

We shall go more into this, later.
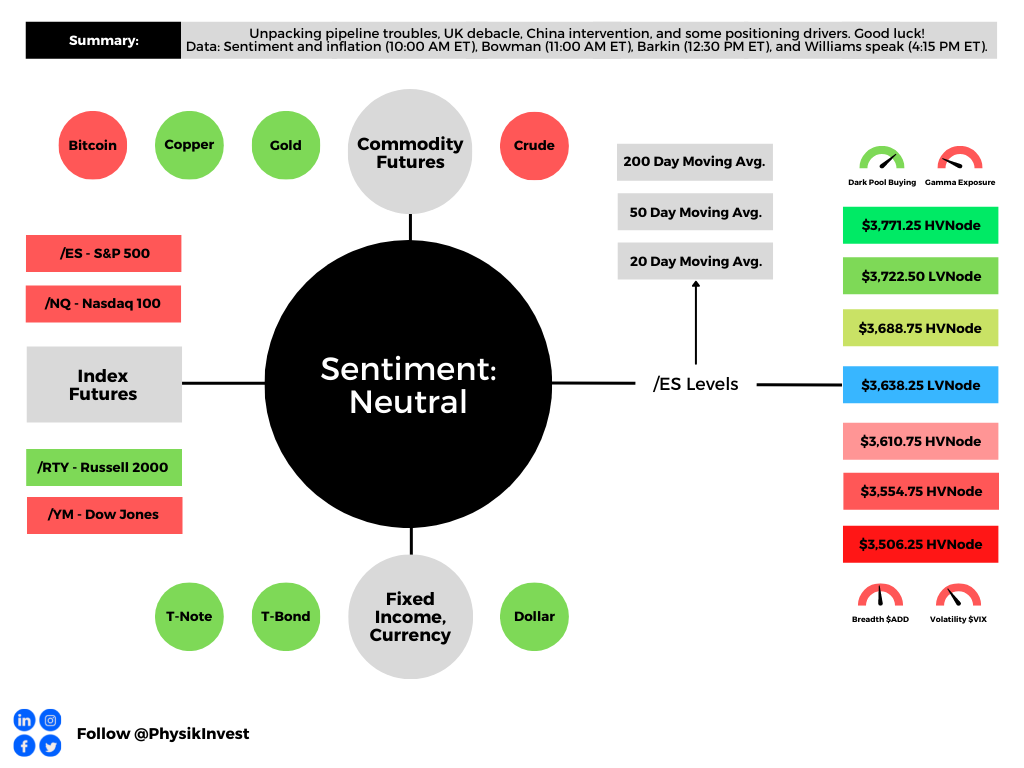
Technical

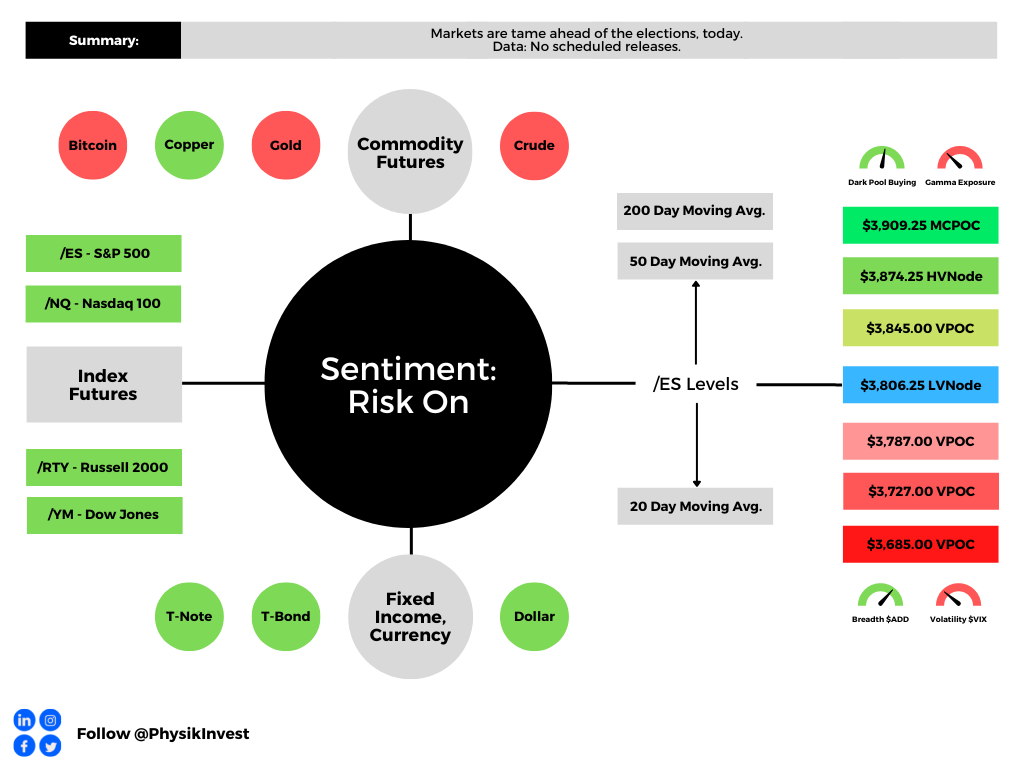
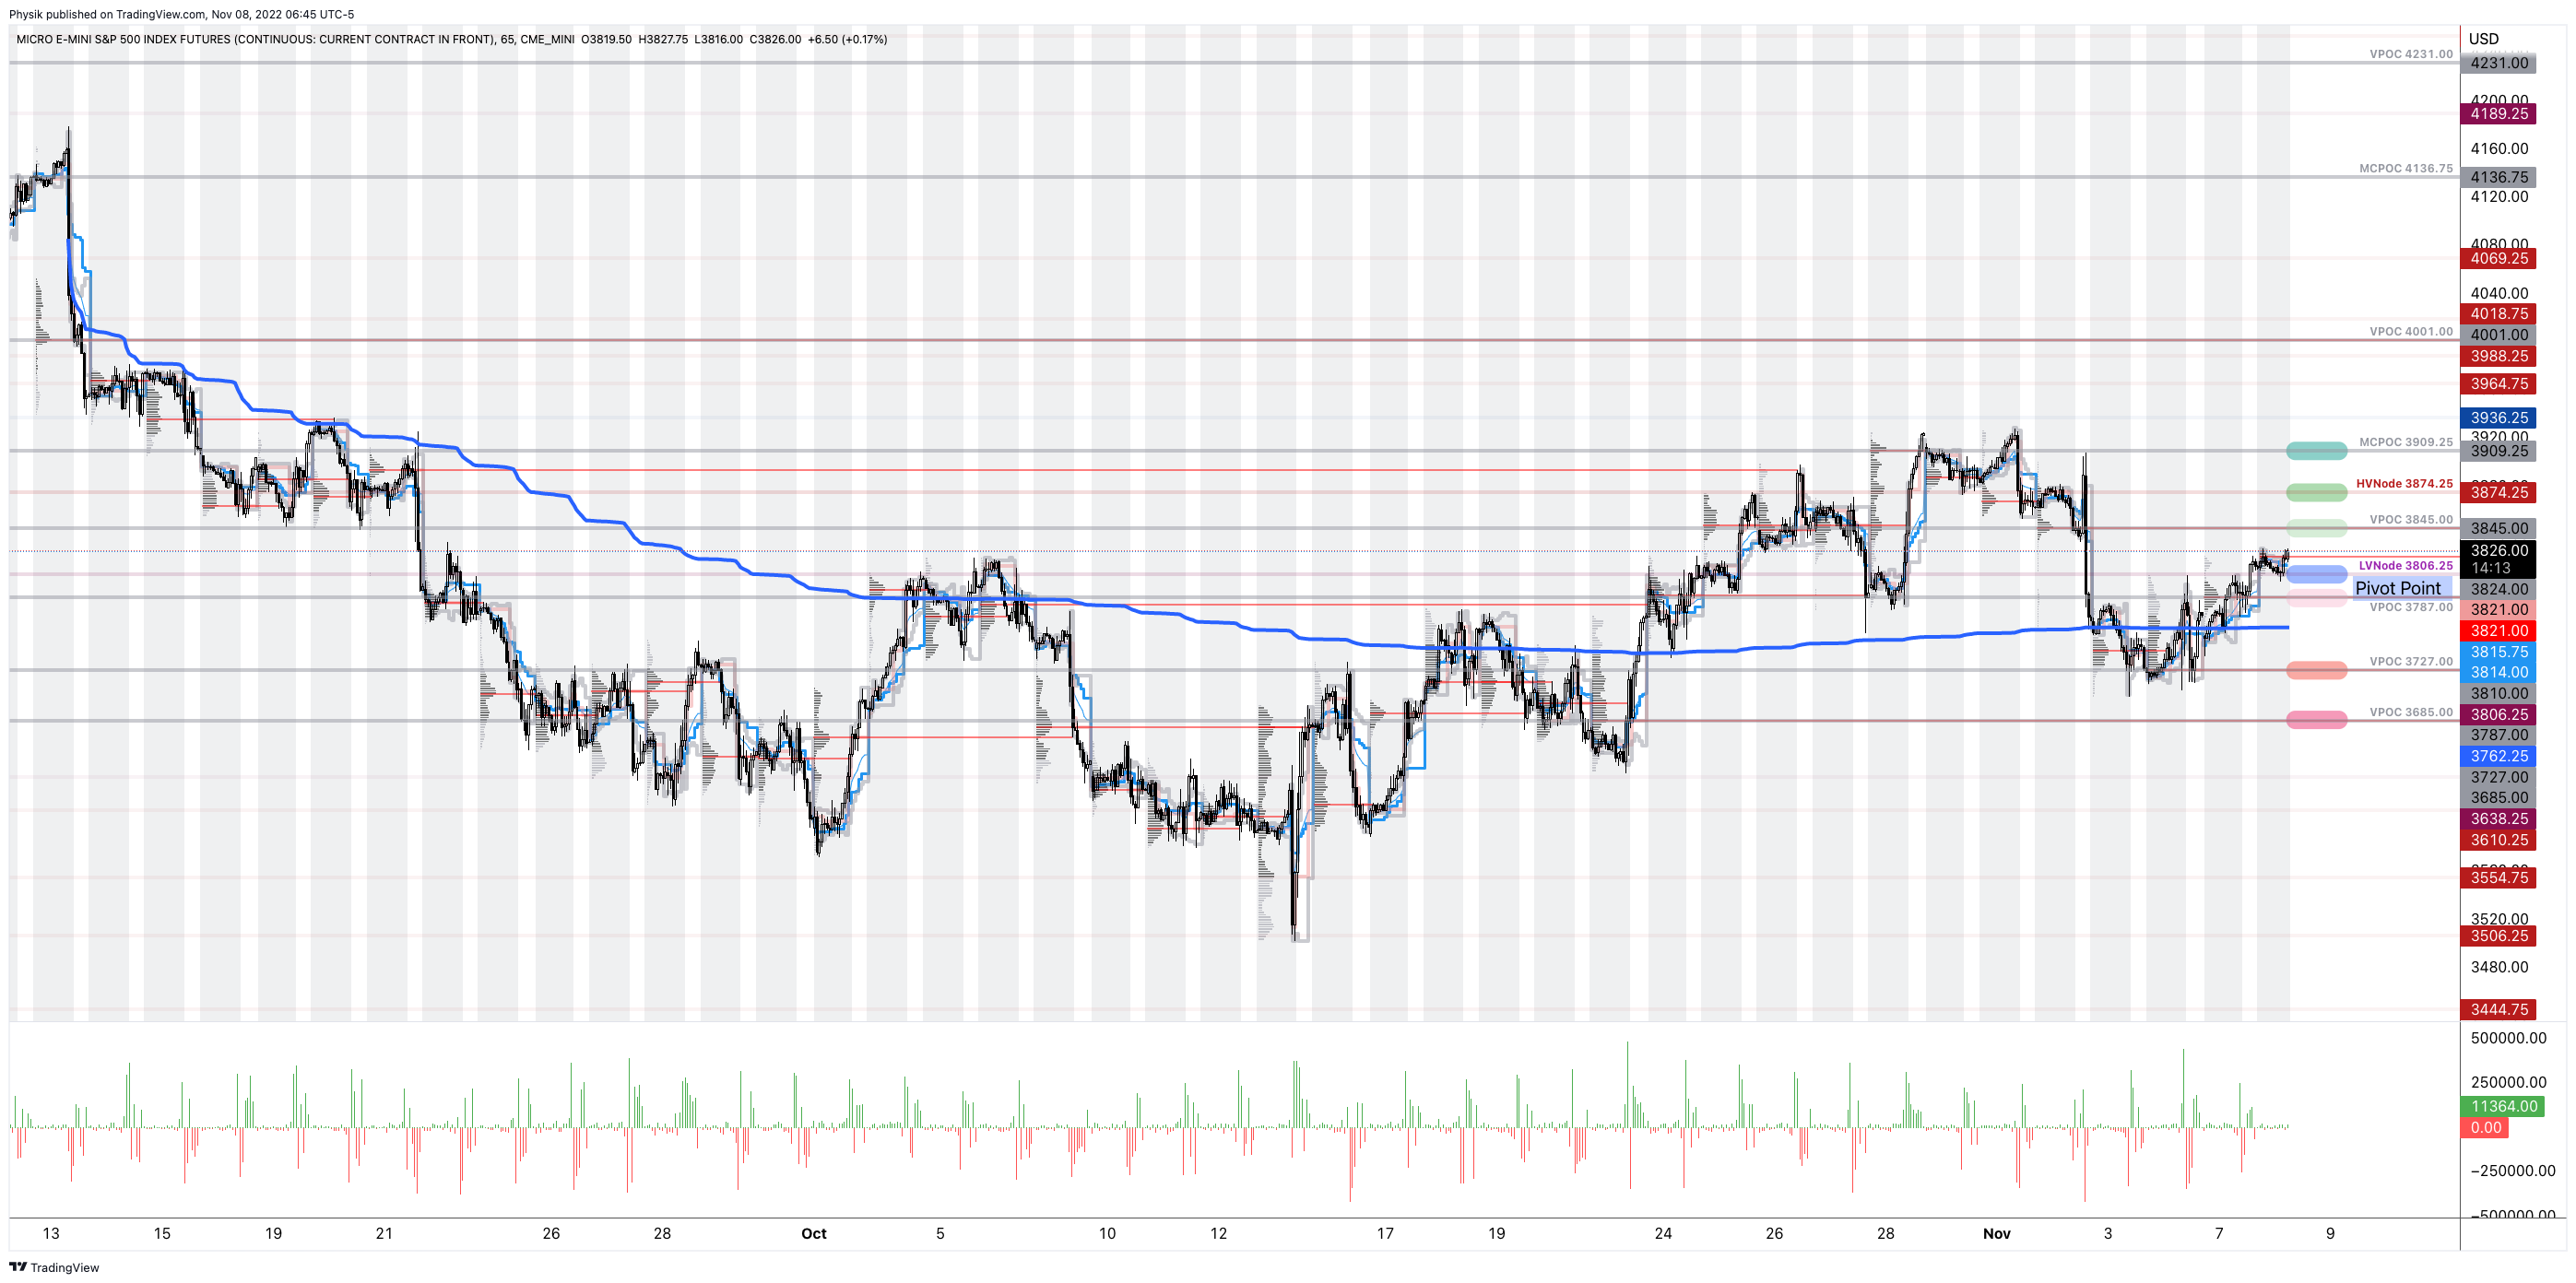
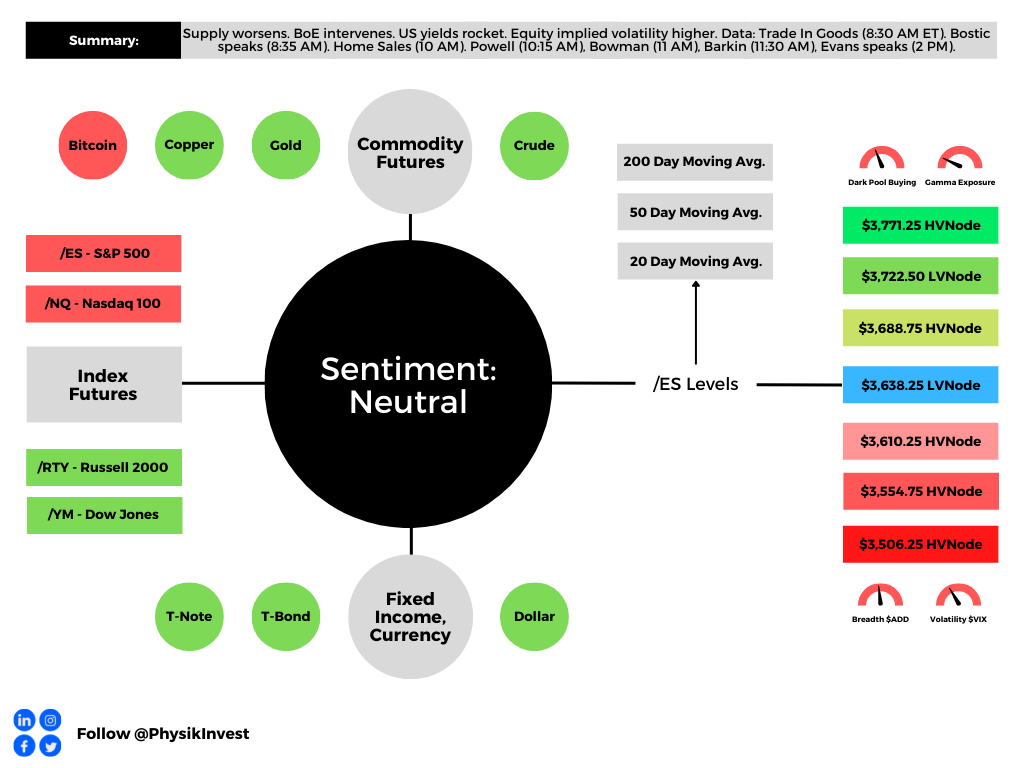
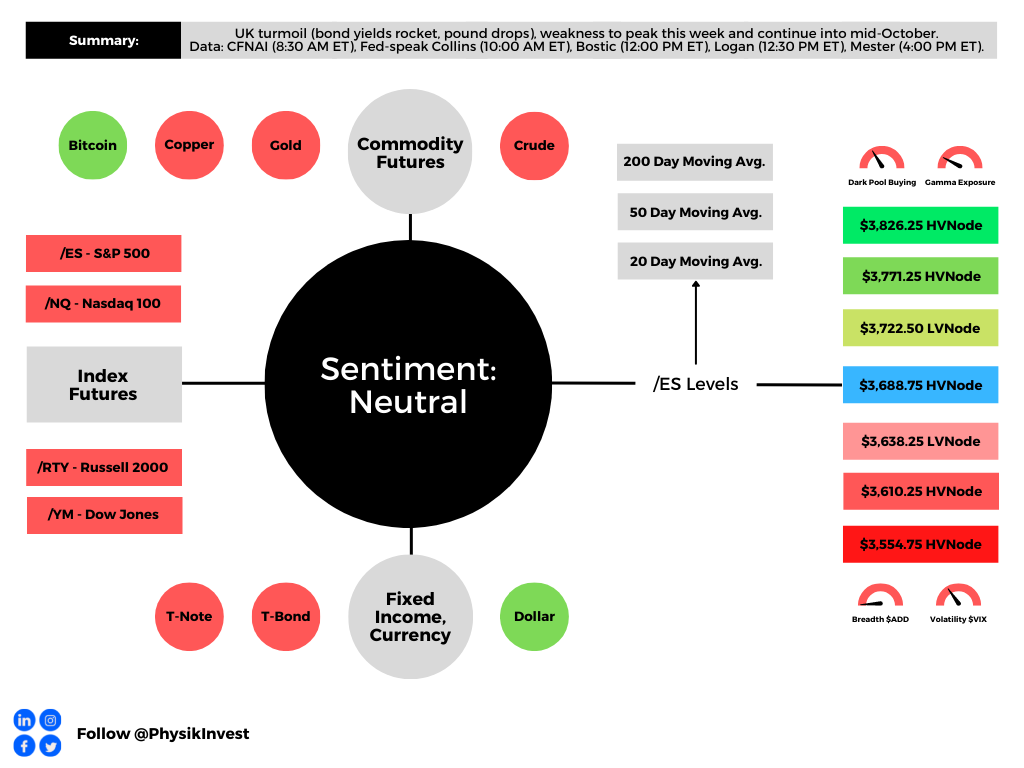
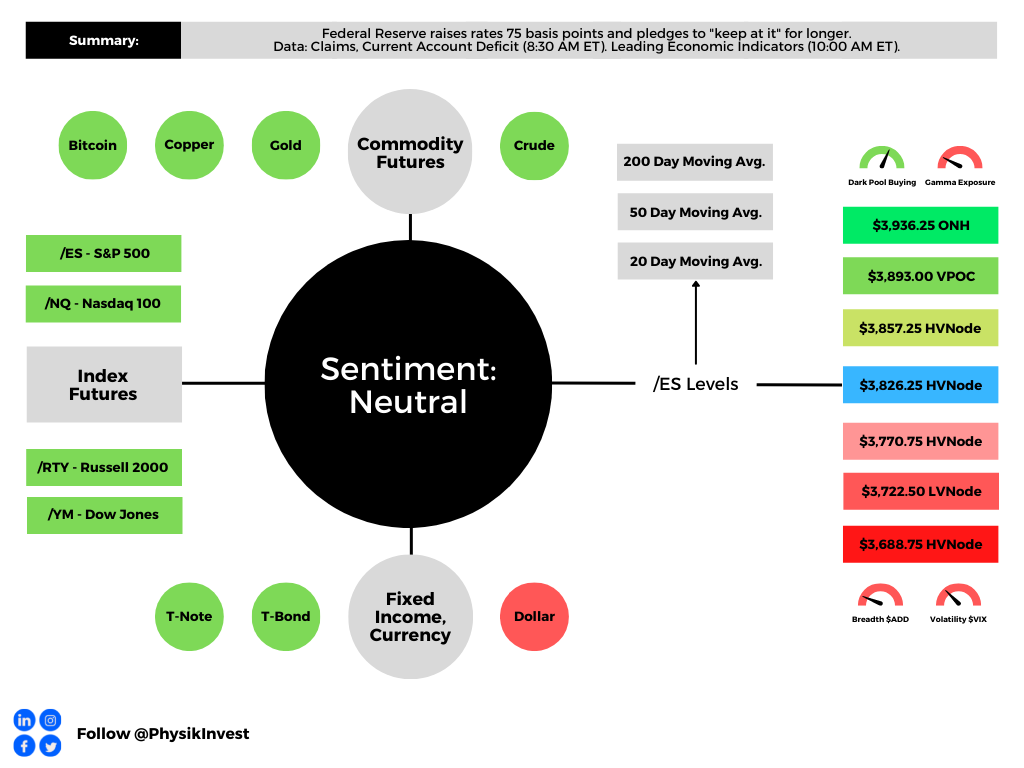
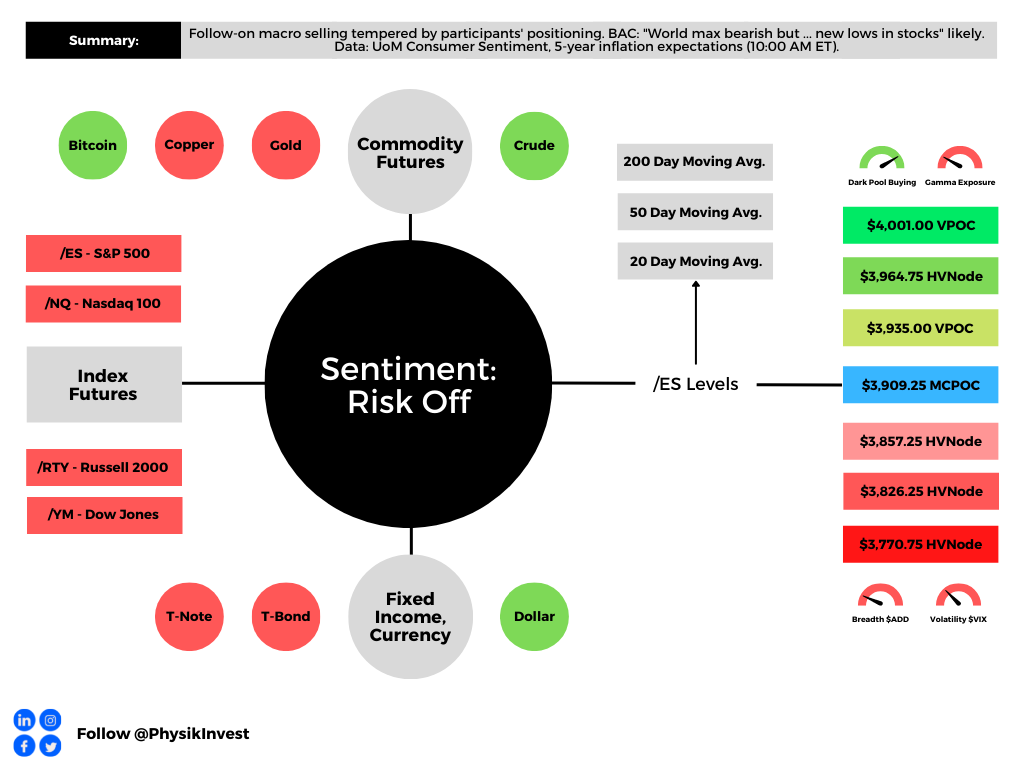
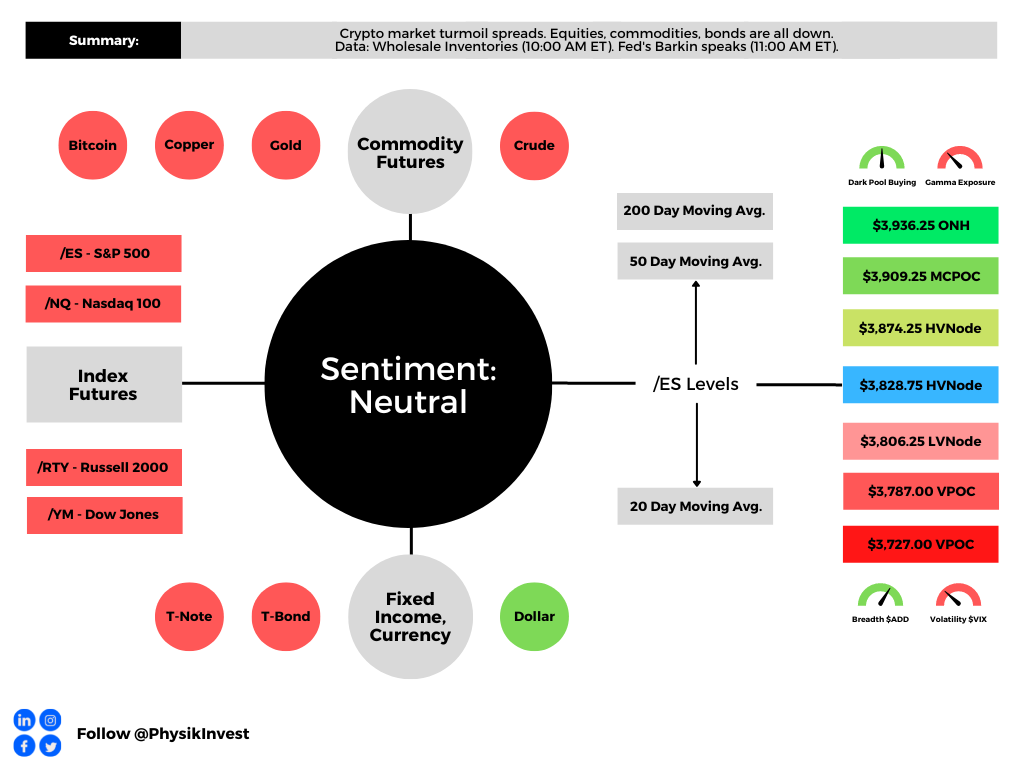
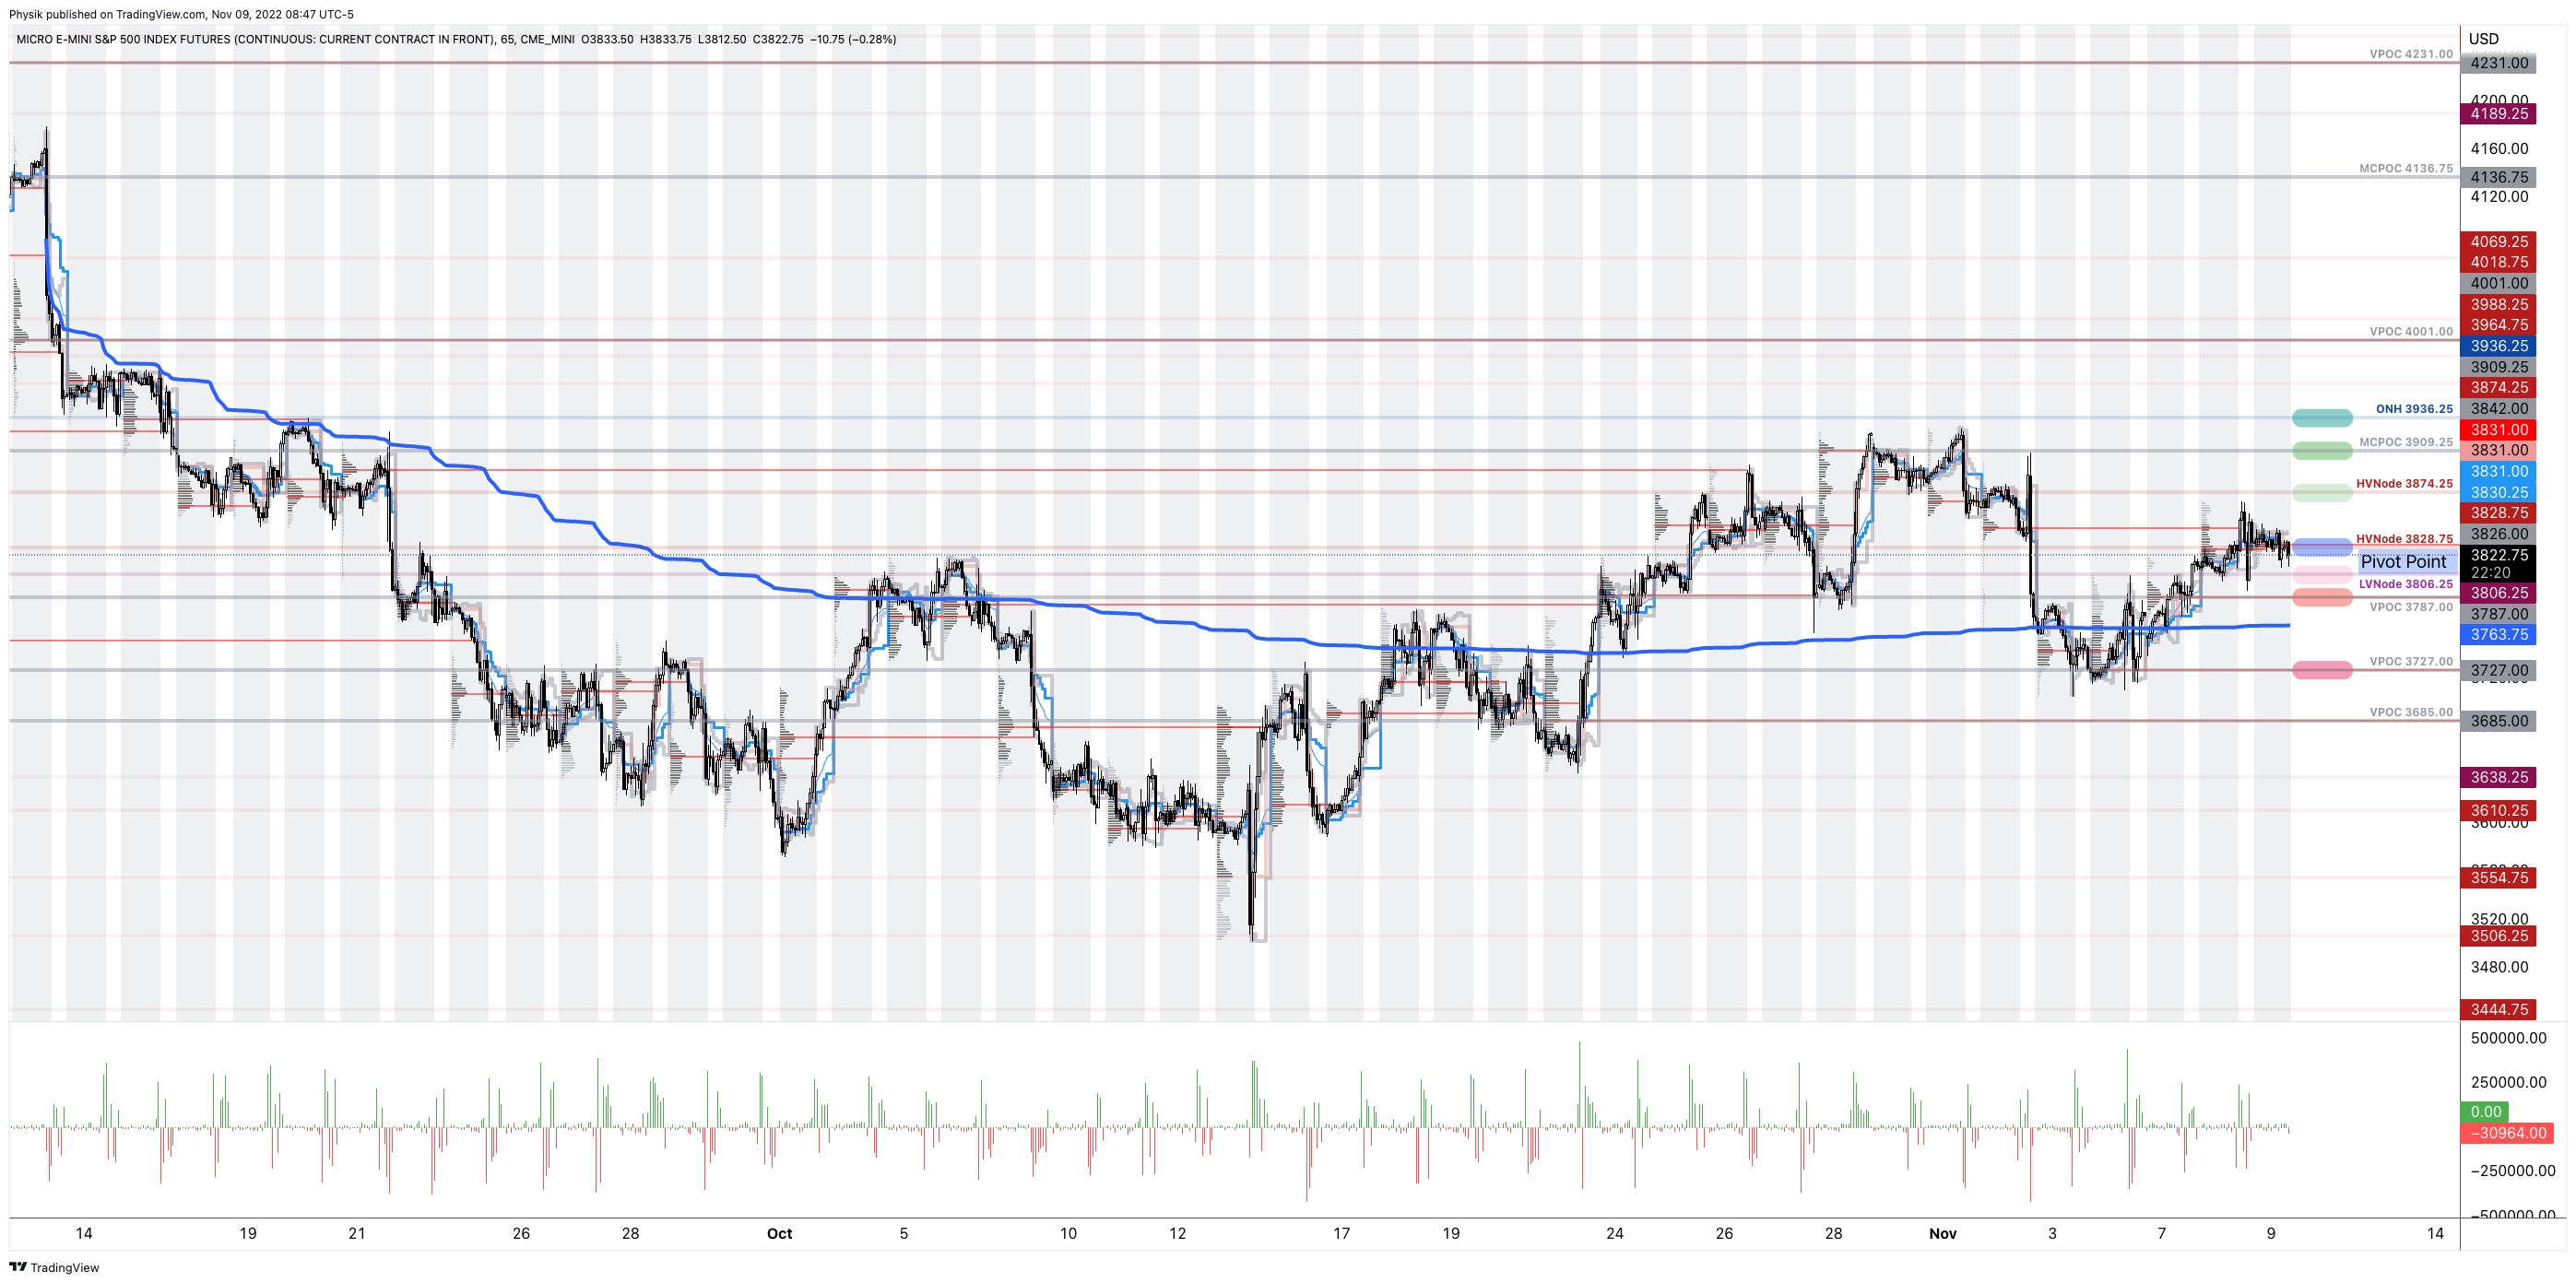
As of 8:45 AM ET, Wednesday’s regular session (9:30 AM – 4:00 PM ET), in the S&P 500, is likely to open in the lower part of a negatively skewed overnight inventory, inside of prior-range and -value, suggesting a limited potential for immediate directional opportunity.

In the best case, the S&P 500 trades higher.

If above the $3,828.75 HVNode, the $3,874.25 HVNode is in play. Initiative trade beyond the latter could reach as high as the $3,909.25 MCPOC and $3,936.25 ONH, or higher.

In the worst case, the S&P 500 trades lower.

If above the $3,828.75 HVNode, the $3,806.25 LVNode is in play. Initiative trade beyond the latter could reach as low as the $3,787.00 VPOC and $3,727.00 VPOC, or lower.

Click here to load today’s key levels into the web-based TradingView charting platform. Note that all levels are derived using the 65-minute timeframe. New links are produced, daily.

Graphic: 65-minute profile chart of the Micro E-mini S&P 500 Futures.

Definitions

Volume Areas: A structurally sound market will build on areas of high volume (HVNodes). Should the market trend for long periods of time, it will lack sound structure, identified as low volume areas (LVNodes). LVNodes denote directional conviction and ought to offer support on any test. 

If participants were to auction and find acceptance into areas of prior low volume (LVNodes), then future discovery ought to be volatile and quick as participants look to HVNodes for favorable entry or exit.

POCs: POCs are valuable as they denote areas where two-sided trade was most prevalent in a prior day session. Participants will respond to future tests of value as they offer favorable entry and exit.

MCPOCs: POCs are valuable as they denote areas where two-sided trade was most prevalent over numerous day sessions. Participants will respond to future tests of value as they offer favorable entry and exit.

About

After years of self-education, strategy development, mentorship, and trial-and-error, Renato Leonard Capelj began trading full-time and founded Physik Invest to detail his methods, research, and performance in the markets.

Capelj also develops insights around impactful options market dynamics at SpotGamma and is a Benzinga reporter.

Some of his works include conversations with ARK Invest’s Catherine Wood, investors Kevin O’Leary and John Chambers, FTX’s Sam Bankman-Fried, ex-Bridgewater Associate Andy Constan, Kai Volatility’s Cem Karsan, The Ambrus Group’s Kris Sidial, among many others.

Disclaimer

In no way should the materials herein be construed as advice. Derivatives carry a substantial risk of loss. All content is for informational purposes only.

Categories
Commentary

Daily Brief For November 8, 2022

The daily brief is a free glimpse into the prevailing fundamental and technical drivers of U.S. equity market products. Join the 1,200+ that read this report daily, below!

Graphic updated 9:15 AM ET. Sentiment Risk-On if expected /ES open is above the prior day’s range. /ES levels are derived from the profile graphic at the bottom of the following section. Levels may have changed since initially quoted; click here for the latest levels. SqueezeMetrics Dark Pool Index (DIX) and Gamma (GEX) calculations are based on where the prior day’s reading falls with respect to the MAX and MIN of all occurrences available. A higher DIX is bullish. At the same time, the lower the GEX, the more (expected) volatility. Learn the implications of volatility, direction, and moneyness. Breadth reflects a reading of the prior day’s NYSE Advance/Decline indicator. VIX reflects a current reading of the CBOE Volatility Index (INDEX: VIX) from 0-100.

Administrative

This letter’s author is ramping up coverage and returning to speed after a short hiatus. Today’s focus will be on adding to the “Positioning” section of Monday’s letter.

Positioning

After some late-October weakness that is coinciding with the Federal Reserve’s (Fed) decision to raise rates, stocks are tame. This is heading into midterm elections, today, and inflation updates, Thursday.

Graphic: Retrieved from Bloomberg. Created by JPMorgan Chase & Co (NYSE: JPM).

Republicans are likely to add to their control of the House and Senate.

Having fewer Democrats in Congress would lower “the odds of fiscal measures [that would] embolden a hawkish Federal Reserve.” 

This is a boon for stocks.

Graphic: Retrieved from Bloomberg. “With things looking that bad, current polls show the Democrats appear to be headed for a drubbing, almost certain to lose control of the House and increasingly likely to see the Senate slip away.”

Indeed, Wells Fargo & Co (NYSE: WFC) strategists found a “GOP-controlled Senate historically is associated with superior equity returns.”

Graphic: Retrieved from Wells Fargo & Co (NYSE: WFC).

In spite of recessions, even, the S&P 500, a year after midterms, often netted positive 20% or so returns Citigroup Inc (NYSE: C) strategists add.

Graphic: Retrieved from Callum Thomas’ Weekly S&P 500 ChartStorm. The “seasonal/cycle outlook is for a lower low or retest of the lows over the next three months as we are in the worst two months of the year and are smack dab in the *Weak Spot* of the 4-Year Cycle”

A post-election bump is on top of the general positiveness of equity performance during the earnings season and periods of strong pessimism as we have today.

Graphic: Retrieved from Mr. Blonde’s Stuck in the Middle letter.

Why all the potential positivity over this short period?

The aforementioned events are happening during a period wherein market liquidity eases (i.e., the holiday season).

It’s during this period, from a positioning perspective, the effects of decay (which we discuss more below) accelerate, and a lack of liquidity, according to Kai Volatility’s Cem Karsan, makes markets sensitive to positive-leaning flows.

Pessimism and hedging may indirectly give rise to bullishness. Why is that?

Demand for options exposures, especially across shorter time horizons, evidenced by heightened implied volatility (IVOL) at the front end (see below), has indirectly added to the pressures of de-grossing, as observed.

Graphic: Retrieved from Bloomberg.

Though positioning is generally thin, as we also talked about in yesterday’s newsletter, thus reducing the impact of the hedging of this positioning, demand remains “strong,” per Karsan, and “dealers are short that volatility.”

Derivatives strategists at the likes of the Royal Bank of Canada (NYSE: RY) agree with Karsan’s remarks; Amy Wu Silverman said that the Cboe Volatility Index’s (INDEX: VIX) elevation was the result of demand for hedges after October options expiry.

“Part of today’s move at least is a function of new positions. There is likely demand for future months since we just went through October options expiry,” she said. “Part of it is a function of the ‘floor’ of a new volatility regime.”

So, what’s the point to make?

For IVOL measures to remain wound, something bad needs to happen, in short.

Otherwise, per SpotGamma, a “decline in IVOL … can aid in a push-and-pull that actually serves to … resist far-reaching weakness” and keep selling orderly.

That’s because, from here, the removal of the protection that’s been demanded in the past days and weeks compounds the sped-up effects of Charm.

Graphic: Retrieved from SpotGamma. SPX prices X-axis. Option delta Y-axis. When the factors of implied volatility (Vanna) and time change (Charm), hedging ratios change. The graphic is for illustrational purposes, only.

Charm, which is the change in options Delta (i.e., exposure to direction) with respect to changes in time, “drives a positive window or seasonality”; “the reduction in time” and “lack of liquidity” make markets more sensitive to those positive flows.

Graphic: Retrieved from SqueezeMetrics.

In the long term, however, weakness is here to stay. Poor IVOL performance and little skew also likely set the stage for a post-holiday tail. More on this, later.

Graphic: Retrieved from Corey Hoffstein on Twitter.

Technical

As of 6:45 AM ET, Tuesday’s regular session (9:30 AM – 4:00 PM ET), in the S&P 500, is likely to open in the upper part of a positively skewed overnight inventory, just outside of prior-range and -value, suggesting a limited potential for immediate directional opportunity.

In the best case, the S&P 500 trades higher.

If above the $3,806.25 LVNode, the $3,845.00 VPOC is in play. Initiative trade beyond the latter could reach as high as the $3,874.25 HVNode and $3,909.25 MCPOC, or higher.

In the worst case, the S&P 500 trades lower.

If above the $3,806.25 LVNode, the $3,787.00 VPOC is in play. Initiative trade beyond the latter could reach as low as the $3,727.00 and $3,685.00 VPOC, or lower.

Click here to load today’s key levels into the web-based TradingView charting platform. Note that all levels are derived using the 65-minute timeframe. New links are produced, daily.

Graphic: 65-minute profile chart of the Micro E-mini S&P 500 Futures.

Considerations: Futures tied to the S&P 500 are trading within close proximity to a blue line in the above graphic. This blue line depicts a volume-weighted average price (VWAP) anchored to price action following the release of consumer price data on September 13, 2022.

The VWAP metric is highly regarded by chief investment officers, among other participants, for the quality of trade. Additionally, liquidity algorithms are benchmarked and programmed to buy and sell around VWAPs.

Should the S&P 500 auction away from this level, and come back to it, a prudent response is to fade. If the price is above the VWAP, and it auctions lower, into the VWAP, traders would buy. On the other hand, if the price is below the VWAP, and it auctions higher, into the VWAP, sell.

At this time, the S&P 500 is near VWAP offering traders lower (directional) opportunities.


Definitions

Volume Areas: A structurally sound market will build on areas of high volume (HVNodes). Should the market trend for long periods of time, it will lack sound structure, identified as low volume areas (LVNodes). LVNodes denote directional conviction and ought to offer support on any test. 

If participants were to auction and find acceptance into areas of prior low volume (LVNodes), then future discovery ought to be volatile and quick as participants look to HVNodes for favorable entry or exit.

Gamma: Gamma is the sensitivity of an option to changes in the underlying price. Dealers that take the other side of options trades hedge their exposure to risk by buying and selling the underlying. When dealers are short-gamma, they hedge by buying into strength and selling into weakness. When dealers are long-gamma, they hedge by selling into strength and buying into weakness. The former exacerbates volatility. The latter calms volatility.

Vanna: The rate at which the delta of an option changes with respect to volatility.

Charm: The rate at which the delta of an option changes with respect to time.

POCs: POCs are valuable as they denote areas where two-sided trade was most prevalent in a prior day session. Participants will respond to future tests of value as they offer favorable entry and exit.

MCPOCs: POCs are valuable as they denote areas where two-sided trade was most prevalent over numerous day sessions. Participants will respond to future tests of value as they offer favorable entry and exit.


About

After years of self-education, strategy development, mentorship, and trial-and-error, Renato Leonard Capelj began trading full-time and founded Physik Invest to detail his methods, research, and performance in the markets.

Capelj also develops insights around impactful options market dynamics at SpotGamma and is a Benzinga reporter.

Some of his works include conversations with ARK Invest’s Catherine Wood, investors Kevin O’Leary and John Chambers, FTX’s Sam Bankman-Fried, ex-Bridgewater Associate Andy Constan, Kai Volatility’s Cem Karsan, The Ambrus Group’s Kris Sidial, among many others.

Disclaimer

In no way should the materials herein be construed as advice. Derivatives carry a substantial risk of loss. All content is for informational purposes only.


Categories
Commentary

Daily Brief For October 6, 2022

The daily brief is a free glimpse into the prevailing fundamental and technical drivers of U.S. equity market products. Join the 1000+ that read this report daily, below!

Graphic updated 8:00 AM ET. Sentiment Neutral if expected /ES open is inside of the prior day’s range. /ES levels are derived from the profile graphic at the bottom of the following section. Levels may have changed since initially quoted; click here for the latest levels. SqueezeMetrics Dark Pool Index (DIX) and Gamma (GEX) calculations are based on where the prior day’s reading falls with respect to the MAX and MIN of all occurrences available. A higher DIX is bullish. At the same time, the lower the GEX, the more (expected) volatility. Learn the implications of volatility, direction, and moneyness. Breadth reflects a reading of the prior day’s NYSE Advance/Decline indicator. VIX reflects a current reading of the CBOE Volatility Index (INDEX: VIX) from 0-100.

Administrative

Good morning, team! Appreciate you opening up this email and reading through the newsletter. 

Over the span of two or so years, on Substack and Physik Invest’s website, issued daily was this letter you, alongside about 1,000 others, are subscribed to.

This newsletter went from about 400 subscribers in July to 1,000 in October, a 150% increase. Thank you to fx:macro, The Morning Hark, The Transcript, and twenty others who, in large part, made that increase happen.

From hereon, gun to the head, I (your letter writer) can’t tell where this newsletter is going. 

In short, this letter served as a tool for me to improve and keep me aware. It was years ago that markets were a dream I was in steadfast pursuit of; I sought mentorship, studied, saved money, and, ultimately, made it a successful full-time gig. 

This letter helped keep me committed to continuous improvement. Sure the money was great, but how do you keep that flow when times get tough? That is something this letter helped me achieve. I hope it’s done the same for you.

At the same time, to weather the storms (periods of inactivity or low earnings while trading like now), I continued my work at places like Benzinga and SpotGamma.

Probably shaved a few years off my life expectancy but the effect was a net positive, I believe. 

That said, in our own way, each and every one of us wants to level up, and that is what makes it difficult for me to promise where this newsletter may go. Speaking bluntly, I am faced with some good problems; e.g., should I raise money and build a fund? Work at an institution? Pivot to PE or, even, government work? Go back to school? Can’t tell you, yet.

What the next step will be I am not sure. Regardless, I intend to keep you fully in the loop. 

As I set out and travel over the next 30 days, I’ll be doing a lot of thinking and, though the frequency of issued letters may change, briefly, the result may be better letters potentially spanning areas far beyond the S&P and the factors that are driving it.

Definitely am open to feedback. Appreciate you for joining the community and staying on board! 

PS: Two things.

First, I’ll be in London and Lisbon over the next month. If you’re in either of the two cities, reach me on Telegram (@renatolcapelj) and/or Discord (Renato Capelj#8625). 

Maybe a coffee?

Second, I spent the past half-year helping Benzinga build an awesome fintech event coming to New York City this December 8, 2022. Organizations such as FIS, Fireblocks, Truist, Symbiont, State Street, Vanguard, Northern Trust, Partisia, and Apex Clearing are a few that will be there.

If you want to network with the best, let me know and I’ll try to get you a ticket!

Regards,

Renato

Fundamental

An eventful week. 

News, today, was focused on Federal Reserve (Fed) officials not planning to cut interest rates next year, the Organization of the Petroleum Exporting Countries (OPEC) agreeing to a supply cut, the UK mulling first-time home buyer program extensions, and Credit Suisse Group AG (NYSE: CS) seeking investment to help spin off its advisory and investment banking units.

Please check out the Physik Invest archives and upcoming letters for more on the impact.

Positioning

Bloomberg reported yesterday a big trade fired off mid-day propelling the S&P 500 higher into the close. The trade consisted of +20,000 OCT $4,500.00, +14,000 MAR $4,300.00 calls, and -48,000 JAN $4,500.00 calls. 

The trade leaves the participant(s) with positive Delta. The other side has exposure to negative Delta meaning they lose money if the S&P 500 is higher, all else equal. To hedge this negative Delta, counterparties buy futures (positive Delta) and that has a positive impact.

According to SpotGamma, though, there needs to be more impactful bullish call repositioning or a market rise that’s large enough to solicit volatility-dampening hedging from counterparties.

Until the last-mentioned happens, the market may continue to balance in a larger range.

Technical

As of 8:00 AM ET, Thursday’s regular session (9:30 AM – 4:00 PM ET), in the S&P 500, is likely to open in the lower part of a negatively skewed overnight inventory, inside of prior-range and -value, suggesting a limited potential for immediate directional opportunity.

In the best case, the S&P 500 trades higher.

Any activity above the $3,771.25 HVNode puts into play the $3,826.25 HVNode. Initiative trade beyond the last-mentioned could reach as high as the $3,862.25 HVNode and $3,893.00 VPOC, or higher.

In the worst case, the S&P 500 trades lower.

Any activity below the $3,771.25 HVNode puts into play the $3,722.50 LVNode. Initiative trade beyond the LVNode could reach as low as the $3,671.00 VPOC and $3,610.75 HVNode, or lower.

Click here to load today’s key levels into the web-based TradingView charting platform. Note that all levels are derived using the 65-minute timeframe. New links are produced, daily.
Graphic: 65-minute profile chart of the Micro E-mini S&P 500 Futures.

Definitions

Volume Areas: A structurally sound market will build on areas of high volume (HVNodes). Should the market trend for long periods of time, it will lack sound structure, identified as low volume areas (LVNodes). LVNodes denote directional conviction and ought to offer support on any test. 

If participants were to auction and find acceptance into areas of prior low volume (LVNodes), then future discovery ought to be volatile and quick as participants look to HVNodes for favorable entry or exit.

POCs: POCs are valuable as they denote areas where two-sided trade was most prevalent in a prior day session. Participants will respond to future tests of value as they offer favorable entry and exit.

About

After years of self-education, strategy development, mentorship, and trial-and-error, Renato Leonard Capelj began trading full-time and founded Physik Invest to detail his methods, research, and performance in the markets.

Capelj also develops insights around impactful options market dynamics at SpotGamma and is a Benzinga reporter.

Some of his works include conversations with ARK Invest’s Catherine Wood, investors Kevin O’Leary and John Chambers, FTX’s Sam Bankman-Fried, ex-Bridgewater Associate Andy Constan, Kai Volatility’s Cem Karsan, The Ambrus Group’s Kris Sidial, among many others.

Disclaimer

In no way should the materials herein be construed as advice. Derivatives carry a substantial risk of loss. All content is for informational purposes only.

Categories
Commentary

Daily Brief For October 3, 2022

The daily brief is a free glimpse into the prevailing fundamental and technical drivers of U.S. equity market products. Join the 980+ that read this report daily, below!

Graphic updated 8:30 AM ET. Sentiment Neutral if expected /ES open is inside of the prior day’s range. /ES levels are derived from the profile graphic at the bottom of the following section. Levels may have changed since initially quoted; click here for the latest levels. SqueezeMetrics Dark Pool Index (DIX) and Gamma (GEX) calculations are based on where the prior day’s reading falls with respect to the MAX and MIN of all occurrences available. A higher DIX is bullish. At the same time, the lower the GEX, the more (expected) volatility. Learn the implications of volatility, direction, and moneyness. Breadth reflects a reading of the prior day’s NYSE Advance/Decline indicator. VIX reflects a current reading of the CBOE Volatility Index (INDEX: VIX) from 0-100.

Administrative

Ended last week on a strong note and started this week on a lighter, less impactful note. 

Separately, due to travel commitments, there may be inconsistency in the frequency of posts in the coming weeks, particularly October 10-21, 2022.

Fundamental

A lot of noise this weekend. Top headlines and posts on social media concerned the stability of Credit Suisse Group AG (NYSE: CS), for one, which is slated to open about 5% lower today.

CEO Ulrich Koerner said the bank is at a “critical moment” while stressing stock prices did not reflect its “​​strong capital base and liquidity position.” The bank’s key capital ratio sits at 13.5%, higher than what Deutsche Bank AG (NYSE: DB) had in 2016 when it was in trouble.

Graphic: Retrieved from Bloomberg. “Credit Suisse Group AG shares are now a “buy for the brave,” said Citigroup Inc. analysts on Monday.”

A hot topic, too, is the bank’s credit default swap (CDS) levels which “are still far from distressed and are part of a broad market selloff,” Bloomberg concludes.

For context, a CDS is a tool to hedge against the risk of some credit event (e.g., bankruptcy, a failure to pay, restructuring of debt, repudiation/moratorium, and obligation acceleration or an obligation default). The settlement of a CDS involves the exchanging of bonds for their par value or a cash payment equal to the difference between par and the bond’s market value.

Graphic: Retrieved from Bloomberg. “There is now a roughly 23% chance the bank defaults on its bonds within 5 years.” A CDS spread at – say 250 bps – “assuming a recovery of zero,” implies an annual default probability of 2.5%.

Moreover, in spite of all the discussion and debate online, “Credit Suisse is not creating anything like the angst we experienced [in 2008],” said columnist John Authers.

If no bailout is needed, “as the CEO’s memo endeavors to show, then all the talk has left it very much oversold.”

Graphic: Retrieved from Bloomberg. CS trades at less than book value (assets less liabilities).

In other news, Liz Truss, the Prime Minister of the UK, shifted her focus from some fiscal stimuli which “bec[ame] a distraction from [the] mission to get Britain moving.”

“Our focus now is on building a high growth economy that funds world-class public services, boosts wages, and creates opportunities across the country.”

For context, the last week was filled with excitement overseas, we explained in detail Monday through Friday.

In short, the announcement of new fiscal policies coincided with market volatility that prompted reflexive feedback loops and the risk of default among some pension schemes.

Some of those announcements were walked back and UK volatility eased. 

Moving on. 

Oil was bid on news that OPEC+ is considering a cut to production in excess of a million barrels per day. This is as they look to “pre-empt” potential surpluses amid waning demand and the sale of oil from the US’s Strategic Petroleum Reserves (SPR) into November.

Graphic: Retrieved from CME Group Inc (NASDAQ: CME). “SPR release has helped tame oil prices.”

Waning demand is showing up in other areas; factor activity is falling on a slowdown, globally, as policymakers tighten and clamp down on excesses. Just yesterday, the Wall Street Journal reported that cargo shipowners were canceling sailings as shipping rates, discussed last week, plunged ~75%.

Positioning

Top of mind, for many, last week was the trade, repositioning, and/or removal of large options positions coinciding with the September Quarterly Options Expiration (OPEX).

Notwithstanding, per SpotGamma data, the “expiration isn’t particularly impressive” as there is likely far “more potential market impact” expected in October and December.

Graphic: Retrieved from SpotGamma.

Still, there was a removal of a lot of put Delta. SpotGamma sees counterparties as having positive Delta (directional) exposure via short put (i.e., meaning the trade loses money if the underlying trades lower). This opens the door to relief as counterparties reposition and trim exposure to their negative Delta (offsetting) hedges via futures and/or stock.

“We believe that the expiration of large put positions can be turning points for market rallies.”

Technical

As of 7:00 AM ET, Monday’s regular session (9:30 AM – 4:00 PM ET), in the S&P 500, is likely to open in the upper part of a balanced overnight inventory, inside of prior-range and -value, suggesting a limited potential for immediate directional opportunity.

In the best case, the S&P 500 trades higher.

Any activity above the $3,610.75 HVNode puts into play the $3,653.00 VPOC. Initiative trade beyond the VPOC could reach as high as the $3,688.75 HVNode and $3,722.50 LVNode, or higher.

In the worst case, the S&P 500 trades lower.

Any activity below the $3,610.75 HVNode puts into play the $3,554.75 HVNode. Initiative trade beyond the last-mentioned could reach as low as the $3,506.25 and $3,444.75 HVNode, or lower.

Click here to load today’s key levels into the web-based TradingView charting platform. Note that all levels are derived using the 65-minute timeframe. New links are produced, daily.
Graphic: 65-minute profile chart of the Micro E-mini S&P 500 Futures.

Definitions

Volume Areas: A structurally sound market will build on areas of high volume (HVNodes). Should the market trend for long periods of time, it will lack sound structure, identified as low volume areas (LVNodes). LVNodes denote directional conviction and ought to offer support on any test. 

If participants were to auction and find acceptance into areas of prior low volume (LVNodes), then future discovery ought to be volatile and quick as participants look to HVNodes for favorable entry or exit.

About

After years of self-education, strategy development, mentorship, and trial-and-error, Renato Leonard Capelj began trading full-time and founded Physik Invest to detail his methods, research, and performance in the markets.

Capelj also develops insights around impactful options market dynamics at SpotGamma and is a Benzinga reporter.

Some of his works include conversations with ARK Invest’s Catherine Wood, investors Kevin O’Leary and John Chambers, FTX’s Sam Bankman-Fried, ex-Bridgewater Associate Andy Constan, Kai Volatility’s Cem Karsan, The Ambrus Group’s Kris Sidial, among many others.

Disclaimer

In no way should the materials herein be construed as advice. Derivatives carry a substantial risk of loss. All content is for informational purposes only.

Categories
Commentary

Daily Brief For September 30, 2022

The daily brief is a free glimpse into the prevailing fundamental and technical drivers of U.S. equity market products. Join the 980+ that read this report daily, below!

Graphic updated 9:50 AM ET. Sentiment Neutral if expected /ES open is inside of the prior day’s range. /ES levels are derived from the profile graphic at the bottom of the following section. Levels may have changed since initially quoted; click here for the latest levels. SqueezeMetrics Dark Pool Index (DIX) and Gamma (GEX) calculations are based on where the prior day’s reading falls with respect to the MAX and MIN of all occurrences available. A higher DIX is bullish. At the same time, the lower the GEX, the more (expected) volatility. Learn the implications of volatility, direction, and moneyness. Breadth reflects a reading of the prior day’s NYSE Advance/Decline indicator. VIX reflects a current reading of the CBOE Volatility Index (INDEX: VIX) from 0-100.

Administrative

Apologies for the delay. Hectic end-of-week! A little heavy on the fundamental side of things and light on the positioning. More to unpack next week. Have a great weekend!

Fundamental

As an update to our September 29, 2022 letter, Russia responded to the Nord Stream attack suggesting the incident spoke of state-sponsored “terrorism”, all the while “an EU official said the incident had fundamentally changed the nature of the conflict in Ukraine,” per Refinitiv.

Graphic: Retrieved from Bloomberg. Updated September 28, 2022.

In short, Russia’s throwing blame on the US, among others, suggesting it was likely to benefit through a boost in liquefied natural gas (LNG) sales. Russia previously said the leaks were in areas “fully under the control” of US intelligence agencies.

It’s the case that in February 2022, Joe Biden commented that if Russia invaded Ukraine, there would “no longer be a Nord Stream 2,” also.

In response, Nord Stream 1 leaks will be stopped on Monday with no forecasts yet on the future of the pipeline’s operation.

To note, the pipelines were not “supplying gas to Europe when the leaks were first detected, … [but] both had gas in them.” Regardless, the EU will be assessing the application of sanctions.

Moving on, as a recap, this week there was tons of volatility in overseas fixed income and FX markets. In short, the announcement of new fiscal policies coincided with market volatility that prompted reflexive feedback responses, which we dissected in our September 29, 2022 letter.

A cascade of margin calls, during the route to 7-8% yields, would have put in jeopardy 90% of UK pension funds. 

To explain, per Reuters, there are schemes “that pay pensioners a fixed annual amount, often a portion of the final salary they earned as employees.” The schemes invest about 50% of assets in bonds, in order to have cash on hand and pay pension liabilities.

To reduce the effects of market volatility, positions are hedged through derivatives “managed by so-called liability-driven investment (LDI) funds,” Reuters well explained. “For example, pension schemes might pay the floating rate leg of an interest rate swap and receive fixed rates.”

Due to the leverage, market moves have an amplified effect on the funds. Therefore, if bonds fall too much, too fast, more cash must be sent to these LDIs. 

“[P]ositions become loss-making – they are paying out more money in the transaction than they are receiving.”

In some cases, schemes were to have “cash reserves to cope with a 200 bps rise in swap rates over a year. However, 30-year gilt interest rate swaps … rose 360 bps this year and 120 bps in the last few days before the BoE stepped in” and bought bonds, boosting inflation expectations, the thing that monetary tightening was, in part, intended to reduce.

Graphic: Retrieved from Fabian Wintersberger.

Accordingly, pensions sold gilts to “ready cash to meet those collateral calls, or they were kicked out of their derivatives positions because they could not pay up in time and had to sell gilts to avoid having a naked exposure to further sharp moves.”

The BoE’s actions calm the market allowing for the more orderly processing of transactions. 

Still, the UK is seen “out-hiking the Fed in the wake of Kwarteng tax cuts,” while “schemes are running out of cash.”

Graphic: Retrieved via Bloomberg.

The risks don’t just stop there, though, we added. 

For one, there’s damage to be had if FX hedges go awry, which we said would likely prompt a call for collateral, too; investors will “buy overseas assets and hedge away the currency risk,” Jim Leaviss explained. “[I]f you had bought a dollar bond and hedged it, the dollars that you have effectively sold ‘short’ against sterling as the hedge have rallied, and the counterparty to the FX hedge will call for a collateral payment.”

The actions of the recent days likely put investors in a position of less liquid assets to meet the (potential) collateral calls, and this is part of the aforementioned technical factors that are likely to have a bearing on the direction of bonds and yields “over coming months.”

Additionally, some participants speculate the US may run into similar issues as the UK. A single (unconfirmed) participant explained pensions may be “selling equities and other asset classes to meet their swap obligations.”

Graphic: Retrieved via Bloomberg.

Separately, another topic of discussion was the People’s Bank of China (PBOC) telling state-run banks to prepare for the shedding of dollar holdings to buy and assist in propping up the yuan.

Graphic: Retrieved from Reuters’ John Kemp.

This is all the while the Federal Reserve (Fed), to address problems of its own (e.g., real estate affordability) is implementing aggressive monetary tightening (prompting a rise in the dollar and triggering a “reverse currency war”). 

Graphic: Retrieved from Bloomberg. “So if you want to spend $2,500 a month, you can now buy a house that costs $476,425. For that same monthly payment, you could have purchased a $758,572 house in early 2021.”

As an aside, US mortgage rates hit a 15-year high and home prices are falling.

Graphic: Retrieved via Bloomberg. To note, housing wealth regressions indicate “that every dollar of changes in housing wealth leads to a 38-cent change in consumption.”

China is looking to do less of the same and “spark growth in an economy that’s been dragged down by COVID-19 lockdowns, a real estate crash, and supply chain snags,” which have hurt some US firms including Apple Inc (NASDAQ: AAPL).

Graphic: Retrieved from Bloomberg. Apple’s manufacturing exposure to China.

That’s the mismatch (i.e., China easy, US uneasy) that’s going on and, per some, the Fed may be acting on a set of lagging indicators; monetary policy action may do more harm than good.

Graphic: Retrieved from Bloomberg. Via Liz Ann Sonders. “Unbelievable decline in shipping rates … cost to send a 40-ft container from Shanghai to Los Angeles has fallen by 74% from peak and is back to August 2020 levels.”

But, for now, a robust labor market and continued spending by American consumers have some feeling there’s far more room to go before US monetary policy does more harm than good.

Graphic: Retrieved from Bloomberg. An end of an era is approaching, however, as companies that grew largely over the past years, including Meta Platforms Inc (NASDAQ: META), seek to reduce headcount and reorganize.

Positioning

All that was said yesterday, and earlier this week, remains valid. In short, the decline prompted traders to demand downside protection, and this wound measures of implied volatility (IVOL).

Graphic: Retrieved from Interactive Brokers Group Inc (NASDAQ: IBKR). Read, here, to understand backwardation and contango in futures markets.

For IVOL measures to remain wound, something bad needs to happen, in short. Otherwise, as seen yesterday, slightly, the S&P 500 drifted lower while certain IVOL measures, such as the Cboe Volatility Index (INDEX: VIX) printed a lower high than that observed on Wednesday.

Per SpotGamma, “If the decline in IVOL is very pronounced, relative to the decline in the S&P, that too can aid in a push-and-pull that actually serves to … resist far-reaching weakness.”

Graphic: Retrieved from SpotGamma. SPX prices X-axis. Option delta Y-axis. When the factors of implied volatility (Vanna) and time change (Charm), hedging ratios change. The graphic is for illustrational purposes, only.

From hereon, the decay and/or removal of the protection that’s been demanded in the past days and weeks may place a like on IVOL and boost markets over a very short term. In the long term, however, weakness is here to stay, says Kai Volatility’s Cem Karsan. 

That’s amid impacts of quantitative tightening (QT) which is manifesting itself as “$4.5 billion less in demand for assets per day,” as well as the blackout period for buybacks (which were consistently “supporting the market”) and options repositioning bolstering the weakness.

Graphic: Via Physik Invest. Data compiled by @jkonopas623. Fed Balance Sheet data, here. Treasury General Account Data, here. Reverse Repo data, here. NL = BS – TGA – RRP.

A lot more on this positioning, and the rollover of some large fund exposures, which have grasped the attention of many online, in some coming letters.

Technical

As of 9:50 AM ET, Friday’s regular session (9:30 AM – 4:00 PM ET), in the S&P 500, is likely to open in the middle part of a balanced overnight inventory, inside of prior-range and -value, suggesting a limited potential for immediate directional opportunity.

In the best case, the S&P 500 trades higher.

Any activity above the $3,638.25 LVNode puts into play the $3,688.75 HVNode. Initiative trade beyond the HVNode could reach as high as the $3,722.50 LVNode and $3,771.25 HVNode, or higher.

In the worst case, the S&P 500 trades lower.

Any activity below the $3,638.25 LVNode puts into play the $3,610.75 HVNode. Initiative trade beyond the latter could reach as low as the $3,554.75 and $3,506.25 HVNode, or lower.

Click here to load today’s key levels into the web-based TradingView charting platform. Note that all levels are derived using the 65-minute timeframe. New links are produced, daily.
Graphic: 65-minute profile chart of the Micro E-mini S&P 500 Futures.

Definitions

Volume Areas: A structurally sound market will build on areas of high volume (HVNodes). Should the market trend for long periods of time, it will lack sound structure, identified as low volume areas (LVNodes). LVNodes denote directional conviction and ought to offer support on any test. 

If participants were to auction and find acceptance into areas of prior low volume (LVNodes), then future discovery ought to be volatile and quick as participants look to HVNodes for favorable entry or exit.

About

After years of self-education, strategy development, mentorship, and trial-and-error, Renato Leonard Capelj began trading full-time and founded Physik Invest to detail his methods, research, and performance in the markets.

Capelj also develops insights around impactful options market dynamics at SpotGamma and is a Benzinga reporter.

Some of his works include conversations with ARK Invest’s Catherine Wood, investors Kevin O’Leary and John Chambers, FTX’s Sam Bankman-Fried, ex-Bridgewater Associate Andy Constan, Kai Volatility’s Cem Karsan, The Ambrus Group’s Kris Sidial, among many others.

Disclaimer

In no way should the materials herein be construed as advice. Derivatives carry a substantial risk of loss. All content is for informational purposes only.

Categories
Commentary

Daily Brief For September 29, 2022

The daily brief is a free glimpse into the prevailing fundamental and technical drivers of U.S. equity market products. Join the 980+ that read this report daily, below!

Graphic updated 8:40 AM ET. Sentiment Neutral if expected /ES open is inside of the prior day’s range. /ES levels are derived from the profile graphic at the bottom of the following section. Levels may have changed since initially quoted; click here for the latest levels. SqueezeMetrics Dark Pool Index (DIX) and Gamma (GEX) calculations are based on where the prior day’s reading falls with respect to the MAX and MIN of all occurrences available. A higher DIX is bullish. At the same time, the lower the GEX, the more (expected) volatility. Learn the implications of volatility, direction, and moneyness. Breadth reflects a reading of the prior day’s NYSE Advance/Decline indicator. VIX reflects a current reading of the CBOE Volatility Index (INDEX: VIX) from 0-100.

Fundamental

More clarity surfaces on the turmoil overseas. After announcements regarding new fiscal policy that would feature steep tax cuts, the prices of longer-dated British bonds fell, prior to the Bank of England (BoE) announcing the purchase of longer-dated bonds to restore stability.

Here’s why the BoE did what it did:

In short, market volatility prompted reflexive feedback responses.

British pensions are required to match assets to liabilities “to ensure that promises to pensioners could be honored,” Bloomberg explained. This prompted purchases of long-dated bonds in size. Essentially, pensions would “enter into swap contracts, using [long-dated bonds] as collateral.” 

That’s because “swaps give[] the pension scheme far more capital to assign to those more interesting asset classes with high potential returns rather than having it tied up in boring gilts.”

“If the bet turned out wrong, [pensions would] have to pay something to the counterparty. And, if the collateral suddenly and unprecedentedly took a massive fall, the counterparty would face a margin call.” 

In size, these “margin calls had turned into a cascade,” forcing pensions to sell into weakness.

Talk of fund insolvencies and the effects of that on the economy, executives running day-to-day operations, not the BoE’s Monetary Policy Committee (MPC), implemented quantitative easing (QE), essentially, buying bonds and pushing their yields lower to ease market volatility.

In stories that followed, a London-based banker discussed his worry that the situation came close to looking like “a Lehman moment.” Cardano Investment executive Kerrin Rosenberg also said “if there was no intervention [], yields could have gone up to 7-8% from 4.5% [] and, in that situation, around 90 per cent of UK pension funds would have run out of collateral.” 

In light of the “madness,” the UK’s Simon Hoare said that actions must be taken at the Treasury and government levels. 

Adding, though volatility eased everywhere (e.g., mortgage rates), including in the US markets, the damages are not contained, some explain.

Graphic: S&P 500 (INDEX: SPX), top. 10-year US Treasury yield (INDEX: TNX), bottom.

UK investors will often “buy overseas assets and hedge away the currency risk,” Jim Leaviss of Bond Vigilantes explained. Amid all the volatility, “if you had bought a dollar bond and hedged it, the dollars that you have effectively sold ‘short’ against sterling as the hedge have rallied, and the counterparty to the FX hedge will call for a collateral payment.”

“Whilst most funds will hold some cash and extremely liquid government bonds against such moves, the size of the recent turmoil probably means that many investors will be having to liquidate credit and other less liquid assets in order to meet these collateral calls.”

Therefore, the aforementioned technical factors have a bearing on the direction of bonds and yields “over coming months.”

Elsewhere, in China, in alignment with a request for state banks to stock up for FX intervention, the “PBOC hit CNH in illiquid hours to have maximum impact,” as “the trouble the PBOC faces is similar to that of Japan – when domestic conditions call for easy policy (vs. US).”

Bob Elliot of Unlimited Funds adds “the moves are likely to be paired with more announcements of macroprudential strategies to slow depreciation. While they will make headlines, most have proven to be reactive and modest in their impact.”

Therefore, “[g]iven weak domestic conditions, the PBOC is very unlikely to prioritize FX over domestic easing – the diff[erence] to the US will only get worse.”

Graphic: Retrieved from Bloomberg. “Overseas demand for goods from China is weakening as the global economy slows … [and] soaring inflation [among] other headwinds elsewhere suppress global demand.” Accordingly, the “cost of shipping goods from China has slumped to the lowest level in more than two years as the world economy stumbles,” just as the US seeks to build more “resilient supply chains” elsewhere.

Positioning

Measures of implied volatility (IVOL) recorded decreases, yesterday, as traders supplied to the market protection, largely, at the front-end where “options are far more sensitive to changes in IVOL and direction,” as SpotGamma put

“As IVOL declines and the S&P rises, the probability of those options paying out falls. This is reflected by their exposure to direction (or Delta) dropping, also. To re-hedge decreased exposure to Delta, liquidity providers may provide the market with a boost.”

Graphic: Retrieved from SpotGamma. SPX prices X-axis. Option delta Y-axis. When the factors of implied volatility (Vanna) and time change (Charm), hedging ratios change. The graphic is for illustrational purposes, only.

As stated yesterday, in the very near term, the risks are skewed to the upside.

“For pumped-up options far from the money to retain their value, there essentially needs to be an adverse move (in price and volatility). Should nothing bad happen, the probability of these options paying out will fade, as will their exposure to direction (or Delta).”

Over a longer-term, however, weakness may persist into October amid impacts of quantitative tightening (QT) which is manifesting itself as “$4.5 billion less in demand for assets per day,” as well as the blackout period for buybacks (which were consistently “supporting the market”) and options repositioning bolstering the weakness.

Graphic: Via Physik Invest. Data compiled by @jkonopas623. Fed Balance Sheet data, here. Treasury General Account Data, here. Reverse Repo data, here. NL = BS – TGA – RRP.

Technical

As of 8:30 AM ET, Thursday’s regular session (9:30 AM – 4:00 PM ET), in the S&P 500, is likely to open in the lower part of a negatively skewed overnight inventory, inside of prior-range and -value, suggesting a limited potential for immediate directional opportunity.

In the best case, the S&P 500 trades higher.

Any activity above the $3,722.50 LVNode puts into play the $3,771.25 HVNode. Initiative trade beyond the $3,771.25 could reach as high as the $3,826.25 and $3,862.25 HVNode, or higher.

In the worst case, the S&P 500 trades lower.

Any activity below the $3,722.50 LVNode puts into play the $3,688.75 HVNode. Initiative trade beyond the HVNode could reach as low as the $3,638.25 LVNode and $3,610.75 HVnode, or lower.

Click here to load today’s key levels into the web-based TradingView charting platform. Note that all levels are derived using the 65-minute timeframe. New links are produced, daily.
Graphic: 65-minute profile chart of the Micro E-mini S&P 500 Futures.

Definitions

Volume Areas: A structurally sound market will build on areas of high volume (HVNodes). Should the market trend for long periods of time, it will lack sound structure, identified as low volume areas (LVNodes). LVNodes denote directional conviction and ought to offer support on any test. 

If participants were to auction and find acceptance into areas of prior low volume (LVNodes), then future discovery ought to be volatile and quick as participants look to HVNodes for favorable entry or exit.

About

After years of self-education, strategy development, mentorship, and trial-and-error, Renato Leonard Capelj began trading full-time and founded Physik Invest to detail his methods, research, and performance in the markets.

Capelj also develops insights around impactful options market dynamics at SpotGamma and is a Benzinga reporter.

Some of his works include conversations with ARK Invest’s Catherine Wood, investors Kevin O’Leary and John Chambers, FTX’s Sam Bankman-Fried, ex-Bridgewater Associate Andy Constan, Kai Volatility’s Cem Karsan, The Ambrus Group’s Kris Sidial, among many others.

Disclaimer

In no way should the materials herein be construed as advice. Derivatives carry a substantial risk of loss. All content is for informational purposes only.

Categories
Commentary

Daily Brief For September 28, 2022

The daily brief is a free glimpse into the prevailing fundamental and technical drivers of U.S. equity market products. Join the 970+ that read this report daily, below!

Graphic updated 8:20 AM ET. Sentiment Neutral if expected /ES open is inside of the prior day’s range. /ES levels are derived from the profile graphic at the bottom of the following section. Levels may have changed since initially quoted; click here for the latest levels. SqueezeMetrics Dark Pool Index (DIX) and Gamma (GEX) calculations are based on where the prior day’s reading falls with respect to the MAX and MIN of all occurrences available. A higher DIX is bullish. At the same time, the lower the GEX, the more (expected) volatility. Learn the implications of volatility, direction, and moneyness. Breadth reflects a reading of the prior day’s NYSE Advance/Decline indicator. VIX reflects a current reading of the CBOE Volatility Index (INDEX: VIX) from 0-100.

Administrative

Apologies, team, if the quality was lacking these past few days. Extremely busy on my end and I look forward to some detailed letters in the near future! – Renato

Fundamental

“Great powers are waging hot wars involving the flow of technologies, goods, and commodities.”

That’s according to Credit Suisse Group AG’s (NYSE: CS) Zoltan Pozsar who believes that the pillars forming the context for a low-inflation world are changing, and this is setting the stage for longer-lasting structural inflation.

In short, inflationary impulses are incoming from non-linear geopolitical and economic conflicts. 

Just yesterday, Europe was investigating attacks on pipelines from Russia; there were “major leaks into the Baltic Sea from two Russian gas pipelines at the cent[er] of an energy standoff.”

“The word sabotage springs to mind,” Javier Blas of Bloomberg, said. “In a single day, the conduits, which link Russia with Germany under the Baltic Sea, have suffered not one, not two, but three separate major leaks.”

Per reports by Refinitiv, seismologists nearby registered “powerful blasts” that “do not resemble signals from earthquakes.” Instead, the explosions likely correspond with hundreds of “kilos (kg) of dynamite.”

Graphic: Retrieved from Bloomberg. 

Given that Nordstream 1 and 2 are not operational, now, the “leaks are more likely a message: [if truly the culprit], Russia is opening a new front on its energy war against Europe.” 

Accordingly, gas prices were higher but “below this year’s peaks,” Refinitiv reported. Generally, across some benchmarks, prices read “more than 200%, higher than in early September 2021.”

Separately, the Bank of England (BoE) is delaying quantitative-tightening (QT) bond sales and opting to purchase longer-dated government bonds in an attempt to restore stability, which we discussed was at risk on Monday and Tuesday.

Graphic: Retrieved from Bloomberg. Credit Default Swaps (CDSs) are a tool for investors to offload credit risk to other market participants.

As a result, after a near-vertical drop (visible below) in Gilts and British corporate bonds (which impacted mortgage lending, for one), UK yields saw some of their biggest drops on record.

Graphic: Retrieved from Bloomberg. Updated September 26, 2022.

The actions over the past few days complicate the Monetary Policy Committee’s (MPC) objective to reach a return to 2% inflation in the medium term.

Graphic: Retrieved, initially, from Bank of America Corporation (NYSE: BAC). Via The Transcript. Interest rates “may be higher for longer” than expected.

At home, here, in the US, yields on the 10-year topped 4.00%. There is a heightened chance of a Federal Reserve (Fed) bump in rates that brings the target rate to 375-400 basis points, while the UK, in stemming its inflationary pressures, is expected to bump by double that amount.

The action to stem inflation is feeding through to demand. Apple Inc (NASDAQ: AAPL) said it would ease plans to boost iPhone production “after an anticipated surge in demand failed to materialize,” a Bloomberg report said

“The supply constraints pulling down on the market since last year have eased and the industry has shifted to a demand-constrained market,” said Nabila Popal, research director at IDC. 

“High inventory in channels and low demand with no signs of immediate recovery has OEMs panicking and cutting their orders drastically for 2022,” a fear we said ARK Invest’s Catherine Wood shared, not too long ago.

Positioning

The beginning of the week was characterized by a sideways-to-lower S&P 500 (INDEX: SPX) and implied volatility (IVOL) metrics, such as the Cboe Volatility Index (INDEX: VIX), rising.

Per IVOL the term structure, demand for options protections seems to be concentrated in options that are shorter-dated and far more sensitive to changes in direction and volatility.

That means for large shifts in price and/or volatility, hedging ratios (e.g., Delta) shift markedly, too. This prompts “hedging feedback mechanisms in both market directions,” per SpotGamma.

Graphic: Retrieved from VIX Central. Taken from The Market Ear. Updated 9/27/2022.

Moreover, the risks are skewed to the upside, SpotGamma added. 

“For pumped-up options far from the money to retain their value, there essentially needs to be an adverse move (in price and volatility). Should nothing bad happen, the probability of these options paying out will fade, as will their exposure to direction (or Delta). [In] re-hedg[ing] decreased exposure to Delta, liquidity providers [] may provide the market with a boost.”

Graphic: Retrieved from SpotGamma. SPX prices X-axis. Option delta Y-axis. When the factors of implied volatility (Vanna) and time change (Charm), hedging ratios change. The graphic is for illustrational purposes, only.

At the same time, there appears to be some “dealer disintermediation” amid “less incentive to make deep, tight markets” due to “capital constraints,” potentially, explained SqueezeMetrics, the creator of the DIX (Dark Pool Index).

This comes after months of high average readings in DIX (likely as market-makers assembled “basket[s] of S&P 500 stocks to create ETF shares, or to hedge away the exposure of a futures contract[s]”). Typically, high DIX readings are associated with stronger 1-month market returns, particularly when put flows are strong (i.e., lower Gamma exposure readings, like now).

Graphic: Retrieved from SqueezeMetrics.

Overall, the trend change is “suggestive of some second thoughts from the [buy-the-dip] crowd, and perhaps (likely!) some deleveraging from elsewhere,” SqueezeMetrics ended.

Technical

As of 8:20 AM ET, Wednesday’s regular session (9:30 AM – 4:00 PM ET), in the S&P 500, is likely to open in the upper part of a negatively skewed overnight inventory, inside of prior-range and -value, suggesting a limited potential for immediate directional opportunity.

In the best case, the S&P 500 trades higher.

Any activity above the $3,638.25 LVNode puts into play the $3,688.75 HVNode. Initiative trade beyond the HVNode could reach as high as the $3,722.50 LVNode and $3,771.25 HVnode, or higher.

In the worst case, the S&P 500 trades lower.

Any activity below the $3,638.25 LVNode puts into play the $3,610.75 HVNode. Initiative trade beyond the HVNode could reach as low as the $3,554.75 and $3,506.25 HVNode, or lower.

Click here to load today’s key levels into the web-based TradingView charting platform. Note that all levels are derived using the 65-minute timeframe. New links are produced, daily.
Graphic: 65-minute profile chart of the Micro E-mini S&P 500 Futures.

Definitions

Volume Areas: A structurally sound market will build on areas of high volume (HVNodes). Should the market trend for long periods of time, it will lack sound structure, identified as low volume areas (LVNodes). LVNodes denote directional conviction and ought to offer support on any test. 

If participants were to auction and find acceptance into areas of prior low volume (LVNodes), then future discovery ought to be volatile and quick as participants look to HVNodes for favorable entry or exit.

POCs: POCs are valuable as they denote areas where two-sided trade was most prevalent in a prior day session. Participants will respond to future tests of value as they offer favorable entry and exit.

About

After years of self-education, strategy development, mentorship, and trial-and-error, Renato Leonard Capelj began trading full-time and founded Physik Invest to detail his methods, research, and performance in the markets.

Capelj also develops insights around impactful options market dynamics at SpotGamma and is a Benzinga reporter.

Some of his works include conversations with ARK Invest’s Catherine Wood, investors Kevin O’Leary and John Chambers, FTX’s Sam Bankman-Fried, ex-Bridgewater Associate Andy Constan, Kai Volatility’s Cem Karsan, The Ambrus Group’s Kris Sidial, among many others.

Disclaimer

In no way should the materials herein be construed as advice. Derivatives carry a substantial risk of loss. All content is for informational purposes only.

Categories
Commentary

Daily Brief For September 26, 2022

The daily brief is a free glimpse into the prevailing fundamental and technical drivers of U.S. equity market products. Join the 950+ that read this report daily, below!

Graphic updated 8:30 AM ET. Sentiment Neutral if expected /ES open is inside of the prior day’s range. /ES levels are derived from the profile graphic at the bottom of the following section. Levels may have changed since initially quoted; click here for the latest levels. SqueezeMetrics Dark Pool Index (DIX) and Gamma (GEX) calculations are based on where the prior day’s reading falls with respect to the MAX and MIN of all occurrences available. A higher DIX is bullish. At the same time, the lower the GEX, the more (expected) volatility. Learn the implications of volatility, direction, and moneyness. Breadth reflects a reading of the prior day’s NYSE Advance/Decline indicator. VIX reflects a current reading of the CBOE Volatility Index (INDEX: VIX) from 0-100.

Fundamental

Overnight news was focused on the drop in Britain’s currency and a surge in bond yields. Per Bloomberg, the UK government’s talk about new fiscal plans and pledged tax cuts, alongside moderate interest rate hikes by the Bank of England (BoE), is the source of the weakness.

That’s because fiscal stimulus, which is part of a strategy to stoke “all-out” growth now, would add to the inflation already high and sticky from supply chokepoints and an easy-moving BoE.

Graphic: Retrieved from Reuters’ John Kemp. This action increases the UK’s competitiveness. It also increases the cost of important items in the UK, like gas for your car and electricity.

“An emergency rate hike would be a damning indictment of the government’s strategy, but it will become increasingly likely if markets fail to stabilize,” said Bloomberg economist Dan Hanson. 

Adding, traders are pricing increased odds of rate increases (~1.75%) by the BoE’s next policy meeting in November. Looking back, in the wake of previous tax giveaways, interest rates rose by a lot to stem the inflationary shock.

Graphic: Retrieved from Bloomberg. “A combination of sharply rising bond yields and a sharply falling currency is very unusual outside emerging markets, and implies doubts over the government’s ability to service its debt.”

The weekend news, has us looking back to our letters on a “self-reinforcing ‘dollar doom loop,’” as Jon Turek of JST Advisors once put forth. It’s the case that the dominant currency for carry, due to easy monetary policies, was the dollar.

However, “the stronger the dollar gets in comparison, the less tenable it becomes as a global reserve,” and this puts pressure on the longer-term trajectory of the currency. 

Knowing that US market liquidity, as well as the dollar’s strong role as a reserve, put the S&P 500 at the center of global carry regimes, an unwinding of carry may compound a market fall affecting nearly all risk assets.

Graphic: Retrieved from Ian Harnett of Absolute Strategy Research. Via The Market Ear.

Accordingly, as put forth in Mr. Blonde’s letter, “[e]ven if you are optimistic about growth and the ability of [the] global economy to digest significant financial conditions tightening, you no longer need to be 100% invested in risky, less liquid, assets when you get a competitive return from risk-free cash.”

Graphic: Retrieved from Mr. Blonde.

Positioning

Following the September options expiration (OPEX), markets tend to have their worst week.

From thereon, the weak seasonality tends to persist for about a month, into mid-October. Given this, Kai Volatility’s Cem Karsan explained, “you need to keep selling the rallies, … [as the] war between the structural negative effects, macro flows, and positioning,” is likely to continue.

Graphic: Retrieved from Mr. Blonde.

Dollar strength should feed into margin compression just now “filtering through” and impacting “international dollar-denominated debt.”

That compounds the impact of quantitative tightening (QT) which is manifesting itself as “$4.5 billion less in demand for assets per day,” as well as the blackout period for buybacks (which were consistently “supporting the market”) and options repositioning.

Read our monetary policy explainers published on September 19 and 20.
Graphic: Via Physik Invest. Data compiled by @jkonopas623. Fed Balance Sheet data, here. Treasury General Account Data, here. Reverse Repo data, here. NL = BS – TGA – RRP.

At the beginning of the 5-week expiration cycle, Karsan explained, Vanna and Charm flows are reduced; there is “significantly less buyback” of counterparty short stock and futures hedges to “the decay of options which sit at the October monthly expiration.”

So, “less support from Vanna and Charm, less support through QT, and less buyback,” presents a “fragile moment” with the next week representing the most “dangerous period” on record.

Graphic: Retrieved from SpotGamma. “SPX prices X-axis. Option Delta Y-axis. When the factors of implied volatility and time change, hedging ratios change. For instance, if SPX is at $4,700.00 and IV jumps 15% (all else equal), the dealer may sell an additional 0.2 Deltas to hedge their exposure to the addition of a positive 0.2 Delta. The graphic is for illustrational purposes, only.”

Ultimately, “December’s quarterly [OPEX] is now coming into the picture, … [where] volatility is generally highly demanded. When you get a lot of volatility supply in that area, you begin to see people who are short getting back the volatility they were short.”

In other words, equities down, implied volatility down is likely to persist for a little while longer as the risks for a “tail” build; “there’s a window that is opening for long volatility to perform probably starting in about a month or two,” through to “January and March.”

Technical

As of 8:30 AM ET, Monday’s regular session (9:30 AM – 4:00 PM ET), in the S&P 500, is likely to open in the lower part of a negatively-skewed overnight inventory, inside of prior-range and -value, suggesting a limited potential for immediate directional opportunity.

In the best case, the S&P 500 trades higher.

Any activity above the $3,688.75 HVNode puts into play the $3,722.50 LVNode. Initiative trade beyond the LVNode could reach as high as the $3,771.25 and $3,826.25 HVNode, or higher.

In the worst case, the S&P 500 trades lower.

Any activity below the $3,688.75 HVNode puts into play the $3,638.25 LVNode. Initiative trade beyond the LVNode could reach as low as the $3,610.75 and $3,554.75 HVNode, or lower.

Click here to load today’s key levels into the web-based TradingView charting platform. Note that all levels are derived using the 65-minute timeframe. New links are produced, daily.
Graphic: 65-minute profile chart of the Micro E-mini S&P 500 Futures.

Definitions

Volume Areas: A structurally sound market will build on areas of high volume (HVNodes). Should the market trend for long periods of time, it will lack sound structure, identified as low volume areas (LVNodes). LVNodes denote directional conviction and ought to offer support on any test. 

If participants were to auction and find acceptance into areas of prior low volume (LVNodes), then future discovery ought to be volatile and quick as participants look to HVNodes for favorable entry or exit.

About

After years of self-education, strategy development, mentorship, and trial-and-error, Renato Leonard Capelj began trading full-time and founded Physik Invest to detail his methods, research, and performance in the markets.

Capelj also develops insights around impactful options market dynamics at SpotGamma and is a Benzinga reporter.

Some of his works include conversations with ARK Invest’s Catherine Wood, investors Kevin O’Leary and John Chambers, FTX’s Sam Bankman-Fried, ex-Bridgewater Associate Andy Constan, Kai Volatility’s Cem Karsan, The Ambrus Group’s Kris Sidial, among many others.

Disclaimer

In no way should the materials herein be construed as advice. Derivatives carry a substantial risk of loss. All content is for informational purposes only.

Categories
Commentary

Daily Brief For September 22, 2022

The daily brief is a free glimpse into the prevailing fundamental and technical drivers of U.S. equity market products. Join the 950+ that read this report daily, below!

Graphic updated 8:00 AM ET. Sentiment Neutral if expected /ES open is inside of the prior day’s range. /ES levels are derived from the profile graphic at the bottom of the following section. Levels may have changed since initially quoted; click here for the latest levels. SqueezeMetrics Dark Pool Index (DIX) and Gamma (GEX) calculations are based on where the prior day’s reading falls with respect to the MAX and MIN of all occurrences available. A higher DIX is bullish. At the same time, the lower the GEX, the more (expected) volatility. Learn the implications of volatility, direction, and moneyness. Breadth reflects a reading of the prior day’s NYSE Advance/Decline indicator. VIX reflects a current reading of the CBOE Volatility Index (INDEX: VIX) from 0-100.

Administrative

An easy read, today. For more complex, see the September 20 and 19 letters. Also, there will not be a letter published for Friday, September 23, 2022. See you next week, team!

Fundamental

Equity markets traded down, yesterday, on the heels of the Federal Reserve’s (Fed) decision to raise interest rates by 0.75% and “keep at it” for longer, eyeing a 1.25% jump, in sum, by 2023.

This puts the current target rate at 3.00-3.25%.

Separately, if the “keep at it” quote sounds familiar, that’s because it is. The Fed Paul Volcker’s memoir is titled “Keeping at It.”

Graphic: CME Group Inc’s (NASDAQ: CME) FedWatch Tool shows higher odds of a 75 to 100 basis point rate hike in November, along the lines of what the futures market was pricing heading into the event.

The Fed Chair Jerome Powell admitted there may be below-trend growth and the potential for unemployment to reach 4.4% next year, up from the current rate of 3.7%. Projected increases, as of yesterday, show interest rates at 4.4% by 2023, and 4.6% in 2023, before moderation in 2024 to 3.9%, as well summarized by Bloomberg.

Graphic: Retrieved from Bloomberg.

Moreover, economists suggest that raising rates to 4.5% would cost the economy nearly 1.7 million jobs while rates at 5% would bring that number to 2 million. A higher savings rate and increased funds at the state level would likely cushion the blow, however.

In response, the likes of Ark Invest’s Cathie Wood, who we quoted recently regarding her thoughts on why the Fed needs to lower the pace of tightening and/or cut, said:

“Most disappointing about the Fed’s decision today was its unanimity. None of those voting on the Federal Reserve is focused on the significant price deflation in the pipeline. The Fed seems to be making decisions based on lagging indicators and analogies.”

She adds that the Fed is setting the stage for deflation:

“The Fed is solving supply chain issues by crushing demand and, in my view, unleashing deflation, setting it up for a major pivot.”

Graphic: Initially retrieved from Bloomberg. Taken from Ophir Gottlieb who concludes costs are dropping, as observed via shipping, gasoline, manufacturing, cars, and rent measures.

Moreover, it’s the case that “[a]s rates rise and debt servicing costs increase, ‘many zombie institutions, zombie households, corporates, banks, shadow banks, and zombie countries are going to die,’” said economist Nouriel Roubini, who predicted the 2008 financial crisis. 

Prior to the Fed event, Roubini forecasted a 75 basis point hike in September, followed by a 50 basis point hike in November. The market is pricing more than what Roubini thought the Fed would probably do after Wednesday’s Fed meeting.

In his opinion, stay “light on equities and have more cash, … [as] equities and other assets can fall by 10%, 20%, 30%.”

Positioning

In short, unexpected was the post-event response. In recent times, post-Fed moves have been positive, driven by the “rebalancing of dealer inventory,” per Kai Volatility’s Cem Karsan.

That didn’t happen and let’s unpack why.

Basically, into the event, traders demanded protection and bid implied volatility (IVOL). The assumption is that counterparties, who are likely on the other end, have exposure to positive Delta and negative Gamma, which they hedge through negative Delta trades in the underlying.

Should fears have been assuaged, the supply of that protection once demanded, would have decreased IVOL (and options Delta), providing the markets a boost.

Graphic: Retrieved from SqueezeMetrics.

That didn’t happen. Instead, traders added protection, as shown by this SpotGamma graphic tracking changes in put open interest on the S&P 500 (INDEX: SPX).

Graphic: Retrieved from SpotGamma. Updated September 22, 2022.

This bid some basic measures of IVOL into the close.

Graphic: Retrieved from VIX Central. Updated September 21, 2022.

That’s as these particular options, which were added at much lower prices, as I explained in a SpotGamma note, recently, “are far more sensitive to changes in direction and IVOL.”

These options can go “from having very little Delta (exposure to direction) to a lot more Delta on the move lower,” quickly. “If we maintain that liquidity providers are short those puts, a positive Delta trade, then those liquidity providers [will sell] futures and stock, a negative Delta trade to stay hedged.”

Graphic: Retrieved from SqueezeMetrics.

Notwithstanding, it’s still the case that a “reload on fresh short-dated downside” flows heighten the risk of a “negative Delta squeeze … into month end,” said Nomura Holdings Inc’s (NYSE: NMR) Charlie McElligott. 

Therefore, “you have to consider a move up [to] $4,000.00 as part of your distribution of outcomes to the upside,” as that is near where “market makers are ‘long,’” as part of an impactful collar trade many are aware sits.

As an aside, some online conversation was sparked around placing cash into riskless trades for some small, but guaranteed, rates of return. In that conversation, Box Spreads were put forth as a solution to lend cash and earn a competitive interest rate.

For context, “Boxes allow market participants to create a loan structure similar to a Treasury bill. T-bills are ‘discount’ instruments that are purchased at a value less than the stated face value. Upon maturity, bills call for the return of the stated face value.”

“For example, one might buy a $1 million 90-day T-bill for $998,000. Ninety days later, the $1 million face or principal value is returned and the $2,000 discount is earned as interest. One may represent the rate on this transaction as a 0.80% or 80 basis point discount yield [= (360/90) x ($2,000/$1,000,000)]. The effective rate on a box represents a ‘discount yield’ similar to a quoted T-bill rate.”

Graphic: Retrieved from boxtrades.com.

IPS Strategic Capital’s Pat Hennessy explains that SPX boxes “typically yield[] 20-40 bps above [the] corresponding maturity risk-free rate.” Additionally, there are tax advantages to using the S&P 500’s 1256 contracts. 

For easier fills, use the “3K/4K line in an AM settled expiry,” Hennessy noted. “Helps if you know where the broker market is.”

Technical

As of 8:00 AM ET, Thursday’s regular session (9:30 AM – 4:00 PM ET), in the S&P 500, is likely to open in the upper part of a balanced overnight inventory, inside of prior-range and -value, suggesting a limited potential for immediate directional opportunity.

In the best case, the S&P 500 trades higher.

Any activity above the $3,826.25 HVNode puts into play the $3,857.25 HVNode. Initiative trade beyond the latter could reach as high as the $3,893.00 VPOC and $3,936.25 ONH, or higher.

In the worst case, the S&P 500 trades lower.

Any activity below the $3,826.25 HVNode puts into play the $3,770.75 HVNode. Initiative trade beyond the HVNode could reach as low as the $3,722.50 LVNode and $3,688.75 HVNode, or lower.

Click here to load today’s key levels into the web-based TradingView charting platform. Note that all levels are derived using the 65-minute timeframe. New links are produced, daily.
Graphic: 65-minute profile chart of the Micro E-mini S&P 500 Futures.

Definitions

Volume Areas: A structurally sound market will build on areas of high volume (HVNodes). Should the market trend for long periods of time, it will lack sound structure, identified as low volume areas (LVNodes). LVNodes denote directional conviction and ought to offer support on any test. 

If participants were to auction and find acceptance into areas of prior low volume (LVNodes), then future discovery ought to be volatile and quick as participants look to HVNodes for favorable entry or exit.

POCs: POCs are valuable as they denote areas where two-sided trade was most prevalent in a prior day session. Participants will respond to future tests of value as they offer favorable entry and exit.

MCPOCs: POCs are valuable as they denote areas where two-sided trade was most prevalent over numerous day sessions. Participants will respond to future tests of value as they offer favorable entry and exit.

About

After years of self-education, strategy development, mentorship, and trial-and-error, Renato Leonard Capelj began trading full-time and founded Physik Invest to detail his methods, research, and performance in the markets.

Capelj also develops insights around impactful options market dynamics at SpotGamma and is a Benzinga reporter.

Some of his works include conversations with ARK Invest’s Catherine Wood, investors Kevin O’Leary and John Chambers, FTX’s Sam Bankman-Fried, ex-Bridgewater Associate Andy Constan, Kai Volatility’s Cem Karsan, The Ambrus Group’s Kris Sidial, among many others.

Disclaimer

In no way should the materials herein be construed as advice. Derivatives carry a substantial risk of loss. All content is for informational purposes only.

Categories
Commentary

Daily Brief For September 16, 2022

The daily brief is a free glimpse into the prevailing fundamental and technical drivers of U.S. equity market products. Join the 900+ that read this report daily, below!

Graphic updated 6:50 AM ET. Sentiment Risk-Off if expected /ES open is below the prior day’s range. /ES levels are derived from the profile graphic at the bottom of the following section. Levels may have changed since initially quoted; click here for the latest levels. SqueezeMetrics Dark Pool Index (DIX) and Gamma (GEX) calculations are based on where the prior day’s reading falls with respect to the MAX and MIN of all occurrences available. A higher DIX is bullish. At the same time, the lower the GEX, the more (expected) volatility. Learn the implications of volatility, direction, and moneyness. Breadth reflects a reading of the prior day’s NYSE Advance/Decline indicator. VIX reflects a current reading of the CBOE Volatility Index (INDEX: VIX) from 0-100.

Administrative

A longer note so stick with me!

Updates are pending for the above dashboard. Exciting! Beyond this, the newsletter is getting a revamp in other parts. If you have any feedback on what should be changed, please comment!

Also, I am going to refer everyone to a conversation between Joseph Wang and Andy Constan, as well as some updates Cem Karsan of Kai Volatility made (HERE and HERE). That is, in part, a primer for what we will be talking more about, soon.

Fundamental

Talked about yesterday was the prospects of contractionary monetary policy reducing inflation and growth. BlackRock Inc (NYSE: BLK) strategists, even, put forth that a “deep recession” is needed to stem inflation. In short, “there is no way around this,” they claim.

Graphic: Retrieved from The Market Ear. FedEx Corporation (NYSE: FDX) sold 20% on warning about the global economy.

From thereon, we talked about how rates rising would “bring private sector credit growth down,” as well as “private sector spending and, hence, the economy.”

Based on where rates are at, the market may still be too expensive.

Graphic: Retrieved from Bloomberg via Michael J. Kramer. “What is amazing is how expensive this market is relative to rates. The spread between the S&P 500 Earnings yield and the 10-Yr nominal rate is at multi-year lows.”

On the other hand, some argue inflation peaks are in. ARK Invest’s Cathie Wood suggests “deflation [is] in the pipeline, heading for the PPI, CPI, PCE Deflator.” 

Tesla Inc’s (NASDAQ: TSLA) Elon Musk added that he thinks the Federal Reserve (Fed) may make a mistake noting “a major Fed rate hike risks deflation.” Musk suggested the Fed should drop 0.25%, basing his decision on non-lagging indicators, unlike the Fed.

That’s not in line with what CME Group Inc’s (NASDAQ: CME) FedWatch tool shows. Through this tool we see traders pricing an 80% chance of a 0.50-0.75% hike, all the while quantitative tightening (reducing Fed Treasuries and mortgage-backed securities holdings) accelerated on September 15. 

UST and MBS will roll off (which could turn into “outright sales”) at a pace of $95 billion per month, now, increasing competition for funding among commercial banks, and bolstering borrowing costs, as explained, below.

Graphic: Via Physik Invest. Data compiled by @jkonopas623. Fed Balance Sheet data, here. Treasury General Account Data, here. Reverse Repo data, here. NL = BS – TGA – RRP.

According to Bank of America Corporation (NYSE: BAC), since 2010, nearly 50% of the moves in market price-to-earnings multiples were explained by quantitative easing (QE), the inverse of QT, through which the Fed (or central banks, in general) creates credit used to buy securities in open markets, MarketWatch explains.

Graphic: Retrieved from the Federal Reserve Bank of Richmond. “The Fed Is Shrinking Its Balance Sheet. What Does That Mean?”

The “purchases of long-dated bonds are intended to drive down yields, which is seen enhancing appetite for risk assets as investors look elsewhere for higher returns. QE creates new reserves on bank balance sheets. The added cushion gives banks, which must hold reserves in line with regulations, more room to lend or to finance trading activity by hedge funds and other financial market participants, further enhancing market liquidity.”

Graphic: Retrieved from Bank of America Corporation (NYSE: BAC) via MarketWatch.

The liability side of the Fed’s balance sheet is what “matters to financial markets.” 

Thus far, “reductions in Fed liabilities have been concentrated in the Treasury General Account, or TGA, which effectively serves as the government’s checking account” to run the day-to-day business.

Given that we’re talking about balance sheets, here, Fed liabilities must match assets. Thus, a rise in the TGA must be accompanied by a decline in bank reserves (which are liabilities to the Fed). This, as a result, decreases the room banks have to “lend or to finance trading activity by hedge funds and other financial market participants, [which] further [cuts into] market liquidity.”

With the Treasury set to increase debt issuance, boosting TGA, it will effectively take “money out of the economy and put[] it into the government’s checking account.” The linked reduction in bank deposits and reserves bolsters “repurchase agreement rates and borrowing benchmarks linked to them, like the Secured Overnight Financing Rate,” per Bloomberg.

Graphic: Retrieved from the Federal Reserve Bank of New York. “The Secured Overnight Financing Rate (SOFR) is a broad measure of the cost of borrowing cash overnight collateralized by Treasury securities.”

Adding, this may play into “an additional tightening of overall financial conditions, in addition to the increase in the main fed funds rate target that the central bank intends to continue boosting.”

This will “put more pressure on the private sector to absorb those Treasurys, which means less money to put into other assets” that may be riskier, like equities, said Aidan Garrib, the head of global macro strategy and research at Montreal-based PGM Global.

Positioning

As of 6:50 AM ET, Friday’s expected volatility, via the Cboe Volatility Index (INDEX: VIX), sits at ~1.44%. Net gamma exposures decreasing may promote generally more expansive ranges.

Graphic: Via Physik Invest. Data retrieved from SqueezeMetrics.

Given where realized (RVOL) and implied (IVOL) volatility measures are, as well as skew, it is beneficial to be a buyer of options structures.

This is as there’s been a lot of speculation, particularly on the downside (put options), setting the stage for a more volatile and fragile market environment, says Kai Volatility’s Cem Karsan.

“On the index level, people are not well hedged,” a departure from what the case was heading into and through much of 2022. It’s the case that heading into 2022, traders were well hedged. Into and through the decline, traders’ monetization of existing hedges, as well as counterparty reactions, “compressed volatility” realized across US equities, as explained on July 15, 2022.

This made for some attractive trade opportunities seen here.

Graphic: Retrieved from The Market Ear. “VIX has decoupled from cross-asset volatilities.”

Now, given that the go-to trade is to sell stock and puts, short interest has grown, as have other risks, associated with this activity; essentially people are “los[ing] faith in convexity and risk premia’s ability to work,” as a result of “poor performance of vol,” and, the reaction to their “pain and financial loss,” is setting the stage for tail risks heading into the Q1 and Q2 2023.

The sale (purchase) of the front (back) expirations will bolster market pinning; as SpotGamma puts forth, “the positive impact of put closers and rolls, as well as decay,” is easing the market drop. However, this “positioning likely compounds drops and adds to volatility,” in the future.

To quote: “Though the removal of put-heavy exposures can boost markets higher, too add, the positive impacts are dulled via the demand for put exposures at much lower prices.”

Graphic: Retrieved from SpotGamma.

These particular options, which are at much lower prices, “are far more sensitive to changes in direction and IVOL,” as I explained in a SpotGamma note. These options can go “from having very little Delta (exposure to direction) to a lot more Delta on the move lower,” quickly.

Graphic: Via Mohamed Bouzoubaa et al’s Exotic Options and Hybrids.

“If we maintain that liquidity providers are short those puts, a positive Delta trade, then those liquidity providers [will sell] futures and stock, a negative Delta trade to stay hedged.”

Graphic: Via Banco Santander SA (NYSE: SAN) research.

Technical

As of 6:50 AM ET, Friday’s regular session (9:30 AM – 4:00 PM ET), in the S&P 500, is likely to open in the lower part of a negatively skewed overnight inventory, outside of prior-range and -value, suggesting a potential for immediate directional opportunity.

In the best case, the S&P 500 trades higher.

Any activity above the $3,909.25 MCPOC puts into play the $3,935.00 VPOC. Initiative trade beyond the latter could reach as high as the $3,964.75 HVNode and $4,001.00 VPOC, or higher.

In the worst case, the S&P 500 trades lower.

Any activity below the $3,909.25 MCPOC puts into play the $3,857.25 HVNode. Initiative trade beyond the latter could reach as low as the $3,826.25 and $3,770.75 HVNodes, or lower.

Click here to load today’s key levels into the web-based TradingView charting platform. Note that all levels are derived using the 65-minute timeframe. New links are produced, daily.
Graphic: 65-minute profile chart of the Micro E-mini S&P 500 Futures.

Considerations: A feature of this 2022 down market was responsiveness near key-technical areas (that are discernable visually on a chart). This suggested to us that technically-driven traders with shorter time horizons were very active. 

Such traders often lack the wherewithal to defend retests and, additionally, the type of trade may be indicative of the other time frame participants waiting for more information to initiate trades.

That’s changing. The key levels, quoted above, are snapping far easier and are not as well respected. That means other time frame participants with wherewithal are initiating trades. 

Those are the participants you should not fade.

Definitions

Volume Areas: A structurally sound market will build on areas of high volume (HVNodes). Should the market trend for long periods of time, it will lack sound structure, identified as low volume areas (LVNodes). LVNodes denote directional conviction and ought to offer support on any test. 

If participants were to auction and find acceptance into areas of prior low volume (LVNodes), then future discovery ought to be volatile and quick as participants look to HVNodes for favorable entry or exit.

POCs: POCs are valuable as they denote areas where two-sided trade was most prevalent in a prior day session. Participants will respond to future tests of value as they offer favorable entry and exit.

MCPOCs: POCs are valuable as they denote areas where two-sided trade was most prevalent over numerous day sessions. Participants will respond to future tests of value as they offer favorable entry and exit.

Gamma: Gamma is the sensitivity of an option to changes in the underlying price. Dealers that take the other side of options trades hedge their exposure to risk by buying and selling the underlying. When dealers are short-gamma, they hedge by buying into strength and selling into weakness. When dealers are long-gamma, they hedge by selling into strength and buying into weakness. The former exacerbates volatility. The latter calms volatility.

About

After years of self-education, strategy development, mentorship, and trial-and-error, Renato Leonard Capelj began trading full-time and founded Physik Invest to detail his methods, research, and performance in the markets.

Capelj also develops insights around impactful options market dynamics at SpotGamma and is a Benzinga reporter.

Some of his works include conversations with ARK Invest’s Catherine Wood, investors Kevin O’Leary and John Chambers, FTX’s Sam Bankman-Fried, ex-Bridgewater Associate Andy Constan, Kai Volatility’s Cem Karsan, The Ambrus Group’s Kris Sidial, among many others.

Disclaimer

In no way should the materials herein be construed as advice. Derivatives carry a substantial risk of loss. All content is for informational purposes only.