Categories
Commentary

Daily Brief For September 26, 2022

The daily brief is a free glimpse into the prevailing fundamental and technical drivers of U.S. equity market products. Join the 950+ that read this report daily, below!

Graphic updated 8:30 AM ET. Sentiment Neutral if expected /ES open is inside of the prior day’s range. /ES levels are derived from the profile graphic at the bottom of the following section. Levels may have changed since initially quoted; click here for the latest levels. SqueezeMetrics Dark Pool Index (DIX) and Gamma (GEX) calculations are based on where the prior day’s reading falls with respect to the MAX and MIN of all occurrences available. A higher DIX is bullish. At the same time, the lower the GEX, the more (expected) volatility. Learn the implications of volatility, direction, and moneyness. Breadth reflects a reading of the prior day’s NYSE Advance/Decline indicator. VIX reflects a current reading of the CBOE Volatility Index (INDEX: VIX) from 0-100.

Fundamental

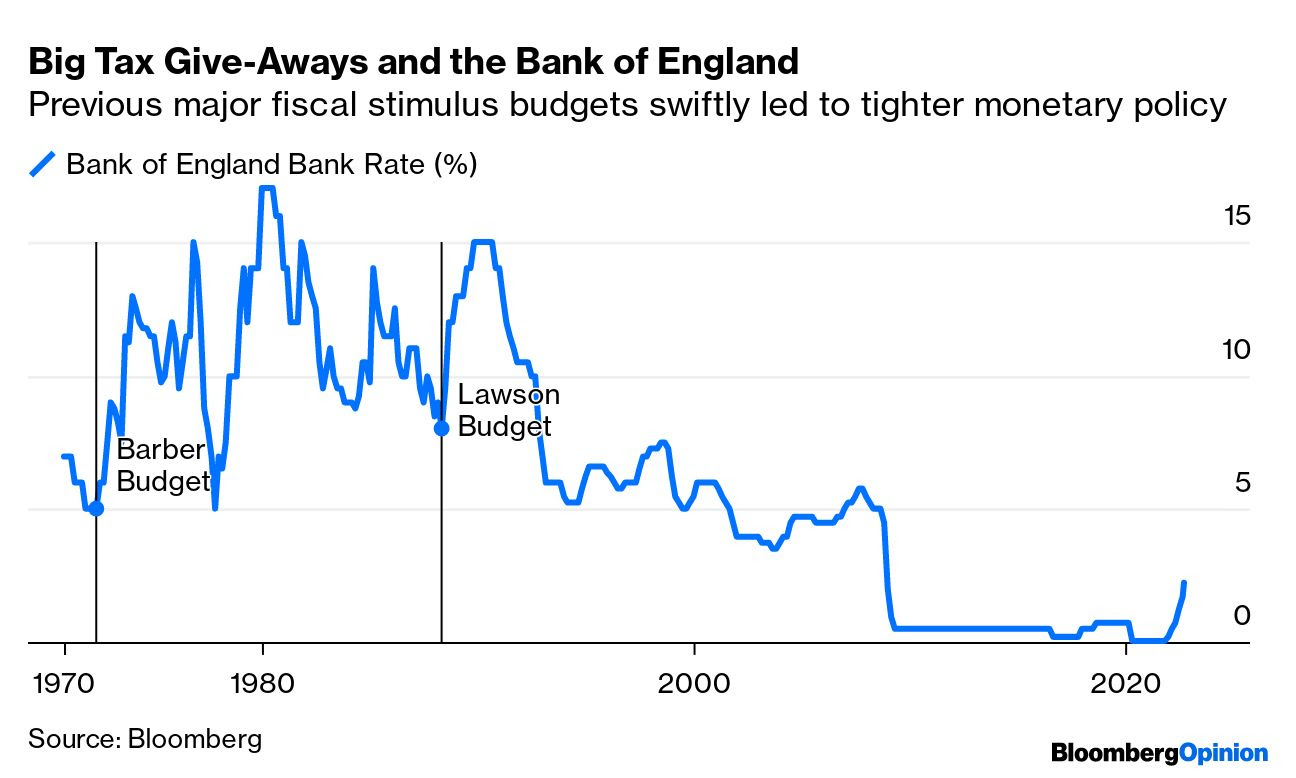
Overnight news was focused on the drop in Britain’s currency and a surge in bond yields. Per Bloomberg, the UK government’s talk about new fiscal plans and pledged tax cuts, alongside moderate interest rate hikes by the Bank of England (BoE), is the source of the weakness.

That’s because fiscal stimulus, which is part of a strategy to stoke “all-out” growth now, would add to the inflation already high and sticky from supply chokepoints and an easy-moving BoE.

Graphic: Retrieved from Reuters’ John Kemp. This action increases the UK’s competitiveness. It also increases the cost of important items in the UK, like gas for your car and electricity.

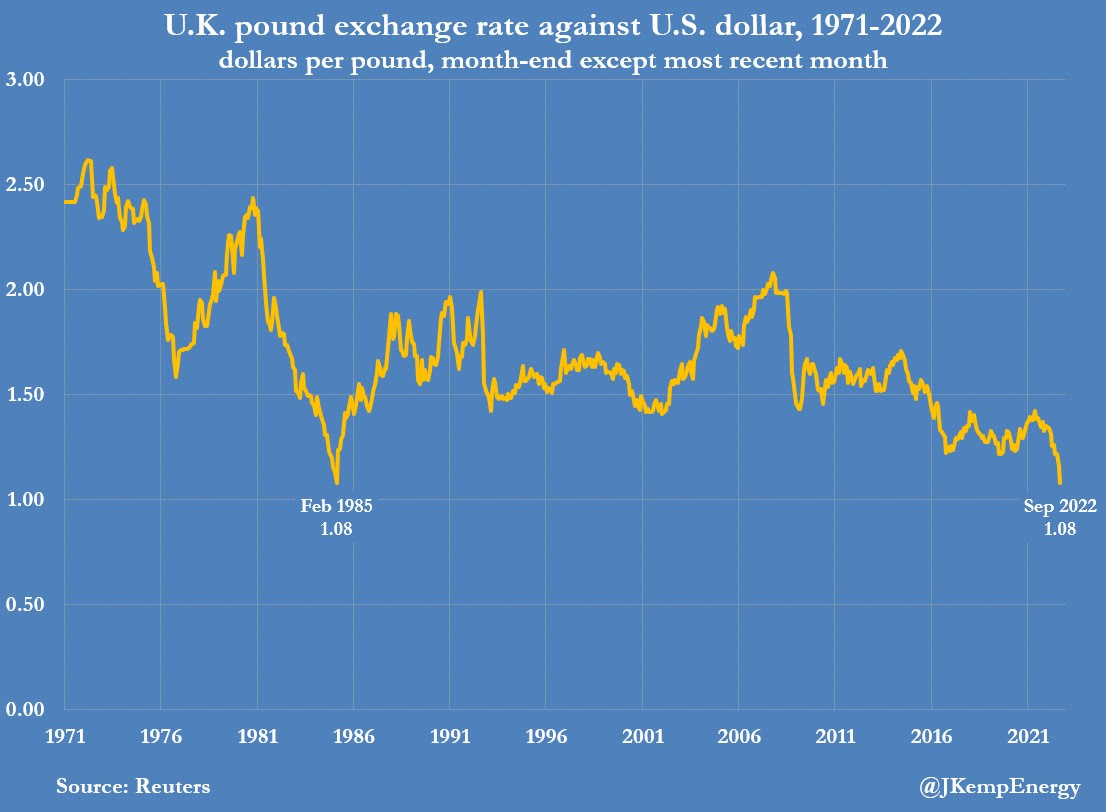
“An emergency rate hike would be a damning indictment of the government’s strategy, but it will become increasingly likely if markets fail to stabilize,” said Bloomberg economist Dan Hanson. 

Adding, traders are pricing increased odds of rate increases (~1.75%) by the BoE’s next policy meeting in November. Looking back, in the wake of previous tax giveaways, interest rates rose by a lot to stem the inflationary shock.

Graphic: Retrieved from Bloomberg. “A combination of sharply rising bond yields and a sharply falling currency is very unusual outside emerging markets, and implies doubts over the government’s ability to service its debt.”

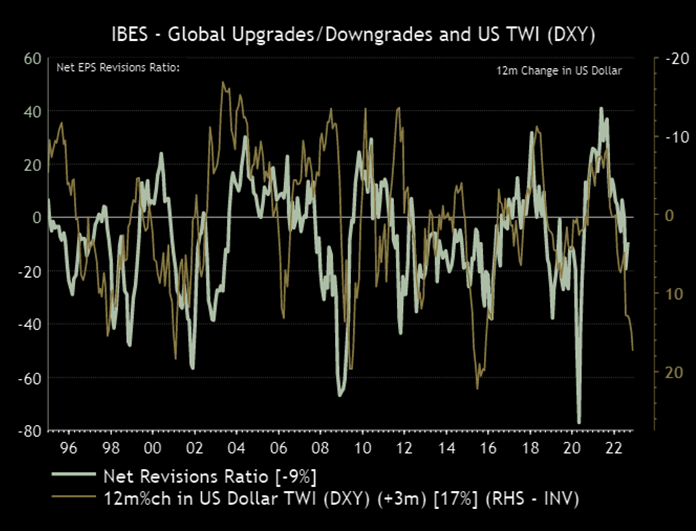
The weekend news, has us looking back to our letters on a “self-reinforcing ‘dollar doom loop,’” as Jon Turek of JST Advisors once put forth. It’s the case that the dominant currency for carry, due to easy monetary policies, was the dollar.

However, “the stronger the dollar gets in comparison, the less tenable it becomes as a global reserve,” and this puts pressure on the longer-term trajectory of the currency. 

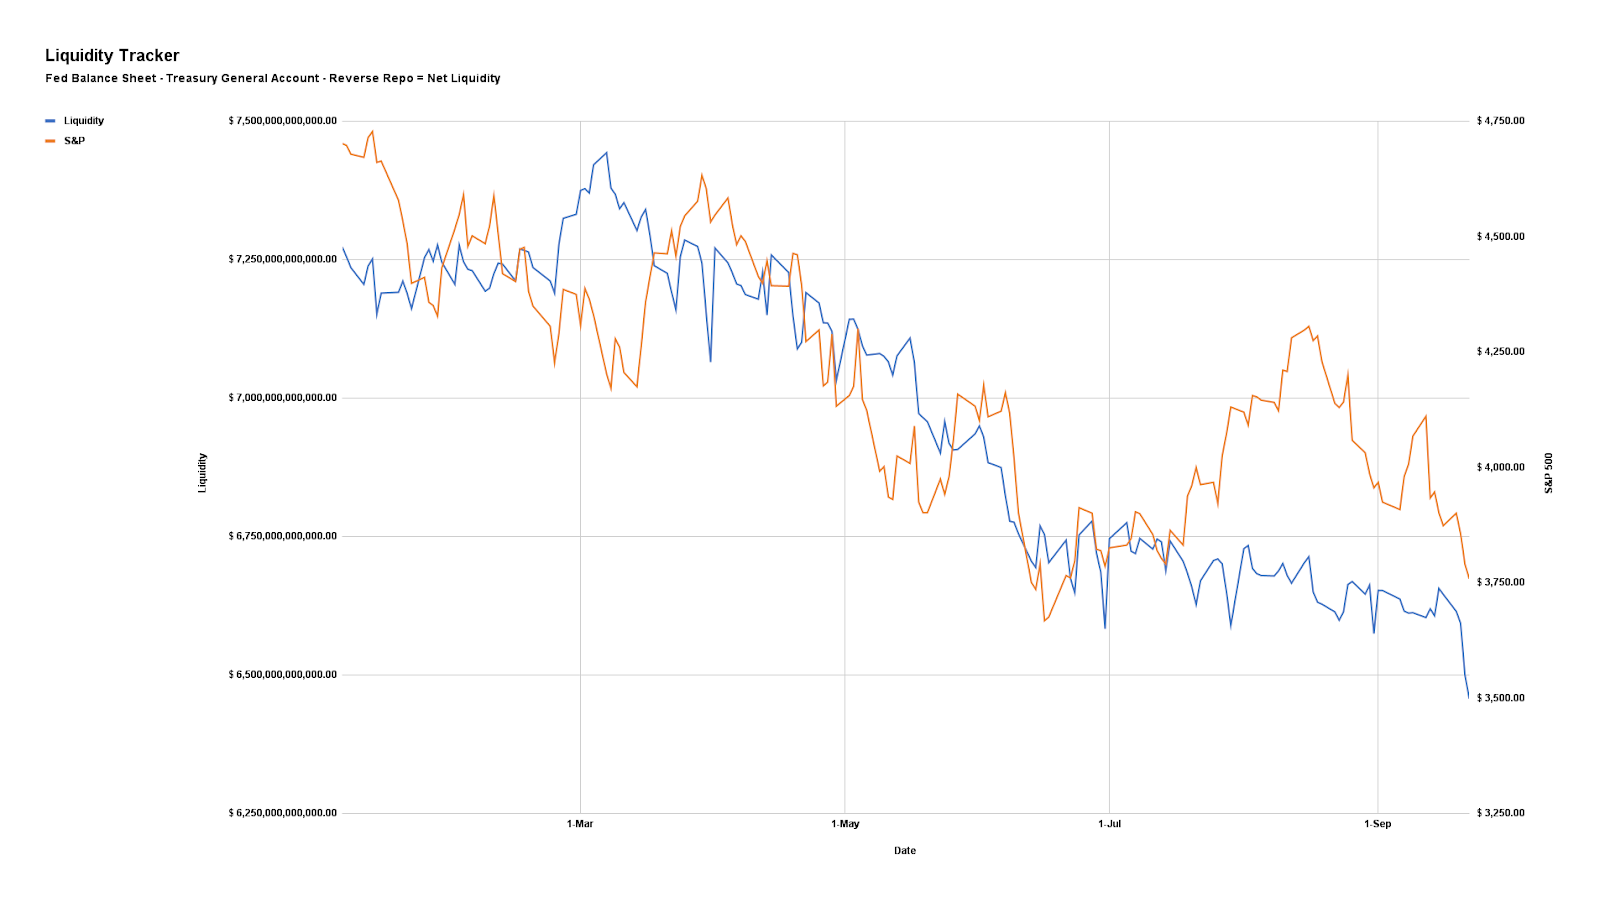
Knowing that US market liquidity, as well as the dollar’s strong role as a reserve, put the S&P 500 at the center of global carry regimes, an unwinding of carry may compound a market fall affecting nearly all risk assets.

Graphic: Retrieved from Ian Harnett of Absolute Strategy Research. Via The Market Ear.

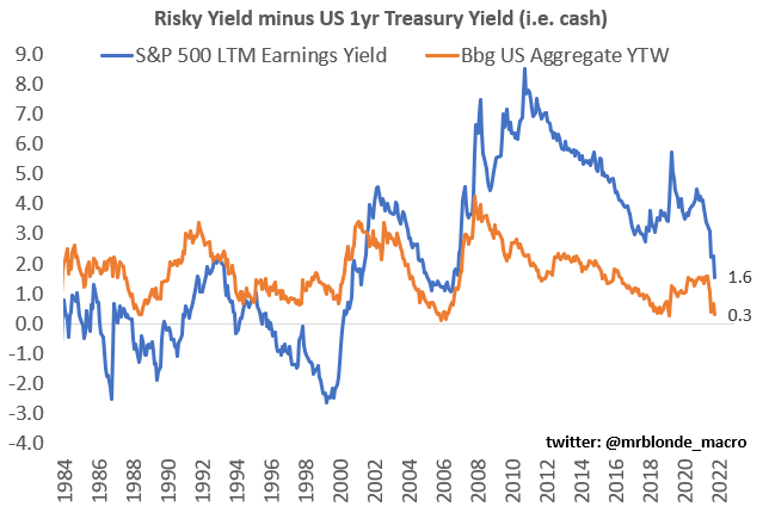
Accordingly, as put forth in Mr. Blonde’s letter, “[e]ven if you are optimistic about growth and the ability of [the] global economy to digest significant financial conditions tightening, you no longer need to be 100% invested in risky, less liquid, assets when you get a competitive return from risk-free cash.”

Graphic: Retrieved from Mr. Blonde.

Positioning

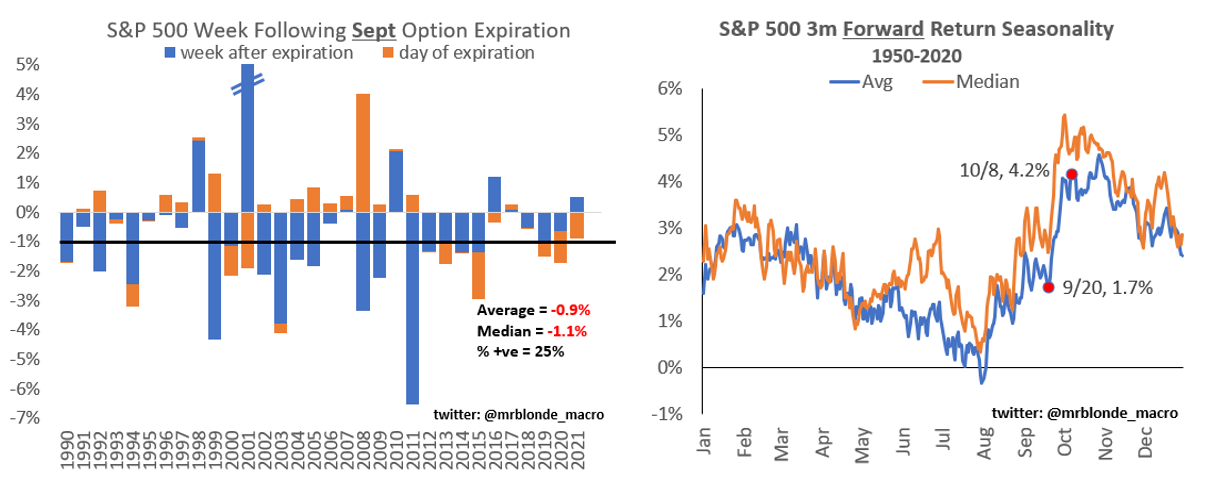
Following the September options expiration (OPEX), markets tend to have their worst week.

From thereon, the weak seasonality tends to persist for about a month, into mid-October. Given this, Kai Volatility’s Cem Karsan explained, “you need to keep selling the rallies, … [as the] war between the structural negative effects, macro flows, and positioning,” is likely to continue.

Graphic: Retrieved from Mr. Blonde.

Dollar strength should feed into margin compression just now “filtering through” and impacting “international dollar-denominated debt.”

That compounds the impact of quantitative tightening (QT) which is manifesting itself as “$4.5 billion less in demand for assets per day,” as well as the blackout period for buybacks (which were consistently “supporting the market”) and options repositioning.

Read our monetary policy explainers published on September 19 and 20.
Graphic: Via Physik Invest. Data compiled by @jkonopas623. Fed Balance Sheet data, here. Treasury General Account Data, here. Reverse Repo data, here. NL = BS – TGA – RRP.

At the beginning of the 5-week expiration cycle, Karsan explained, Vanna and Charm flows are reduced; there is “significantly less buyback” of counterparty short stock and futures hedges to “the decay of options which sit at the October monthly expiration.”

So, “less support from Vanna and Charm, less support through QT, and less buyback,” presents a “fragile moment” with the next week representing the most “dangerous period” on record.

Graphic: Retrieved from SpotGamma. “SPX prices X-axis. Option Delta Y-axis. When the factors of implied volatility and time change, hedging ratios change. For instance, if SPX is at $4,700.00 and IV jumps 15% (all else equal), the dealer may sell an additional 0.2 Deltas to hedge their exposure to the addition of a positive 0.2 Delta. The graphic is for illustrational purposes, only.”

Ultimately, “December’s quarterly [OPEX] is now coming into the picture, … [where] volatility is generally highly demanded. When you get a lot of volatility supply in that area, you begin to see people who are short getting back the volatility they were short.”

In other words, equities down, implied volatility down is likely to persist for a little while longer as the risks for a “tail” build; “there’s a window that is opening for long volatility to perform probably starting in about a month or two,” through to “January and March.”

Technical

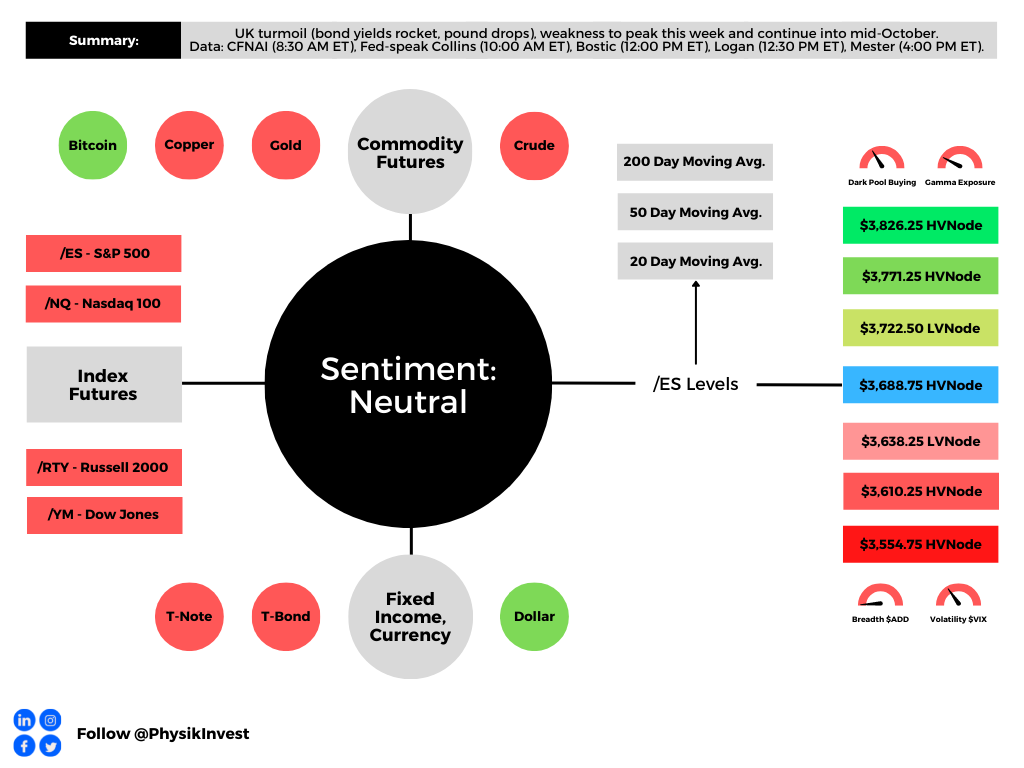
As of 8:30 AM ET, Monday’s regular session (9:30 AM – 4:00 PM ET), in the S&P 500, is likely to open in the lower part of a negatively-skewed overnight inventory, inside of prior-range and -value, suggesting a limited potential for immediate directional opportunity.

In the best case, the S&P 500 trades higher.

Any activity above the $3,688.75 HVNode puts into play the $3,722.50 LVNode. Initiative trade beyond the LVNode could reach as high as the $3,771.25 and $3,826.25 HVNode, or higher.

In the worst case, the S&P 500 trades lower.

Any activity below the $3,688.75 HVNode puts into play the $3,638.25 LVNode. Initiative trade beyond the LVNode could reach as low as the $3,610.75 and $3,554.75 HVNode, or lower.

Click here to load today’s key levels into the web-based TradingView charting platform. Note that all levels are derived using the 65-minute timeframe. New links are produced, daily.
Graphic: 65-minute profile chart of the Micro E-mini S&P 500 Futures.

Definitions

Volume Areas: A structurally sound market will build on areas of high volume (HVNodes). Should the market trend for long periods of time, it will lack sound structure, identified as low volume areas (LVNodes). LVNodes denote directional conviction and ought to offer support on any test. 

If participants were to auction and find acceptance into areas of prior low volume (LVNodes), then future discovery ought to be volatile and quick as participants look to HVNodes for favorable entry or exit.

About

After years of self-education, strategy development, mentorship, and trial-and-error, Renato Leonard Capelj began trading full-time and founded Physik Invest to detail his methods, research, and performance in the markets.

Capelj also develops insights around impactful options market dynamics at SpotGamma and is a Benzinga reporter.

Some of his works include conversations with ARK Invest’s Catherine Wood, investors Kevin O’Leary and John Chambers, FTX’s Sam Bankman-Fried, ex-Bridgewater Associate Andy Constan, Kai Volatility’s Cem Karsan, The Ambrus Group’s Kris Sidial, among many others.

Disclaimer

In no way should the materials herein be construed as advice. Derivatives carry a substantial risk of loss. All content is for informational purposes only.

Categories
Commentary

Daily Brief For September 12, 2022

The daily brief is a free glimpse into the prevailing fundamental and technical drivers of U.S. equity market products. Join the 900+ that read this report daily, below!

Graphic updated 7:30 AM ET. Sentiment Risk-On if expected /ES open is above the prior day’s range. /ES levels are derived from the profile graphic at the bottom of the following section. Levels may have changed since initially quoted; click here for the latest levels. SqueezeMetrics Dark Pool Index (DIX) and Gamma (GEX) calculations are based on where the prior day’s reading falls with respect to the MAX and MIN of all occurrences available. A higher DIX is bullish. At the same time, the lower the GEX, the more (expected) volatility. Learn the implications of volatility, direction, and moneyness. Breadth reflects a reading of the prior day’s NYSE Advance/Decline indicator. VIX reflects a current reading of the CBOE Volatility Index (INDEX: VIX) from 0-100.

Administrative

Hey team, before we get started, let’s address the mismatch some observed last week with this letter’s levels and S&P quotes, versus what they saw at home. 

It is basically the case that our charting platform rolled over to the December S&P 500 Index futures contract on September 9, 2022. This was about 1-week ahead of the expiry of the old contract on September 16, 2022.

Going forward, unless otherwise noted, 6-days prior to the expiration of a quoted contract, the levels and prices in this letter may reflect that of the new, father-dated contract.

As an aside, based on CME Group Inc’s (NASDAQ: CME) Equity Quarterly Roll Analyzer Tool, the pace of the E-mini S&P 500 (FUTURE: /ES) roll is far off of what it has historically been at this stage of the roll period. 

This roll, too, caught your letter’s writer by surprise. Sorry!

Graphic: Retrieved from CME Group Inc (NASDAQ: CME).

Moving on, coverage this week may be sporadic due to some uncertain travel commitments. It is seeming very likely that there may not be a letter published on September 13 and 14, 2022.

Fundamental

Let’s get into it.

At its core, there’s a lot of stuff happening on the monetary and fiscal front. Guiding some of this action, on those fronts, are (geo)political happenings, the rising tide of populism, and beyond.

On the political fronts, Ukrainians “broke through weakened Russian lines, seizing the strategic railway hub of Kupiansk and the key staging area of Izyum,” Noah Smith explained in his letter.

Recent happenings illustrate “some important principles about the broader conflict unfolding across our world between liberalism and illiberalism,” as well as what a “successful defense of Ukraine” would do to hurt “the dawn of a new age of imperial expansionism,” something we’ve talked a lot about in past letters, alongside the growing deglobalization pulse.

The go-to on the implications of these conflicts, as well as the “burgeoning monetary order,” dubbed Bretton Woods III, has been Credit Suisse Group AG’s (NYSE: CS) Zoltan Pozsar who thinks the dollar “is entering a new and rockier phase” and what “matters more than access to dollars is access to commodities and actual things.”

From hereon, Pozsar thinks “commodity prices can go much higher, … and a dollar can get devalued in terms of commodities.”

In the face of geopolitical and supply chokepoints (further bolstered by such things as railroad strikes), as well as the fragmentation of “the physical world,” it’s no “longer appropriate to think about the world as a unified whole,” Pozsar explains.

Potentially at hand is a “self-reinforcing ‘dollar doom loop,’” Jon Turek of JST Advisors adds in the earlier quoted article. That’s big since, as we once explained, the dollar is the dominant currency for carry due to the easy monetary policies that removed the risk of a strong dollar. 

“Non-US entities make dollar-based loans and transactions … because it’s considered more trustworthy than native fiat,” Bankless explained. “When there’s a disruption in global cash flows, there’s effectively a short squeeze on the dollar.” 

Therefore, while efforts to stem inflation bolstered by supply chokepoints continue, “the stronger the dollar gets in comparison, the less tenable it becomes as a global reserve.”

That is pressure on the long-term trajectory of the dollar.

Ultimately, through the earlier mentioned developments, “breaking the dollar’s dominance could arguably help some countries avoid a tightening of financial conditions,” Bloomberg explains.

Accordingly, with “the dollar’s peak [] already in the rearview mirror,” concerns are amped in regard to how this impacts U.S. markets. It’s the case that U.S. market liquidity, as well as the dollar’s strong role as a reserve, put the S&P 500 at the center of the global carry regime. 

Thus, an unwinding of carry may compound a market drop affecting nearly all risk assets, even housing, and prompting recession, something we shall unpack further in coming letters.

Graphic: Retrieved from The Market Ear. Via Morgan Stanley (NYSE: MS). “MS Research thinks the lows for this bear market will likely arrive in the fourth quarter with 3,400 the minimum downside and 3,000 the low if a recession arrives.”

To round out this section, a bull case is likely characterized by less outsized interest rate hikes here, in the US, with quantitative tightening (QT) ramping “to its maximal caps” with no increase in “vol or yields,” said JPMorgan Chase & Co (NYSE: JPM) market intelligence.

Graphic: Retrieved from Bloomberg.

However, if inflation remains hot – 8% and 9% – and supply disruptions remain sticky, the Fed may continue on its path of higher for longer. That means an “outsized rate hike cadence in Nov/Dec, bringing Fed Funds above 4.0% … and QT put[ting] upward pressure on yields.”

Graphic: Retrieved from Callum Thomas. Via Bank of America Corporation (NYSE: BAC). Market bottoms often appear when the Federal Reserve (Fed) begins cutting interest rates.

Positioning

Demand for protection and re-entry into shorts was the context for selling that culminated in an S&P 500 (INDEX: SPX) low at $3,900.00 last week. 

It’s at this level, “where the demand for put options was concentrated,” analysis providers like SpotGamma saw “support” and, “absent an exogenous catalyst,” S&P 500 stability.

From thereon, into the end of the week, SpotGamma adds that “positive delta hedging flows” bolstered a “market move away from the $3,900.00 support.” Tools like SpotGamma’s HIRO showed volatility selling and this validated a SpotGamma call for “follow-on bullishness.”

Graphic: Retrieved from SpotGamma. Updated September 7, 2022.

Nonetheless, in light of the above fundamental and positioning contexts, after derivatives expiries this month, the stage is likely set for larger two-way ranges.

Technical

As of 7:20 AM ET, Monday’s regular session (9:30 AM – 4:00 PM ET), in the S&P 500, is likely to open in the upper part of a balanced overnight inventory, outside of prior-range and -value, suggesting a potential for immediate directional opportunity.

In the best case, the S&P 500 trades higher.

Any activity above the $4,107.00 POC puts into play the $4,136.75 MCPOC. Initiative trade beyond the MCPOC could reach as high as the $4,189.25 LVNode and $4,231.00 VPOC, or higher.

In the worst case, the S&P 500 trades lower.

Any activity below the $4,107.00 POC puts into play the $4,071.00 VPOC. Initiative trade beyond the VPOC could reach as low as the $4,018.75 HVNode and $3,991.00 VPOC, or lower.

Click here to load today’s key levels into the web-based TradingView charting platform. Note that all levels are derived using the 65-minute timeframe. New links are produced, daily.
Graphic: 65-minute profile chart of the Micro E-mini S&P 500 Futures.

Definitions

Volume Areas: A structurally sound market will build on areas of high volume (HVNodes). Should the market trend for long periods of time, it will lack sound structure, identified as low volume areas (LVNodes). LVNodes denote directional conviction and ought to offer support on any test. 

If participants were to auction and find acceptance into areas of prior low volume (LVNodes), then future discovery ought to be volatile and quick as participants look to HVNodes for favorable entry or exit.

POCs: POCs are valuable as they denote areas where two-sided trade was most prevalent in a prior day session. Participants will respond to future tests of value as they offer favorable entry and exit.

MCPOCs: POCs are valuable as they denote areas where two-sided trade was most prevalent over numerous day sessions. Participants will respond to future tests of value as they offer favorable entry and exit.

About

After years of self-education, strategy development, mentorship, and trial-and-error, Renato Leonard Capelj began trading full-time and founded Physik Invest to detail his methods, research, and performance in the markets.

Capelj also develops insights around impactful options market dynamics at SpotGamma and is a Benzinga reporter.

Some of his works include conversations with ARK Invest’s Catherine Wood, investors Kevin O’Leary and John Chambers, FTX’s Sam Bankman-Fried, ex-Bridgewater Associate Andy Constan, Kai Volatility’s Cem Karsan, The Ambrus Group’s Kris Sidial, among many others.

Disclaimer

In no way should the materials herein be construed as advice. Derivatives carry a substantial risk of loss. All content is for informational purposes only.