
The daily brief is a free glimpse into the prevailing fundamental and technical drivers of U.S. equity market products. Join the 980+ that read this report daily, below!
Administrative
Ended last week on a strong note and started this week on a lighter, less impactful note.
Separately, due to travel commitments, there may be inconsistency in the frequency of posts in the coming weeks, particularly October 10-21, 2022.
Fundamental
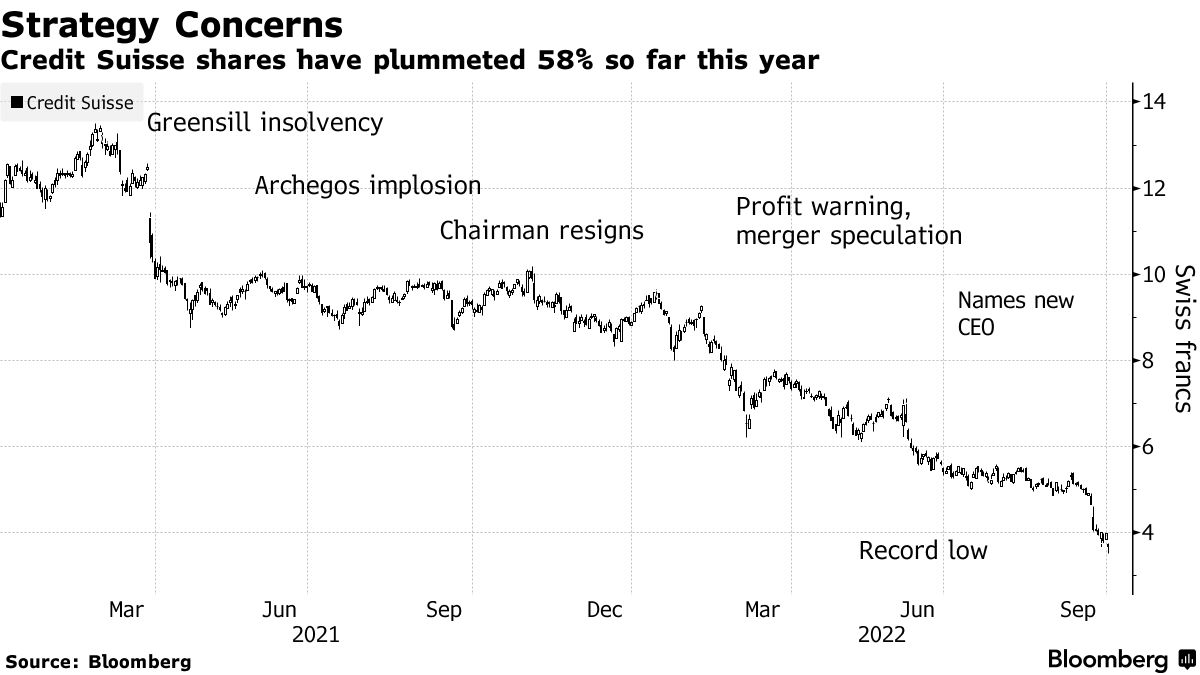
A lot of noise this weekend. Top headlines and posts on social media concerned the stability of Credit Suisse Group AG (NYSE: CS), for one, which is slated to open about 5% lower today.
CEO Ulrich Koerner said the bank is at a “critical moment” while stressing stock prices did not reflect its “strong capital base and liquidity position.” The bank’s key capital ratio sits at 13.5%, higher than what Deutsche Bank AG (NYSE: DB) had in 2016 when it was in trouble.
A hot topic, too, is the bank’s credit default swap (CDS) levels which “are still far from distressed and are part of a broad market selloff,” Bloomberg concludes.
For context, a CDS is a tool to hedge against the risk of some credit event (e.g., bankruptcy, a failure to pay, restructuring of debt, repudiation/moratorium, and obligation acceleration or an obligation default). The settlement of a CDS involves the exchanging of bonds for their par value or a cash payment equal to the difference between par and the bond’s market value.
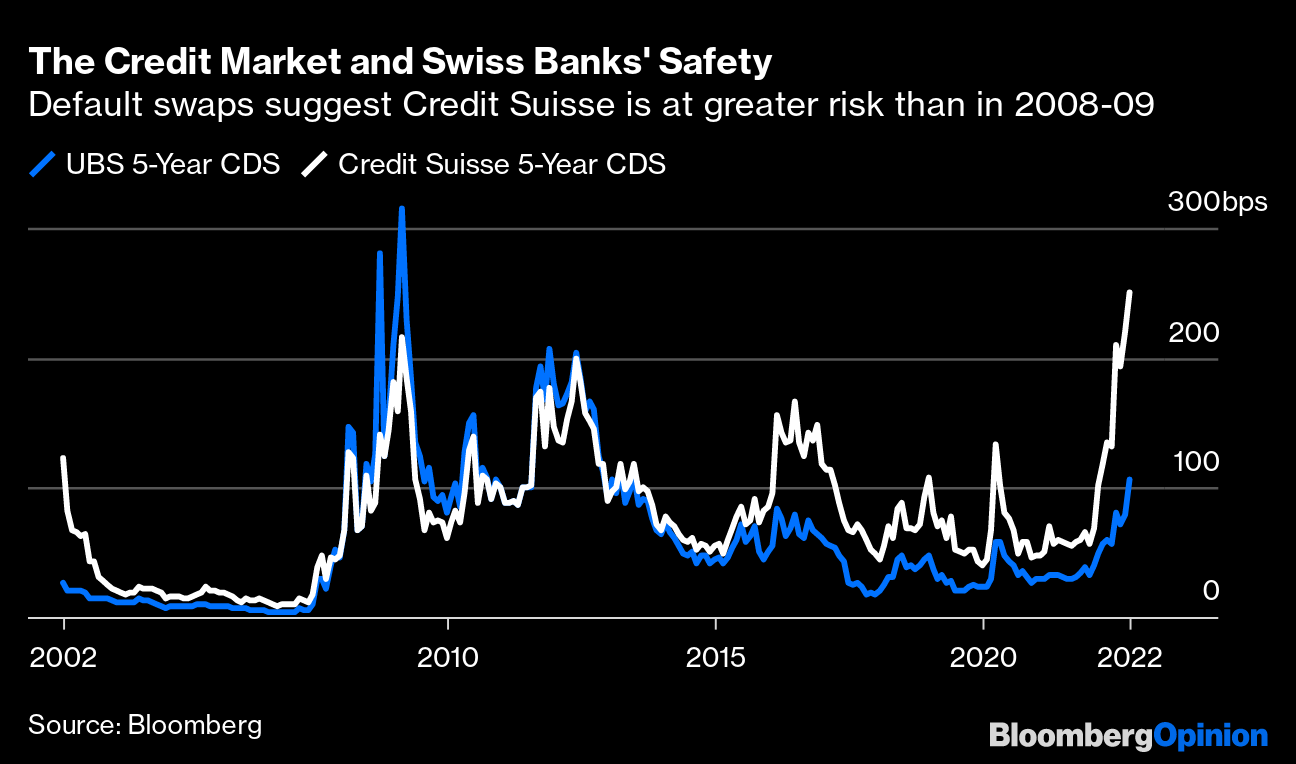
Moreover, in spite of all the discussion and debate online, “Credit Suisse is not creating anything like the angst we experienced [in 2008],” said columnist John Authers.
If no bailout is needed, “as the CEO’s memo endeavors to show, then all the talk has left it very much oversold.”
In other news, Liz Truss, the Prime Minister of the UK, shifted her focus from some fiscal stimuli which “bec[ame] a distraction from [the] mission to get Britain moving.”
“Our focus now is on building a high growth economy that funds world-class public services, boosts wages, and creates opportunities across the country.”
For context, the last week was filled with excitement overseas, we explained in detail Monday through Friday.
In short, the announcement of new fiscal policies coincided with market volatility that prompted reflexive feedback loops and the risk of default among some pension schemes.
Some of those announcements were walked back and UK volatility eased.
Moving on.
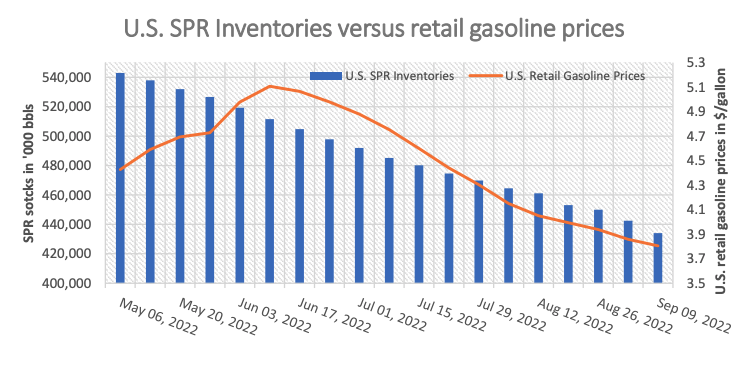
Oil was bid on news that OPEC+ is considering a cut to production in excess of a million barrels per day. This is as they look to “pre-empt” potential surpluses amid waning demand and the sale of oil from the US’s Strategic Petroleum Reserves (SPR) into November.
Waning demand is showing up in other areas; factor activity is falling on a slowdown, globally, as policymakers tighten and clamp down on excesses. Just yesterday, the Wall Street Journal reported that cargo shipowners were canceling sailings as shipping rates, discussed last week, plunged ~75%.
Positioning
Top of mind, for many, last week was the trade, repositioning, and/or removal of large options positions coinciding with the September Quarterly Options Expiration (OPEX).
Notwithstanding, per SpotGamma data, the “expiration isn’t particularly impressive” as there is likely far “more potential market impact” expected in October and December.
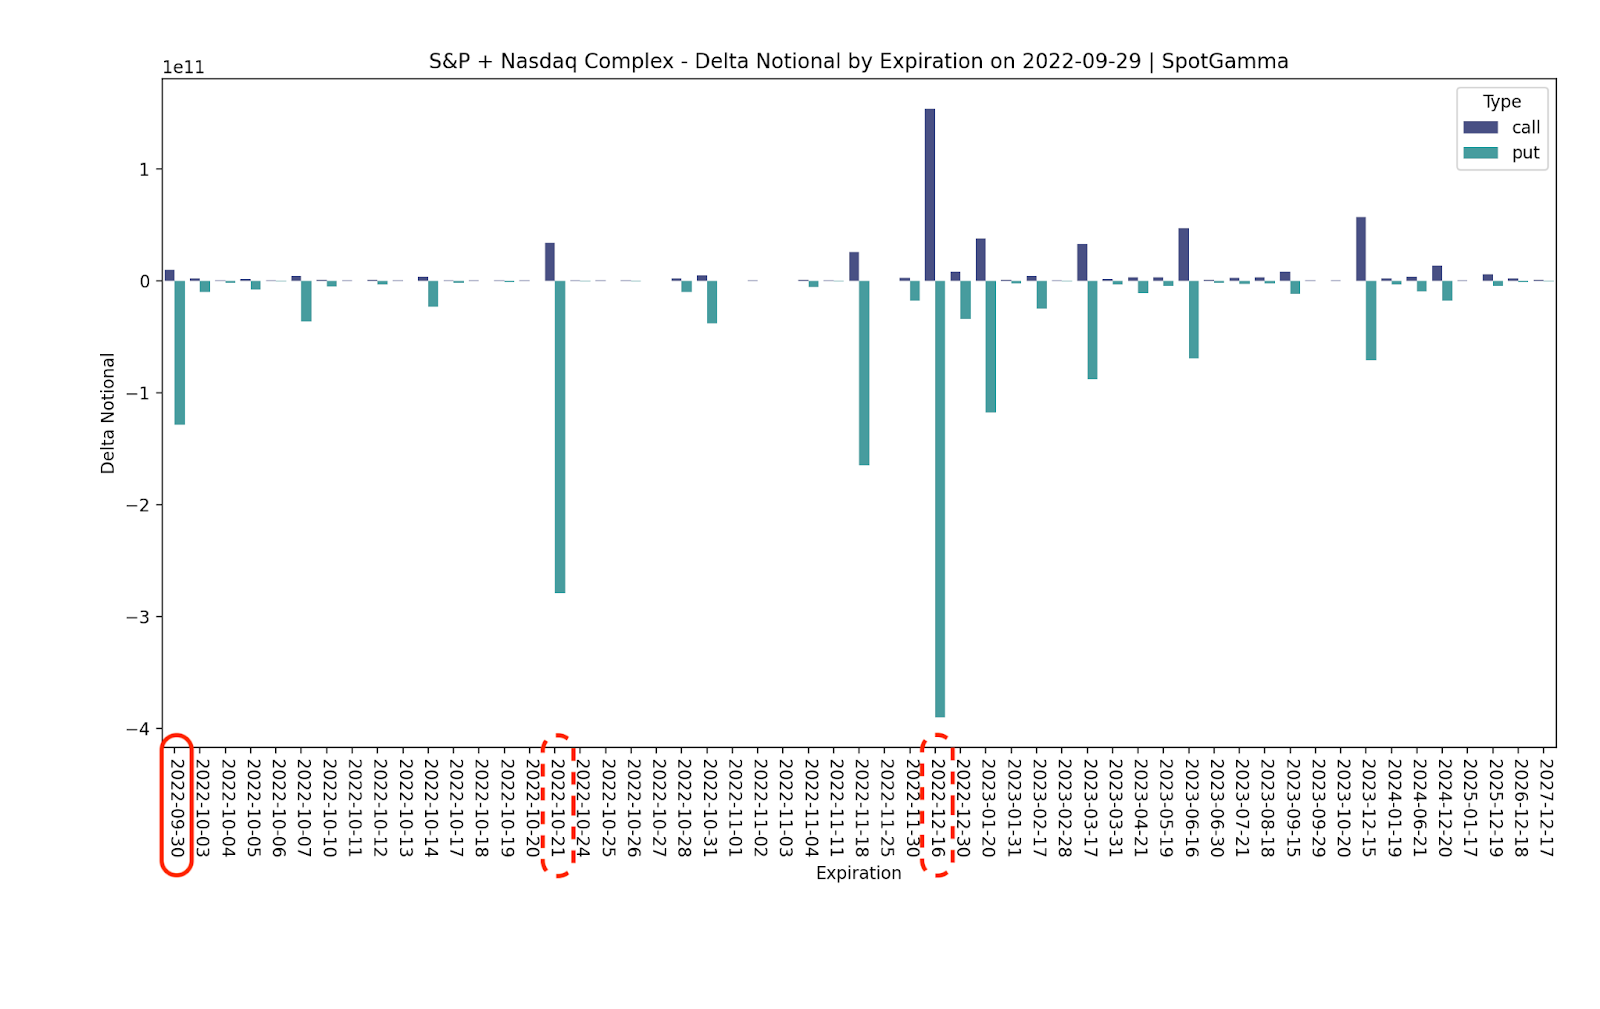
Still, there was a removal of a lot of put Delta. SpotGamma sees counterparties as having positive Delta (directional) exposure via short put (i.e., meaning the trade loses money if the underlying trades lower). This opens the door to relief as counterparties reposition and trim exposure to their negative Delta (offsetting) hedges via futures and/or stock.
“We believe that the expiration of large put positions can be turning points for market rallies.”
Technical
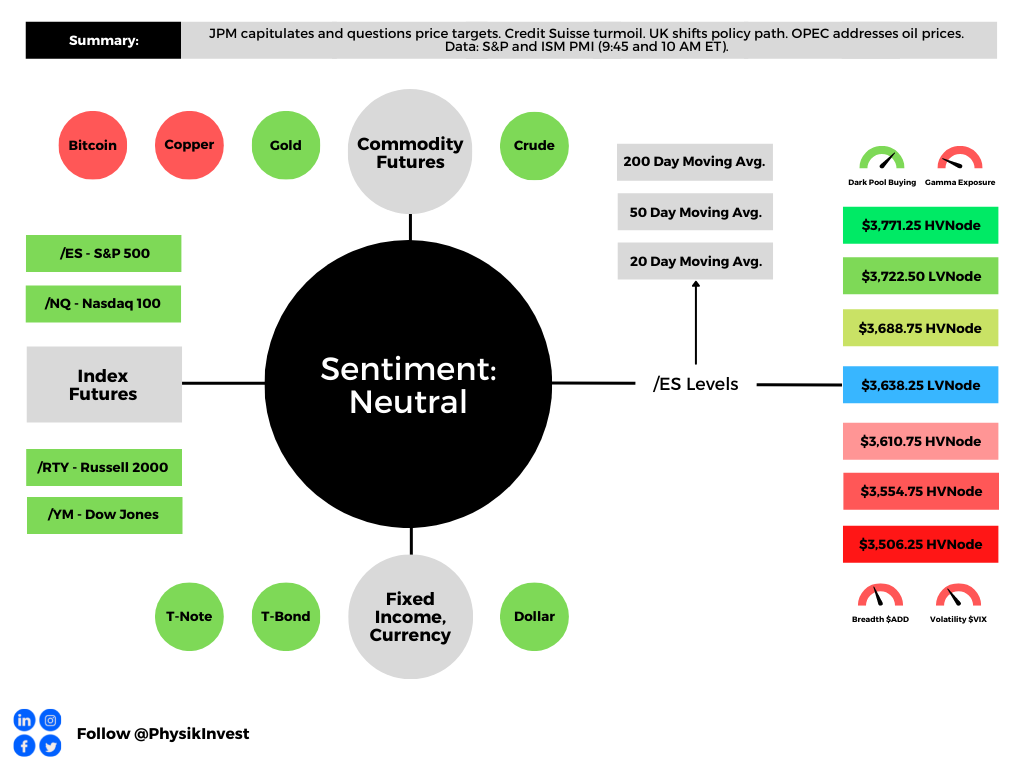
As of 7:00 AM ET, Monday’s regular session (9:30 AM – 4:00 PM ET), in the S&P 500, is likely to open in the upper part of a balanced overnight inventory, inside of prior-range and -value, suggesting a limited potential for immediate directional opportunity.
In the best case, the S&P 500 trades higher.
Any activity above the $3,610.75 HVNode puts into play the $3,653.00 VPOC. Initiative trade beyond the VPOC could reach as high as the $3,688.75 HVNode and $3,722.50 LVNode, or higher.
In the worst case, the S&P 500 trades lower.
Any activity below the $3,610.75 HVNode puts into play the $3,554.75 HVNode. Initiative trade beyond the last-mentioned could reach as low as the $3,506.25 and $3,444.75 HVNode, or lower.
Click here to load today’s key levels into the web-based TradingView charting platform. Note that all levels are derived using the 65-minute timeframe. New links are produced, daily.

Definitions
Volume Areas: A structurally sound market will build on areas of high volume (HVNodes). Should the market trend for long periods of time, it will lack sound structure, identified as low volume areas (LVNodes). LVNodes denote directional conviction and ought to offer support on any test.
If participants were to auction and find acceptance into areas of prior low volume (LVNodes), then future discovery ought to be volatile and quick as participants look to HVNodes for favorable entry or exit.
About
After years of self-education, strategy development, mentorship, and trial-and-error, Renato Leonard Capelj began trading full-time and founded Physik Invest to detail his methods, research, and performance in the markets.
Capelj also develops insights around impactful options market dynamics at SpotGamma and is a Benzinga reporter.
Some of his works include conversations with ARK Invest’s Catherine Wood, investors Kevin O’Leary and John Chambers, FTX’s Sam Bankman-Fried, ex-Bridgewater Associate Andy Constan, Kai Volatility’s Cem Karsan, The Ambrus Group’s Kris Sidial, among many others.
Disclaimer
In no way should the materials herein be construed as advice. Derivatives carry a substantial risk of loss. All content is for informational purposes only.


One reply on “Daily Brief For October 3, 2022”
[…] CS) debacle. However, despite the bank’s “critical moment,” as discussed in yesterday’s letter, credit default swap (CDS) levels, though still rising, are “far from […]