Categories
Commentary

Daily Brief For March 30, 2023

Intrigued about what moves markets and economies and how that can impact your financial wellness? Subscribe to this free newsletter below!

Graphic updated 6:30 AM ET. Sentiment Risk-On if expected /MES open is above the prior day’s range. /MES levels are derived from the profile graphic at the bottom of this letter. Click here for the latest levels. SqueezeMetrics Dark Pool Index (DIX) and Gamma (GEX) with the latter calculated based on where the prior day’s reading falls with respect to the MAX and MIN of all occurrences available. A higher DIX is bullish. The lower the GEX, the more (expected) volatility. Click to learn the implications of volatility, direction, and moneyness. Breadth reflects a reading of the prior day’s NYSE Advance/Decline indicator. The CBOE VIX Volatility Index (INDEX: VVIX) reflects the attractiveness of owning volatility. UMBS prices via MNDClick here for the economic calendar.

Administrative

Thanks for the feedback on the newsletter design! The technical section has returned for your viewing of crucial levels. We may update this section or merge it with another in the future. If you have any feedback, please comment or reply!

By the way, check out fx:macro’s neat market dashboard how-to-build guide! They have a fabulous newsletter, and this dashboard is an excellent component.

Take care, everybody.

Fundamental

In the coming sessions, there will be a dive into the geopolitical developments of late, far higher in quality than what we started this week with. For a sneak peek at what we will be talking about, look at this article, this podcast, and the Daily Brief for 1/4/23.

Positioning

In yesterday’s letter on positioning contexts, we concluded it was likely for markets to remain contained through month-end.

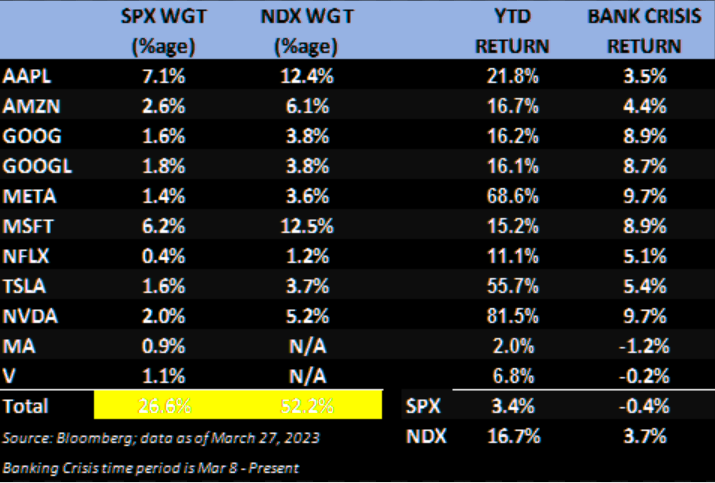
We said, “there is potential for markets to move into a far ‘more combustible’ position, … [and], with call skews far up meaningfully steep, still-present low- and zero-cost call structures” in previously depressed products like the Nasdaq 100 (INDEX: NDX), buoyed by financial tensions easing, were attractive to express the bullish view.

Graphic: Retrieved from JPMorgan Chase & Co (NYSE: JPM) via The Market Ear.

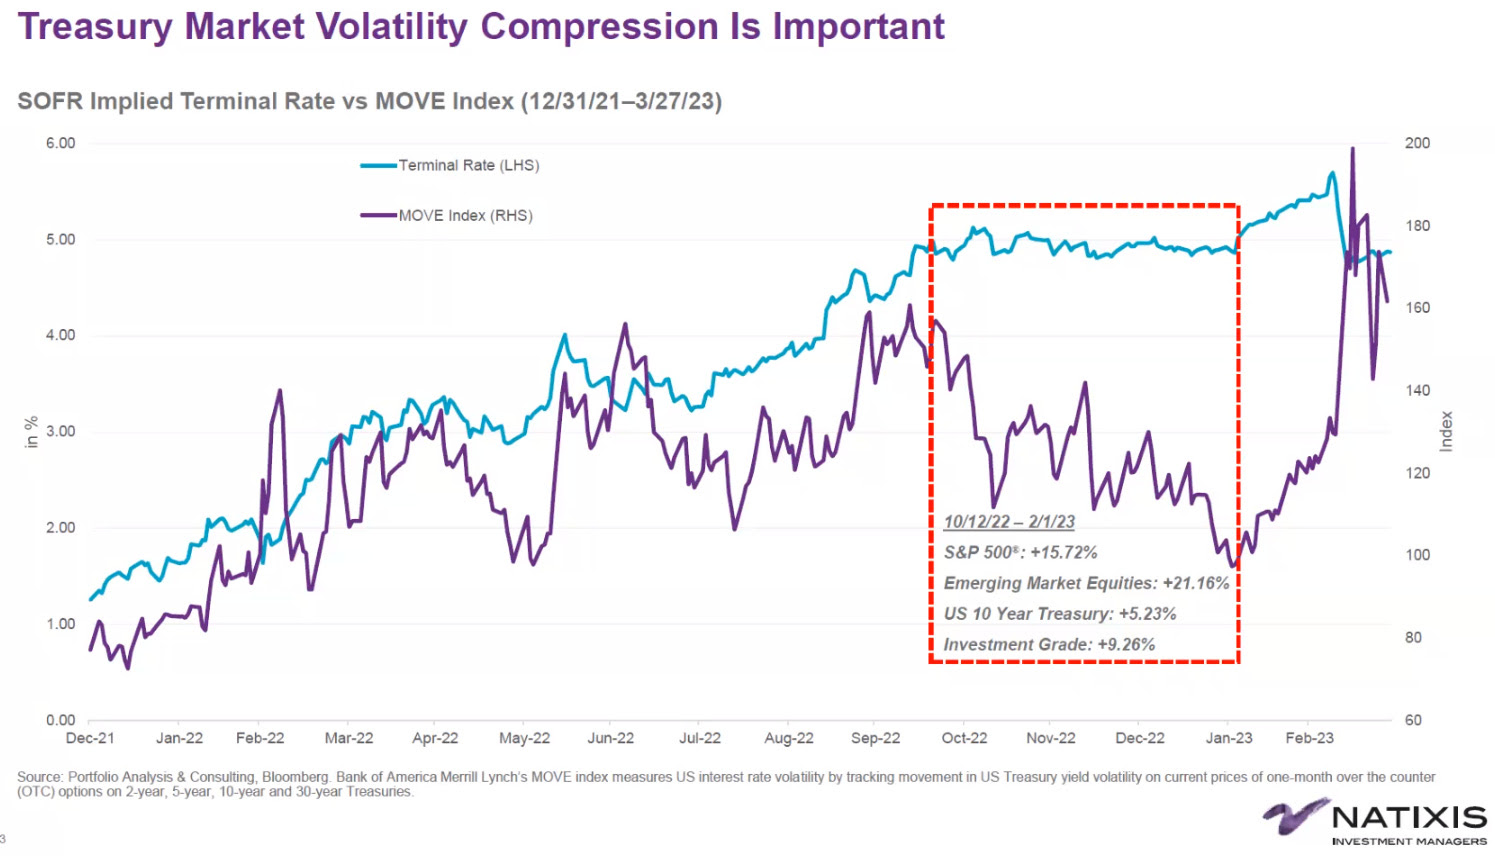
Though we weren’t too right about the potential for volatility to be sticky, which may be detrimental to some of the more expensive structures, such trades’ exposure to direction and movement appears to be offsetting time decay and volatility, sped up by the resolution of the liquidity crisis (i.e., the asset-liability mismatch at some banks that thought their depositors were far more loyal, hence less of a need to hedge risk) which prompted traders a few weeks back to demand protection and reprice options higher; the Merrill Lynch Option Volatility Estimate (INDEX: MOVE) and Cboe Volatility Index (INDEX: VIX) have come in dramatically. Please take a look at the full letter here.

Graphic: Retrieved from NATIXIS via Bloomberg.

As stated on 3/29, the fundamental view hasn’t changed. Therefore, we may consider monetizing our structures now and in the near future and using those credits to offset debit risk in plays such as far-dated bear put spreads (i.e., buy put and sell another at a lower strike); options data and insight platform SpotGamma says the juice has been squeezed now with S&P 500 (INDEX: SPX) 1-month at-the-money implied volatility or IVOL pricing at 17%. “For a decline to continue, we need a change in volatility regime (i.e., soft landing, bank crisis resolved, etc.) because, with 1-month realized at 15%, you can argue there isn’t much juice left to squeeze.” Caution on the upside plays.

Graphic: Retrieved from Bloomberg via SpotGamma.

Technical

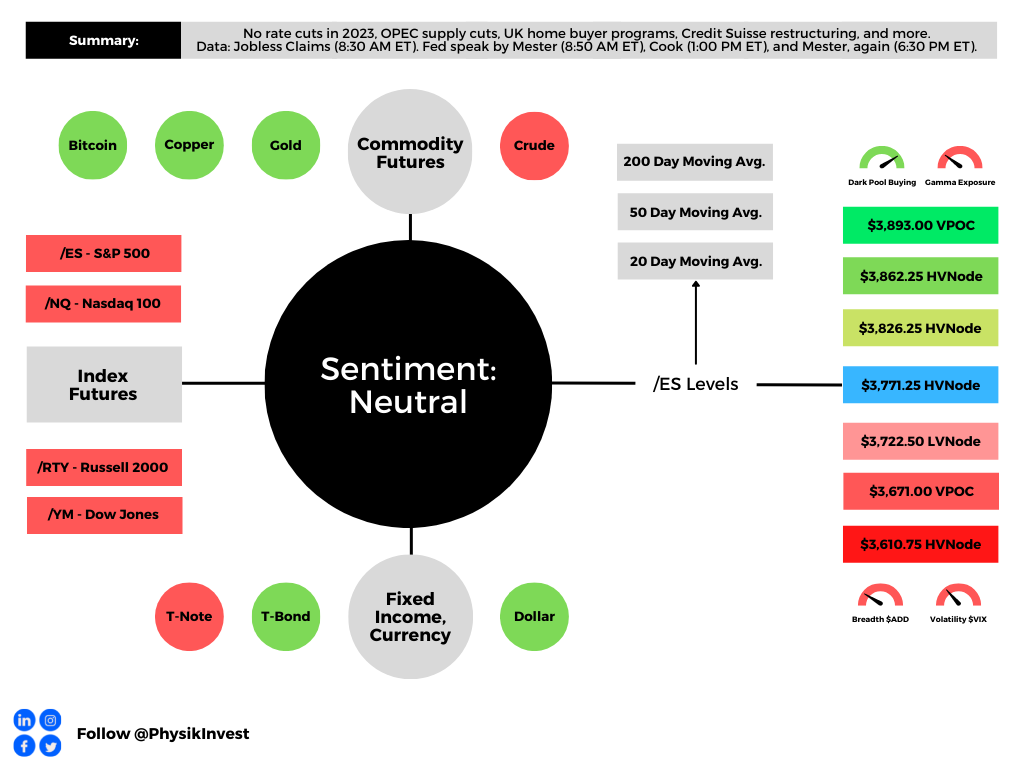
As of 6:30 AM ET, Thursday’s regular session (9:30 AM – 4:00 PM ET) in the S&P 500 will likely open in the upper part of a positively skewed overnight inventory, outside of the prior day’s range, suggesting a potential for immediate directional opportunity.

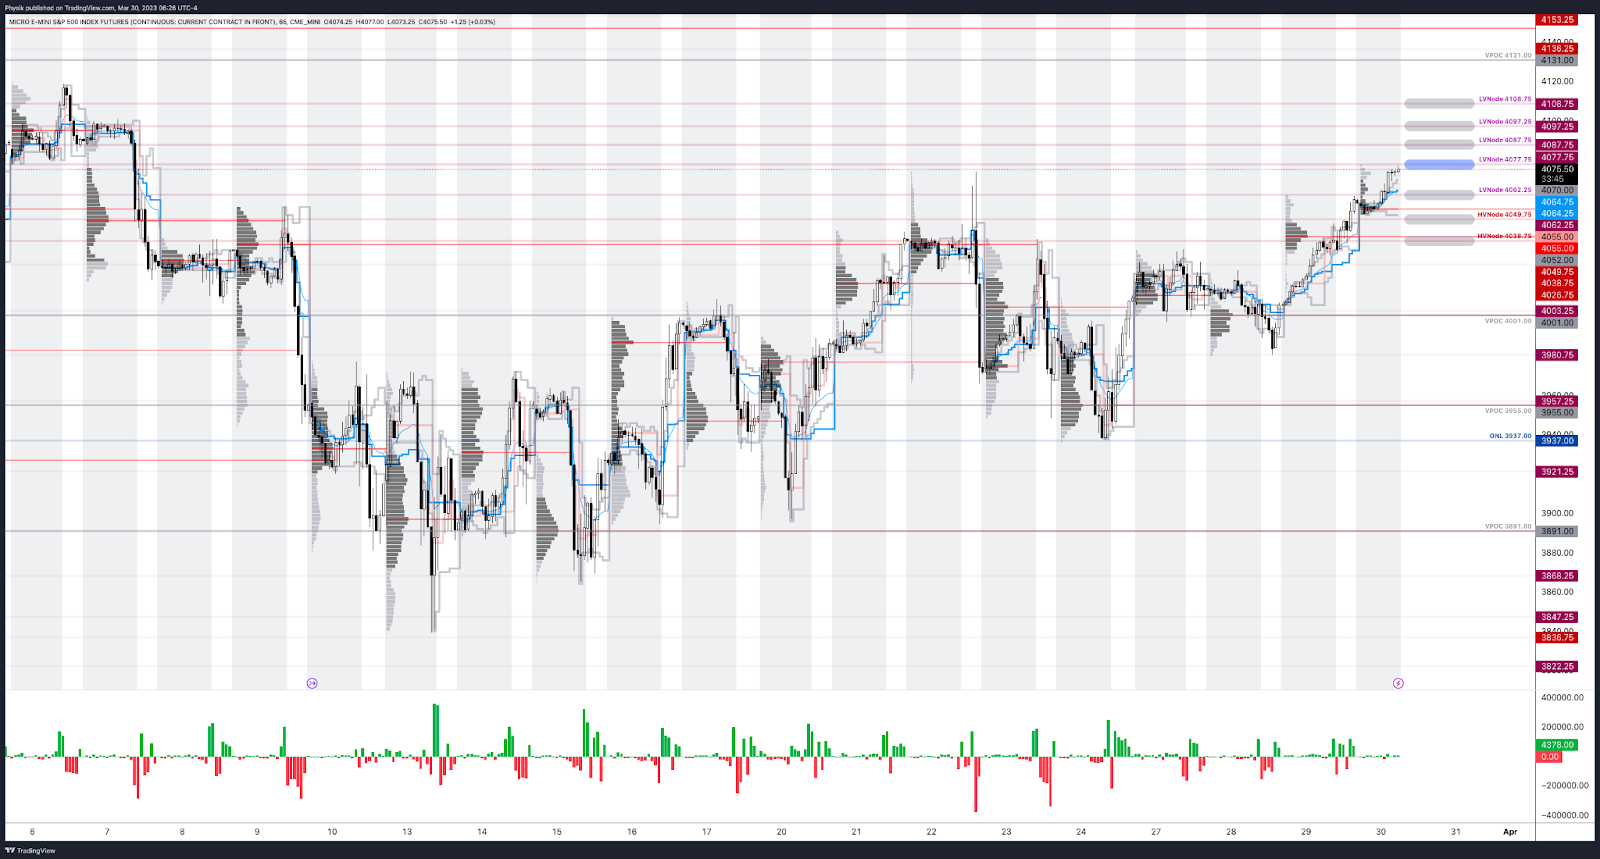
The S&P 500 pivot for today is $4,077.75

Key levels to the upside include $4,087.75$4,097.25, and $4,108.75.

Key levels to the downside include $4,062.25$4,049.75, and $4,038.75.

Click here to load the updated key levels via the web-based TradingView platform.

New links are produced daily.

Quoted levels likely hold, barring an exogenous development.

Graphic: 65-minute profile chart of the Micro E-mini S&P 500 Futures.

About

The author, Renato Leonard Capelj, spends the bulk of his time at Physik Invest, an entity through which he invests and publishes free daily analyses to thousands of subscribers. The analyses offer him and his subscribers a way to stay on the right side of the market. 

Separately, Capelj is an accredited journalist with past works, including interviews with investor Kevin O’Leary, ARK Invest’s Catherine Wood, FTX’s Sam Bankman-Fried, North Dakota Governor Doug Burgum, Lithuania’s Minister of Economy and Innovation Aušrinė Armonaitė, former Cisco chairman and CEO John Chambers, and persons at the Clinton Global Initiative.

Connect

Direct queries to renato@physikinvest.com. Find Physik Invest on TwitterLinkedInFacebook, and Instagram. Find Capelj on TwitterLinkedIn, and Instagram. Only follow the verified profiles.

Calendar

You may view this letter’s content calendar at this link.

Disclaimer

Do not construe this newsletter as advice; all content is for informational purposes, and derivatives carry a substantial risk of loss. Capelj and Physik Invest, non-professional advisors, will never solicit others for capital or collect fees and disbursements for their work.

Categories
Commentary

Daily Brief For October 6, 2022

The daily brief is a free glimpse into the prevailing fundamental and technical drivers of U.S. equity market products. Join the 1000+ that read this report daily, below!

Graphic updated 8:00 AM ET. Sentiment Neutral if expected /ES open is inside of the prior day’s range. /ES levels are derived from the profile graphic at the bottom of the following section. Levels may have changed since initially quoted; click here for the latest levels. SqueezeMetrics Dark Pool Index (DIX) and Gamma (GEX) calculations are based on where the prior day’s reading falls with respect to the MAX and MIN of all occurrences available. A higher DIX is bullish. At the same time, the lower the GEX, the more (expected) volatility. Learn the implications of volatility, direction, and moneyness. Breadth reflects a reading of the prior day’s NYSE Advance/Decline indicator. VIX reflects a current reading of the CBOE Volatility Index (INDEX: VIX) from 0-100.

Administrative

Good morning, team! Appreciate you opening up this email and reading through the newsletter. 

Over the span of two or so years, on Substack and Physik Invest’s website, issued daily was this letter you, alongside about 1,000 others, are subscribed to.

This newsletter went from about 400 subscribers in July to 1,000 in October, a 150% increase. Thank you to fx:macro, The Morning Hark, The Transcript, and twenty others who, in large part, made that increase happen.

From hereon, gun to the head, I (your letter writer) can’t tell where this newsletter is going. 

In short, this letter served as a tool for me to improve and keep me aware. It was years ago that markets were a dream I was in steadfast pursuit of; I sought mentorship, studied, saved money, and, ultimately, made it a successful full-time gig. 

This letter helped keep me committed to continuous improvement. Sure the money was great, but how do you keep that flow when times get tough? That is something this letter helped me achieve. I hope it’s done the same for you.

At the same time, to weather the storms (periods of inactivity or low earnings while trading like now), I continued my work at places like Benzinga and SpotGamma.

Probably shaved a few years off my life expectancy but the effect was a net positive, I believe. 

That said, in our own way, each and every one of us wants to level up, and that is what makes it difficult for me to promise where this newsletter may go. Speaking bluntly, I am faced with some good problems; e.g., should I raise money and build a fund? Work at an institution? Pivot to PE or, even, government work? Go back to school? Can’t tell you, yet.

What the next step will be I am not sure. Regardless, I intend to keep you fully in the loop. 

As I set out and travel over the next 30 days, I’ll be doing a lot of thinking and, though the frequency of issued letters may change, briefly, the result may be better letters potentially spanning areas far beyond the S&P and the factors that are driving it.

Definitely am open to feedback. Appreciate you for joining the community and staying on board! 

PS: Two things.

First, I’ll be in London and Lisbon over the next month. If you’re in either of the two cities, reach me on Telegram (@renatolcapelj) and/or Discord (Renato Capelj#8625). 

Maybe a coffee?

Second, I spent the past half-year helping Benzinga build an awesome fintech event coming to New York City this December 8, 2022. Organizations such as FIS, Fireblocks, Truist, Symbiont, State Street, Vanguard, Northern Trust, Partisia, and Apex Clearing are a few that will be there.

If you want to network with the best, let me know and I’ll try to get you a ticket!

Regards,

Renato

Fundamental

An eventful week. 

News, today, was focused on Federal Reserve (Fed) officials not planning to cut interest rates next year, the Organization of the Petroleum Exporting Countries (OPEC) agreeing to a supply cut, the UK mulling first-time home buyer program extensions, and Credit Suisse Group AG (NYSE: CS) seeking investment to help spin off its advisory and investment banking units.

Please check out the Physik Invest archives and upcoming letters for more on the impact.

Positioning

Bloomberg reported yesterday a big trade fired off mid-day propelling the S&P 500 higher into the close. The trade consisted of +20,000 OCT $4,500.00, +14,000 MAR $4,300.00 calls, and -48,000 JAN $4,500.00 calls. 

The trade leaves the participant(s) with positive Delta. The other side has exposure to negative Delta meaning they lose money if the S&P 500 is higher, all else equal. To hedge this negative Delta, counterparties buy futures (positive Delta) and that has a positive impact.

According to SpotGamma, though, there needs to be more impactful bullish call repositioning or a market rise that’s large enough to solicit volatility-dampening hedging from counterparties.

Until the last-mentioned happens, the market may continue to balance in a larger range.

Technical

As of 8:00 AM ET, Thursday’s regular session (9:30 AM – 4:00 PM ET), in the S&P 500, is likely to open in the lower part of a negatively skewed overnight inventory, inside of prior-range and -value, suggesting a limited potential for immediate directional opportunity.

In the best case, the S&P 500 trades higher.

Any activity above the $3,771.25 HVNode puts into play the $3,826.25 HVNode. Initiative trade beyond the last-mentioned could reach as high as the $3,862.25 HVNode and $3,893.00 VPOC, or higher.

In the worst case, the S&P 500 trades lower.

Any activity below the $3,771.25 HVNode puts into play the $3,722.50 LVNode. Initiative trade beyond the LVNode could reach as low as the $3,671.00 VPOC and $3,610.75 HVNode, or lower.

Click here to load today’s key levels into the web-based TradingView charting platform. Note that all levels are derived using the 65-minute timeframe. New links are produced, daily.
Graphic: 65-minute profile chart of the Micro E-mini S&P 500 Futures.

Definitions

Volume Areas: A structurally sound market will build on areas of high volume (HVNodes). Should the market trend for long periods of time, it will lack sound structure, identified as low volume areas (LVNodes). LVNodes denote directional conviction and ought to offer support on any test. 

If participants were to auction and find acceptance into areas of prior low volume (LVNodes), then future discovery ought to be volatile and quick as participants look to HVNodes for favorable entry or exit.

POCs: POCs are valuable as they denote areas where two-sided trade was most prevalent in a prior day session. Participants will respond to future tests of value as they offer favorable entry and exit.

About

After years of self-education, strategy development, mentorship, and trial-and-error, Renato Leonard Capelj began trading full-time and founded Physik Invest to detail his methods, research, and performance in the markets.

Capelj also develops insights around impactful options market dynamics at SpotGamma and is a Benzinga reporter.

Some of his works include conversations with ARK Invest’s Catherine Wood, investors Kevin O’Leary and John Chambers, FTX’s Sam Bankman-Fried, ex-Bridgewater Associate Andy Constan, Kai Volatility’s Cem Karsan, The Ambrus Group’s Kris Sidial, among many others.

Disclaimer

In no way should the materials herein be construed as advice. Derivatives carry a substantial risk of loss. All content is for informational purposes only.