Led by the Russell 2000, overnight, equity index futures continued higher while commodities were mixed and bonds were a touch lower. Friday, December 24, markets are closed.
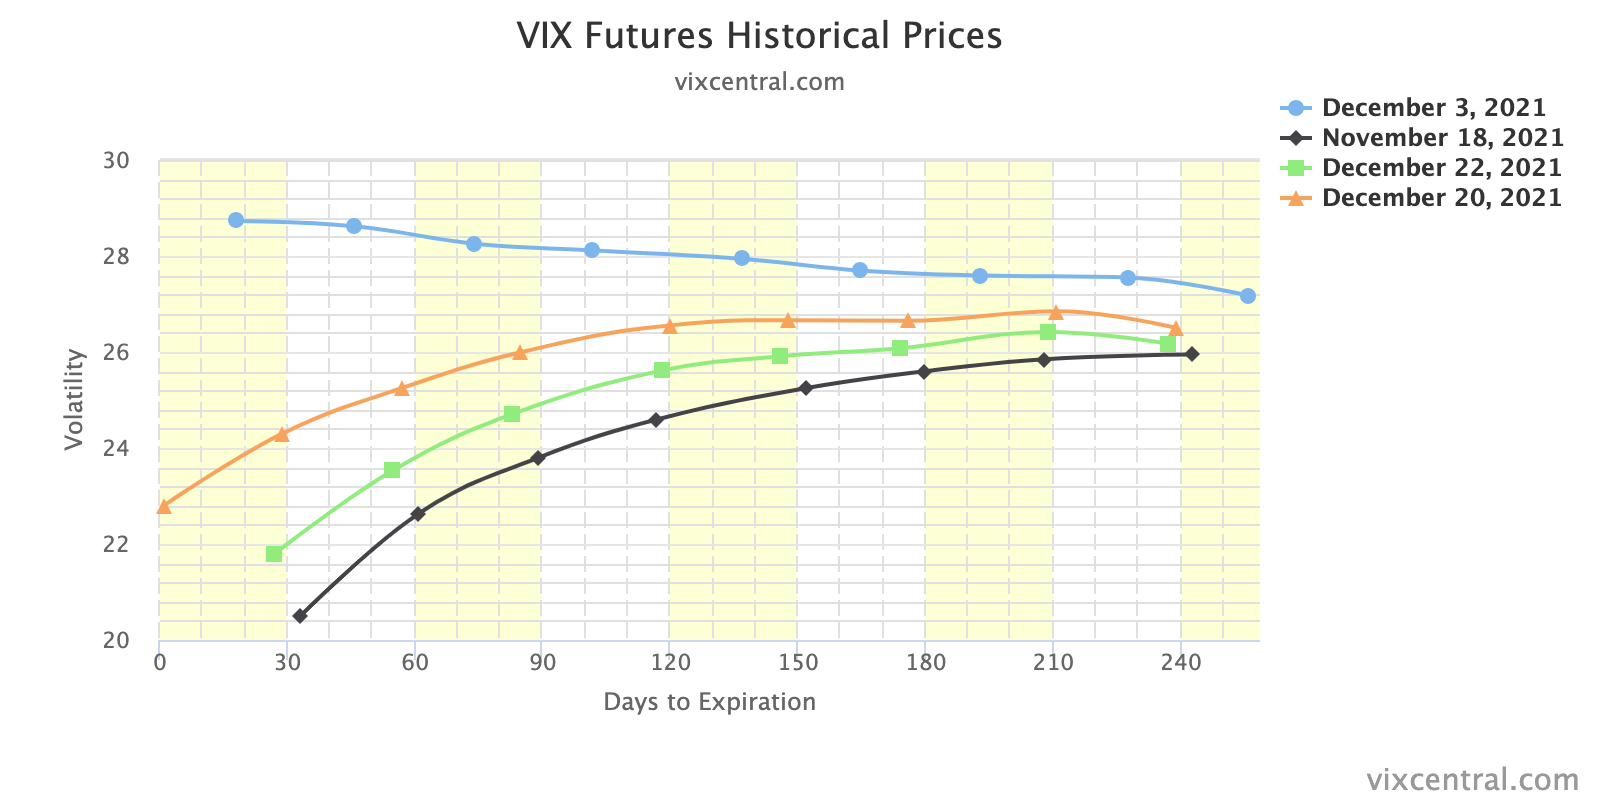
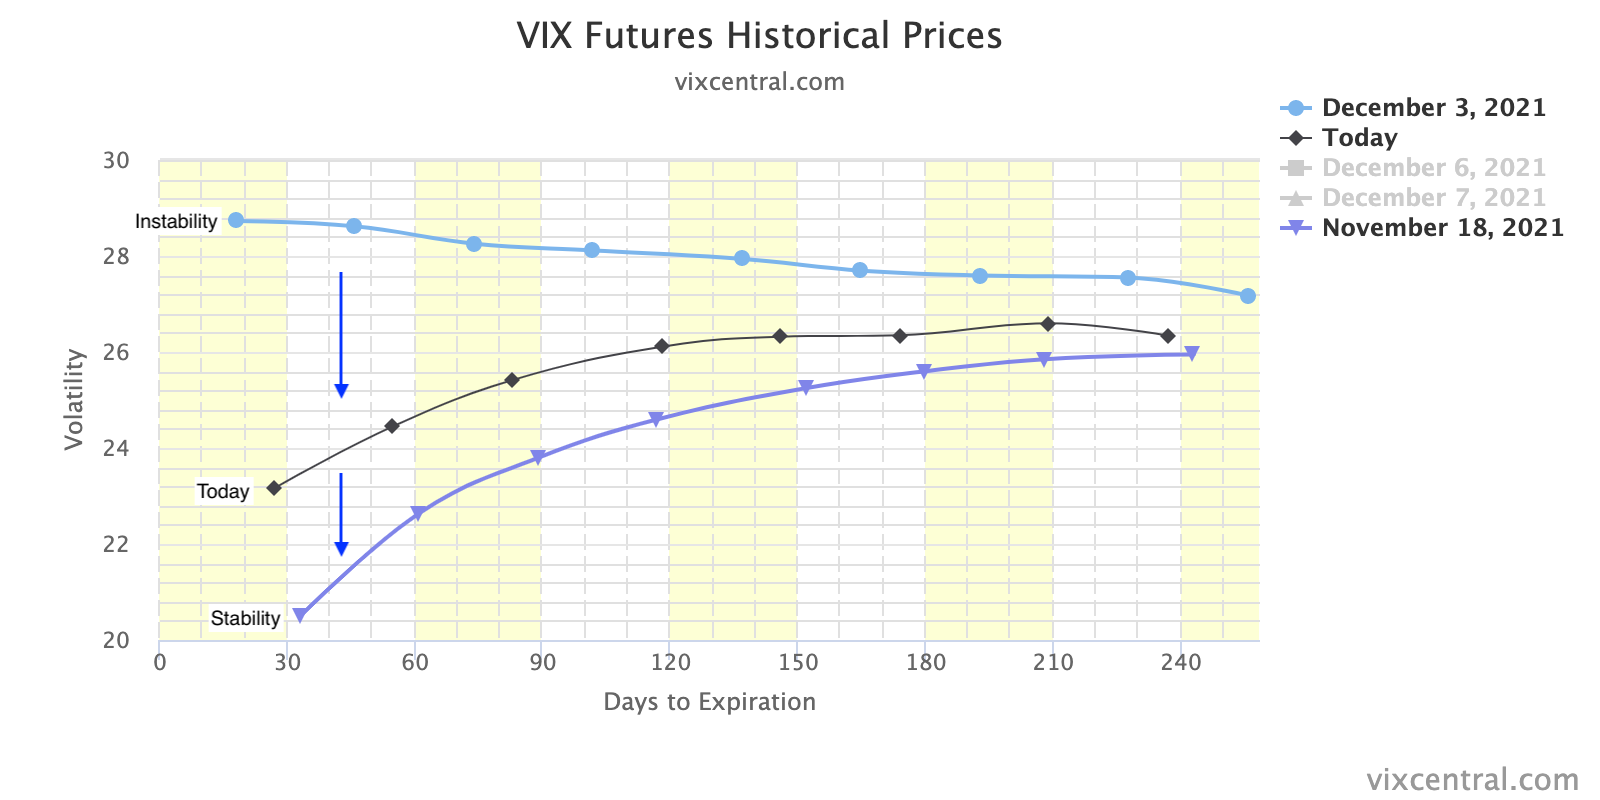
Pursuant to comments made earlier this week, volatility was sold aggressively; the CBOE Volatility Index (INDEX: VIX) dropped ~9.00. This coincides with a compression in the VIX’s term structure, and that has so-called bullish/supportive implications.
Ahead is data on jobless claims, personal income, consumer spending, inflation, disposable income, goods orders (8:30 AM ET), as well as new home sales, University of Michigan sentiment, and five-year inflation expectations (10:00 AM ET).
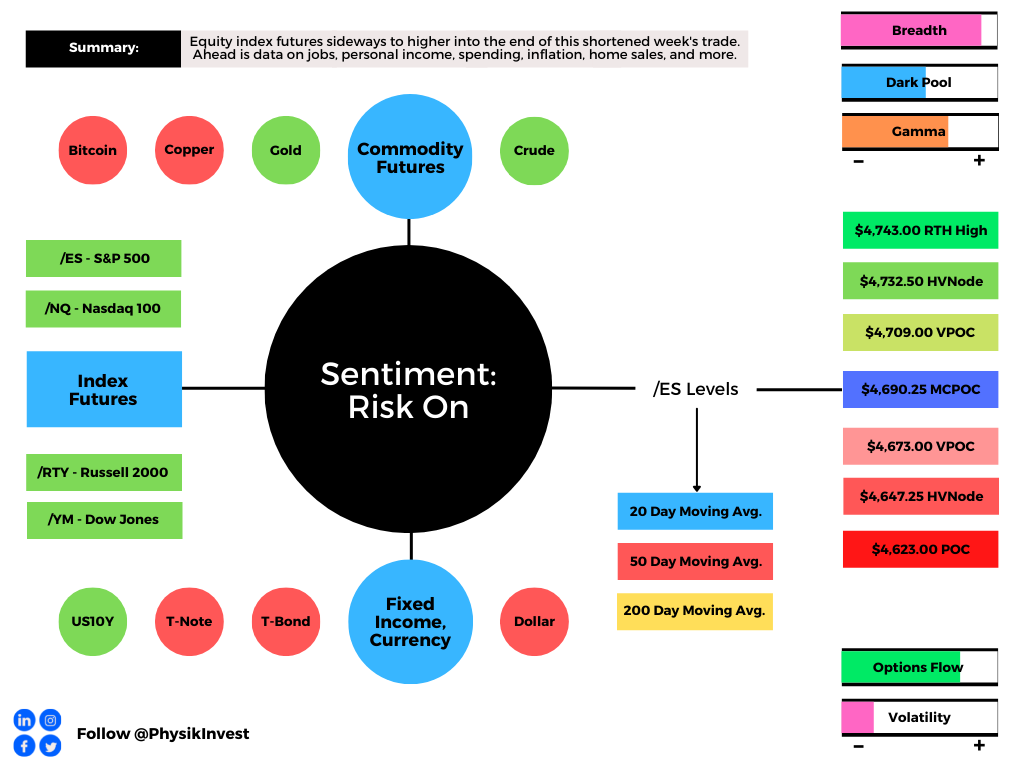
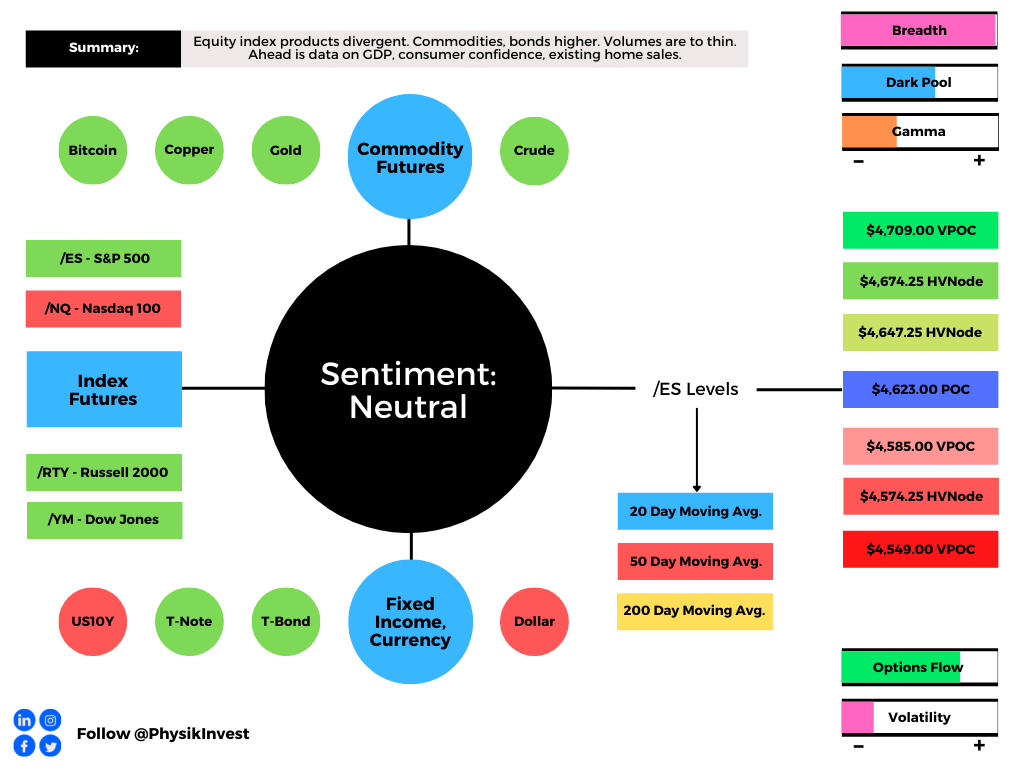
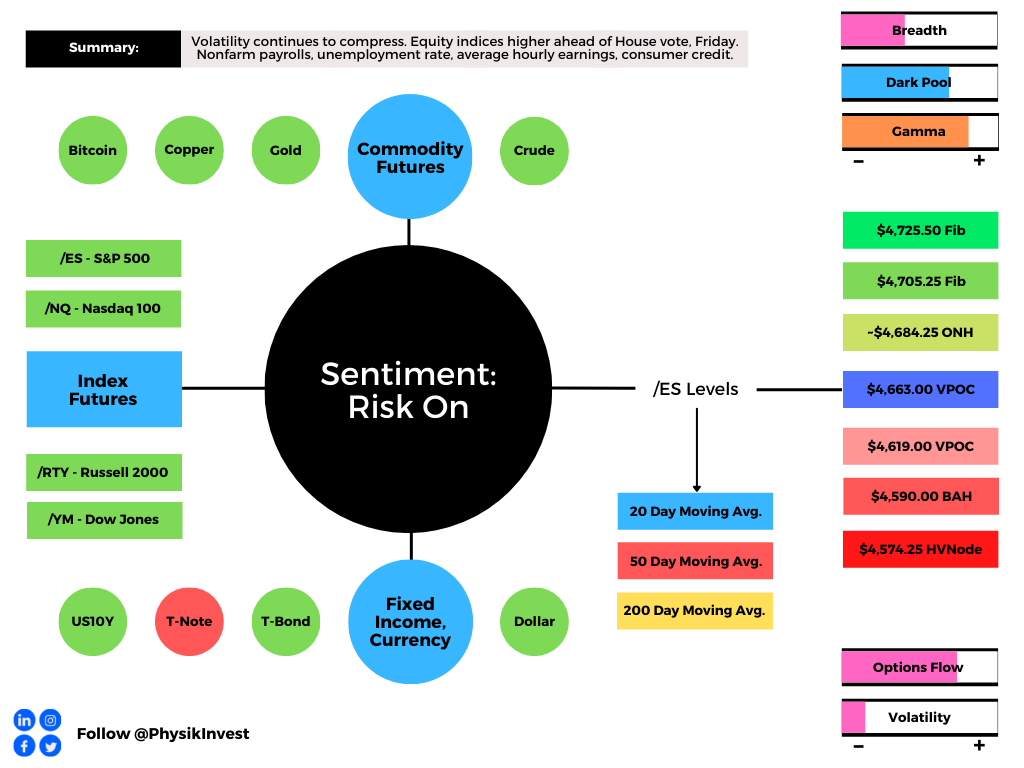
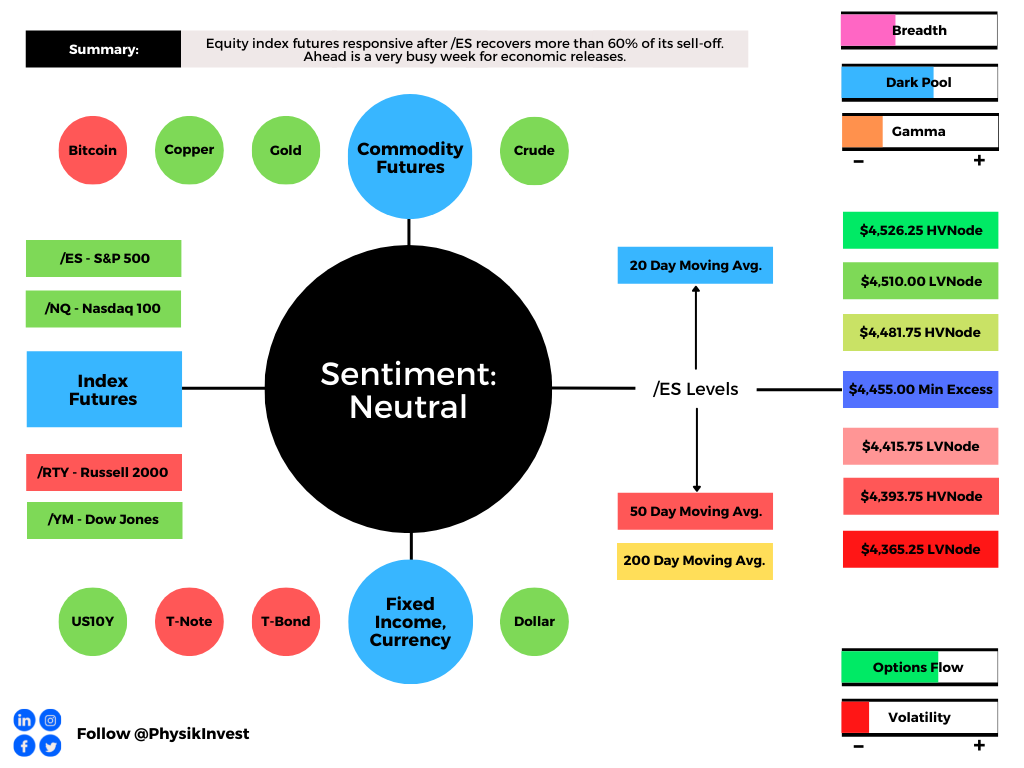
Graphic updated 6:40 AM ET. Sentiment Risk-On if expected /ES open is above the prior day’s range. /ES levels are derived from the profile graphic at the bottom of the following section. Levels may have changed since initially quoted; click here for the latest levels. SqueezeMetrics Dark Pool Index (DIX) and Gamma (GEX) calculations are based on where the prior day’s reading falls with respect to the MAX and MIN of all occurrences available. A higher DIX is bullish. At the same time, the lower the GEX, the more (expected) volatility. Learn the implications of volatility, direction, and moneyness. SHIFT data used for S&P 500 (INDEX: SPX) options activity. Note that options flow is sorted by the call premium spent; if more positive then more was spent on call options. Breadth reflects a reading of the prior day’s NYSE Advance/Decline indicator. VIX reflects a current reading of the CBOE Volatility Index (INDEX: VIX) from 0-100.
What To Expect
On lackluster intraday breadth and divergent market liquidity metrics, the best case outcome occurred, via the S&P 500’s spike close higher, away from intraday value, the levels at which participants found it most favorable to transact.
This activity, which marks the continuation of an earlier trend change, is built on poor structure.
That, ultimately, adds to technical instability.
Why?If you haven’t noticed, the levels quoted daily in this particular commentary seem to be holding to the tick. Given the persistence of mechanical responses to key technical levels, visually-driven, weaker-handed participants (which seldom bear the wherewithal to defend retests) carry a heavier hand in recent price discovery.
Via volume profile analysis, we see a plethora of low-volume pockets – voids, if you will – that likely hold virgin tests. As stated, yesterday, successful penetration portends follow-through given the participants that were most active at those technical levels. Caution is warranted.
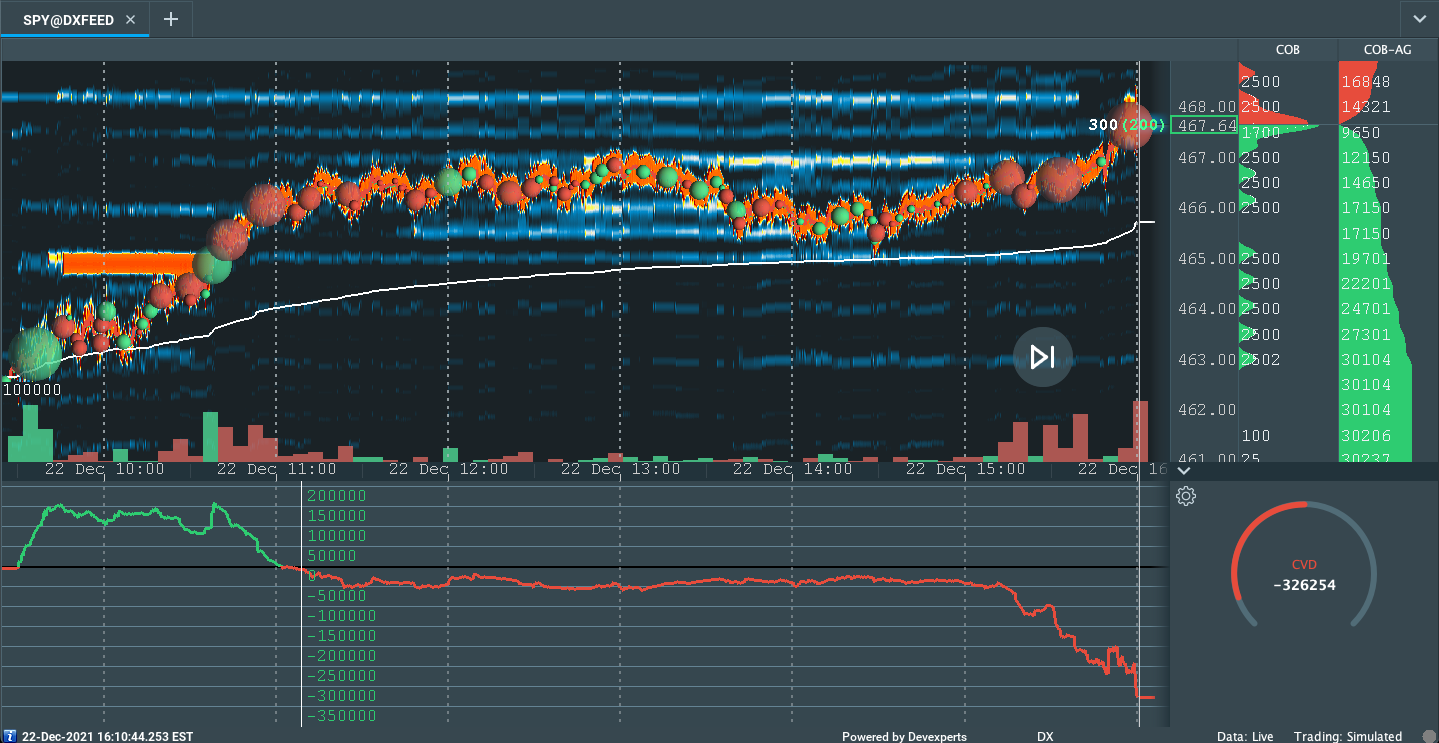
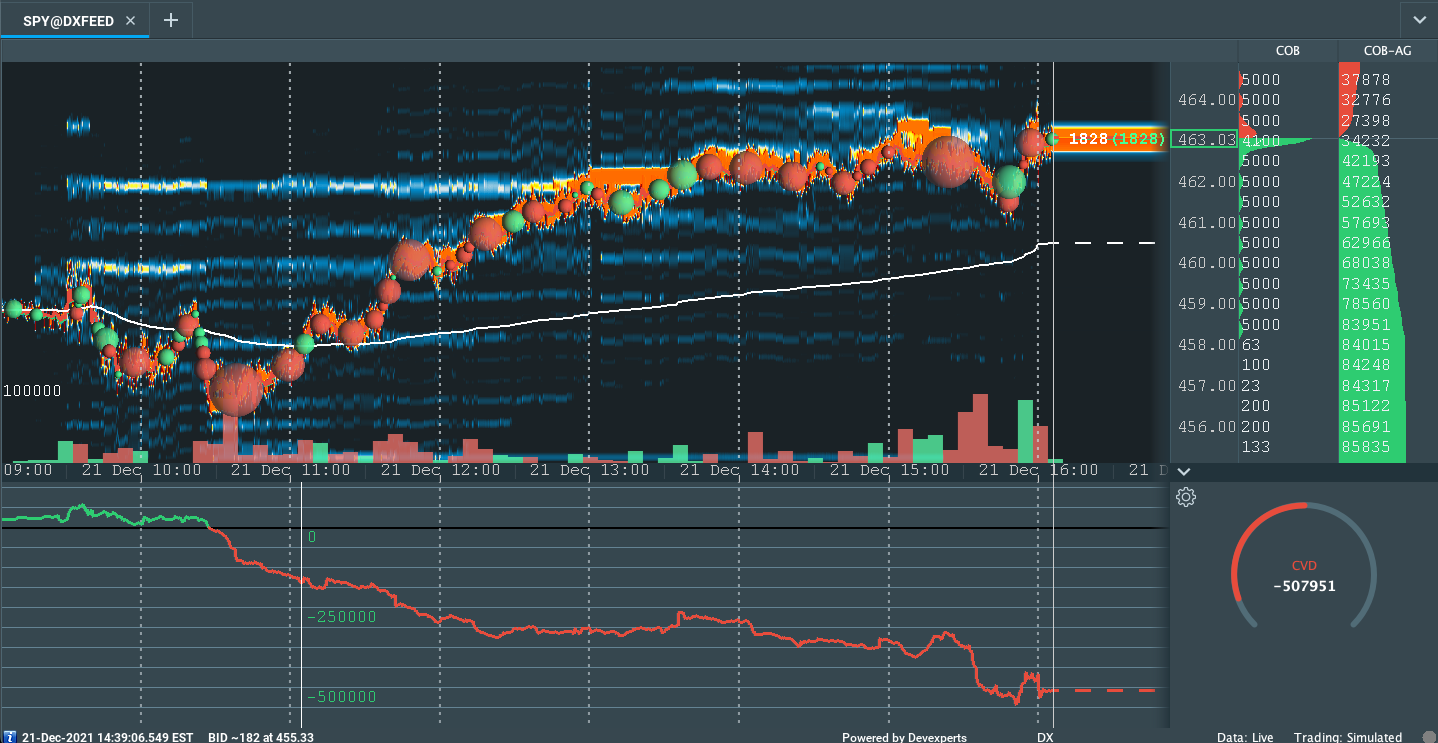
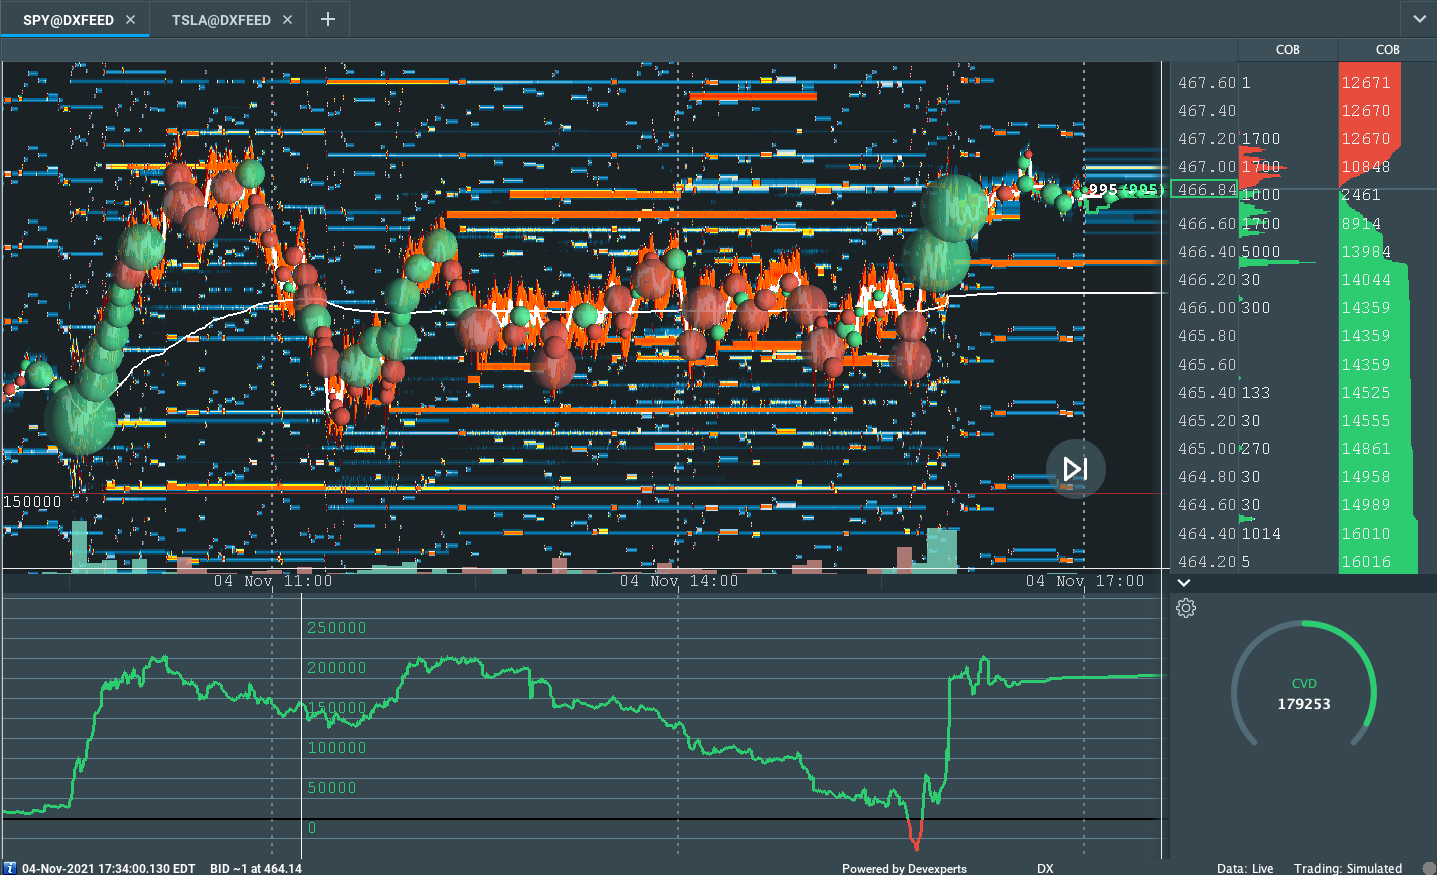
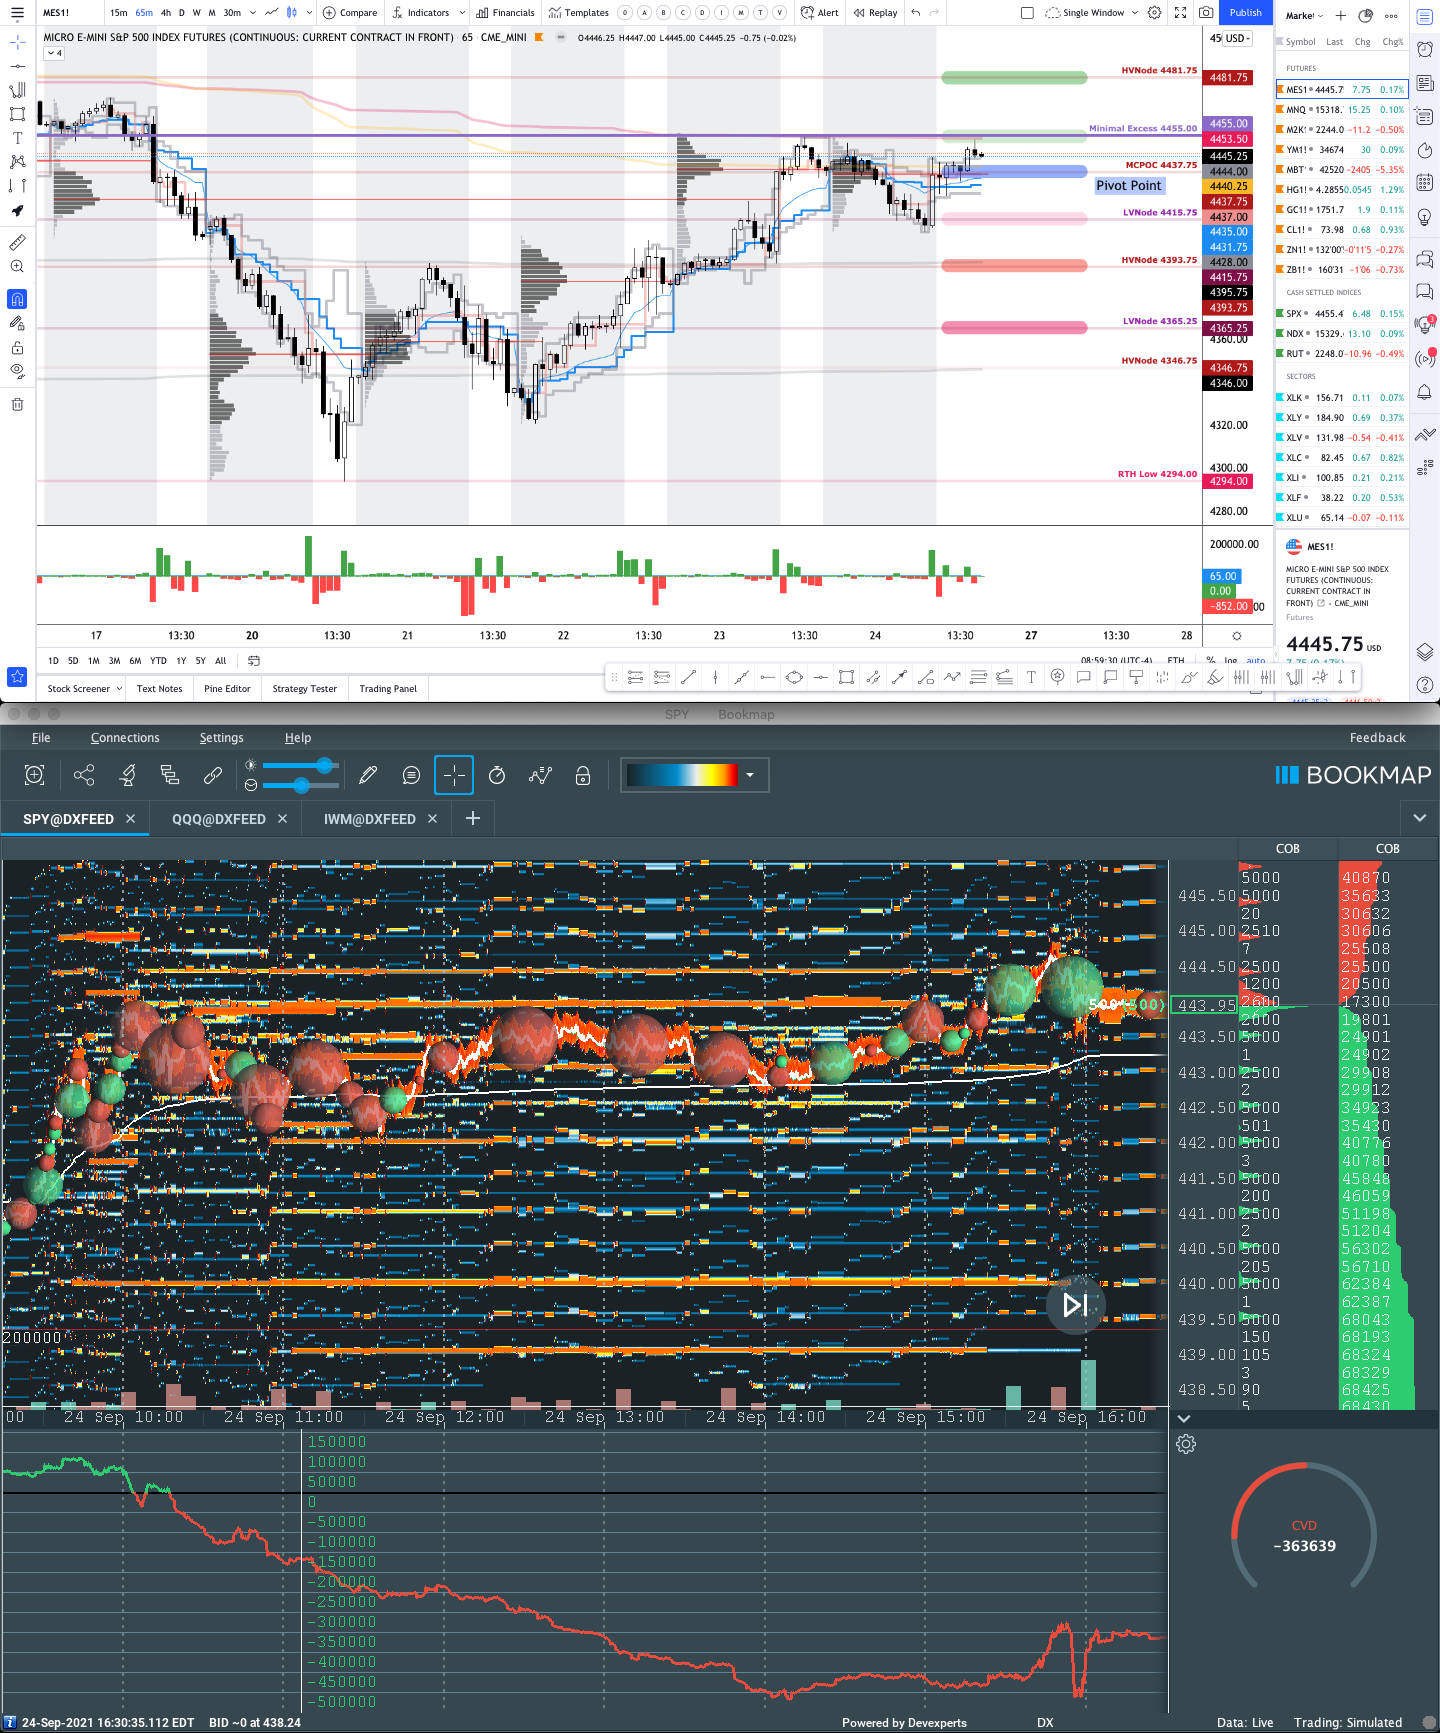
Graphic: Divergent delta (i.e., non-committed buying as measured by volume delta or buying and selling power as calculated by the difference in volume traded at the bid and offer) in SPDR S&P 500 ETF Trust (NYSE: SPY), one of the largest ETFs that track the S&P 500 index, via Bookmap. The readings are supportive of responsive trade (i.e., rotational trade that suggests current prices offer favorable entry and exit; the market is in balance).
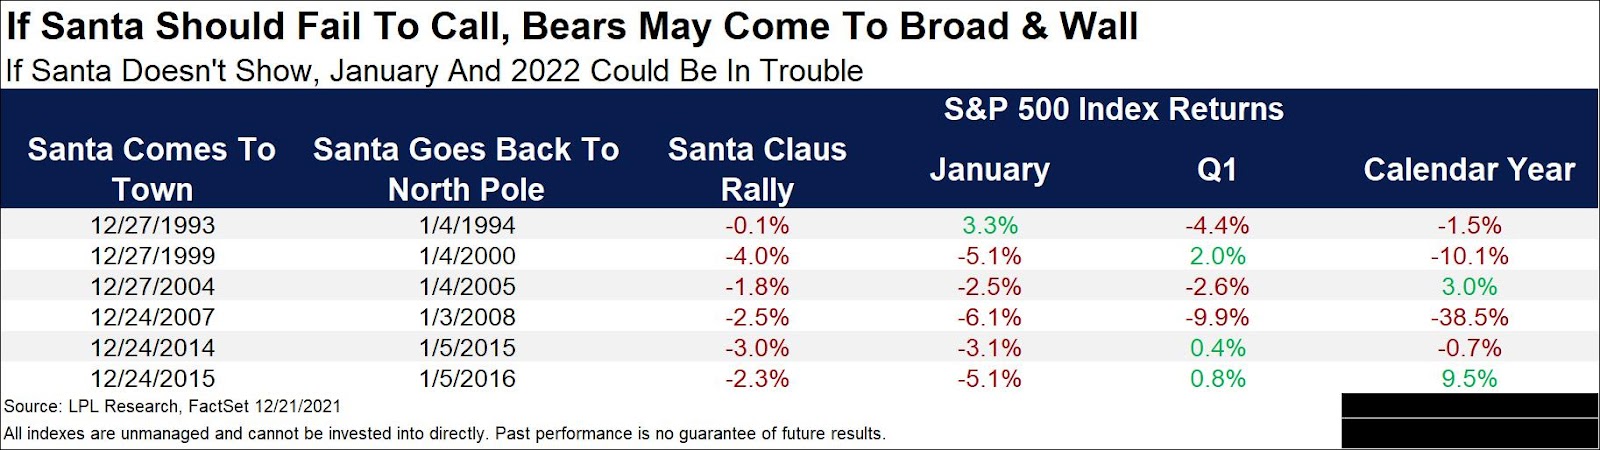
Context: According to Ryan Detrick of LPL Financial, the “official Santa Claus Rally starts this Monday (last 5 days of the year and the first two of the following year).”
The 7 days (after this Monday) are up nearly 79% of the time.
However, in the past 5 occurrences, “Jan was also in the red and Q1 been weak as well.”
Graphic: LPL Financial on the so-called Santa Claus rally.
This activity comes after last week’s weighty “quad-witching” and ahead of the December “Quarterlys” expiry.
The exposure that rolled (and is to roll) off was “put-heavy.”
Participants’ commitment to capital at strikes lower in price and out in time – in the face of weak breadth and bearish fundamental developments – in single stocks, fed into the indices, also.
According to SpotGamma, the December 17 expiration cleared quite a bit of negative delta (e.g., the ARK Innovation ETF [NYSE: ARKK] had $1.5 billion in notional put delta expire).
This opened a window of strength and realized volatility, wherein positive fundamental forces and dealers’ covering of hedges could bolster any recovery.
Its often positioning – particularly around OPEX that drives price.
So, it is this week’s collapse in implied volatility (and associated collapse in term structure), coupled with the pending management of large S&P positions, and relentless, seasonally-aligned “passive buying support,” which brought positive flows bolstering this “Santa Claus rally.”
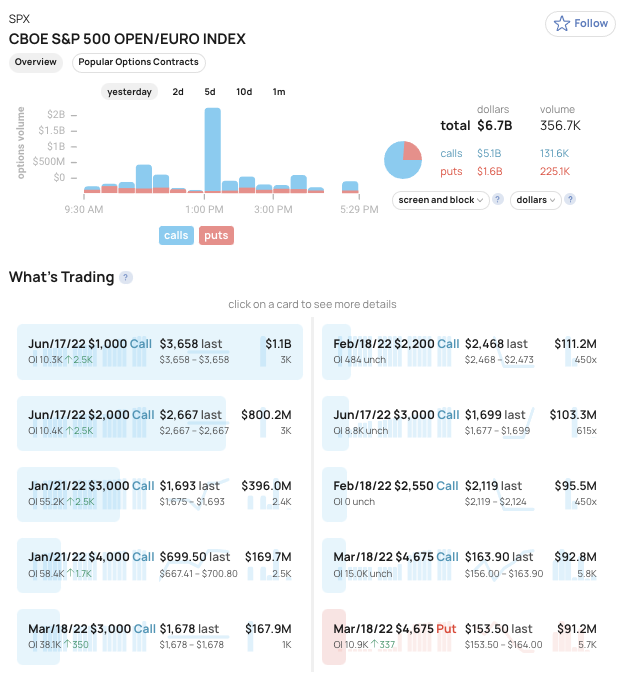
Graphic: Shift Search data suggests participants are likely initiating box spreads and rolling their call exposure out in time (as much as 6 months).
Notwithstanding, as mentioned, yesterday, Goldman Sachs Group (NYSE: GS) saw “options selling strategies as attractive in the near term,” estimating “a 12% probability of a 1-month 5% down-move in the SPX in this economic environment based on [the] GS-EQMOVE model.”
“Options are pricing a 22% probability of that size move indicating that puts are overvalued.”
As noted Tuesday, the commitment of capital on lower volatility results in counterparties taking on more exposure to positive gamma. The growth in positive gamma (as the data is showing) will be offset through the dealers’ supply of liquidity, pressuring the price discovery process.
Note: As a position’s delta rises with stock or index price rises, gamma (or how an option’s delta is expected to change given a change in the underlying) is added to the delta.
This is while many products are in lower liquidity and short-gamma (wherein an options delta decreases with stock prices rises and increases when stock prices drop) in which moves are more erratic.
Therefore, coming into weighty options expirations, correlations may be off (as that is the only reconciliation in an environment where, at the index level, hedging pressures are sticky, whereas elsewhere they aren’t).
Thereafter, participants ought to monitor the sides and levels capital is committed for clues as to where we go next. Continued compression of volatility, as well as a commitment to options higher in prices and further out in time, supports upward price discovery.
Graphic: Via The Market Ear, “There have been five prior years since 1953 (when we went to the 5-day trading week) that have seen December as the most volatile month: 1973, 1978, 1985, 1995, and 2018. The January following these five prior years was BIG positive four out of five times, with January 2019 seeing the biggest gain.”
Weakness (alongside a commitment to strikes lower in price and out in time) likely sets the market up for another round of instability, as realized in late November and early December.
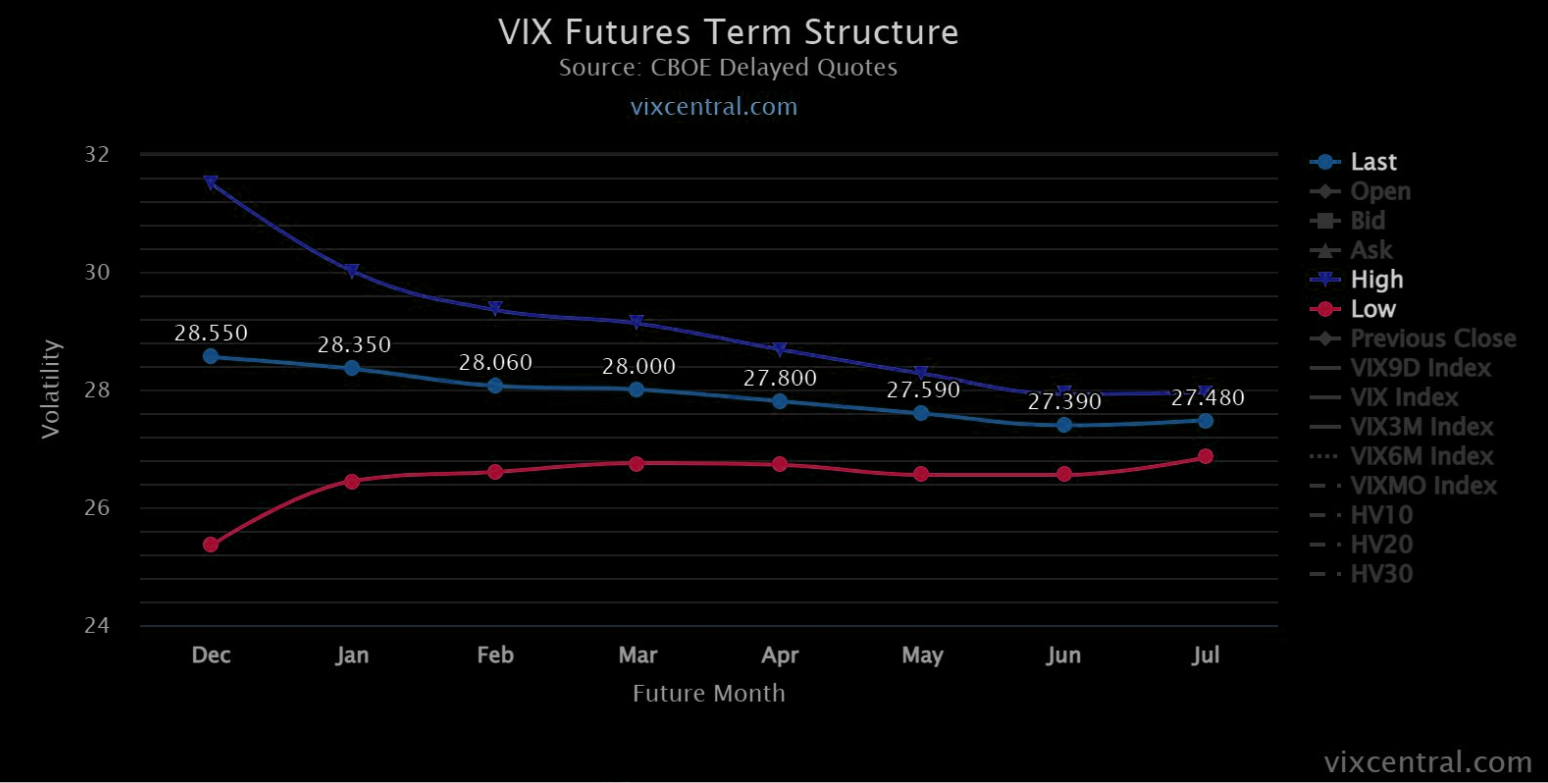
Graphic: A compression in the VIX term structure would provide markets with a boost.
Expectations: As of 6:30 AM ET, Thursday’s regular session (9:30 AM – 4:00 PM ET), in the S&P 500, will likely open in the upper part of a positively skewed overnight inventory, outside of prior-range and -value, suggesting a potential for immediate directional opportunity.
Spike Rules In Play: Spike’s mark the beginning of a break from value. Spikes higher (lower) are validated by trade at or above (below) the spike base (i.e., the origin of the spike).

The spike base is $4,678.50. Below bearish (change in tone). Above bullish (status quo).
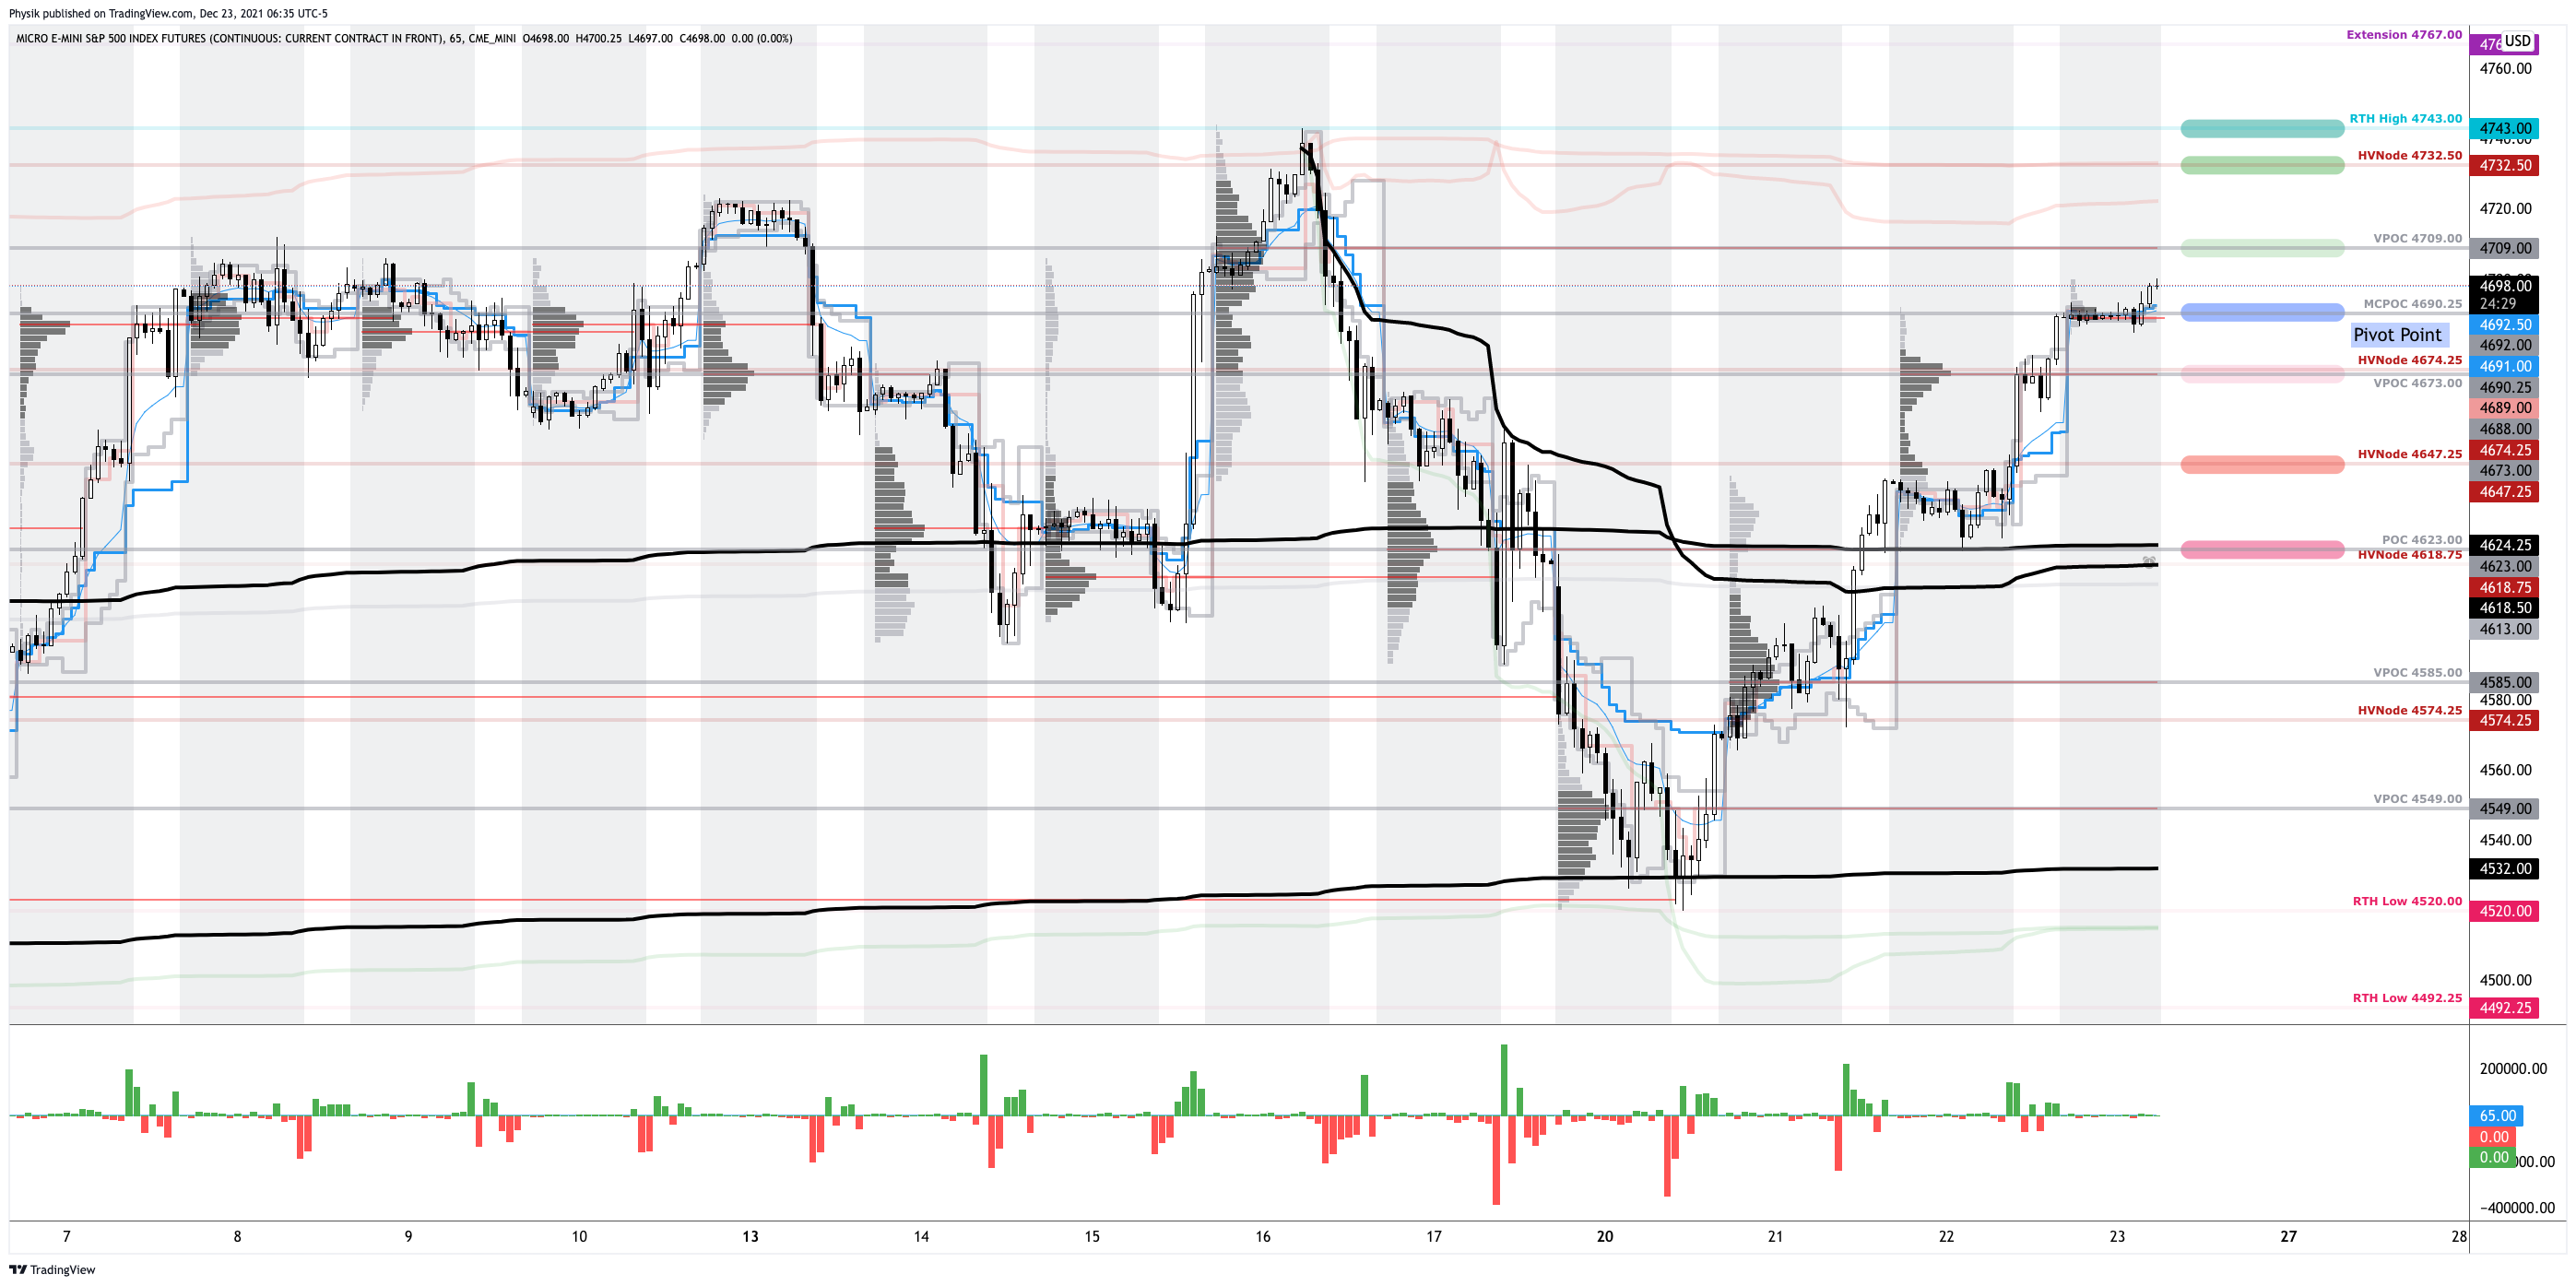
In the best case, the S&P 500 trades sideways or higher; activity above the $4,690.75 micro composite point of control (MCPOC) puts in play the $4,709.00 untested point of control (VPOC). Initiative trade beyond the VPOC could reach as high as the $4,732.50 high volume area (HVNode) and $4,743.00 regular trade high (RTH High), or higher.
In the worst case, the S&P 500 trades lower; activity below the $4,690.25 MCPOC puts in play the $4,673.00 VPOC. Initiative trade beyond the VPOC could reach as low as the $4,647.25 HVNode and $4,623.00 POC, or lower.
Click here to load today’s key levels into the web-based TradingView charting platform. Note that all levels are derived using the 65-minute timeframe. New links are produced, daily.
Graphic: 65-minute profile chart of the Micro E-mini S&P 500 Futures. Learn about the profile.
Definitions
Volume Areas: A structurally sound market will build on areas of high volume (HVNodes). Should the market trend for long periods of time, it will lack sound structure, identified as low volume areas (LVNodes). LVNodes denote directional conviction and ought to offer support on any test.
If participants were to auction and find acceptance into areas of prior low volume (LVNodes), then future discovery ought to be volatile and quick as participants look to HVNodes for favorable entry or exit.
POCs: POCs are valuable as they denote areas where two-sided trade was most prevalent in a prior day session. Participants will respond to future tests of value as they offer favorable entry and exit.
MCPOCs: POCs are valuable as they denote areas where two-sided trade was most prevalent over numerous day sessions. Participants will respond to future tests of value as they offer favorable entry and exit.
Significance Of Prior ATHs, ATLs: Prices often encounter resistance (support) at prior highs (lows) due to the supply (demand) of old business. These areas take time to resolve. Breaking and establishing value (i.e., trading more than 30-minutes beyond this level) portends continuation.
Price Discovery (One-Timeframe Or Trend): Elongation and range expansion denotes a market seeking new prices to establish value, or acceptance (i.e., more than 30-minutes of trade at a particular price level).
Volume-Weighted Average Prices (VWAPs): A metric highly regarded by chief investment officers, among other participants, for quality of trade. Additionally, liquidity algorithms are benchmarked and programmed to buy and sell around VWAPs.
About
After years of self-education, strategy development, and trial-and-error, Renato Leonard Capelj began trading full-time and founded Physik Invest to detail his methods, research, and performance in the markets.
Additionally, Capelj is a Benzinga finance and technology reporter interviewing the likes of Shark Tank’s Kevin O’Leary, JC2 Ventures’ John Chambers, and ARK Invest’s Catherine Wood, as well as a SpotGamma contributor, helping develop insights around impactful options market dynamics.
Disclaimer
At this time, Physik Invest does not carry the right to provide advice. In no way should the materials herein be construed as advice. Derivatives carry a substantial risk of loss. All content is for informational purposes only.
Overnight, equity index futures were divergent while most commodity and bond products were sideways to higher. This is as traders position themselves for the less liquid holiday trade.
Ahead is data on gross domestic product and income (8:30 AM ET), consumer confidence, and existing home sales (10:00 AM ET).
Graphic updated 6:30 AM ET. Sentiment Neutral if expected /ES open is inside of the prior day’s range. /ES levels are derived from the profile graphic at the bottom of the following section. Levels may have changed since initially quoted; click here for the latest levels. SqueezeMetrics Dark Pool Index (DIX) and Gamma (GEX) calculations are based on where the prior day’s reading falls with respect to the MAX and MIN of all occurrences available. A higher DIX is bullish. At the same time, the lower the GEX, the more (expected) volatility. Learn the implications of volatility, direction, and moneyness. SHIFT data used for S&P 500 (INDEX: SPX) options activity. Note that options flow is sorted by the call premium spent; if more positive then more was spent on call options. Breadth reflects a reading of the prior day’s NYSE Advance/Decline indicator. VIX reflects a current reading of the CBOE Volatility Index (INDEX: VIX) from 0-100.
What To Expect
On supportive intraday breadth and divergent market liquidity metrics, the best case outcome occurred; the S&P 500 auctioned away from intraday value, the levels at which participants found it most favorable to trade at.
Given the mechanical responses to key technical levels, visually-driven, weaker-handed participants (which seldom bear the wherewithal to defend retests) are very much in control.
Moreover, Tuesday’s activity, which was follow-through on Monday’s responsive buying, left low-volume structures in its wake.
Virgin tests of the low-volume – a void of sorts – ought to hold. Successful penetration portends follow-through given the participants that were most active at those levels.
Graphic: Divergent delta (i.e., non-committed buying as measured by volume delta or buying and selling power as calculated by the difference in volume traded at the bid and offer) in SPDR S&P 500 ETF Trust (NYSE: SPY), one of the largest ETFs that track the S&P 500 index, via Bookmap. The readings are supportive of responsive trade (i.e., rotational trade that suggests current prices offer favorable entry and exit; the market is in balance).
Context: In light of elevated implied volatility and limited macro, and micro catalysts, Goldman Sachs Group (NYSE: GS) sees “options selling strategies as attractive in the near term.”
“We estimate there is a 12% probability of a 1-month 5% down-move in the SPX in this economic environment based on our GS-EQMOVE model. Options are pricing a 22% probability of that size move indicating that puts are overvalued.”
The commitment of capital on lower directional volatility results in counterparties taking on more exposure to positive gamma which they will offset by supplying the market with liquidity, thereby pressuring the price discovery process.
Note: As a position’s delta rises with stock or index price rises, gamma (or how an option’s delta is expected to change given a change in the underlying) is added to the delta.
“I use this analogy of a jet,” Kai Volatility’s Cem Karsan once explained to me, referencing the three factors – the change in the underlying price (gamma), implied volatility (vanna), and time (charm) – that are well known to impact an options exposure to directional risk or delta.
“As volatility is compressed, those jets will keep firing because … the hedging vanna and charm flows, and whatnot will push the markets higher.”
Still, many products are in lower liquidity and short-gamma (wherein an options delta decreases with stock prices rises and increases when stock prices drop) in which moves are more erratic.
If the S&P were to further trend sideways, as a result of the aforementioned hedging pressures, a decline in correlation – among volatile constituents – would be the only reconciliation.
A post-holiday collapse in implied volatility, coupled with the management of massive S&P positions, and relentless, seasonally-aligned “passive buying support,” may bring in positive flows that would bolster any attempt higher.
Graphic: A compression in the VIX term structure would provide markets a boost.
Expectations: As of 6:30 AM ET, Wednesday’s regular session (9:30 AM – 4:00 PM ET), in the S&P 500, will likely open in the upper part of a balanced overnight inventory, just outside of prior-range and -value, suggesting a potential for immediate directional opportunity.
Gap Scenarios In Play: Gaps ought to fill quickly. Should they not, that’s a signal of strength; do not fade. Leaving value behind on a gap-fill or failing to fill a gap (i.e., remaining outside of the prior session’s range) is a go-with indicator.

Auctioning and spending at least 1-hour of trade back in the prior range suggests a lack of conviction; in such a case, do not follow the direction of the most recent initiative activity.
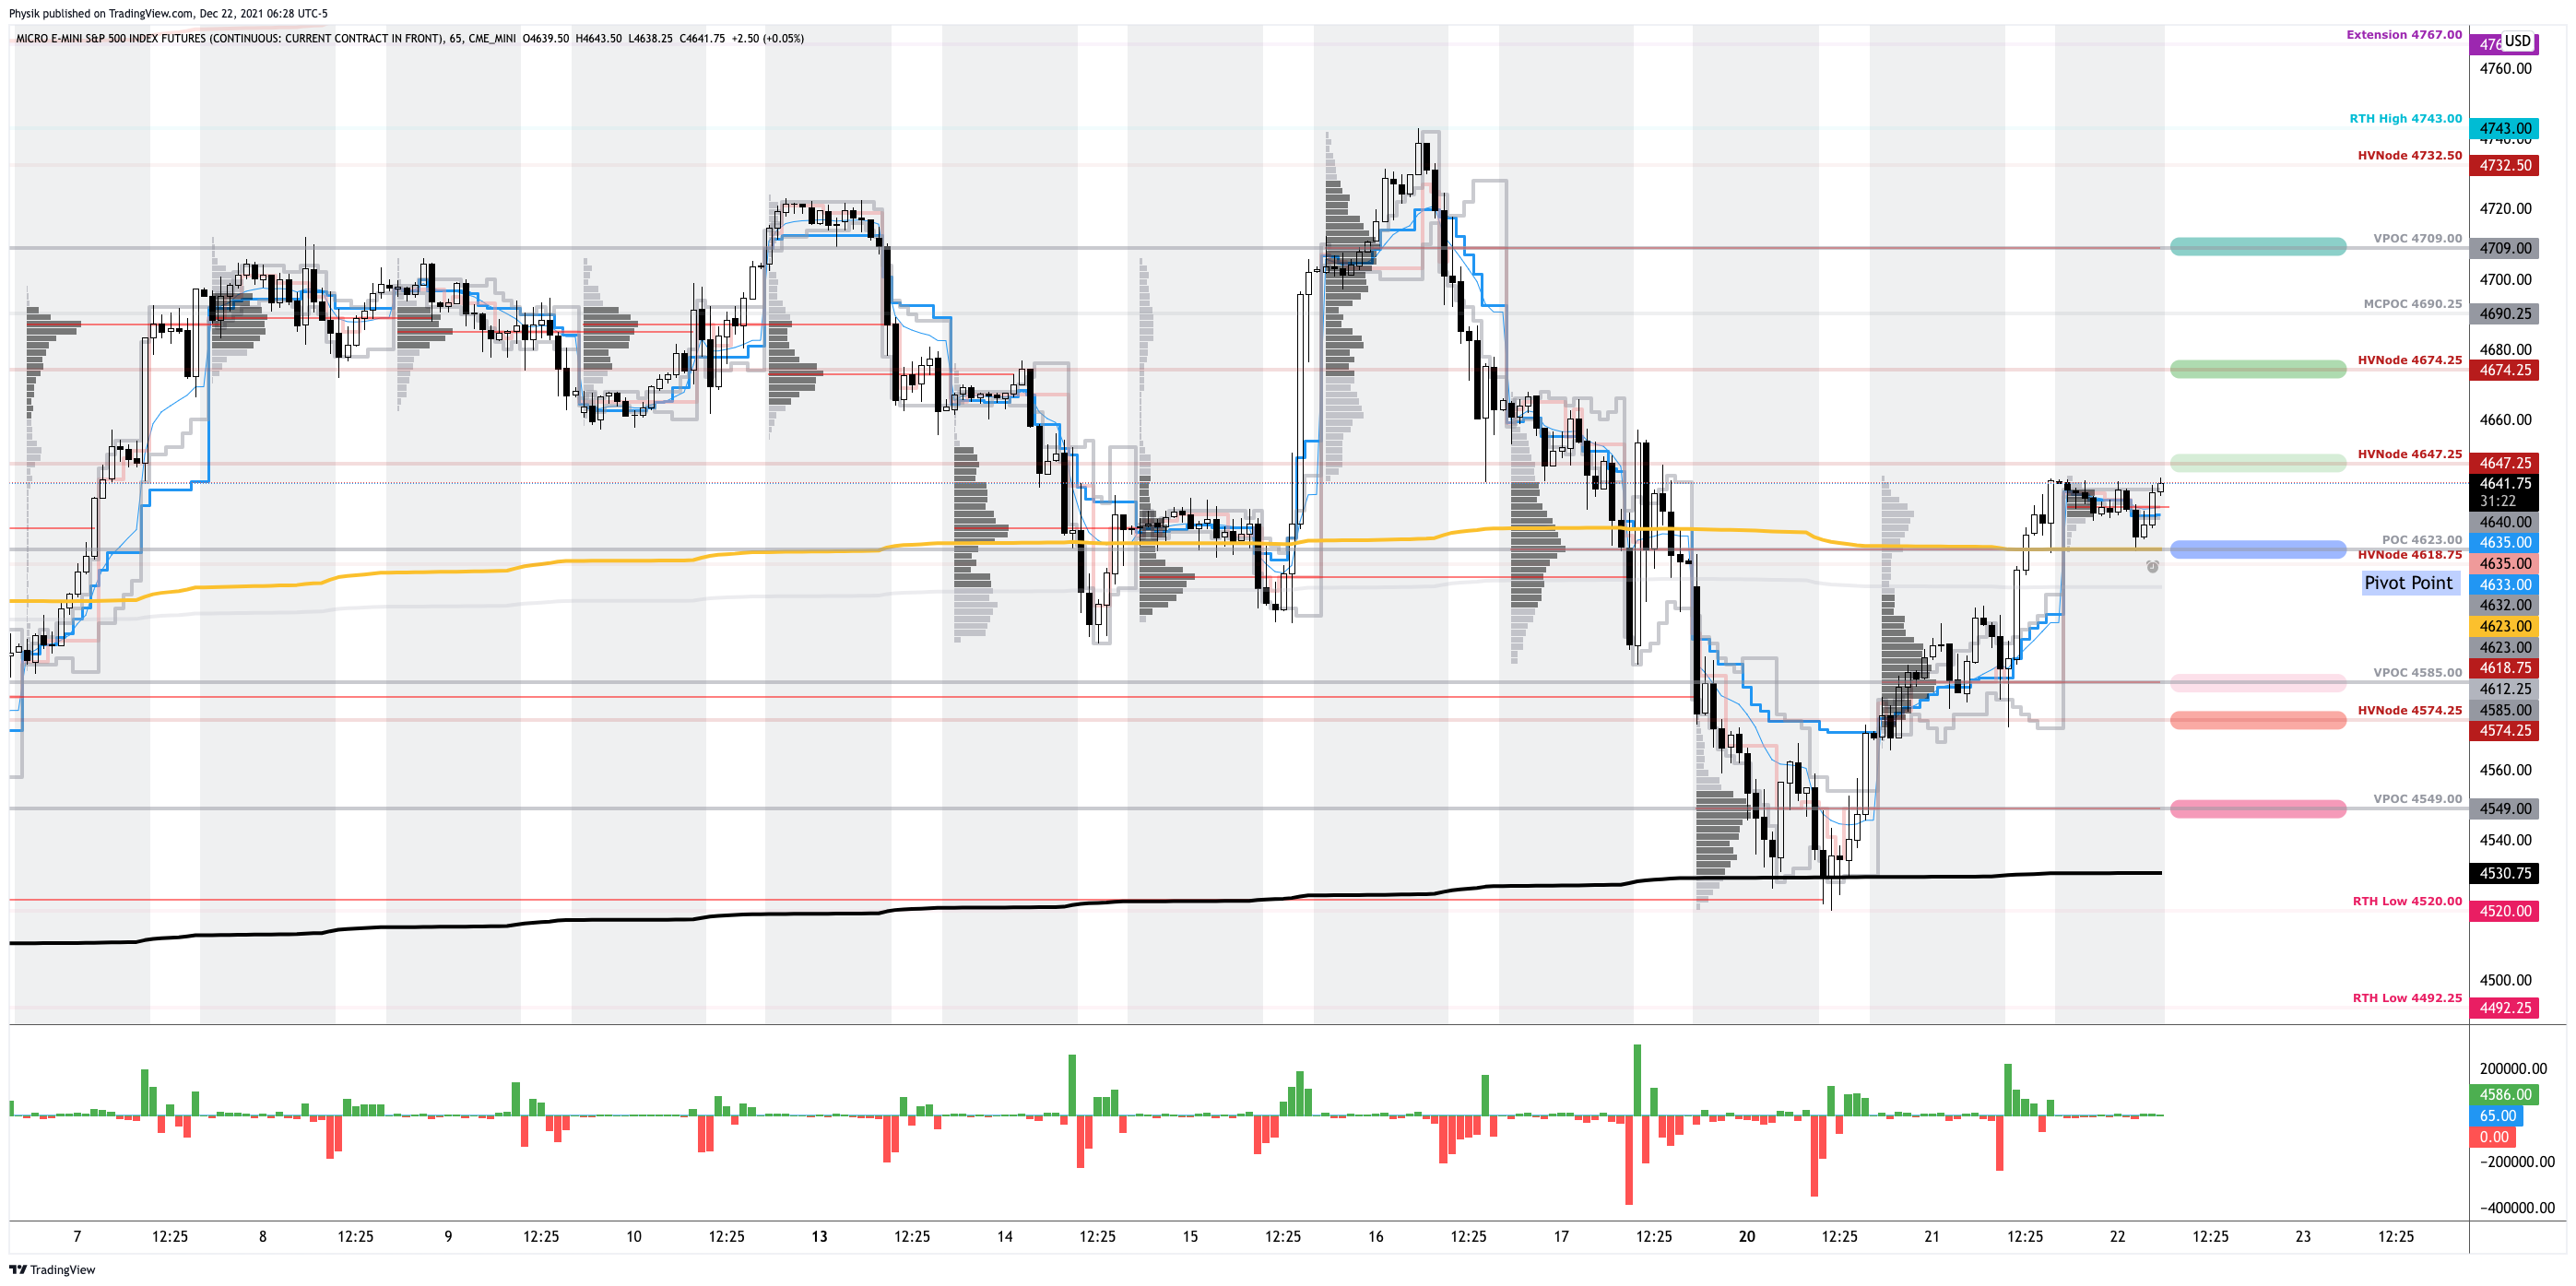
In the best case, the S&P 500 trades sideways or higher; activity above the $4,623.00 point of control (POC) puts in play the $4,647.25 high volume area (HVNode). Initiative trade beyond the HVNode could reach as high as the $4,674.25 HVNode and $4,709.00 VPOC, or higher.
In the worst case, the S&P 500 trades lower; activity below the $4,623.00 POC puts in play the $4,585.00 VPOC. Initiative trade beyond the VPOC could reach as low as the $4,574.25 HVNode and $4,549.00 VPOC, or lower.
Click here to load today’s key levels into the web-based TradingView charting platform. Note that all levels are derived using the 65-minute timeframe. New links are produced, daily.
Graphic: 65-minute profile chart of the Micro E-mini S&P 500 Futures. Learn about the profile.
What People Are Saying
To me, this is really the most cautious sign in this environment.
Contrary to the news outlets, there has not been any real “fear” hitting the derivatives market. Yes there was a bid in vol, but we have been noticing a lot of orders on the tape opening to sell Vega. https://t.co/scRyKSSTTy
Volume Areas: A structurally sound market will build on areas of high volume (HVNodes). Should the market trend for long periods of time, it will lack sound structure, identified as low volume areas (LVNodes). LVNodes denote directional conviction and ought to offer support on any test.
If participants were to auction and find acceptance into areas of prior low volume (LVNodes), then future discovery ought to be volatile and quick as participants look to HVNodes for favorable entry or exit.
POCs: POCs are valuable as they denote areas where two-sided trade was most prevalent in a prior day session. Participants will respond to future tests of value as they offer favorable entry and exit.
MCPOCs: POCs are valuable as they denote areas where two-sided trade was most prevalent over numerous day sessions. Participants will respond to future tests of value as they offer favorable entry and exit.
Volume-Weighted Average Prices (VWAPs): A metric highly regarded by chief investment officers, among other participants, for quality of trade. Additionally, liquidity algorithms are benchmarked and programmed to buy and sell around VWAPs.
About
After years of self-education, strategy development, and trial-and-error, Renato Leonard Capelj began trading full-time and founded Physik Invest to detail his methods, research, and performance in the markets.
Additionally, Capelj is a Benzinga finance and technology reporter interviewing the likes of Shark Tank’s Kevin O’Leary, JC2 Ventures’ John Chambers, and ARK Invest’s Catherine Wood, as well as a SpotGamma contributor, helping develop insights around impactful options market dynamics.
Disclaimer
At this time, Physik Invest does not carry the right to provide advice. In no way should the materials herein be construed as advice. Derivatives carry a substantial risk of loss. All content is for informational purposes only.
Overnight, equity index futures auctioned sideways to lower with growth-heavy and rate-sensitive names bearing the brunt of the move.
This is as Goldman Sachs Group (NYSE: GS) economists reduced their U.S. economic growth expectations, Senator Joe Manchin rejected a $2 trillion tax-and-spending package, hawkish central bank pivots, and rising COVID-19 lockdown risks.
Ahead is data on leading economic indicators (10:00 AM ET).
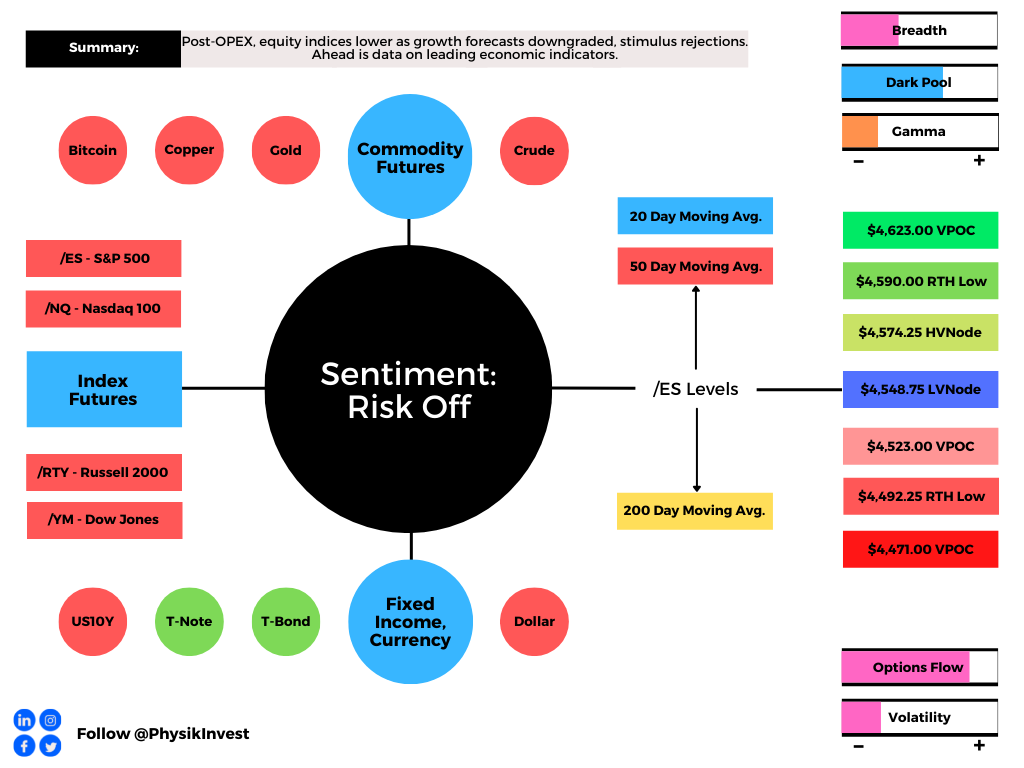
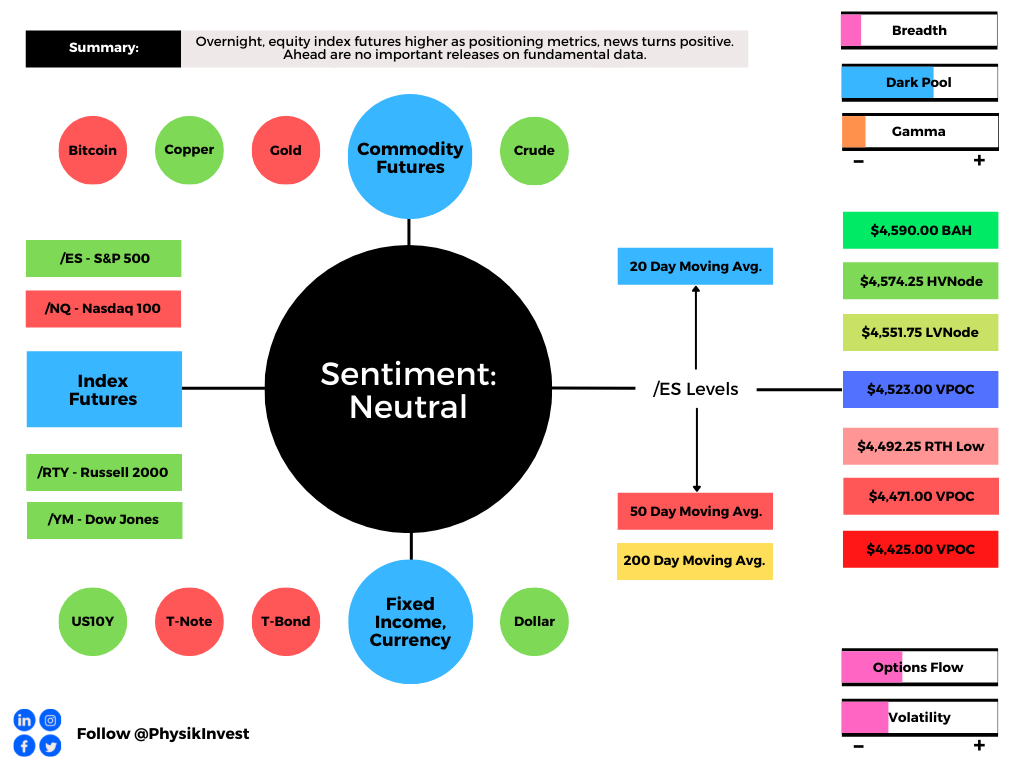
Graphic updated 6:40 AM ET. Sentiment Risk-Off if expected /ES open is below the prior day’s range. /ES levels are derived from the profile graphic at the bottom of the following section. Levels may have changed since initially quoted; click here for the latest levels. SqueezeMetrics Dark Pool Index (DIX) and Gamma (GEX) calculations are based on where the prior day’s reading falls with respect to the MAX and MIN of all occurrences available. A higher DIX is bullish. At the same time, the lower the GEX, the more (expected) volatility. Learn the implications of volatility, direction, and moneyness. SHIFT data used for S&P 500 (INDEX: SPX) options activity. Note that options flow is sorted by the call premium spent; if more positive then more was spent on call options. Breadth reflects a reading of the prior day’s NYSE Advance/Decline indicator. VIX reflects a current reading of the CBOE Volatility Index (INDEX: VIX) from 0-100.
What To Expect
Divergent breadth in less heavily-weighted constituents, and what remains of “put-heavy” positioning, coupled with recent fundamental developments, is feeding into lower index prices.
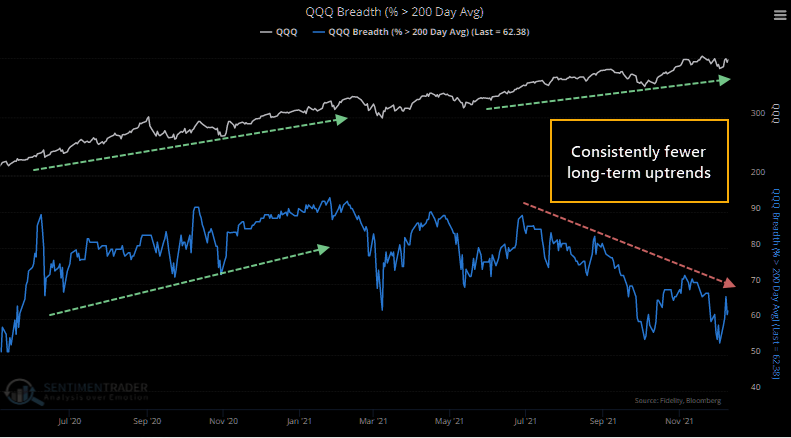
Graphic: Sentimentrader writes: “Fewer than 65% of NDX stocks are currently trading above their 200-day moving averages. That is a stark change from a year ago when internal trends improved as the NDX marched steadily higher.”
Though the December 17 options expiration (OPEX) cleared positive delta and quite a bit of negative delta (e.g., the ARK Innovation ETF [NYSE: ARKK] had $1.5 billion in notional put delta expire) which, in theory, should open a window of strength and realized volatility, wherein positive fundamental forces and dealers’ covering of hedges would bolster any recovery, the January 21 expiry still carries $1.7 billion in notional put delta.
Continued weakness and higher volatility, among other things, likely solicits dealer hedging of exposure to increasing positive delta; weakness has dealers selling against short-dated, increasingly sensitive negative gamma positioning.
With breadth still to recover, a clear expansion of range places the S&P 500 below its 20- and 50-day simple moving averages, the levels which solicited responsive buying by short-term, visual traders who often lack the wherewithal (both emotional and financial) to defend retests.
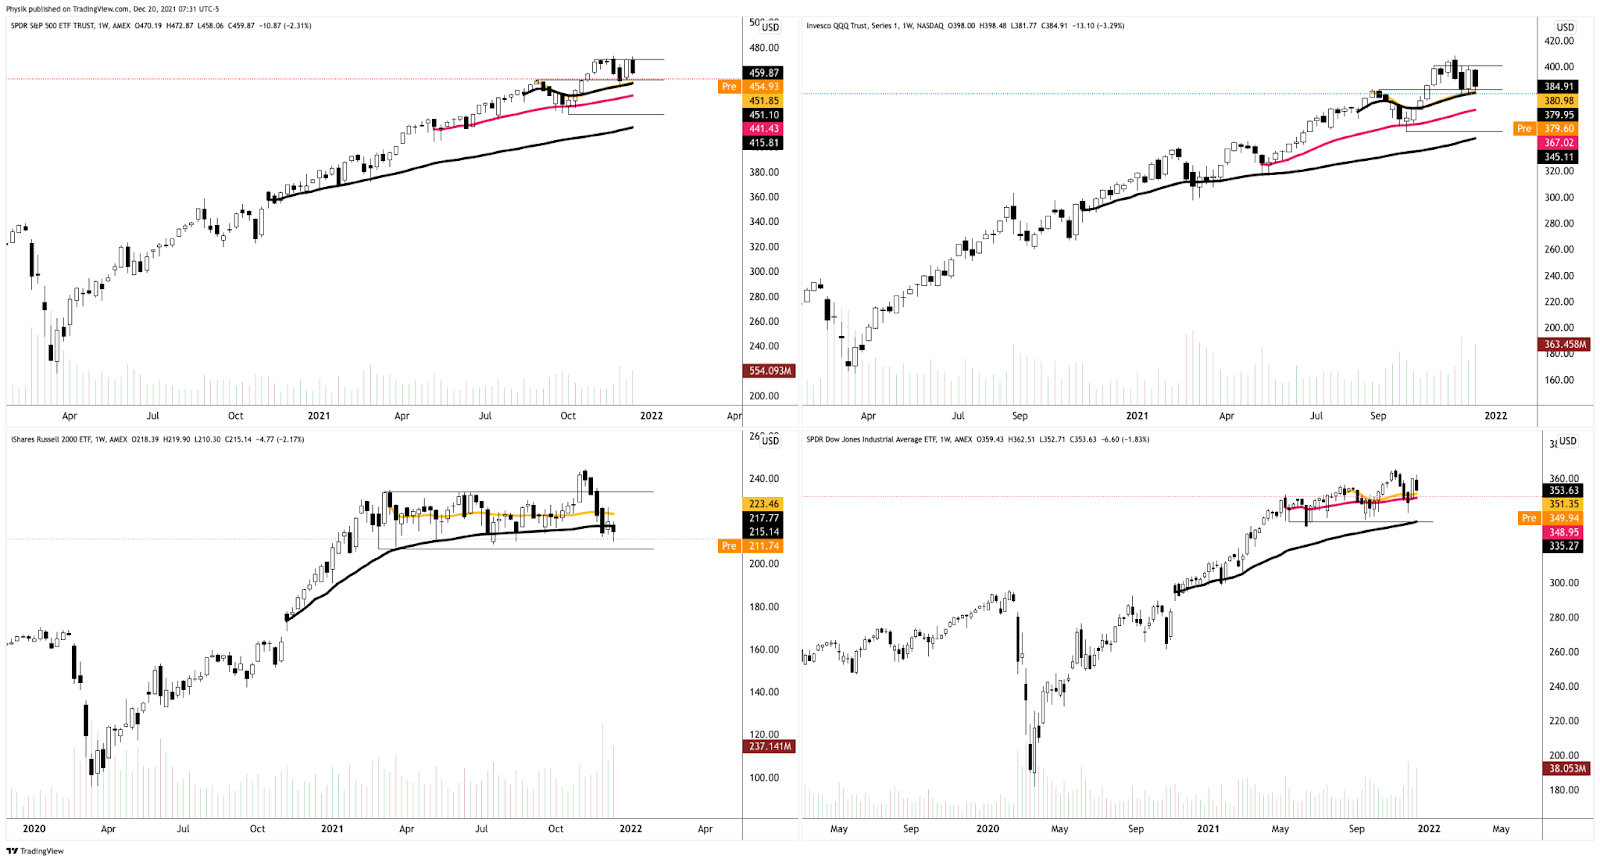
Graphic: Monthly charts of the S&P 500 (top left), Nasdaq 100 (top right), Russell 2000 (bottom left), Dow Jones Industrial Average (bottom right). All indices come into major support areas.
Context: “The Fed is seen responding to the inflation fears stalking businesses by leaning toward an older playbook of prioritizing the fight against price pressures — even if that risks weaker growth over the longer term,” per Bloomberg.
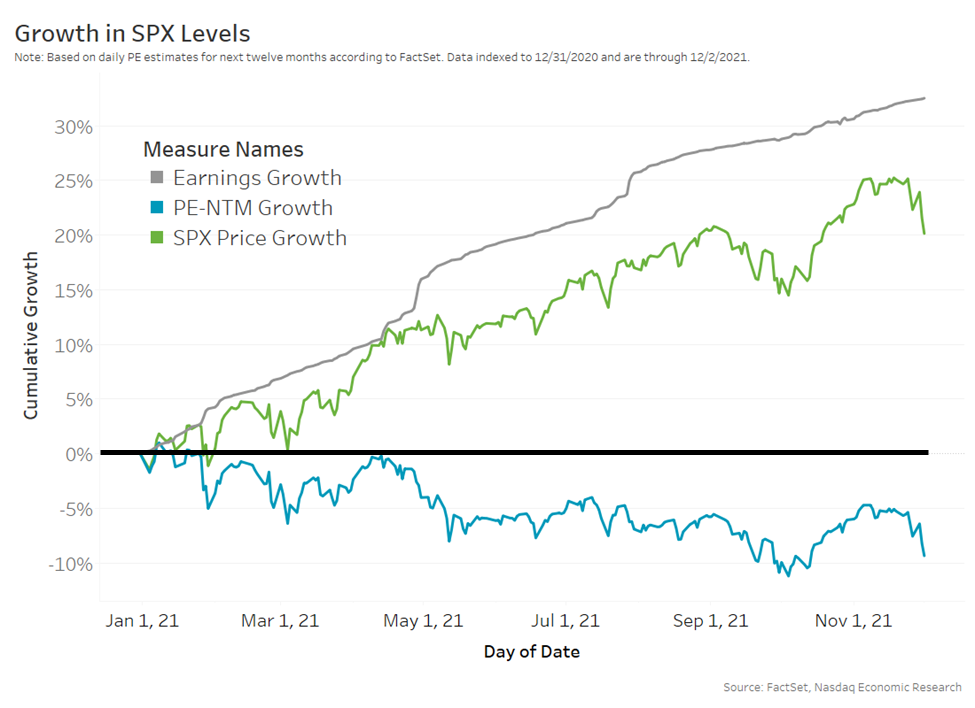
Notwithstanding, per Nasdaq, “growth in earnings is so far stronger than the multiple compression caused by rising rates,” and that is what has helped support this year’s rally.
Couple that with the management of massive S&P positions, and relentless, seasonally-aligned “passive buying support,” in the face of expectations there will be “the strongest quarterly nominal [economic] growth in more than three decades,” weakness (especially in growth-heavy and rate-sensitive names) remains.
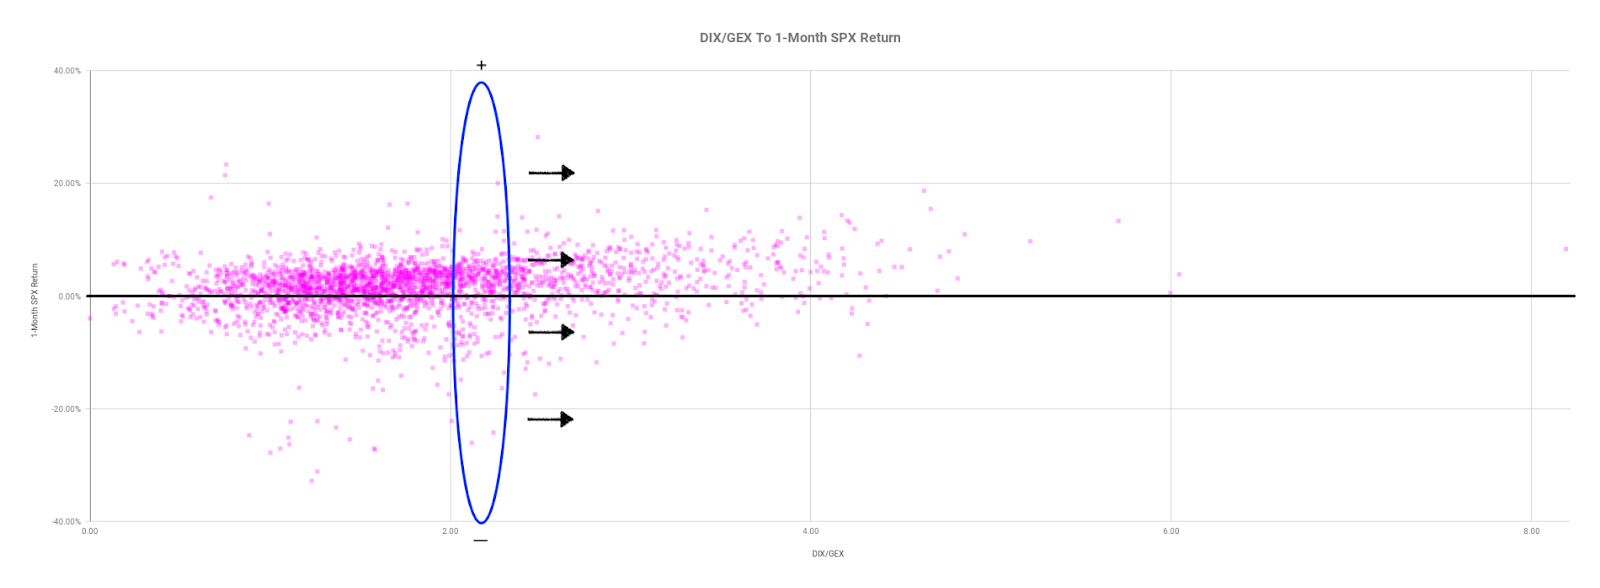
Graphic: Positively skewed return distribution amidst “natural, passive buying,” and supportive positioning metrics. Data SqueezeMetrics. Graph via Physik Invest.
That’s due in part to some of the dynamics discussed in an earlier section, coupled with some negative fundamental developments like the rejection of an economic stimulus package, cuts to Goldman Sachs Group’s GDP forecasts, among other things.
I end with a note from JPMorgan Chase & Co’s (NYSE: JPM) Marko Kolanovic who expects a year-end rally to be driven by stocks targeted by short-sellers.
“For short-selling campaigns to succeed, there have to be positioning, liquidity and often systematic amplifiers of the selloff,” Kolanovic wrote.
“We believe these conditions are not met, and hence this market episode may end up in a short squeeze and cyclical rally into year-end and January.”
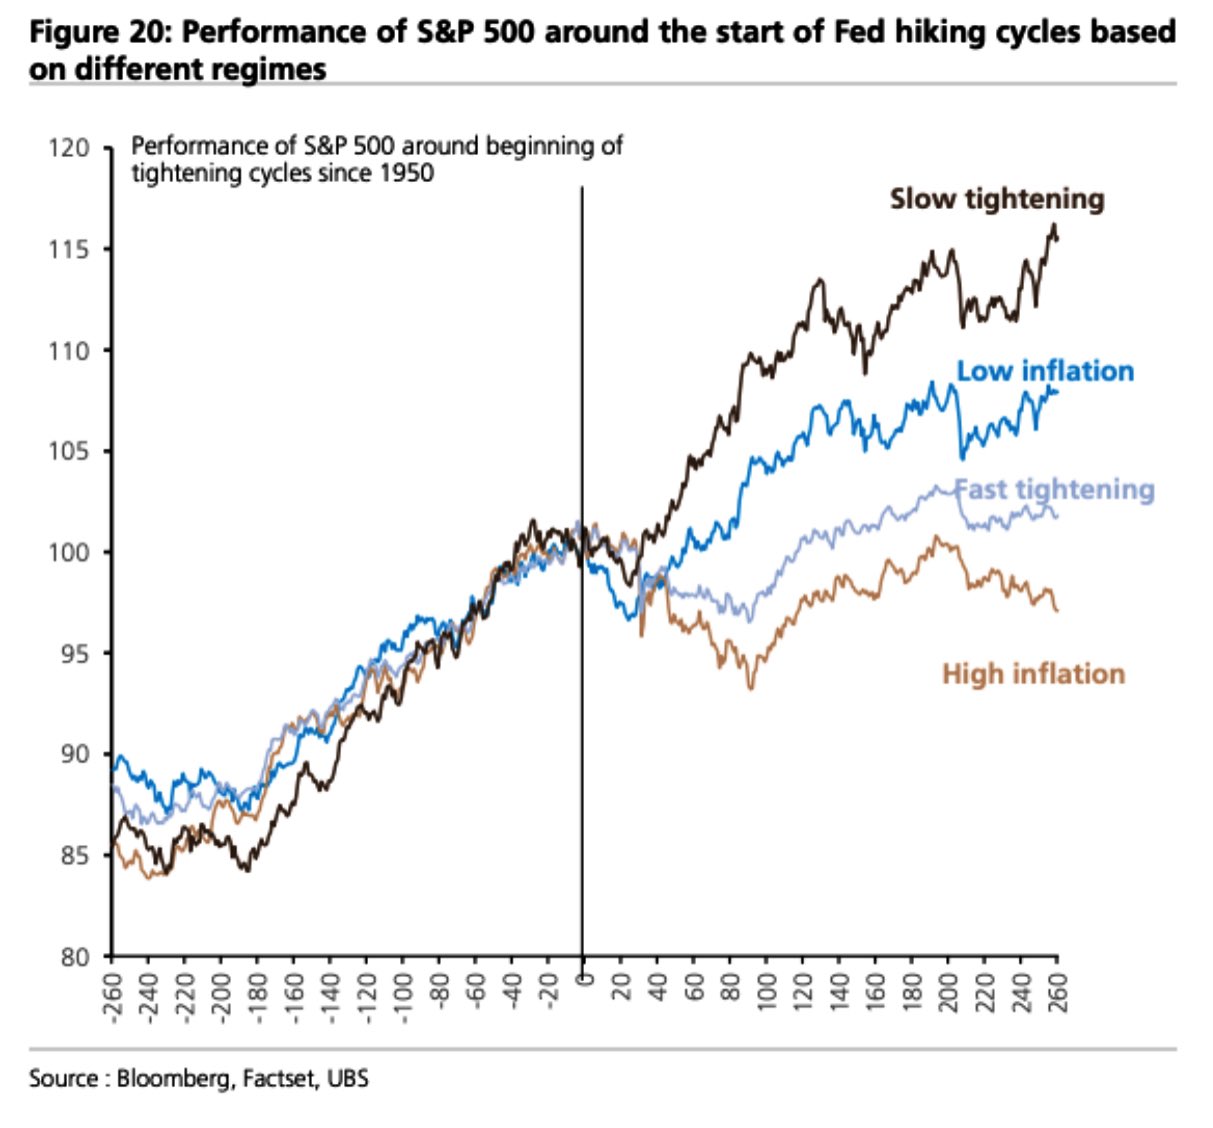
That aligns with light positioning, improving seasonality metrics, and data that suggests equity markets tend to rally into the first hike.
Graphic: S&P 500 performance before and after rate hikes.
Expectations: As of 6:40 AM ET, Monday’s regular session (9:30 AM – 4:00 PM ET), in the S&P 500, will likely open in the middle part of a negatively skewed overnight inventory, outside of prior-range and -value, suggesting a potential for immediate directional opportunity.
Gap Scenarios: Gaps ought to fill quickly. Should they not, that’s a signal of strength; do not fade. Leaving value behind on a gap-fill or failing to fill a gap (i.e., remaining outside of the prior session’s range) is a go-with indicator.

Auctioning and spending at least 1-hour of trade back in the prior range suggests a lack of conviction; in such a case, do not follow the direction of the most recent initiative activity.
In the best case, the S&P 500 trades sideways or higher; activity above the $4,548.75 low volume area (LVNode) puts in play the $4,574.25 high volume area (HVNode). Initiative trade beyond the HVNode could reach as high as the $4,590.00 regular trade low (RTH Low) and $4,623.00 untested point of control (VPOC), or higher.
In the worst case, the S&P 500 trades lower; activity below the $4,548.75 LVNode puts in play the $4,523.00 VPOC. Initiative trade beyond the VPOC could reach as low as the $4,492.25 RTH Low and $4,471.00 VPOC, or lower.
Click here to load today’s key levels into the web-based TradingView charting platform. Note that all levels are derived using the 65-minute timeframe. New links are produced, daily.
Graphic: 65-minute profile chart of the Micro E-mini S&P 500 Futures. Learn about the profile.
Definitions
Volume Areas: A structurally sound market will build on areas of high volume (HVNodes). Should the market trend for long periods of time, it will lack sound structure, identified as low volume areas (LVNodes). LVNodes denote directional conviction and ought to offer support on any test.
If participants were to auction and find acceptance into areas of prior low volume (LVNodes), then future discovery ought to be volatile and quick as participants look to HVNodes for favorable entry or exit.
POCs: POCs are valuable as they denote areas where two-sided trade was most prevalent in a prior day session. Participants will respond to future tests of value as they offer favorable entry and exit.
MCPOCs: POCs are valuable as they denote areas where two-sided trade was most prevalent over numerous day sessions. Participants will respond to future tests of value as they offer favorable entry and exit.
Volume-Weighted Average Prices (VWAPs): A metric highly regarded by chief investment officers, among other participants, for quality of trade. Additionally, liquidity algorithms are benchmarked and programmed to buy and sell around VWAPs.
About
After years of self-education, strategy development, and trial-and-error, Renato Leonard Capelj began trading full-time and founded Physik Invest to detail his methods, research, and performance in the markets.
Additionally, Capelj is a Benzinga finance and technology reporter interviewing the likes of Shark Tank’s Kevin O’Leary, JC2 Ventures’ John Chambers, and ARK Invest’s Catherine Wood, as well as a SpotGamma contributor, helping develop insights around impactful options market dynamics.
Disclaimer
At this time, Physik Invest does not carry the right to provide advice. In no way should the materials herein be construed as advice. Derivatives carry a substantial risk of loss. All content is for informational purposes only.
Overnight, equity index futures auctioned sideways to higher after Friday’s liquidation had the S&P 500 undercutting its 50-day simple moving average (SMA), a visual go/no-go level.
Strength shifted, again, to the Russell 2000 while the tech-heavy Nasdaq 100 was underwater. This comes as policymakers look to temper inflation with the tightening of monetary policy.
In regards to news, China’s central bank looked to boost liquidity for its slowing economy. It was also found that a new virus variant was not fueling a surge in hospitalizations; the U.S.’s adviser on the issue, Anthony Fauci, said there wasn’t “a great degree of severity to omicron.”
That didn’t stop the economists at Goldman Sachs Group Inc (NYSE: GS) from cutting their forecasts for U.S. GDP next year; the estimates were revised down on an expectation the omicron strain would drag growth.
Ahead are no important releases on fundamental data.
Graphic updated 6:30 AM ET. Sentiment Neutral if expected /ES open is inside of the prior day’s range. /ES levels are derived from the profile graphic at the bottom of the following section. Levels may have changed since initially quoted; click here for the latest levels. SqueezeMetrics Dark Pool Index (DIX) and Gamma (GEX) calculations are based on where the prior day’s reading falls with respect to the MAX and MIN of all occurrences available. A higher DIX is bullish. At the same time, the lower the GEX, the more (expected) volatility. Learn the implications of volatility, direction, and moneyness. SHIFT data used for S&P 500 (INDEX: SPX) options activity. Note that options flow is sorted by the call premium spent; if more positive then more was spent on call options. Breadth reflects a reading of the prior day’s NYSE Advance/Decline indicator. VIX reflects a current reading of the CBOE Volatility Index (INDEX: VIX) from 0-100.
What To Expect
On weak intraday breadth and divergent market liquidity metrics, the worst outcome occurred; there was an expansion of range, to the downside, and participants spent the majority of the session building value at lower prices (i.e., levels at which 70% of that day’s volume occurred).
The lower bound of Friday’s range was $4,500.00 or so, at which the 50-day SMA corresponded with a large base of resting liquidity.
To note, the 50-day is visual level at which short-term, technically-driven participants were likely buying in response to probes below developing balance.
Successfully auctioning beneath the 50-day is a concern. Those short-term participants lack the wherewithal (both emotional and financial) to defend retests.
Continuation lower, in such a case, is likely.
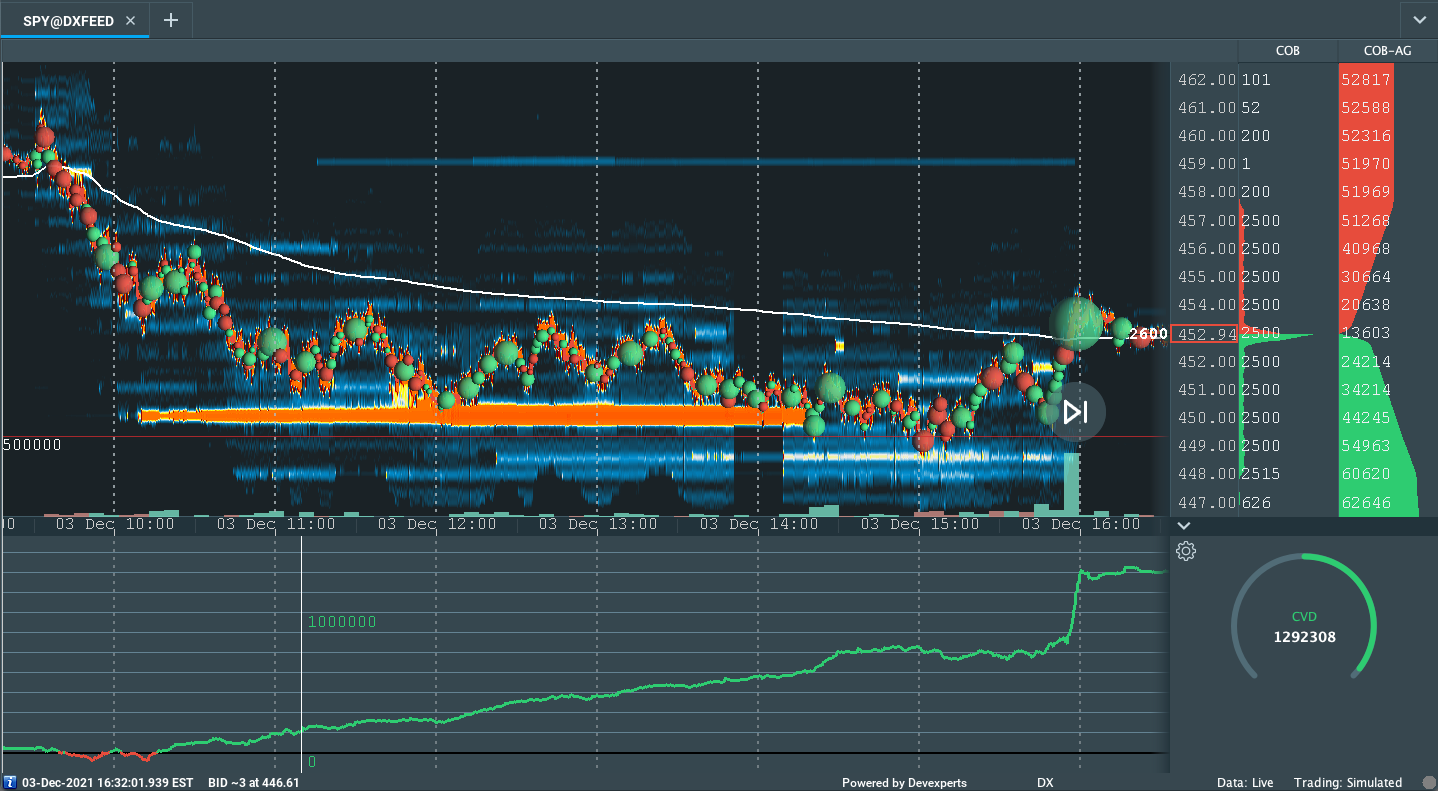
Graphic: Divergent delta (i.e., non-committed selling as measured by volume delta or buying and selling power as calculated by the difference in volume traded at the bid and offer) in SPDR S&P 500 ETF Trust (NYSE: SPY), one of the largest ETFs that track the S&P 500 index, via Bookmap. The readings are supportive of responsive trade (i.e., rotational trade that suggests current prices offer favorable entry and exit; the market is in balance).
Context: The Fed’s intent to moderate stimulus and uncertainty with regards to how a new COVID-19 variant will impact the global recovery.
According to Bloomberg, “the Fed is seen responding to the inflation fears stalking businesses by leaning toward an older playbook of prioritizing the fight against price pressures — even if that risks weaker growth over the longer term.”
In line with the aforementioned, traders already started pricing in potential rate overshoots with the “December 2024 eurodollar yields [rising] above December 2025 contracts, a curve inversion that signals expectations the central bank may consider cutting rates in 2025.”
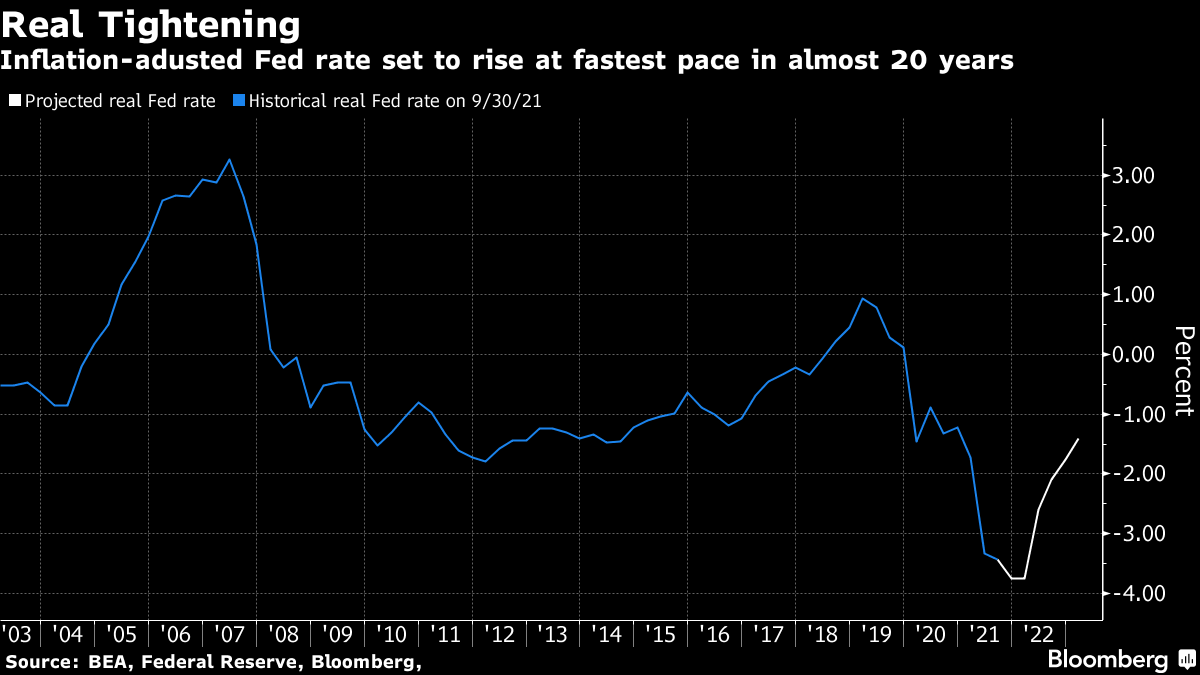
The result is that the U.S. may realize the swiftest tightening in financial conditions since 2005 if the Fed was to hike rates three times next year.
Graphic: Via Bloomberg, trades price in a rapid increase in the real Fed rate.
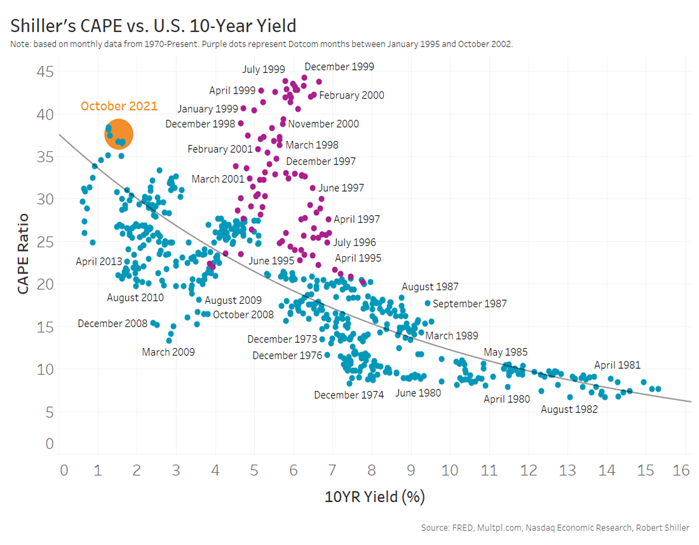
This development carries weight; now, more than during the tech-and-telecom bubble, low rates support current valuations.
Graphic: Low rates support current valuations better than the ‘90s, according to Nasdaq.
The reason being?
“Lower interest rates lead to future cashflow discounting less – leading to higher valuations. From another perspective, a company with a 5% profit margin is a much more attractive investment when long-term borrow costs are less than 2%, as they are now than when it costs 5%-7% to borrow money back in the ‘90s.”
The Fed’s intent to taper faster, and eventually hike rates, just as liquidity conditions have deteriorated, pushed “the orange dot [in the above graphic] toward the right during the year.”
Notwithstanding, “growth in earnings is so far stronger than the multiple compression caused by rising rates (blue line),” and that is helping support this year’s rally.
The intent to moderate stimulus is likely to serve as a headwind; there’s always a possibility of unanticipated policy adjustments, in the face of a resurgent COVID-19 digging further into the economy’s growth.
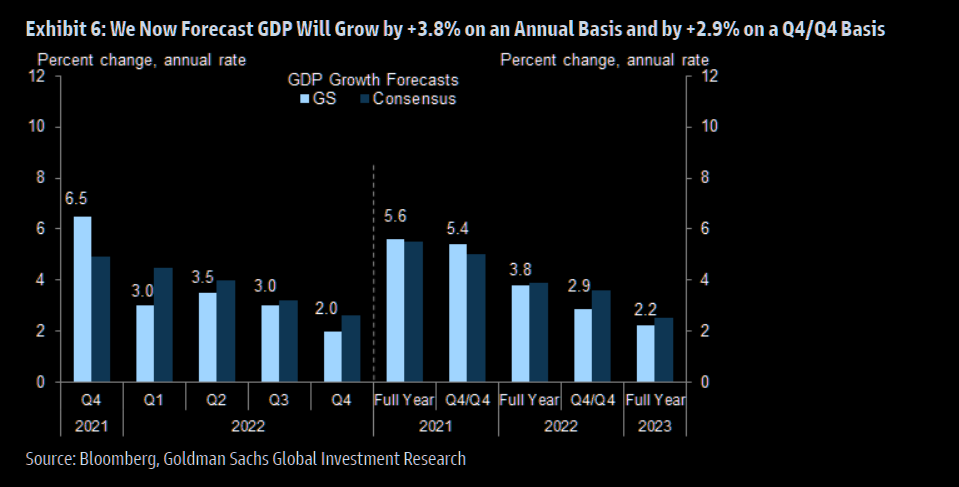
That’s partially why we saw Goldman Sachs cut their forecasts for GDP.
Graphic: Via The Market Ear. Goldman Sachs cut its forecast for GDP.
But, for every negative view, there is a positive (either by the same institution or a competitor).
We see JPMorgan Chase & Co (NYSE: JPM), among others, doubling down on their bullishness.
“We are calling for another year of positive earnings surprises, relative to current consensus estimates.”
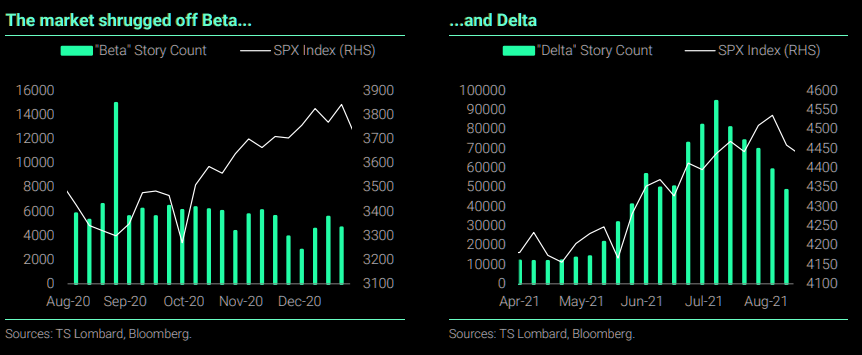
Similarly, the market may shrug off omicron just as it did beta and delta.
Graphic: Via The Market Ear, the market shrugs off COVID-19 variants with ease.
And, despite the market’s trade in short-gamma (a “negative [gamma] implies the opposite [selling into lows, buying into highs], thus magnifying market volatility”) destabilizing demand for downside protection is concentrated in shorter-dated options.
Graphic: A roll lower in the VIX term structure brings in supportive flows. Via The Market Ear.
Once that short-dated protection rolls off the table (and/or is monetized), counterparties will quickly reverse and support the market, buying to close their existing stock/futures hedges.
This flow is stabilizing and may play into a seasonally-aligned rally into Christmas as participants see defenses rolled out against the new COVID-19 variant, and the positive effects of pro-cyclical inflation, economic growth, and improvements in global trade.
Such development plays into a thesis held by Moody’s Corporation (NYSE: MCO).
“The forecast is that the Dow Jones Industrial Average increases this quarter and peaks in early 2022. However, the rest of the contours of the forecast didn’t change. We expect the DJIA to steadily decline throughout 2022, but because it will now peak later than previously thought, the level of the DJIA will be higher at the end of next year and over the near-term forecast.”
Similarly, here are some views by Morgan Stanley (NYSE: MS), compiled by The Market Ear.
“The Morgan Stanley’s Global Risk Demand Index (GRDI) [fell] to a 10Y low reading of -4.2SD, last Friday (currently -3.SD). Historically, such a level has proved to be a solid buy signal over the next 3m. Other signs that investor sentiment has overshot to the downside include the VIX > 30, a steep put-call skew, and the AAII survey where 42% of respondents are bearish (90th percentile reading). Over the last decade, MSCI ACWI has risen 98% of the time over the next 3m post this signal and by an average of 10%.”
Expectations: As of 6:30 AM ET, Monday’s regular session (9:30 AM – 4:00 PM ET), in the S&P 500, will likely open in the middle part of a positively skewed overnight inventory, inside of prior-range and -value, suggesting a limited potential for immediate directional opportunity.
Balance-Break Scenarios: A change in the market (i.e., the transition from two-time frame trade, or balance, to one-time frame trade, or trend) may occur.

Monitor for acceptance (i.e., more than 1-hour of trade) outside of the developing balance area. Rejection (i.e., return inside of balance) portends a move to the opposite end of the balance.
In the best case, the S&P 500 trades sideways or higher; activity above the $4,523.00 untested point of control (VPOC) puts in play the $4,551.75 low volume area (LVNode). Initiative trade beyond the LVNode could reach as high as the $4,574.25 high volume area (HVNode) and $4,590.00 balance area high (BAH), or higher.
In the worst case, the S&P 500 trades lower; activity below the $4,523.00 VPOC puts in play the $4,492.25 regular trade low (RTH Low). Initiative trade beyond the RTH Low could reach as low as the $4,471.00 and $4,425.00 VPOC, or lower.
Click here to load today’s updated key levels into the web-based TradingView charting platform. Note that all levels are derived using the 65-minute timeframe. New links are produced, daily.
Graphic: 65-minute profile chart of the Micro E-mini S&P 500 Futures. Learn about the profile.
What People Are Saying
The "Gamma Trap"
Dec SPX has 3.3mm puts which is the largest of any expiration. The chunkiest of these puts are likely held by funds which will hold to 12/17 expiration. The 4000 strike has the most put interest.
If the market goes under 4500, the gamma trap could set: (1/n)
The 10 day moving average of the combined put-call ratio has been a long time solid guide to human behavior in the markets. When everyone is bullish (.50 ish) markets top and pull back. When everyone is bearish (.70 ish) markets bottom and rally. Ending the week at .75 pic.twitter.com/MDUhUncrMW
Volume Areas: A structurally sound market will build on areas of high volume (HVNodes). Should the market trend for long periods of time, it will lack sound structure, identified as low volume areas (LVNodes). LVNodes denote directional conviction and ought to offer support on any test.
If participants were to auction and find acceptance into areas of prior low volume (LVNodes), then future discovery ought to be volatile and quick as participants look to HVNodes for favorable entry or exit.
Liquidation Breaks: The profile shape suggests participants were “too” long and had poor location.
POCs: POCs are valuable as they denote areas where two-sided trade was most prevalent in a prior day session. Participants will respond to future tests of value as they offer favorable entry and exit.
About
After years of self-education, strategy development, and trial-and-error, Renato Leonard Capelj began trading full-time and founded Physik Invest to detail his methods, research, and performance in the markets.
Additionally, Capelj is a Benzinga finance and technology reporter interviewing the likes of Shark Tank’s Kevin O’Leary, JC2 Ventures’ John Chambers, and ARK Invest’s Catherine Wood, as well as a SpotGamma contributor, developing insights around impactful options market dynamics.
Disclaimer
At this time, Physik Invest does not manage outside capital and is not licensed. In no way should the materials herein be construed as advice. Derivatives carry a substantial risk of loss. All content is for informational purposes only.
Overnight, equity index futures auctioned in-sync, within the confines of yesterday’s recovery.
This is as participants position themselves for Friday’s data dump that may shed light on how fast the Federal Reserve (Fed) intends to tighten monetary policy.
Ahead is data on nonfarm payrolls, the unemployment rate, and average hourly earnings (8:30 AM ET). Later is Fed-speak by James Bullard (9:15 AM ET), Markit services PMI (9:45 AM ET), as well as ISM services, factory orders, and core capital goods orders (10:00 AM ET).
Graphic updated 6:45 AM ET. Sentiment Neutral if expected /ES open is inside of the prior day’s range. /ES levels are derived from the profile graphic at the bottom of the following section. Levels may have changed since initially quoted; click here for the latest levels. SqueezeMetrics Dark Pool Index (DIX) and Gamma (GEX) calculations are based on where the prior day’s reading falls with respect to the MAX and MIN of all occurrences available. A higher DIX is bullish. At the same time, the lower the GEX, the more (expected) volatility. Learn the implications of volatility, direction, and moneyness. SHIFT data used for S&P 500 (INDEX: SPX) options activity. Note that options flow is sorted by the call premium spent; if more positive then more was spent on call options. Breadth reflects a reading of the prior day’s NYSE Advance/Decline indicator. VIX reflects a current reading of the CBOE Volatility Index (INDEX: VIX) from 0-100.
What To Expect
In the face of strong intraday breadth, the best case outcome occurred, evidenced by the recovery of Wednesday’s value (i.e., the prices at which 70% of that day’s volume occurred).
This action negated the knee-jerk selling that coincided with COVID-19 variant news.
As a result, the S&P 500 is back inside of a short-term consolidation; participants had no interest in transacting the S&P 500 on prices advertised below the balancearea.
Context: The Fed’s intent to moderate stimulus and uncertainty with regards to how a new COVID-19 variant will impact the global recovery.
In the face of it all, according to Bloomberg, “The market is again pricing June 2022 as the most likely timing for the first Fed rate hike, same as on Nov. 24. At various stages over the intervening days traders looked at July, or even as late as September.”
This is as an emerging trend from the Fed, confirmed by Chair Jerome Powell’s Congressional testimony – for weeks into this most recent equity – resulted in a re-pricing of bond market risk.
That fear – demand for protection in the bond market – failed to appear in the equity market.
Instead, there was an insatiable appetite for stocks, according to Bloomberg, with investors pouring more cash in 2021 than in the past 19 years, combined.
That appetite for risk fed into the activity of some high-flyers like Tesla Inc (NASDAQ: TSLA), and, more recently Apple Inc (NASDAQ: AAPL). At the same time, the broader market was weakening, evidenced by a decline in breadth.
With indices pinned, heading into the November monthly options expiration (OPEX), as a result of sticky and supportive hedging flows, correlations declined.
Think about it. If heavily weighted index constituents are higher and the indices are pinned, then something has to give!
After OPEX, the removal of certain hedging flows had the market succumb to fundamental forces. The addition of participants’ underexposure to downside put protection, according to SpotGamma, resulted in more rampant two-way volatility.
The reason being? The market quickly entered into an environment known as short-gamma.
“What the heck is that? Please explain to me like I’m ten.” Okay, hold my beer.
Basically, funds holding long equity, in the interest of lower volatility returns, hedge. The S&P 500 is a benchmark and one of the best places to hedge, given liquidity, and so on.
These participants will sell calls against their long equity exposure. The proceeds from that sale will be put toward downside protection. Long equity, short call, long put.Get it?
The counterparty to this dominant positioning is a buyer (seller) of upside (downside) protection, a carry trade (i.e., long delta).
This exposure is hedged, yes! However, this exposure will also decay, in time, all else equal.
Volatility will slide down its term structure (vanna) and time will pass (charm); “as volatility ebbs and time passes, the unwind of these hedges brings in positive flows that can lead to lengthy sprints.” – Cem Karsan of Kai Volatility.
Now, within a certain range, said counterparties are, long-gamma also. Gamma is basically “the rate of change of delta per 1-point move in the underlying,” according to SqueezeMetrics.
As volatility and time to expiration decline, the gamma of at-the-money options rises; “option market-makers will hedge their positions in a fashion that stifles volatility (buying into lows, selling into highs).”
There are times, also, when the market is in a short-gamma; a “negative [gamma] implies the opposite (selling into lows, buying into highs), thus magnifying market volatility.”
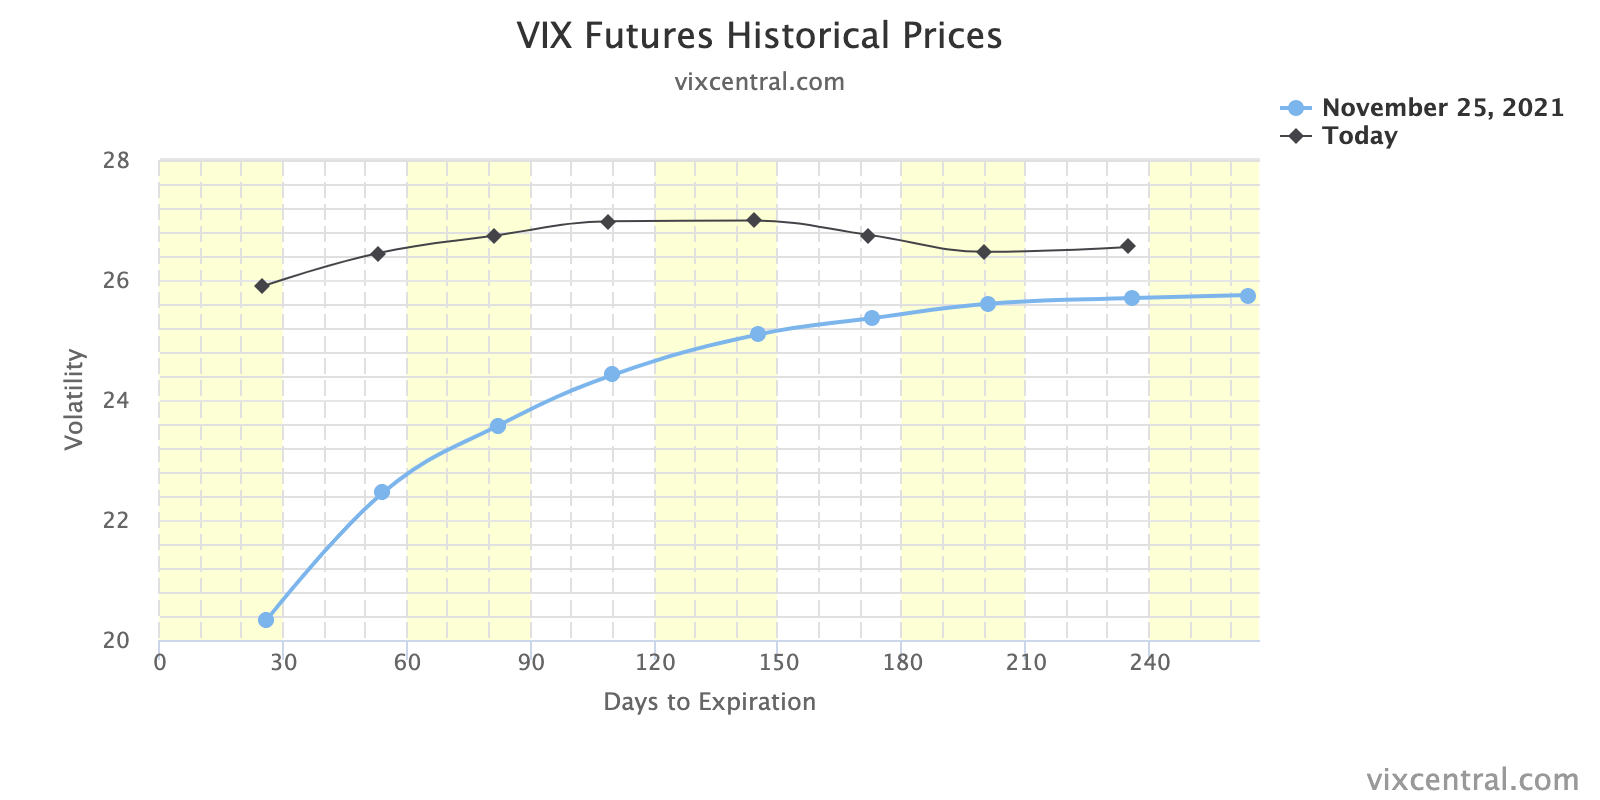
With participants underexposed to downside protection, post-OPEX demand kicked the market into short-gamma; the conditions worsened when much of the activity was concentrated in shorter-dated tenors where the sensitivity of options to direction is higher, as stated.
Graphic: VIX term structure 11/25. Backwardation signaled an entry into an unstable environment with activity concentrated at the front-end of the curve.
Once that short-dated protection rolls off the table (and/or is monetized), counterparties will quickly reverse and support the market, buying to close their existing stock/futures hedges.
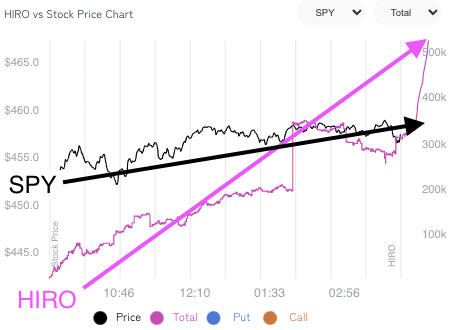
Graphic: SpotGamma’s Hedging Impact of Real-Time Options (HIRO) indicator on 12/2 shows positive options delta trades firing off, which likely had dealers buying stock/futures into the close.
This flow is stabilizing and may play into a seasonally-aligned rally into Christmas as participants see defenses rolled out against the new COVID-19 variant, and the positive effects of pro-cyclical inflation and economic growth, improvements in global trade, and continuity at the Fed, among other dynamics, play out.
Heavy buy program action continues from the open. The Monitor also provides the symbols that are in these buy programs and we can see most of them are in non index component issues …few FATMAAN entries compared to thousands of individual equity symbols.
We see participants opportunistically buying the dip, already, via metrics like DIX that’s derived from liquidity provision on the market-making side.
Graphic: Earnings are rising and helping support historic PE multiples, via Nasdaq.
Notwithstanding, the market is still in short-gamma and unless participants began betting on the upside (i.e., committing increased capital to calls at strikes higher in price and out in time), and we cross over to long-gamma, volatility ought to remain.
To assuage fears, though, here is a quote from Goldman Sachs Group Inc (NYSE: GS):
“We find that the market has already priced in a significant downgrade in the growth outlook off the back of Omicron concerns. While we don’t believe that the most extreme downside scenarios are fully reflected in current market pricing, there are clearly still scenarios that could prove better than anticipated by the sharp shift in pricing in recent weeks, in our view”.
Expectations: As of 6:45 AM ET, Friday’s regular session (9:30 AM – 4:00 PM ET), in the S&P 500, will likely open in the upper part of a negatively skewed overnight inventory, inside of prior-range and -value, suggesting a limited potential for immediate directional opportunity.
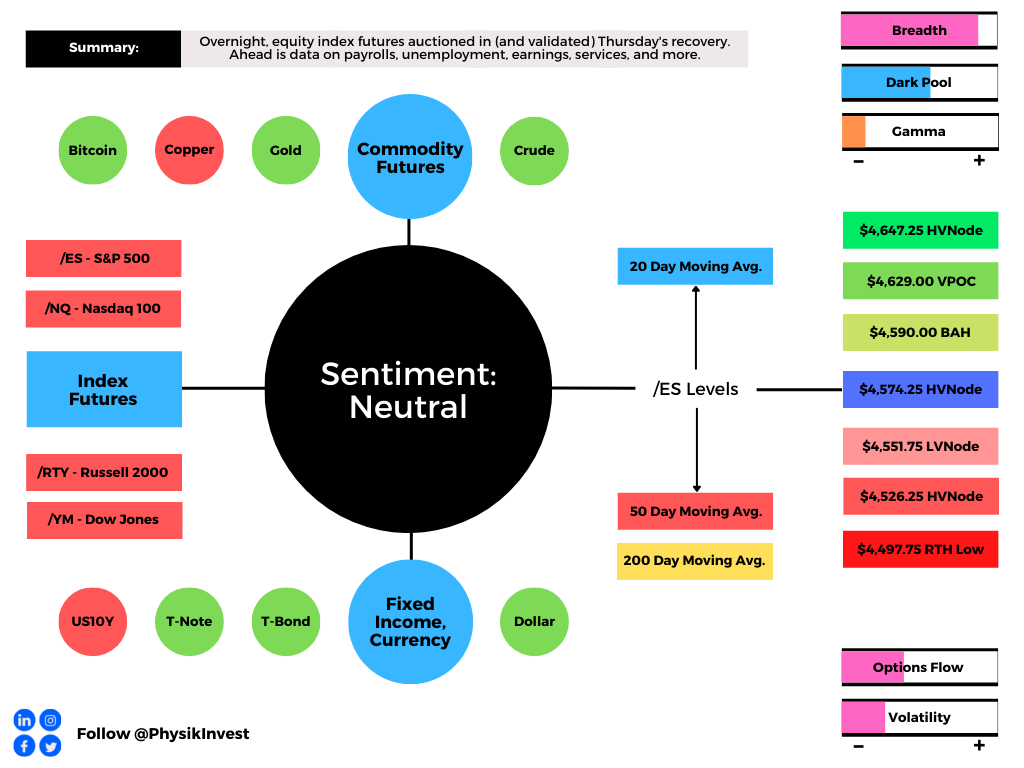
In the best case, the S&P 500 trades sideways or higher; activity above the $4,574.25 high volume area (HVNode) puts in play the $4,590.00 balance area high (BAH). Initiative trade beyond the BAH could reach as high as the $4,629.00 untested point of control (VPOC) and $4,647.25 HVNode, or higher.
In the worst case, the S&P 500 trades lower; activity below the $4,574.25 HVNode puts in play the $4,551.75 low volume area (LVNode). Initiative trade beyond the LVNode could reach as low as the $4,526.25 HVNode and $4,497.75 regular trade low (RTH Low), or lower.
Click here to load today’s updated key levels into the web-based TradingView charting platform. Note that all levels are derived using the 65-minute timeframe. New links are produced, daily.
Graphic: 65-minute profile chart of the Micro E-mini S&P 500 Futures. Learn about the profile.
What People Are Saying
If the bond market is rigged by central bank QE purchases (as per mainstream financial media) and thus we cannot rely on its (inconvenient?) disinflationary signals, then how to explain other gigantic markets (EDF, USD) that corroborate bonds?https://t.co/fcSjDFLGmUpic.twitter.com/DIPqVb6vTg
Volume Areas: A structurally sound market will build on areas of high volume (HVNodes). Should the market trend for long periods of time, it will lack sound structure, identified as low volume areas (LVNodes). LVNodes denote directional conviction and ought to offer support on any test.
If participants were to auction and find acceptance into areas of prior low volume (LVNodes), then future discovery ought to be volatile and quick as participants look to HVNodes for favorable entry or exit.
DIX: For every buyer is a seller (usually a market maker). Using DIX — which is derived from short sales (i.e., liquidity provision on the market-making side) — we can measure buying pressure.
Gamma: Gamma is the sensitivity of an option to changes in the underlying price. Dealers that take the other side of options trades hedge their exposure to risk by buying and selling the underlying. When dealers are short-gamma, they hedge by buying into strength and selling into weakness. When dealers are long-gamma, they hedge by selling into strength and buying into weakness. The former exacerbates volatility. The latter calms volatility.
Vanna: The rate at which the delta of an option changes with respect to volatility.
Charm: The rate at which the delta of an option changes with respect to time.
POCs: POCs are valuable as they denote areas where two-sided trade was most prevalent in a prior day session. Participants will respond to future tests of value as they offer favorable entry and exit.
Options Expiration (OPEX): Traditionally, option expiries mark an end to pinning (i.e, the theory that market makers and institutions short options move stocks to the point where the greatest dollar value of contracts will expire) and the reduction dealer gamma exposure.
Balance (Two-Timeframe Or Bracket): Rotational trade that denotes current prices offer favorable entry and exit. Balance-areas make it easy to spot a change in the market (i.e., the transition from two-time frame trade, or balance, to one-time frame trade, or trend).
Modus operandi is responsive trade (i.e., fade the edges), rather than initiative trade (i.e., play the break).
Value-Area Placement: Perception of value unchanged if value overlapping (i.e., inside day). Perception of value has changed if value not overlapping (i.e., outside day). Delay trade in the former case.
Rates: Low rates have to potential to increase the present value of future earnings making stocks, especially those that are high growth, more attractive. To note, inflation and rates move inversely to each other. Low rates stimulate demand for loans (i.e., borrowing money is more attractive).
About
After years of self-education, strategy development, and trial-and-error, Renato Leonard Capelj began trading full-time and founded Physik Invest to detail his methods, research, and performance in the markets.
Additionally, Capelj is a Benzinga finance and technology reporter interviewing the likes of Shark Tank’s Kevin O’Leary, JC2 Ventures’ John Chambers, and ARK Invest’s Catherine Wood, as well as a SpotGamma contributor, developing insights around impactful options market dynamics.
Disclaimer
At this time, Physik Invest does not manage outside capital and is not licensed. In no way should the materials herein be construed as advice. Derivatives carry a substantial risk of loss. All content is for informational purposes only.
Equity index futures higher. Commodities were higher. Bonds mixed. Volatility compressed.
Ahead is a heavier day of economic releases, in the face of fundamental narratives and positioning metrics that may support intraday price stability.
What Happened
Overnight, equity index futures were marked up ahead of the House’s plan to vote on President Joe Biden’s economic package and infrastructure, as well as October jobs data.
Also, in the news, there were narratives surrounding China’s dollar surplus, a pandemic resurgence in Europe, Pfizer Inc’s (NYSE: PFE) development of a pill for COVID-19.
Ahead is data on payrolls, unemployment, and average hourly earnings (8:30 AM ET), as well as consumer credit (3:00 PM ET). I apologize as this is what I listed yesterday, mistakenly.
Graphic updated 6:30 AM ET. Sentiment Risk-On if expected /ES open is above the prior day’s range. /ES levels are derived from the profile graphic at the bottom of the following section. Levels may have changed since initially quoted; click here for the latest levels. SqueezeMetrics Dark Pool Index (DIX) and Gamma (GEX) calculations are based on where the prior day’s reading falls with respect to the MAX and MIN of all occurrences available. A higher DIX is bullish. At the same time, the lower the GEX, the more (expected) volatility. Learn the implications of volatility, direction, and moneyness. SHIFT data used for S&P 500 (INDEX: SPX) options activity. Note that options flow is sorted by the call premium spent; if more positive then more was spent on call options. Breadth reflects a reading of the prior day’s NYSE Advance/Decline indicator. VIX reflects a current reading of the CBOE Volatility Index (INDEX: VIX) from 0-100.
What To Expect
On weak intraday breadth and lacklustermarket liquidity metrics, the best case outcome occurred, evidenced by balanced trade at newly discovered S&P 500 prices.
As also evidenced by the separation of value, overnight, the gap out of yesterday’s range marks a potential willingness to continue the uptrend.
To note, poor structure left behind prior initiative trade adds to technical instability, a dynamic mentioned in prior commentaries. Participants will likely look to check old value (i.e., revisit, repair, and strengthen) pockets of low-volume, feverishly, on any breakdown of trend.
Graphic: Flat delta (i.e., non-committed buying/selling as measured by volume delta or buying and selling power as calculated by the difference in volume traded at the bid and offer) in SPDR S&P 500 ETF Trust (NYSE: SPY), via Bookmap. The readings are supportive of responsive trade (i.e., rotational trade that suggests current prices offered favorable entry and exit).
Context: The aforementioned trade is happening in the context of a slowdown in economic growth, increased clarity on the Federal Reserve’s (Fed) intent to moderate stimulus, as well as the prospects of renewed fiscal support.
The implications of these narratives on price are contradictory.
To elaborate, supply chain disruptions slowed the pace of economic growth, while participants saw both the Fed’s decision to taper and keep rates unchanged, as well as the potential passage of President Biden’s economic plan, today, as near-term positives.
In terms of positioning, the CBOE Volatility Index (INDEX: VIX) was lower, while supply came in across the VIX futures term structure. That, alongside the long-gamma environment and increased demand for options above current prices (i.e., bets on the upside), points to increased odds of near-term equity market stability.
To quote options analysis and data provider SpotGamma, “the term structure of IV (this is how high the IV is for longer-dated options) remains elevated. That suggests near term options could have more ‘bleed’ which could keep the SPX market price tailwind intact.”
Expectations: As of 6:30 AM ET, Friday’s regular session (9:30 AM – 4:00 PM ET), in the S&P 500, will likely open in the upper part of a positively skewed overnight inventory, outside of prior-range and -value, suggesting a potential for immediate directional opportunity.
Gap Scenarios: Gaps ought to fill quickly. Should they not, that’s a signal of strength; do not fade. Leaving value behind on a gap-fill or failing to fill a gap (i.e., remaining outside of the prior session’s range) is a go-with indicator.

Auctioning and spending at least 1-hour of trade back in the prior range suggests a lack of conviction; in such a case, do not follow the direction of the most recent initiative activity.
In the best case, the S&P 500 trades sideways or higher; activity above the $4,663.00 untested point of control (VPOC) puts in play the $4,684.25 overnight high (ONH). Initiative trade beyond the ONH could reach as high as the $4,705.25 and $4,725.50 Fibonacci, or higher.
In the worst case, the S&P 500 trades lower; activity below the $4,663.00 VPOC puts in play the $4,619.00 VPOC. Initiative trade beyond the VPOC could reach as low as the $4,590.00 balance boundary and $4,574.25 high volume area (HVNode), or lower.
Click here to load today’s updated key levels into the web-based TradingView charting platform. Note that all levels are derived using the 65-minute timeframe. New links are produced, daily.
Graphic: 65-minute profile chart of the Micro E-mini S&P 500 Futures. Learn about the profile.
Charts To Watch
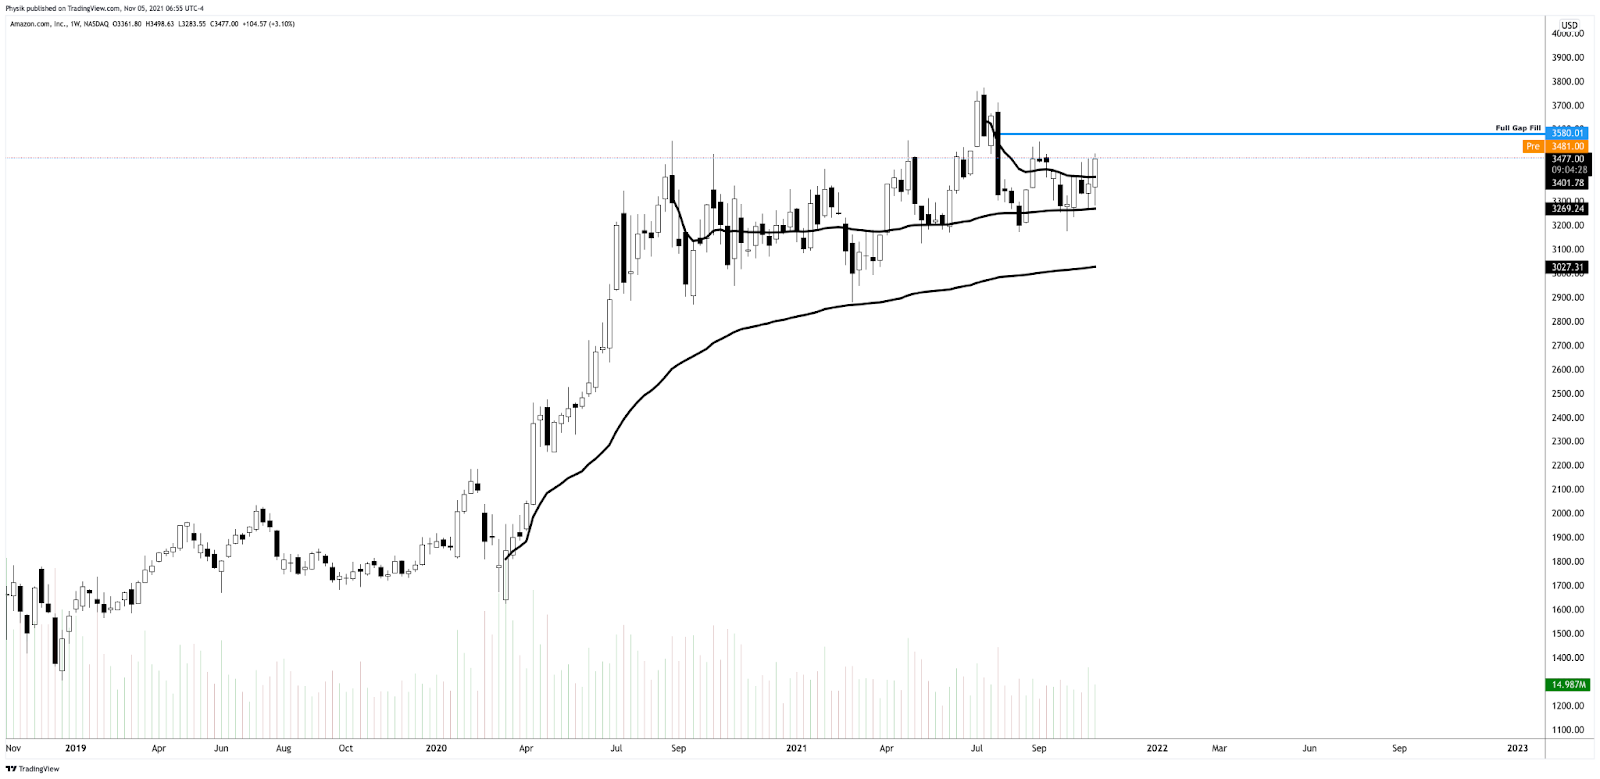
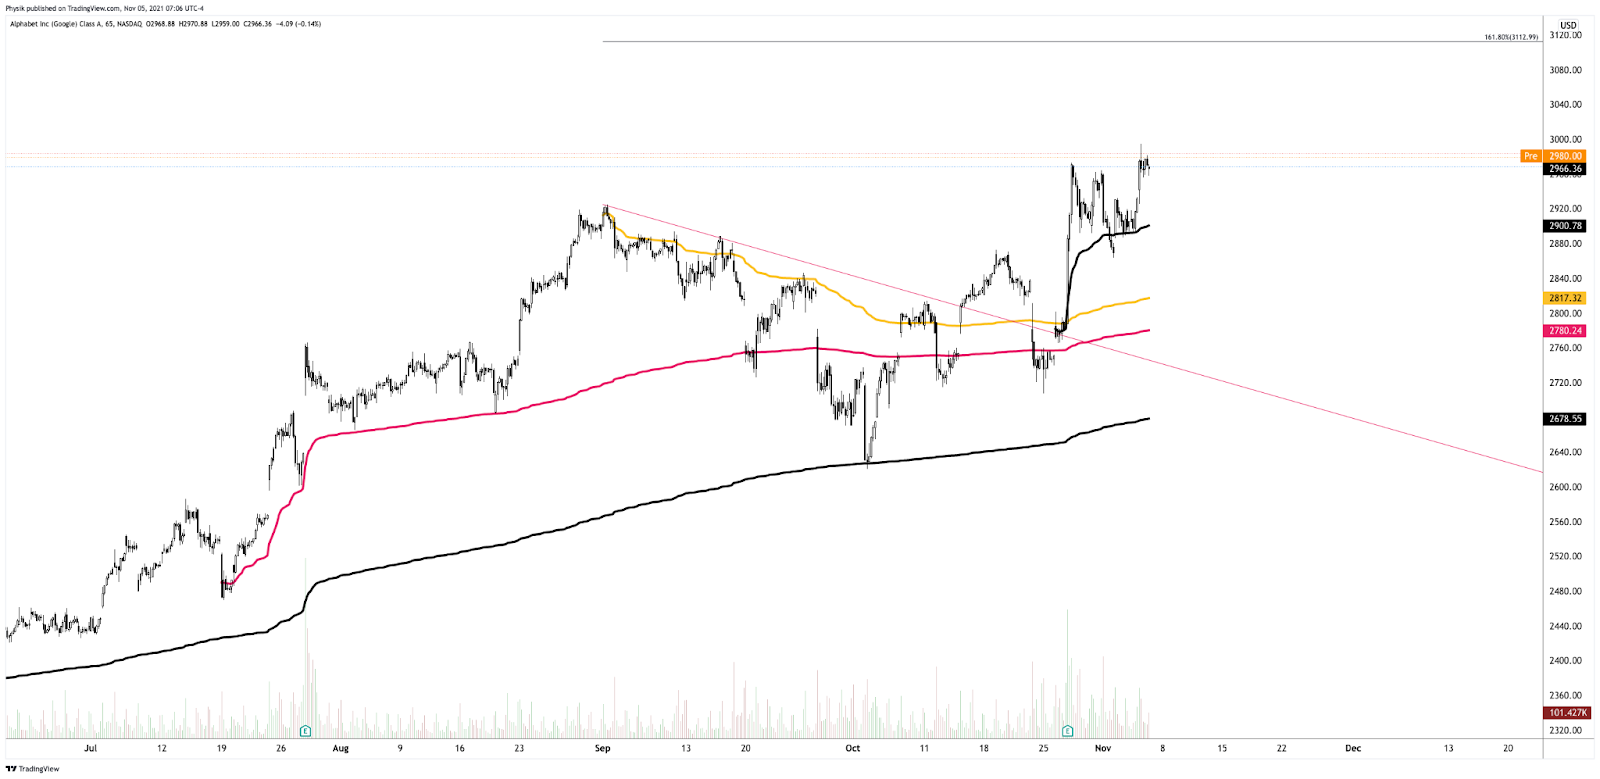
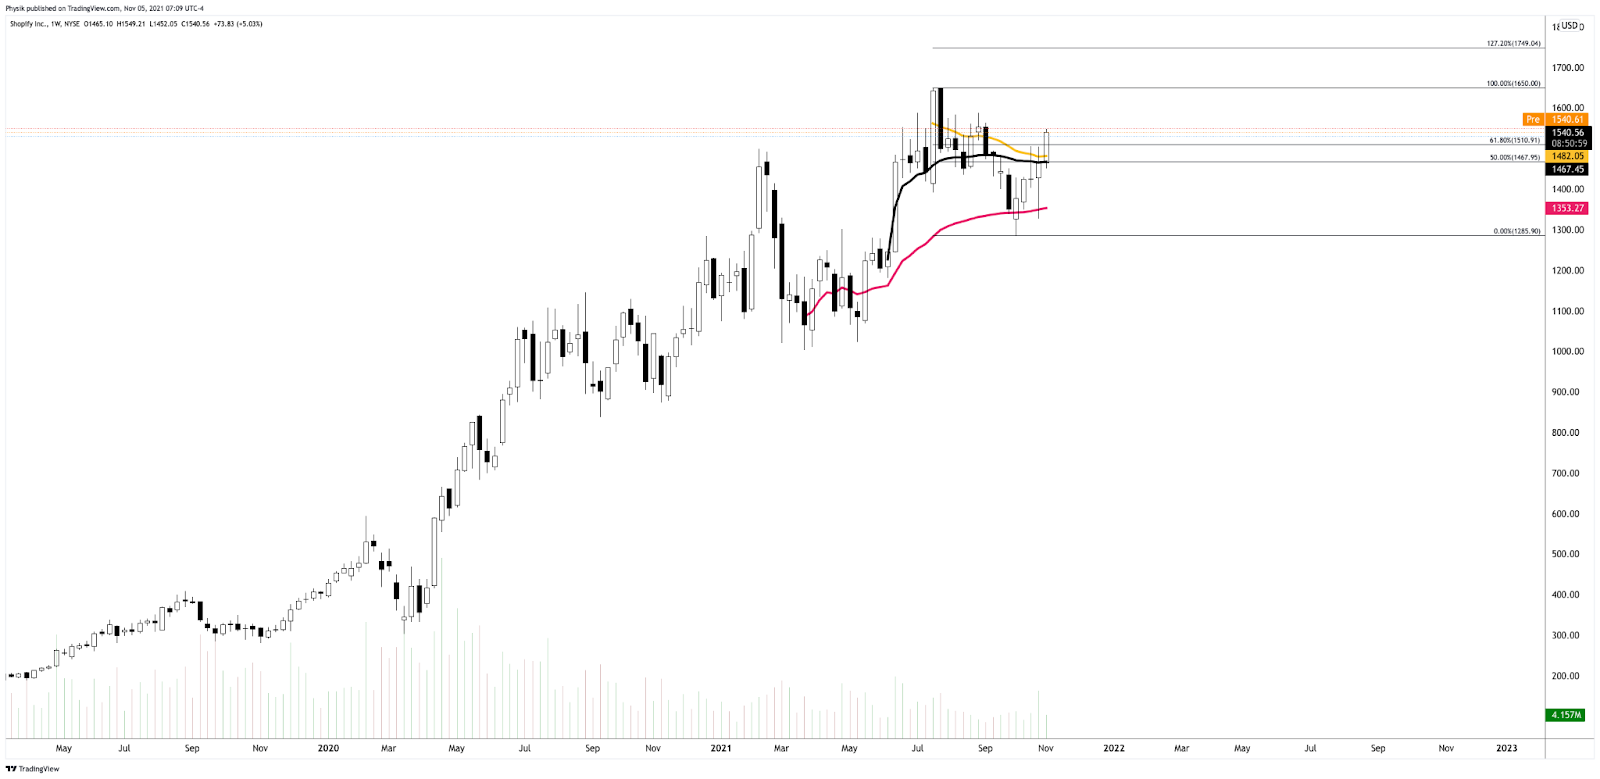
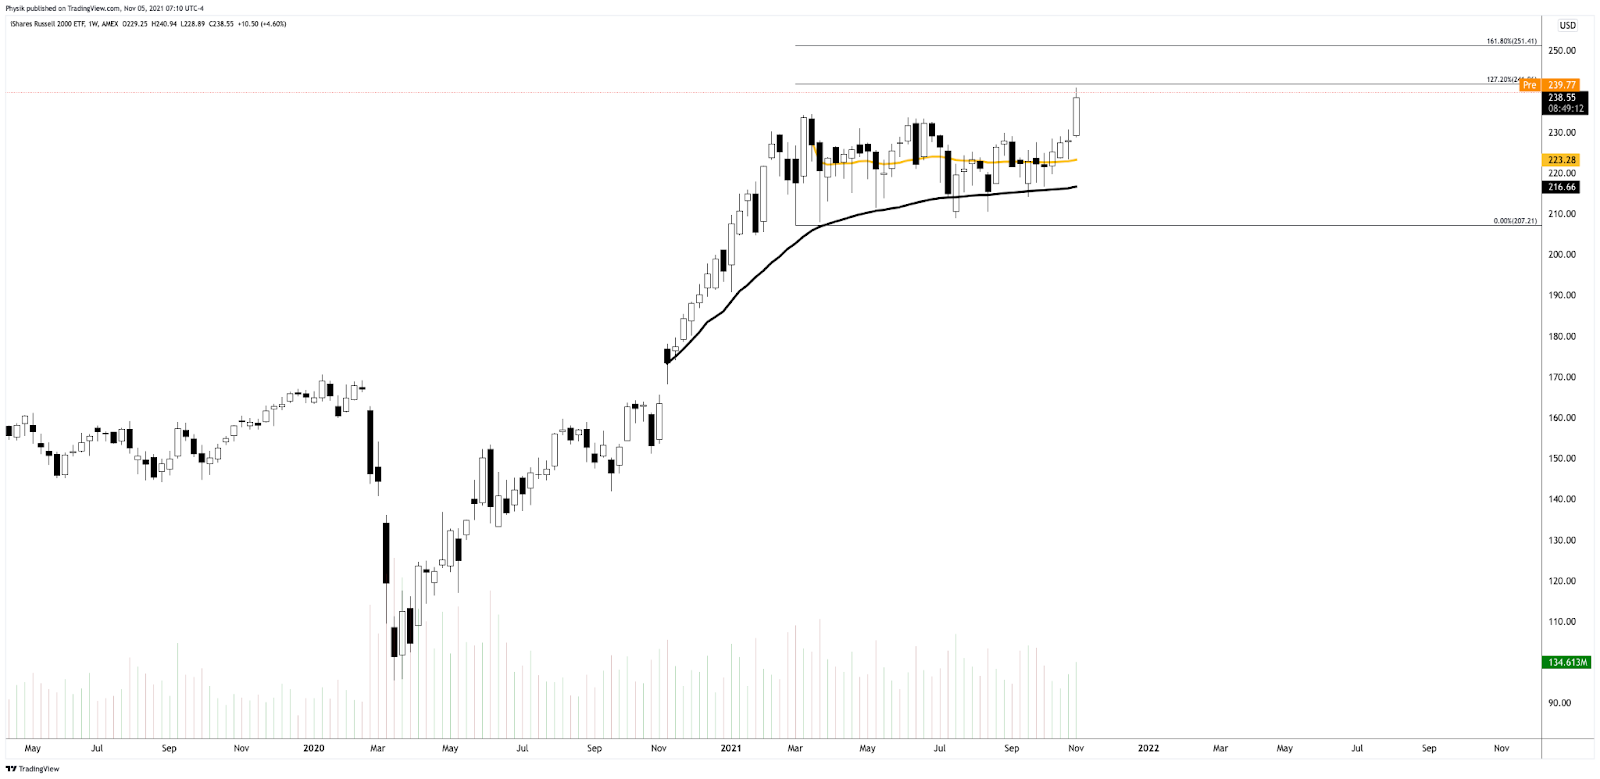
Graphic: (NASDAQ: AMZN). (S~3403, R~3580). S is for support. R is for resistance. I am seeking to initiate short-duration call structures against the 3580 gap fill and prior all-time high. Will initiate for credit or finance with put structures.Graphic: (NASDAQ: FB). (S~326.45, R~336.90). S is for support. R is for resistance. If the stock was to maintain prices above 336.90, there is a potential change in tone. In such a case, I’m targeting Fibonacci retracements with call structures financed with credits on the put side.Graphic: (NASDAQ: GOOGL). (S~2900, R~3113). S is for support. R is for resistance. I’m targeting prices between 3000 and 3100 with call structures for low cost or credit.Graphic: (NYSE: SHOP). (S~1482, R~1650). S is for support. R is for resistance. Potential break of trend, move to an all-time high.Graphic: (NYSE: IWM). (S~234.53, R~241.96, 251.41). S is for support. R is for resistance. Russell 2000 breaks out of balance. In my opinion, upon acceptance, there are potential opportunities for long trades.
Other charts I’m watching include BABA (S~155.29), ZM (S~245.92), ARKK (S~120.15), PINS (S~42.06), Z (S~58.15), BBY (S~123.65), GOOS (S~40.91), CTSH (R~82.00), LYFT (S~44.41), TMUS (S~118.00), WDC (51.47). S is for support. R is for resistance.
What People Are Saying
🔥 Goldman's Prime desk saw clients unwind risk on single names for a 3rd straight day, resulting in the largest $ de-grossing activity in 14 months – since Sept 2020.
Cave-Fill Process: Widened the area deemed favorable to transact at by an increased share of participants. This is a good development.
Overnight Rally Highs (Lows): Typically, there is a low historical probability associated with overnight rally-highs (lows) ending the upside (downside) discovery process.
Volume Areas: A structurally sound market will build on areas of high volume (HVNodes). Should the market trend for long periods of time, it will lack sound structure, identified as low volume areas (LVNodes). LVNodes denote directional conviction and ought to offer support on any test.
If participants were to auction and find acceptance into areas of prior low volume (LVNodes), then future discovery ought to be volatile and quick as participants look to HVNodes for favorable entry or exit.
Gamma: Gamma is the sensitivity of an option to changes in the underlying price. Dealers that take the other side of options trades hedge their exposure to risk by buying and selling the underlying. When dealers are short-gamma, they hedge by buying into strength and selling into weakness. When dealers are long-gamma, they hedge by selling into strength and buying into weakness. The former exacerbates volatility. The latter calms volatility.
POCs: POCs are valuable as they denote areas where two-sided trade was most prevalent in a prior day session. Participants will respond to future tests of value as they offer favorable entry and exit.
Balance (Two-Timeframe Or Bracket): Rotational trade that denotes current prices offer favorable entry and exit. Balance-areas make it easy to spot a change in the market (i.e., the transition from two-time frame trade, or balance, to one-time frame trade, or trend).
Modus operandi is responsive trade (i.e., fade the edges), rather than initiative trade (i.e., play the break).
Value-Area Placement: Perception of value unchanged if value overlapping (i.e., inside day). Perception of value has changed if value not overlapping (i.e., outside day). Delay trade in the former case.
About
After years of self-education, strategy development, and trial-and-error, Renato Leonard Capelj began trading full-time and founded Physik Invest to detail his methods, research, and performance in the markets.
Additionally, Capelj is a Benzinga finance and technology reporter interviewing the likes of Shark Tank’s Kevin O’Leary, JC2 Ventures’ John Chambers, and ARK Invest’s Catherine Wood, as well as a SpotGamma contributor, developing insights around impactful options market dynamics.
Disclaimer
At this time, Physik Invest does not manage outside capital and is not licensed. In no way should the materials herein be construed as advice. Derivatives carry a substantial risk of loss. All content is for informational purposes only.
Equity index futures higher. Commodities were mostly higher. Bonds mixed. Volatility compressed.
Ahead is a heavier day of economic releases, in the face of fundamental narratives and positioning metrics that support intraday price stability.
What Happened
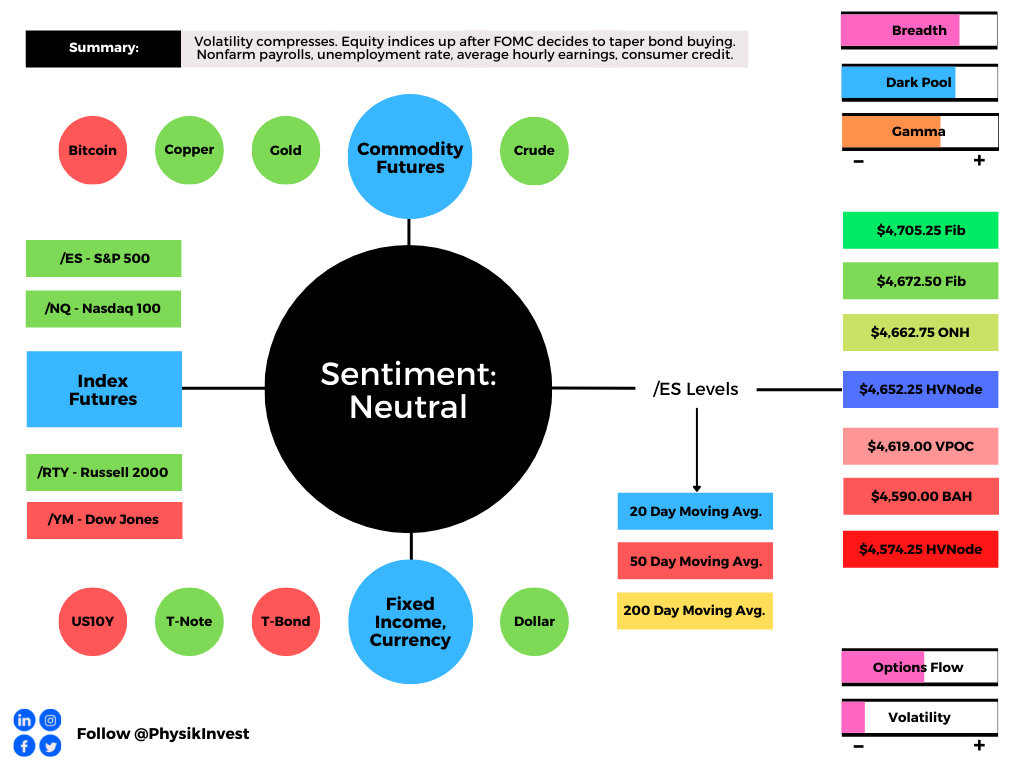
Overnight, equity index futures auctioned sideways to higher alongside the Federal Open Market Committee’s decision to taper bond buying and hold rate hikes.
Ahead is data on nonfarm payrolls, unemployment rate, and average hourly earnings (8:30 AM ET), as well as consumer credit (3:00 PM ET).
Graphic updated 6:30 AM ET. Sentiment Neutral if expected /ES open is inside of the prior day’s range. /ES levels are derived from the profile graphic at the bottom of the following section. Levels may have changed since initially quoted; click here for the latest levels. SqueezeMetrics Dark Pool Index (DIX) and Gamma (GEX) calculations are based on where the prior day’s reading falls with respect to the MAX and MIN of all occurrences available. A higher DIX is bullish. At the same time, the lower the GEX, the more (expected) volatility. Learn the implications of volatility, direction, and moneyness. SHIFT data used for S&P 500 (INDEX: SPX) options activity. Note that options flow is sorted by the call premium spent; if more positive then more was spent on call options. Breadth reflects a reading of the prior day’s NYSE Advance/Decline indicator. VIX reflects a current reading of the CBOE Volatility Index (INDEX: VIX) from 0-100.
What To Expect
Action: On supportive intraday breadth and market liquidity metrics, the best case outcome occurred, evidenced by a spike away from an area of balanced, sideways trade in S&P 500 (INDEX: SPX) (ETF: SPY) (FUTURE: /ES).
Intent: As also evidenced by the separation of value (i.e., the area where 70% of the day’s trade occurred), the spike marks a potential willingness to continue the trend.
Validation: Continued sideways to higher trade, above the $4,627.00 level (a prior all-time high), validates the market’s prevailing intent to markup in the face of new information.
Consideration: Poor structure left behind prior initiative trade (as evidenced by the presence of numerous gaps and p-shaped emotional, multiple-distribution profile structures which denote short-covering and a lack of material, new-money buying) adds to technical instability.
This is a remark, which has been made in the last several commentaries, remains valid; post-FOMC, should the market crack, participants will likely look to check old value (i.e., revisit, repair, and strengthen) these pockets of low-volume, feverishly.
Graphic: Supportive delta (i.e., committed buying as measured by volume delta or buying and selling power as calculated by the difference in volume traded at the bid and offer) in SPDR S&P 500 ETF Trust (NYSE: SPY), one of the largest ETFs that track the S&P 500 index, via Bookmap. The readings are supportive of initiative trade (i.e., directional trade that suggests old prices were not favorable to entry and exit; the market is not in balance).
Context: The aforementioned trade is happening in the context of the FOMC’s decision to taper bond purchases and not raise interest rates.
The implications of this are, as evidenced by a near-vertical price rise, seen as positive.
To elaborate, Bloomberg’s John Authers writes: “In 2013, the bond market threw a tantrum at the mere mention of a taper. Real financial conditions had sharply tightened before the Fed could eventually start withdrawing stimulus. This time, real yields are no higher than they were on New Year’s Day. People are still prepared to lend money to the government on the assumption that they will get a return a full percentage point below the inflation rate.”
On the topic of interest rates, “the Fed will warn us in advance – which in effect means that a rate rise should be penciled in for next July’s meeting, or June at the earliest.”
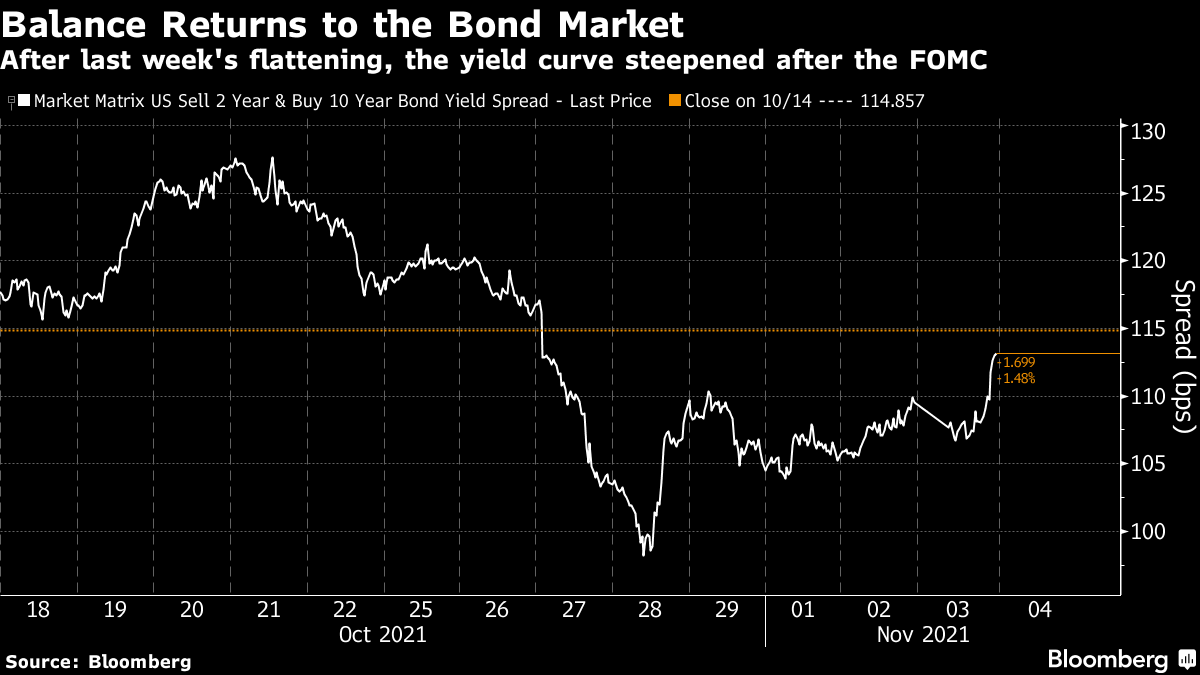
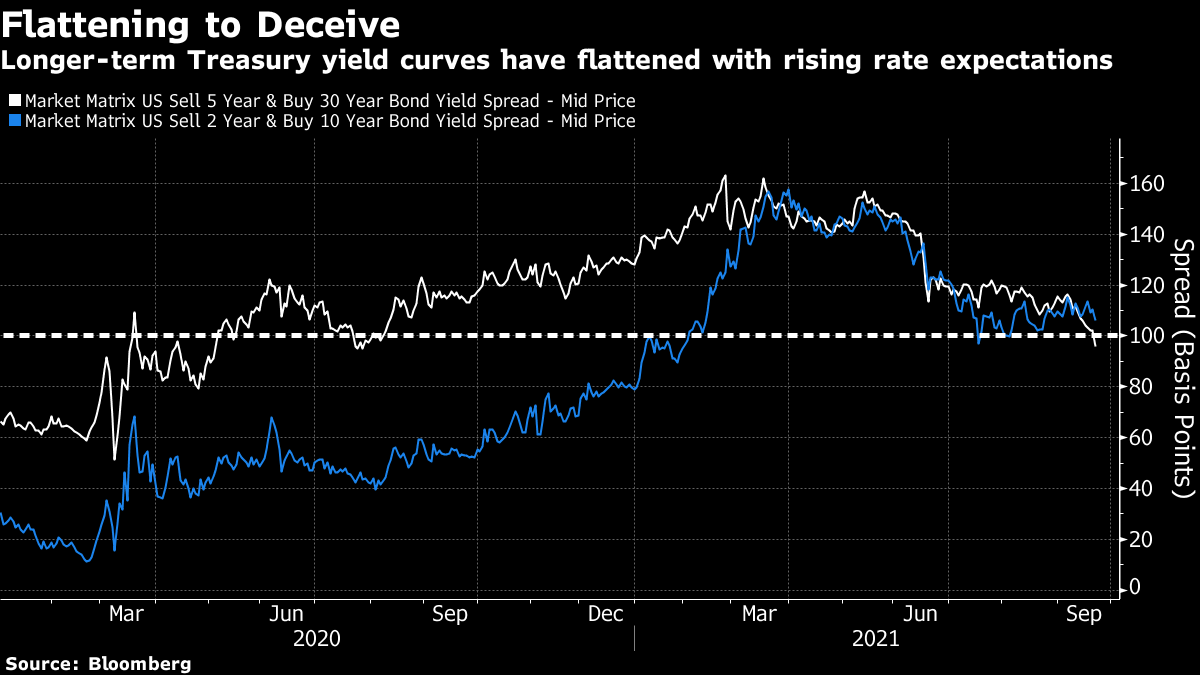
Graphic: Per Bloomberg, “Last week saw a dramatic flattening, in an implicit bet that the Fed was going to hike rates in the near term, and choke off growth in the longer term. The curve had already started to steepen by the end of last week, and it regained more ground after the Federal Open Market Committee and Jerome Powell’s press conference.”
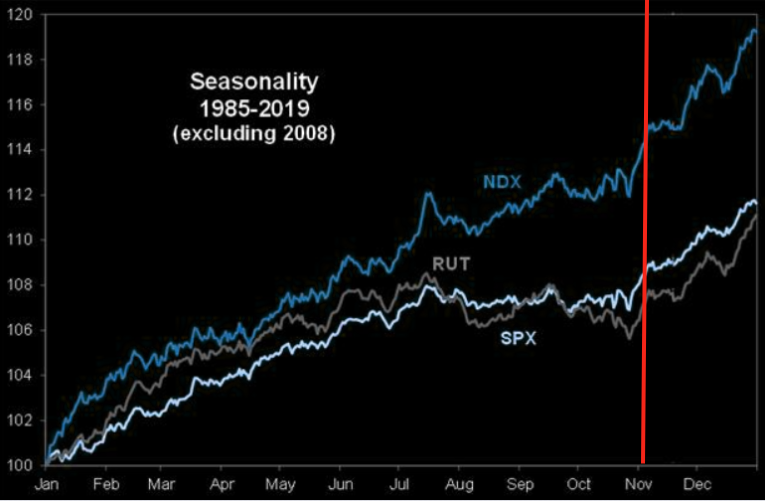
In terms of positioning, the CBOE Volatility Index (INDEX: VIX) was lower, while the VIX futures term structure came in a bit. To put it simply, participants were assuaged of their fears; the post-FOMC compression in volatility plays into an end-of-year, seasonally-aligned, rally supported by the flows typically associated with decaying, options hedges, according to SpotGamma.
Graphic: Goldman Sachs Group (NYSE: GS) charts S&P 500 seasonality. Taken from The Market Ear.
Expectations: As of 6:30 AM ET, Thursday’s regular session (9:30 AM – 4:00 PM ET), in the S&P 500, will likely open near the middle part of a positively skewed overnight inventory, just outside of prior-range and -value, suggesting a potential for directional opportunity.
Spike Scenarios Apply: Spikes mark the beginning of a break from value. Spikes higher (lower) are validated by trade at or above (below) the spike base (i.e., the origin of the spike). The spike reference to go by is $4,627.00, a prior all-time high.
In the best case, the S&P 500 trades sideways or higher; activity above the $4,652.25 high volume area (HVNode) puts in play the $4,662.75 overnight high (ONH). Initiative trade beyond the ONH could reach as high as the $4,672.50 and $4,705.25 Fibonacci, or higher.
In the worst case, the S&P 500 trades lower; activity below the $4,652.25 HVNode puts in play the $4,619.00 untested point of control (VPOC). Initiative trade beyond the VPOC could reach as low as the $4,590.00 balance area high (BAH) and $4,574.25 HVNode, or lower.
Click here to load today’s updated key levels into the web-based TradingView charting platform. Note that all levels are derived using the 65-minute timeframe. New links are produced, daily.
Graphic: 65-minute profile chart of the Micro E-mini S&P 500 Futures. Learn about the profile.
So this is a fascinating thesis that I think a lot of people are dismissing out of hand just because it seems too extreme.
But let's unpack for a sec here what @SqueezeMetrics (who, worryingly, has a tendency to be right) is saying & attach it to some observed phenomena. 1/ https://t.co/Z7p4dQY1H8
Overnight Rally Highs (Lows): Typically, there is a low historical probability associated with overnight rally-highs (lows) ending the upside (downside) discovery process.
Volume Areas: A structurally sound market will build on areas of high volume (HVNodes). Should the market trend for long periods of time, it will lack sound structure, identified as low volume areas (LVNodes). LVNodes denote directional conviction and ought to offer support on any test.
If participants were to auction and find acceptance into areas of prior low volume (LVNodes), then future discovery ought to be volatile and quick as participants look to HVNodes for favorable entry or exit.
POCs: POCs are valuable as they denote areas where two-sided trade was most prevalent in a prior day session. Participants will respond to future tests of value as they offer favorable entry and exit.
Balance (Two-Timeframe Or Bracket): Rotational trade that denotes current prices offer favorable entry and exit. Balance-areas make it easy to spot a change in the market (i.e., the transition from two-time frame trade, or balance, to one-time frame trade, or trend).
Modus operandi is responsive trade (i.e., fade the edges), rather than initiative trade (i.e., play the break).
Value-Area Placement: Perception of value unchanged if value overlapping (i.e., inside day). Perception of value has changed if value not overlapping (i.e., outside day). Delay trade in the former case.
About
After years of self-education, strategy development, and trial-and-error, Renato Leonard Capelj began trading full-time and founded Physik Invest to detail his methods, research, and performance in the markets.
Additionally, Capelj is a Benzinga finance and technology reporter interviewing the likes of Shark Tank’s Kevin O’Leary, JC2 Ventures’ John Chambers, and ARK Invest’s Catherine Wood, as well as a SpotGamma contributor, developing insights around impactful options market dynamics.
Disclaimer
At this time, Physik Invest does not manage outside capital and is not licensed. In no way should the materials herein be construed as advice. Derivatives carry a substantial risk of loss. All content is for informational purposes only.
Editor’s Note: The newsletter schedule has changed.
From now on, you can expect to see Daily Briefsonly – Monday through Friday – posted shortly before 8:00 AM ET. The Weekly Trade Idea will be packaged into Monday’s commentary, also.
Thanks again for your continued support. I strive to simplify and add value, as best I can.
Market Commentary
Equity index futures trade sideways to lower with bonds. Commodities were mixed.
October bottom; a rip up into EOY?
Ahead: No economic reports today.
What Happened: Ahead of a busy start to the third-quarter earnings season, this week, U.S. stock index futures auctioned sideways to lower overnight alongside some mixed narratives.
Last night, it was revealed that Goldman Sachs Group (NYSE: GS) cut its U.S. growth forecast on consumption and a fiscal slowdown. Not even a day later, there is news that Goldman, alongside JPMorgan Chase & Co (NYSE: JPM) strategists, suggests the recent dip is a buy.
Given the Columbus Day holiday, today, no economic reports are scheduled.
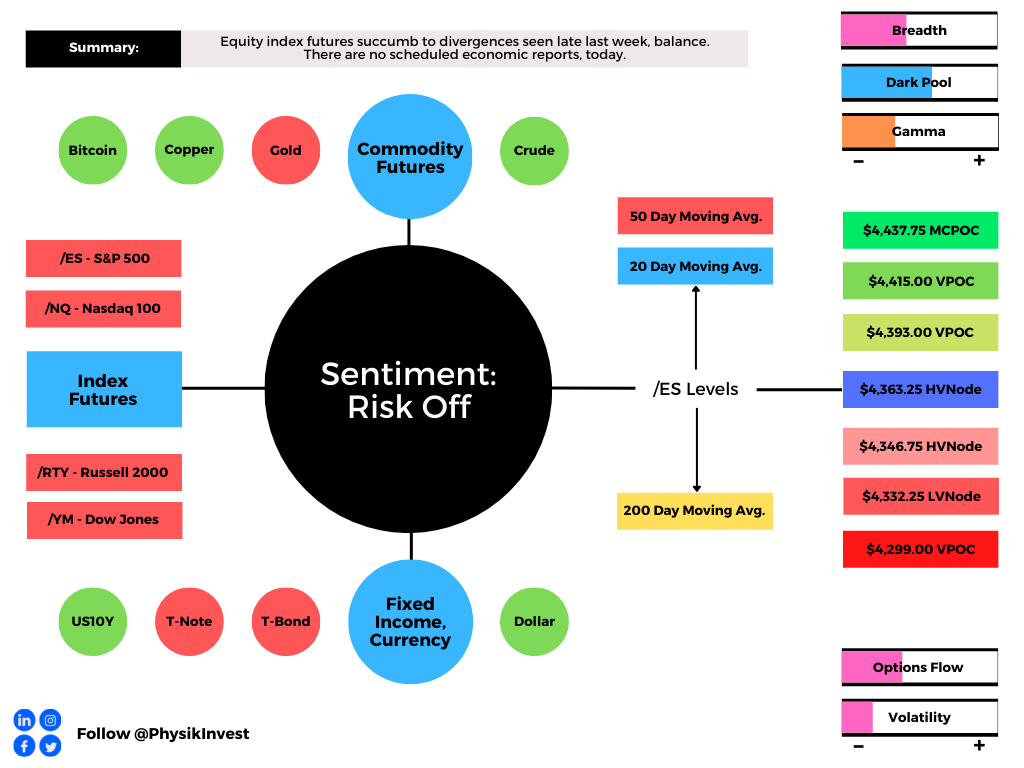
Graphic updated 6:20 AM ET. Sentiment Risk-Off if expected /ES open is below the prior day’s range. /ES levels are derived from the profile graphic at the bottom of the following section. SqueezeMetrics Dark Pool Index (DIX) and Gamma (GEX) calculations are based on where the prior day’s reading falls with respect to the MAX and MIN of all occurrences available. A higher DIX is bullish. At the same time, the lower the GEX, the more (expected) volatility. SHIFT data used for S&P 500 (INDEX: SPX) options activity. Note that options flow is sorted by the call premium spent; if more positive then more was spent on call options. Breadth reflects a reading of the prior day’s NYSE Advance/Decline indicator. VIX reflects a current reading of the CBOE Volatility Index (INDEX: VIX) from 0-100.
What To Expect: As of 6:20 AM ET, Monday’s regular session (9:30 AM – 4:00 PM EST) in the S&P 500 will likely open outside of prior-range and -value, suggesting a potential for immediate directional opportunity.
Gap Scenarios: Gaps ought to fill quickly. Should they not, that’s a signal of strength; do not fade. Leaving value behind on a gap-fill or failing to fill a gap (i.e., remaining outside of the prior session’s range) is a go-with indicator.

Auctioning and spending at least 1-hour of trade back in the prior range suggests a lack of conviction; in such a case, do not follow the direction of the most recent initiative activity.
Further, during the prior week’s trade, on mostly strong intraday breadth and divergent market liquidity metrics, equity index futures established a rounded bottom and minimal excess low.
Then, a swift recovery ensued; initiative sellers lacked the wherewithal to take prices lower, beyond the S&P 500’s $4,363.25-$4,278.00 balance area. Initiative buyers were then emboldened, expanding range and value the opposite way.
During this recovery process, the S&P 500 – as evidenced by p-shaped emotional, multiple-distribution profile structures – established a minimal excess high before momentum from covering shorts was overpowered by responsive selling at key areas of resting liquidity, at and around /ES $4,410.25 (SPY $441.00), the site of a key anchored volume-weighted average price (VWAP) level.
Note: Liquidity algorithms are benchmarked and programmed to buy and sell around VWAPs.
Friday’s session succumbed to divergences in buying and selling power as calculated by the difference in volume traded at the bid and offer, resolving some of the aforementioned emotional structures through what’s called the “cave-fill” process.
During this process, participants revisited, repaired, and strengthened – building out areas of high volume (HVNodes), or value – areas low volume (LVNodes).
Note: The cave-fill process widened the area deemed favorable to transact at by an increased share of participants. This is a good development.
Moreover, September’s seasonally-aligned weakness saw the Nasdaq 100 lead lower. Last week – alongside improvement amongst some positioning metrics – the tone shifted with the cash-settled Nasdaq 100 (INDEX: NDX) rising 4.35% versus the S&P 500 (INDEX: SPX) rising 3.25%.
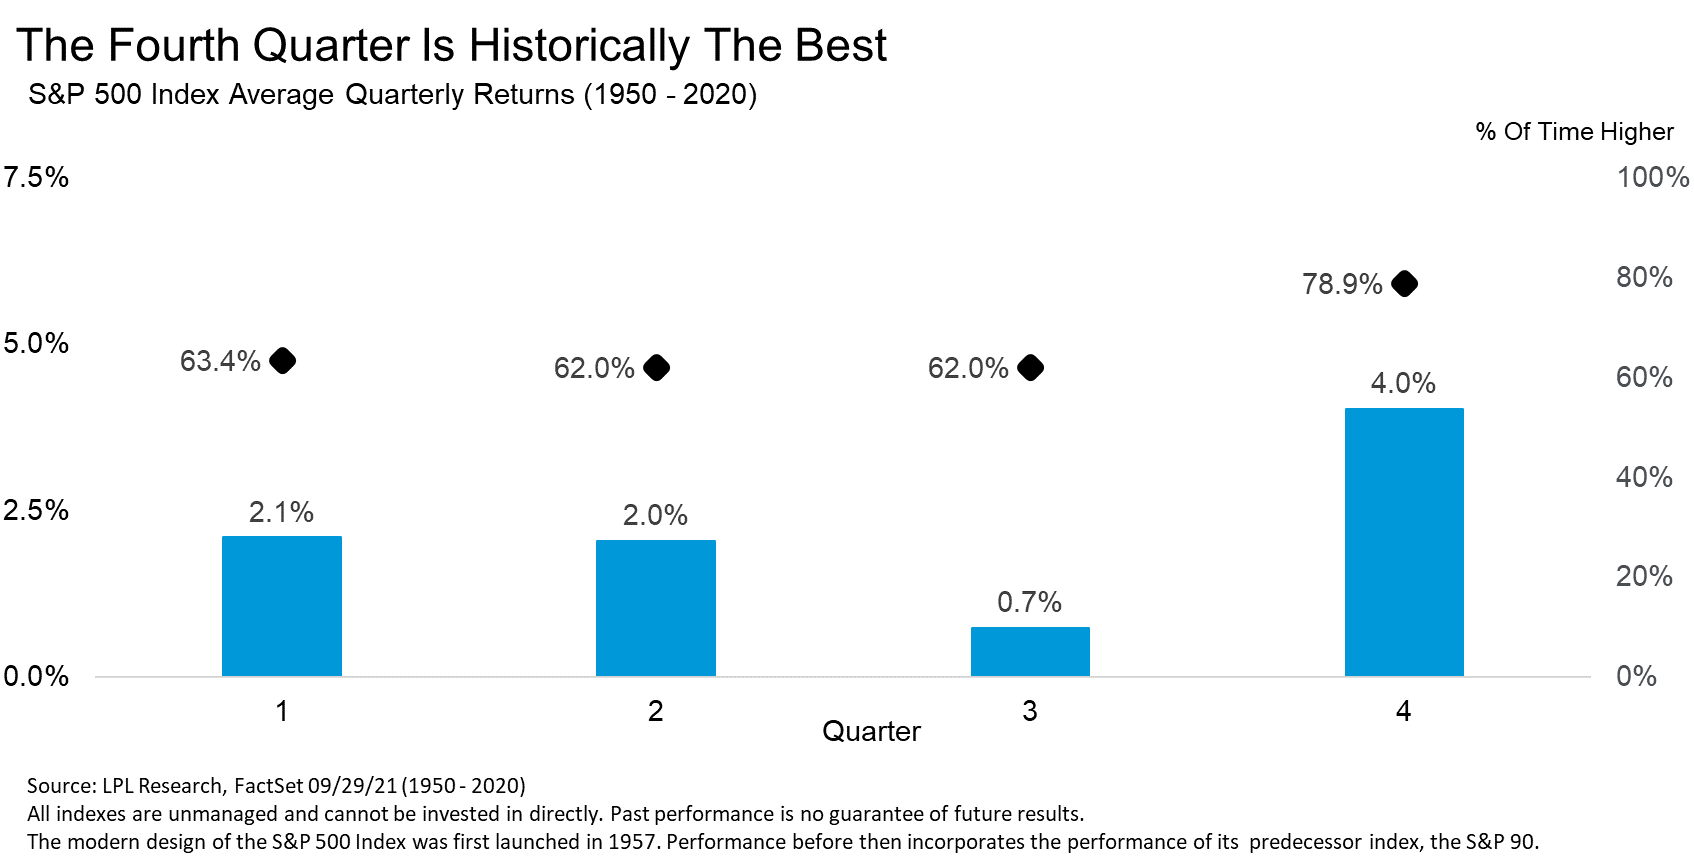
That comes as October traditionally marks an end to weakness amidst a cycle of rebalancing and earnings; according to LPL Financial Research, “Stocks rise 3.8% on average during the fourth quarter, but the past seven times the S&P 500 was up 15% year-to-date heading into the home stretch of the year, the fourth quarter was higher every single time, up a very impressive 5.8%.”
“Earnings for the third quarter should again be strong and mostly outpace expectations,” Leuthold Group chief investment strategist Jim Paulsen adds. “Hours worked in the third quarter rose by about 5% suggesting real GDP for the quarter may be close to 7%. With most companies reporting strong pricing power, solid real GDP growth should result in another surprisingly strong corporate earnings season.”
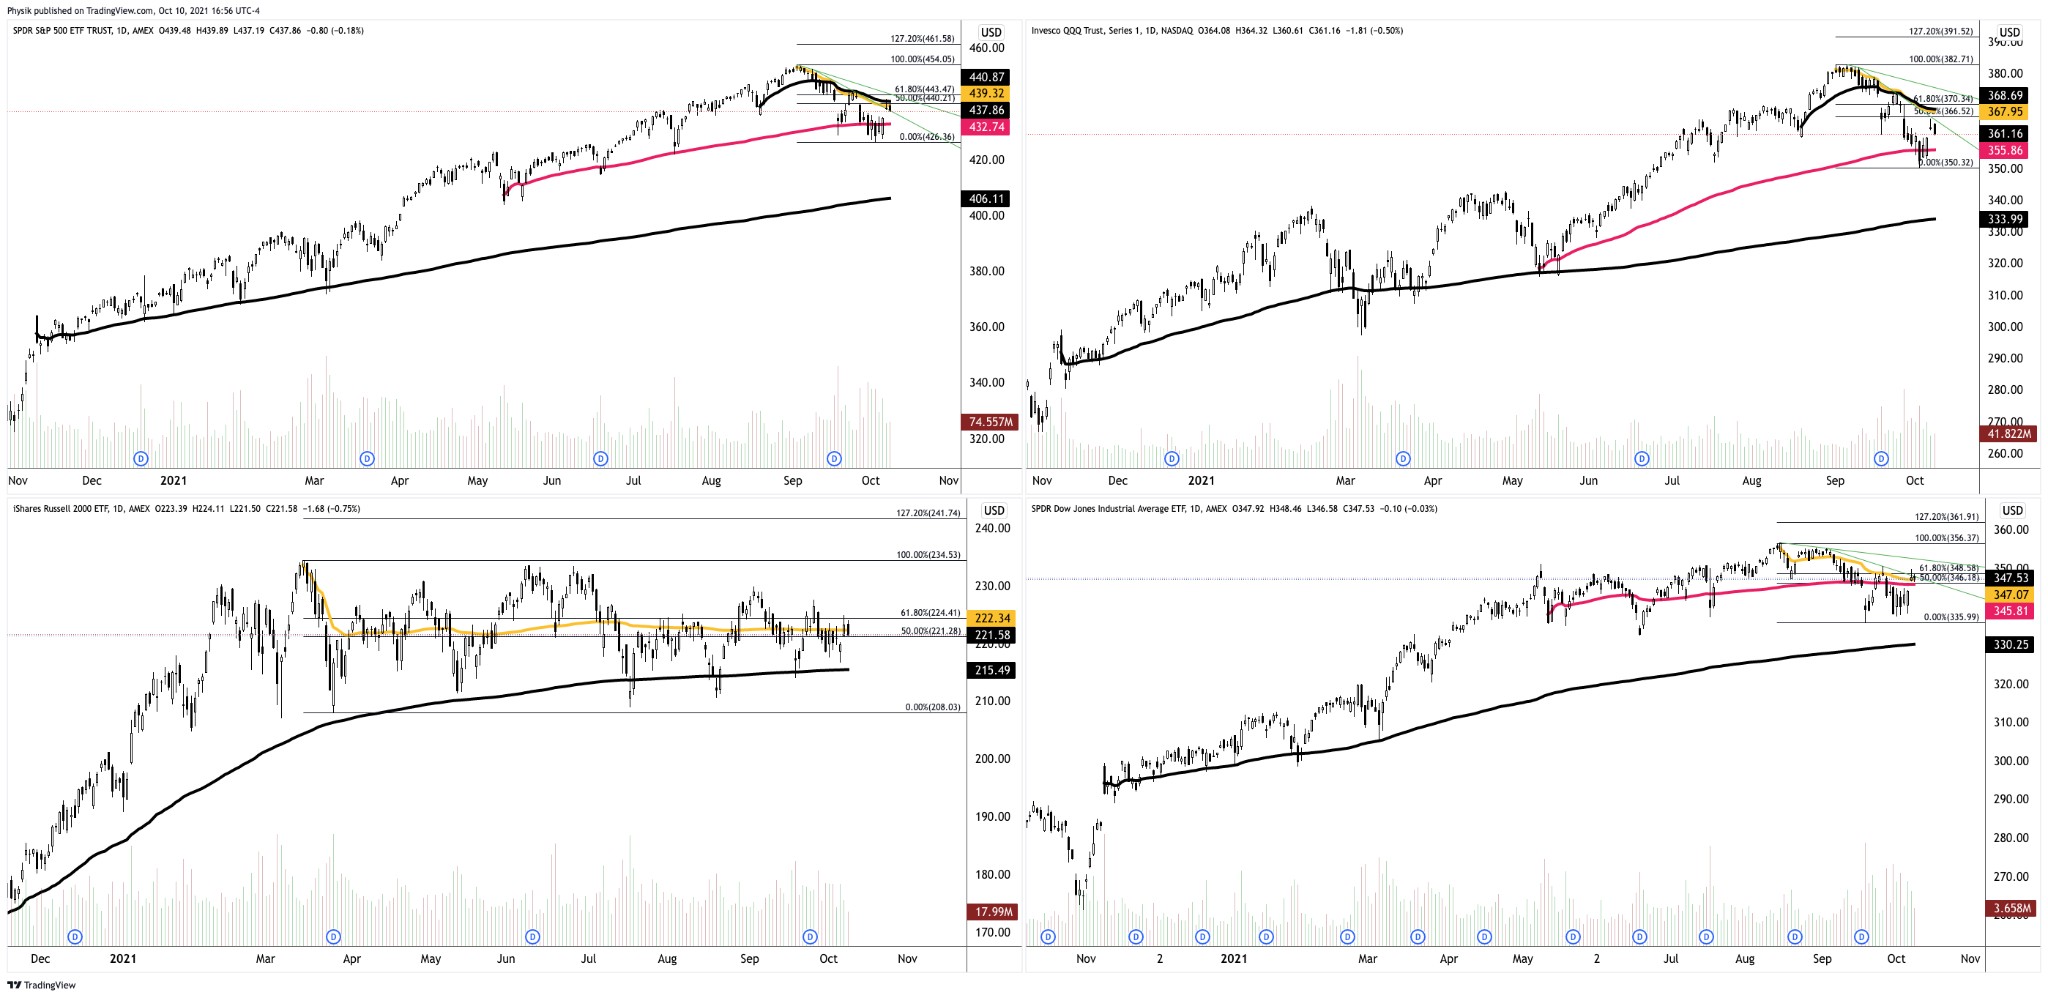
Graphic: LPL Financial Research unpacks S&P 500 seasonality.Graphic: SPDR S&P 500 ETF (NYSE: SPY) top left, Invesco QQQ Trust Series 1 (NASDAQ: QQQ) top right, iShares Russell 2000 ETF (NYSE: IWM) bottom left, SPDR Dow Jones Industrial Average ETF Trust (NYSE: DIA) bottom right. Spending more than a few hours of trade above trend, VWAP (yellow), and the 61.80% Fibonacci retracement suggest good odds of upside continuation.
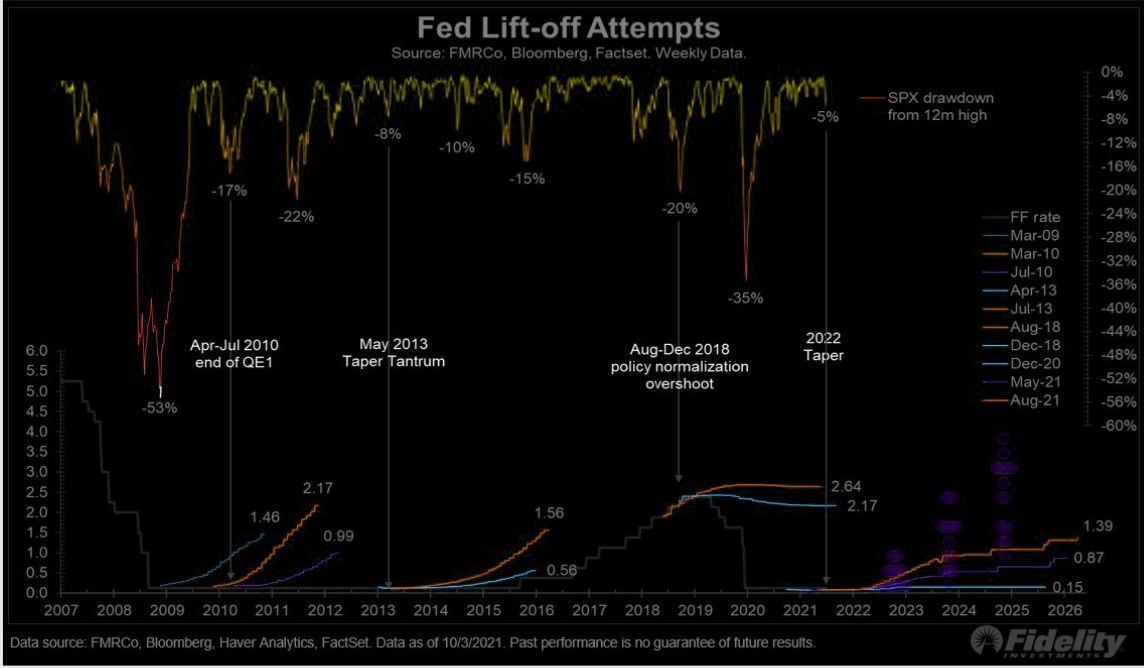
Notwithstanding, some risks to be aware of include the Federal Reserve’s tapering initiatives and the prospects of a rise in the Fed funds rate, amidst hot sentiment, a decline in top-of-book depth, as well as back and forth entry (exit) into (from) short-gamma.
“What we see in the equity space is a lot of sensitivity to higher real yields,” Joseph Little, chief global strategist at HSBC Holdings Plc (NYSE: HSBC) Asset Management, said. “We are seeing policy normalization everywhere. That creates a little bit of a challenge for [the] equity market because it does change the drivers of equity performance.”
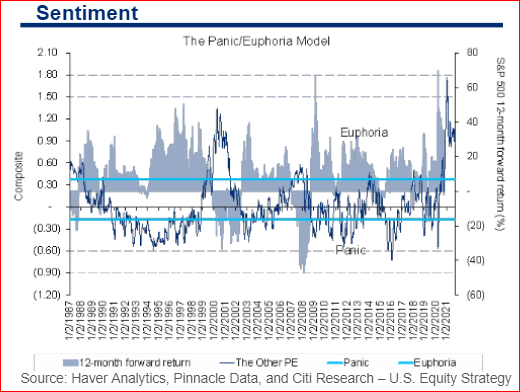
Graphic: A “gentle reminder of the fact tapering matters,” via The Market Ear.Graphic: Sentiment elevated, “generating a 96% historical probability of down markets in the next 12 months at current levels.”
In addition, to balance some of our Q4 bullishness, in a quote highlighted by The Market Ear, Bank of America Corporation (NYSE: BAC) explained: September 30 “was the 24th time since 1928 that the S&P experienced two or more 3-sigma shocks in 10 trading days, … [and] only in 3 of 23 episodes (and 1 in the last 50yrs) did the S&P surpass the prior month’s peak in the month following the second shock.”
Moreover, for today, participants may make use of the following frameworks.
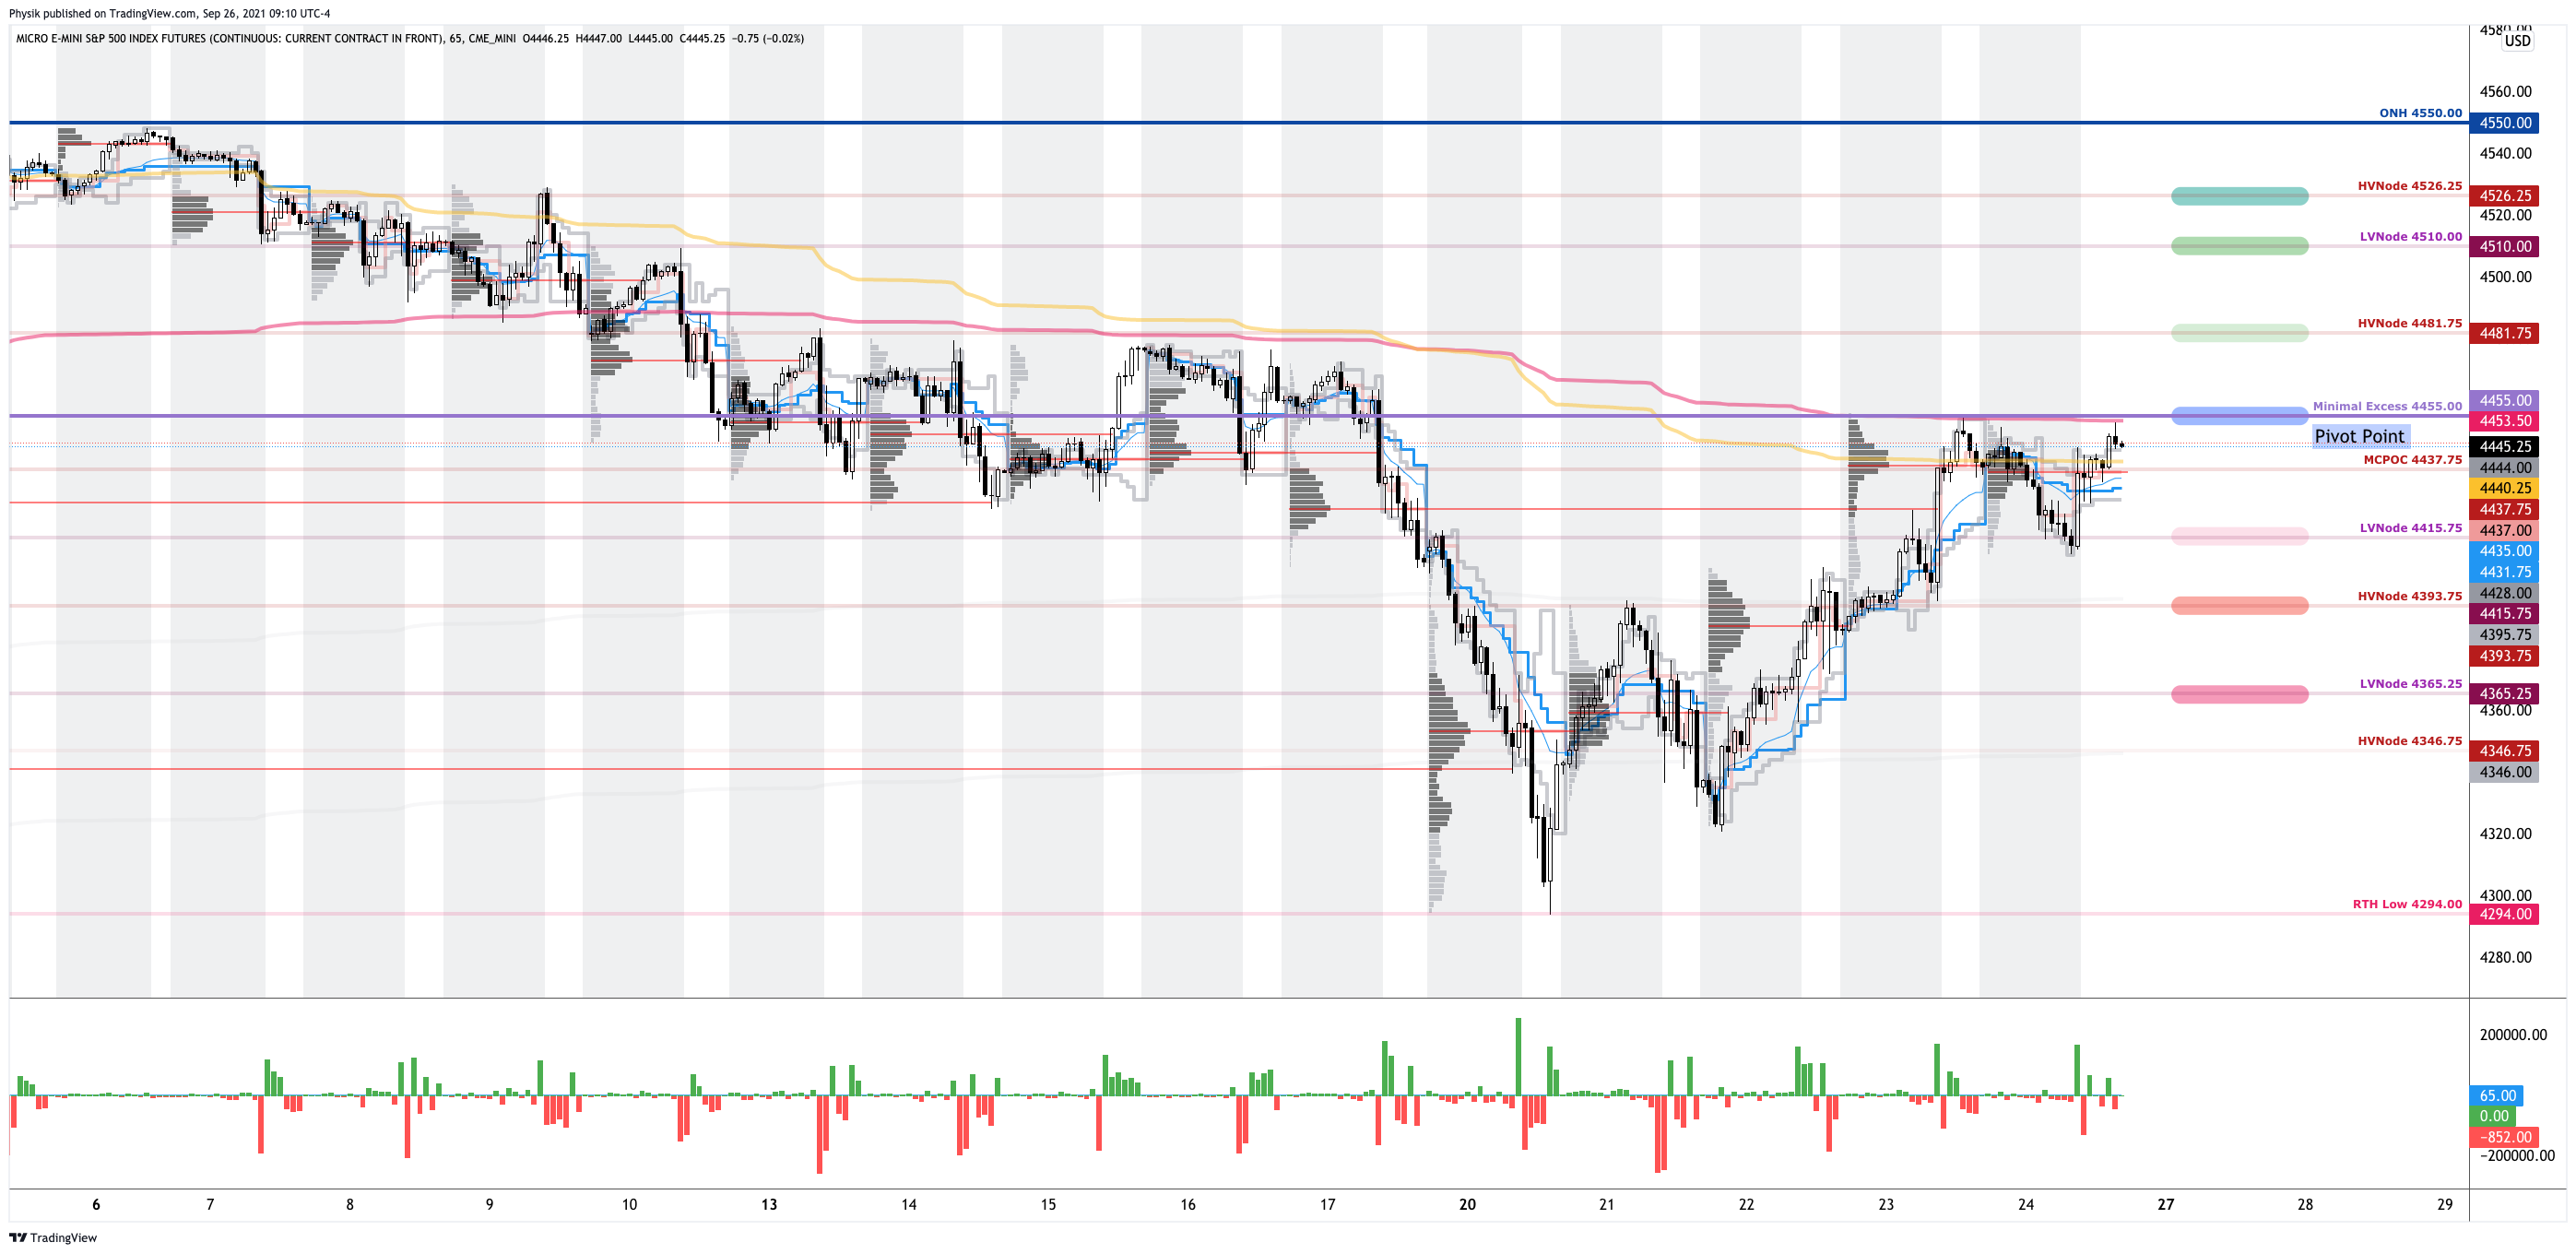
In the best case, the S&P 500 trades sideways or higher; activity above the $4,363.25 high volume area (HVNode) puts in play the $4,393.00 untested point of control (VPOC). Initiative trade beyond the $4,393.00 VPOC could reach as high as the $4,415.00 VPOC and $4,437.75 micro composite point of control (MCPOC), or higher.
In the worst case, the S&P 500 trades lower; activity below the $4,363.25 HVNode puts in play the $4,346.75 HVNode. Initiative trade beyond the HVNode could reach as low as the $4,332.25 low volume area (LVNode) and $4,299.00 VPOC, or lower.
Graphic: 65-minute profile chart of the Micro E-mini S&P 500 Futures updated 6:20 AM ET.
Definitions
Volume Areas: A structurally sound market will build on areas of high volume (HVNodes). Should the market trend for long periods of time, it will lack sound structure, identified as low volume areas (LVNodes). LVNodes denote directional conviction and ought to offer support on any test.
If participants were to auction and find acceptance into areas of prior low volume (LVNodes), then future discovery ought to be volatile and quick as participants look to HVNodes for favorable entry or exit.
Gamma: Gamma is the sensitivity of an option to changes in the underlying price. Dealers that take the other side of options trades hedge their exposure to risk by buying and selling the underlying. When dealers are short-gamma, they hedge by buying into strength and selling into weakness. When dealers are long-gamma, they hedge by selling into strength and buying into weakness. The former exacerbates volatility. The latter calms volatility.
POCs: POCs are valuable as they denote areas where two-sided trade was most prevalent in a prior day session. Participants will respond to future tests of value as they offer favorable entry and exit.
MCPOCs: POCs are valuable as they denote areas where two-sided trade was most prevalent over numerous day sessions. Participants will respond to future tests of value as they offer favorable entry and exit.
Excess: A proper end to price discovery; the market travels too far while advertising prices. Responsive, other-timeframe (OTF) participants aggressively enter the market, leaving tails or gaps which denote unfair prices.
Value-Area Placement: Perception of value unchanged if value overlapping (i.e., inside day). Perception of value has changed if value not overlapping (i.e., outside day). Delay trade in the former case.
News And Analysis
Banks bought epic amounts of safe assets; forget inflation.
The Fed is likely to side with growth and keep policy easy.
Merck seeks emergency use authorization for COVID pills.
Europe Economic Snapshot: Faster-than-expected restart.
Latin America settles into new post-pandemic slow growth.
S&P talking stock-flow confusion again – QE and tapering.
What People Are Saying
2 Index Options takeaways from last week: > Calls were sold to open > Long puts were closed, and there was a bit of put shorting but not material
Specifically these charts show: Top Chart: Index options bought to open – sold to open Bottom: Index bought to open – sold to close pic.twitter.com/Hxqayqp2Y2
Before $BTC moves to new all-time high, I would like to volatility to drop even further. Maybe a few more back and forth below 65.6K. pic.twitter.com/aJTw4D2yKP
W/payrolls crapping out past two months, the Fed WILL taper anyway. They've backed themselves into a narrow corner where if they don't they think it will be harmful to acknowledge weakness.
After years of self-education, strategy development, and trial-and-error, Renato Leonard Capelj began trading full-time and founded Physik Invest to detail his methods, research, and performance in the markets.
Additionally, Capelj is a finance and technology reporter. Some of his biggest works include interviews with leaders such as John Chambers, founder and CEO, JC2 Ventures, Kevin O’Leary, businessman and Shark Tank host, Catherine Wood, CEO and CIO, ARK Invest, among others.
Disclaimer
At this time, Physik Invest does not manage outside capital and is not licensed. In no way should the materials herein be construed as advice. Derivatives carry a substantial risk of loss. All content is for informational purposes only.
Editor’s Note: Market commentaries to pause until Monday, October 4, 2021, due to travel commitments. As a result, I go in-depth today and offer a strong trade idea for the week ahead.
Also, if you’re in a rush, focus on the bolded text!
Market Commentary
Equity index futures recover. Yields break higher. Volatility implodes.
Indices have recovered 60% of sell-off.
Buying-the-dip psychology is breaking.
Watching: Taper, shutdown, debt risks.
Fed may stamp out life in the economy.
Trade Idea: Capitalizing on TSLA skew.
What Happened: After a series of outlier moves, U.S. stock index futures ended the week range-bound when responsive sellers – as confirmed by measures of market liquidity – stepped in at key moving averages and anchored volume-weighted average price levels.
Ahead is a busy week in terms of economic releases; important data on durable goods orders, consumer confidence, home sales, personal income and spending, PCE deflators, as well as manufacturing data are slated to come out.
Graphic updated 9:00 AM ET Sunday. Sentiment Neutral if expected /ES open is inside of the prior day’s range. /ES levels are derived from the profile graphic at the bottom of the following section. SqueezeMetrics Dark Pool Index (DIX) and Gamma (GEX) calculations are based on where the prior day’s reading falls with respect to the MAX and MIN of all occurrences available. A higher DIX is bullish. At the same time, the lower the GEX, the more (expected) volatility. SHIFT data used for S&P 500 (INDEX: SPX) options activity. Note that options flow is sorted by the call premium spent; if more positive then more was spent on call options. Breadth reflects a reading of the prior day’s NYSE Advance/Decline indicator. VIX reflects a current reading of the CBOE Volatility Index (INDEX: VIX) from 0-100.
What To Expect: Be patient with me, there is a lot to condense.
During the prior week’s trade, on mostly strong intraday breadth and divergent market liquidity metrics, equity index futures briefly liquidated; the S&P 500 went as low as $4,300.00.
Then, a swift recovery ensued; participants took back nearly 60% of the most recent sell-off.
During the recovery process, the S&P 500 – as evidenced by emotional, multiple distribution profile structures – established a minimal excess rally high at $4,455.00 before the momentum from covering shorts was overpowered by responsive selling at key areas of resting liquidity, at and around $4,455.00, or so.
Friday’s session, however, resolved some of the aforementioned emotional structures through what’s called the “cave-fill” process; revisiting, repairing, and strengthening – building out areas of high volume (HVNodes), or value – areas low volume (LVNodes).
To put it simply, the cave-fill process widened the area deemed favorable to transact at by an increased share of participants. This is a good development.
Graphic: Divergent delta (i.e., non-committed buying as measured by volume delta or buying and selling power as calculated by the difference in volume traded at the bid and offer) in SPDR S&P 500 ETF Trust (NYSE: SPY), one of the largest ETFs that track the S&P 500 index, via Bookmap. The readings are supportive of responsive trade or balance (i.e., rotational trade that suggests current prices offer favorable entry and exit).
Further, the aforementioned trade is happening in the context of narratives surrounding a taper to Federal Reserve asset purchases, a government shutdown, and the debt ceiling.
The implications of these themes on price are contradictory; to elaborate, in the most recent meeting of the Federal Open Market Committee (FOMC), it was announced that the economy made substantial progress toward the central bank’s goals and, if progress continued as expected, a moderation in the pace of asset purchases was likely.
“Powell said that the tapering process could be wrapped up by mid-2022, which would require either an earlier start or larger reductions,” Moody’s said.
“In other words, as long as September employment isn’t a disaster, the Fed will begin tapering at its November meeting. Therefore, it would skip a formal announcement and a one-meeting delay to dive right into the tapering process. It seems we’re headed for an eight-month taper, or [a] $15 billion reduction per month.”
The Fed’s dot plot saw movement, too; there are increased odds of a rate hike in 2022.
In regards to the debt ceiling, which caused a kink in the Treasury bill curve and may portend financial market volatility if not resolved, Powell voiced concern, noting that it must be raised.
This is a likely development given that “lawmakers know that voting against raising the debt ceiling would have enormous economic costs,” Moody’s noted.
Graphic: “The spread between 5- and 30-year yields dropped below 100 basis points after the FOMC meeting, for the first time since just before last year’s Jackson Hole’s conference. Such a flat curve … signal[s] that the bond market thinks the Fed is going to make a hawkish mistake, and stamp out the life in the economy when previously there had been a belief that the Fed would be easy and let inflation move higher.” The source is Bloomberg.
Adding, after the September 17 options expiry which cut S&P 500 dealer gamma in half and opened the window to volatility, alongside threats posed by China’s Evergrande complications, the tone changed markedly, given a fraying in the buy-the-dip psychology.
While strategists at JPMorgan Chase & Co (NYSE: JPM) suggest the selling was knee-jerk and technical, the truth is that, according to Reuters, “global stock funds lost the most since March 2020 as investors moved in [favor] of cash where they [plowed] in $39.6 billion of funds.”
Still, in the face of comments by the Fed, as well as the Evergrande and debt ceiling debacle, the liquidation resolved some fragility with respect to positioning and stocks rallied, affirming the beliefs held by Goldman Sachs Group Inc’s (NYSE: GS) Peter Oppenheimer and HSBC Holdings Plc (NYSE: HSBC) strategists that dip-buying is a go as “we’re still in the relatively early stages of this economic cycle.”
To put it differently, per one Bloomberg article, “the lasting impression … is that for markets the tapir no longer has the power to induce fear in the way that it did eight years ago, … [and] [t]he post-Evergrande bounce has some life in it. It’s no dead cat.” A 4,700 or 5,000 S&P 500, as some strategists see it, could be in the cards.
Moreover, for next week, participants may make use of the following frameworks.
In the best case, the S&P 500 trades sideways or higher; activity above the $4,455.00 minimal excess high puts in play the $4,481.75 HVNode. Initiative trade beyond the HVNode could reach as high as the $4,510.00 LVNode and $4,526.25 HVNode, or higher.
In the worst case, the S&P 500 trades lower; activity below the $4,455.00 minimal excess high puts in play the $4,415.75 LVNode. Initiative trade beyond the LVNode could reach as low as the $4,393.75 HVNode and $4,365.25 LVNode, or lower.
Graphic: 65-minute profile chart of the Micro E-mini S&P 500 Futures updated 9:00 AM ET Sunday.
Definitions
Volume Areas: A structurally sound market will build on areas of high volume (HVNodes). Should the market trend for long periods of time, it will lack sound structure, identified as low volume areas (LVNodes). LVNodes denote directional conviction and ought to offer support on any test.

If participants were to auction and find acceptance into areas of prior low volume (LVNodes), then future discovery ought to be volatile and quick as participants look to HVNodes for favorable entry or exit.

Gamma: Gamma is the sensitivity of an option to changes in the underlying price.

Dealers that take the other side of options trades hedge their exposure to risk by buying and selling the underlying.

When dealers are short-gamma, they hedge by buying into strength and selling into weakness. When dealers are long-gamma, they hedge by selling into strength and buying into weakness.

The former exacerbates volatility. The latter calms volatility.

Options Expiration (OPEX): Option expiries mark an end to pinning (i.e, the theory that market makers and institutions short options move stocks to the point where the greatest dollar value of contracts will expire worthless) and the reduction dealer gamma exposure.

Excess: A proper end to price discovery; the market travels too far while advertising prices. Responsive, other-timeframe (OTF) participants aggressively enter the market, leaving tails or gaps which denote unfair prices.

More On Volume-Weighted Average Prices (VWAPs): A metric highly regarded by chief investment officers, among other participants, for quality of trade. Additionally, liquidity algorithms are benchmarked and programmed to buy and sell around VWAPs.

Rates: Low rates have to potential to increase the present value of future earnings making stocks, especially those that are high growth, more attractive.

To note, inflation and rates move inversely to each other.

Low rates stimulate demand for loans (i.e., borrowing money is more attractive). In conjunction with the rapid recovery, lower rates solicit hawkish commentary as policymakers look to inhibit inflation.
Weekly Trade Idea
News And Analysis
Weakening U.S. economy threatens swelling corporate debt mountain.
Ongoing debt limit fight is as much about 2022 politics as fiscal policy.
Alhambra Investments: Next steps to watch for a scarcity of collateral.
From New York To Sydney: See the supply shocks spanning the globe.
Economic Outlooks U.S. Q4 2021: The rocket is beginning to level off.
Nancy Pelosi: The infrastructure plan will likely pass House this week.
Treasuries at risk as Federal Reserve paves way for breakout in yields.
The SEC’s Gary Gensler doesn’t see cryptocurrencies lasting that long.
Bear market is unlikely, but stumble in stocks may lead to a bigger fall.
— Renato Leonard Capelj (@renatolcapelj) July 26, 2021
Let’s Hang Out
Salt Lake City, UT September 28-30
Las Vegas, NV October 1-3
About
After years of self-education, strategy development, and trial-and-error, Renato Leonard Capelj began trading full-time and founded Physik Invest to detail his methods, research, and performance in the markets.
Additionally, Capelj is a finance and technology reporter. Some of his biggest works include interviews with leaders such as John Chambers, founder and CEO, JC2 Ventures, Kevin O’Leary, businessman and Shark Tank host, Catherine Wood, CEO and CIO, ARK Invest, among others.
Disclaimer
At this time, Physik Invest does not manage outside capital and is not licensed. In no way should the materials herein be construed as advice. Derivatives carry a substantial risk of loss. All content is for informational purposes only.