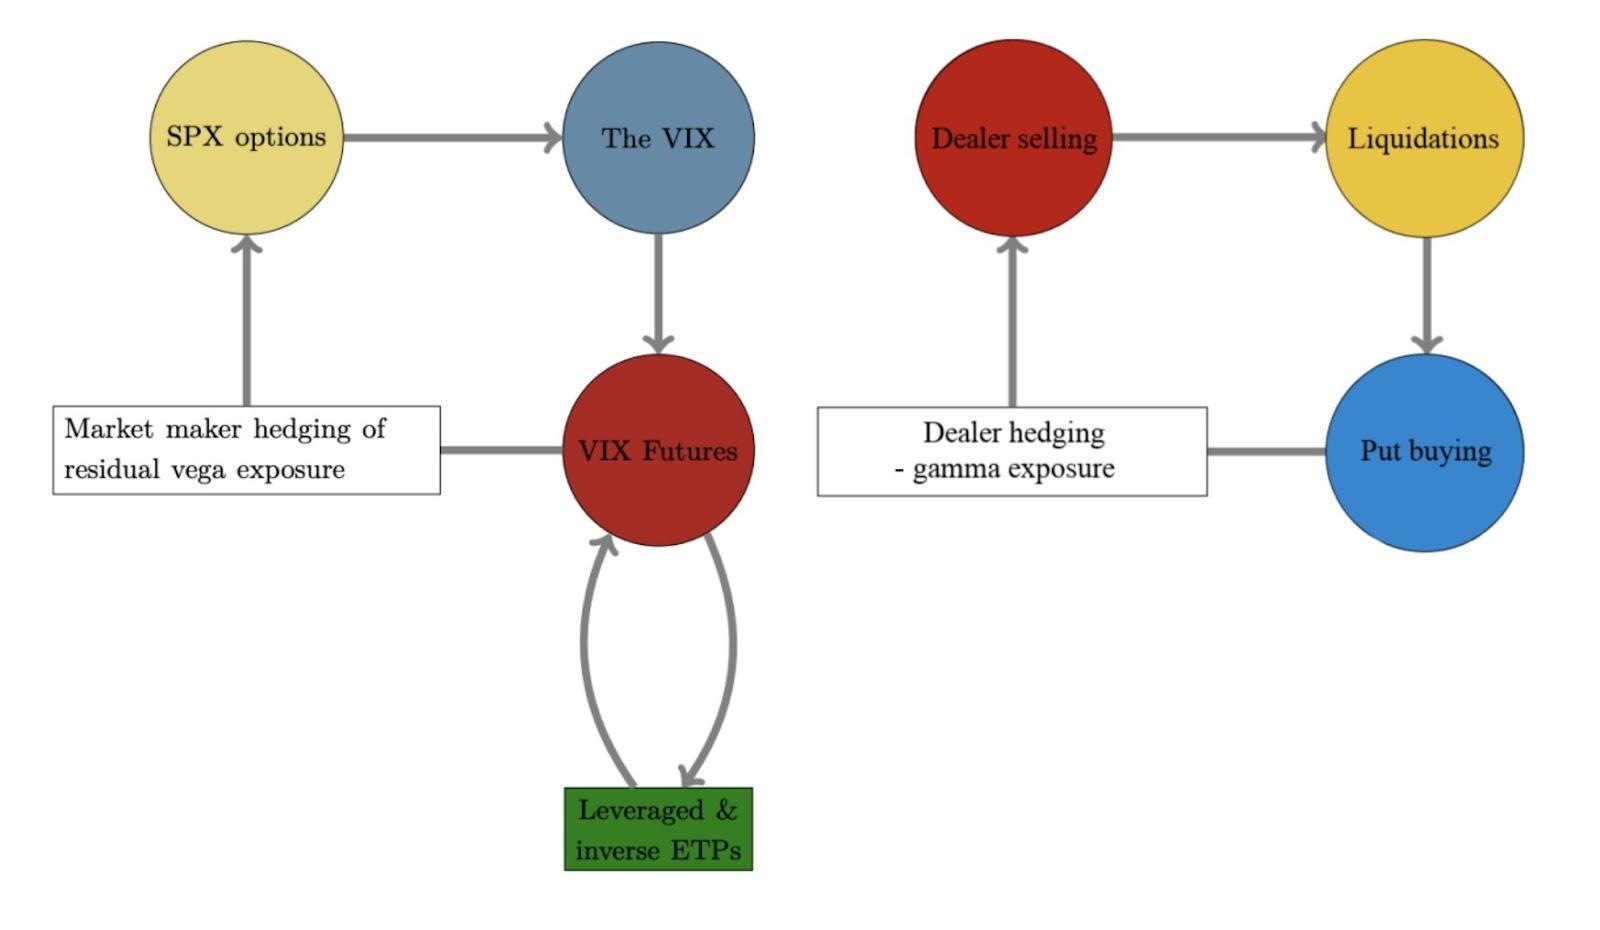
Categories
Commentary

Daily Brief For January 27, 2022

Editor’s Note: Our newsletter service provider is not working, today. Our apologies if you were not able to receive the note via email, as usual.

What Happened

Overnight, equity index futures explored lower before later recovering the prior day’s weak close after hawkish statements from the Federal Reserve (Fed). 

This is as some metrics continue to show buying support and any compression in volatility may serve to bolster a move higher.

Ahead is data on jobless claims, gross domestic product, durable goods orders, and core capital equipment orders (8:30 AM ET), as well as pending home sales (10:00 AM ET).
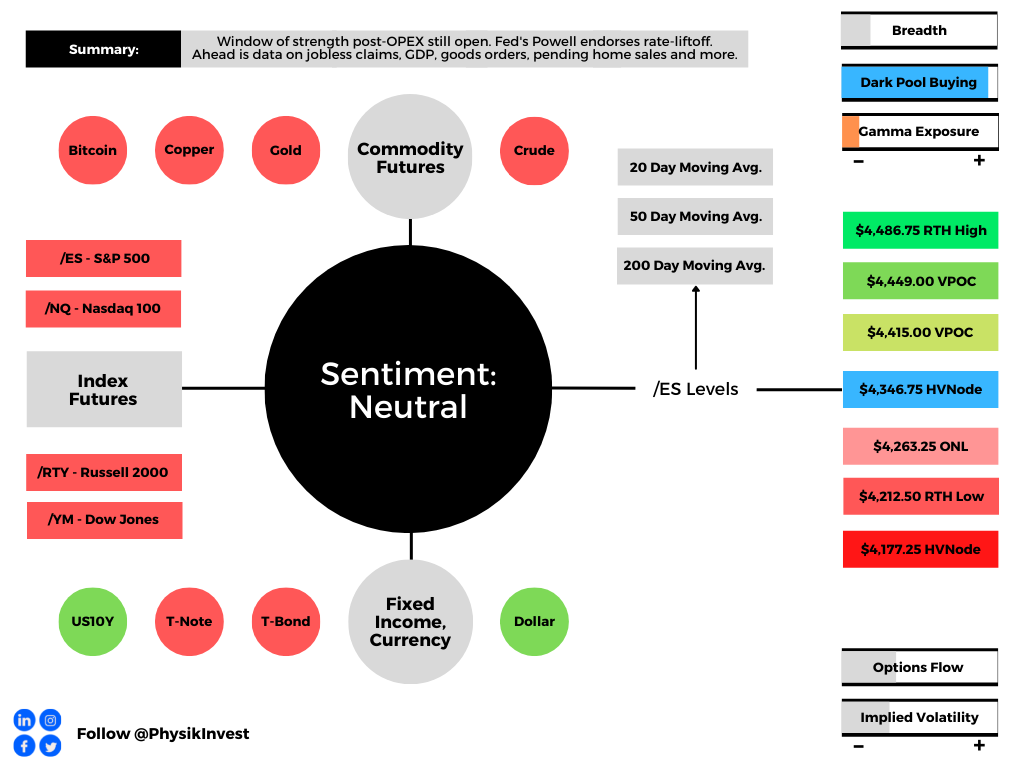
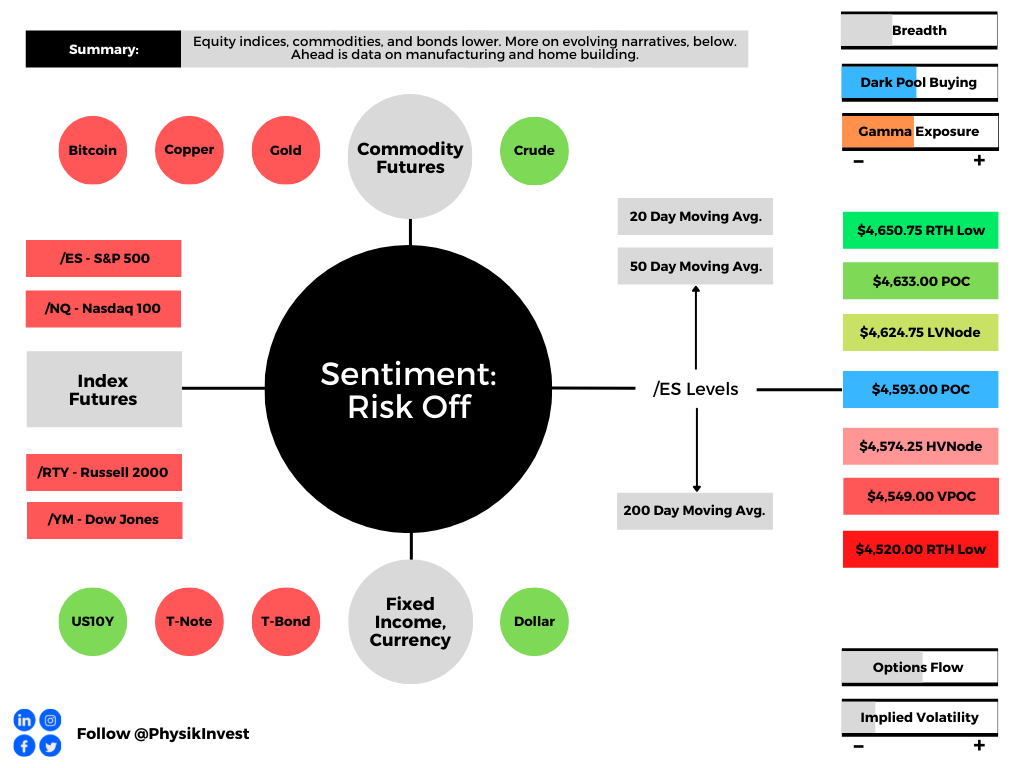
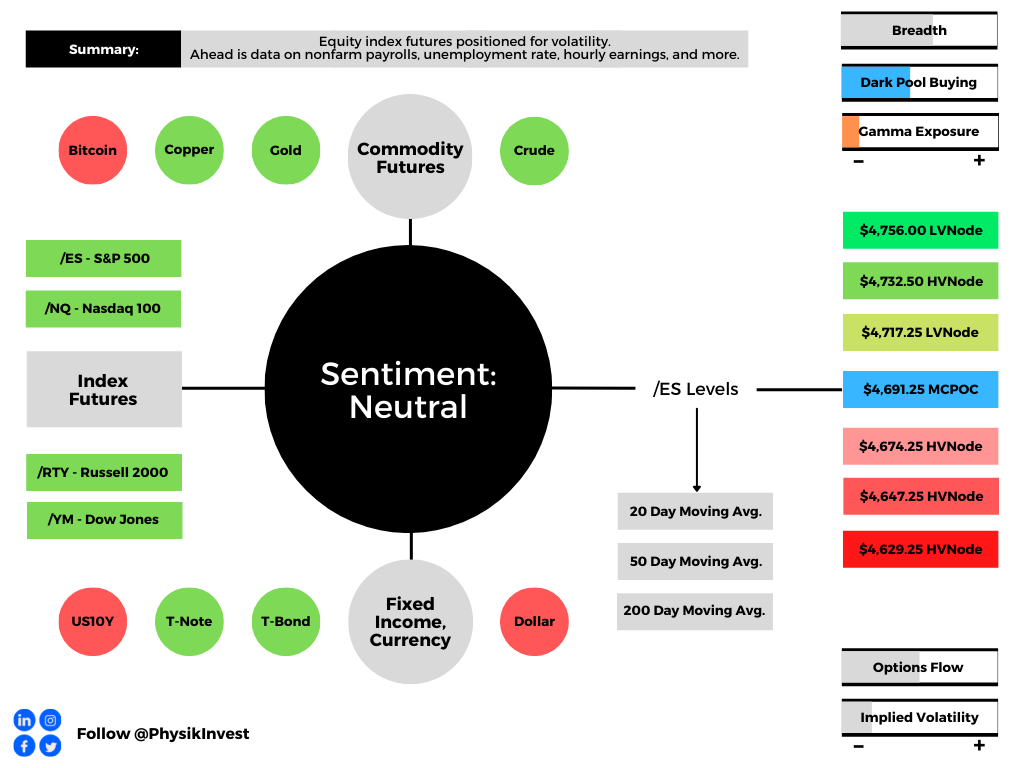
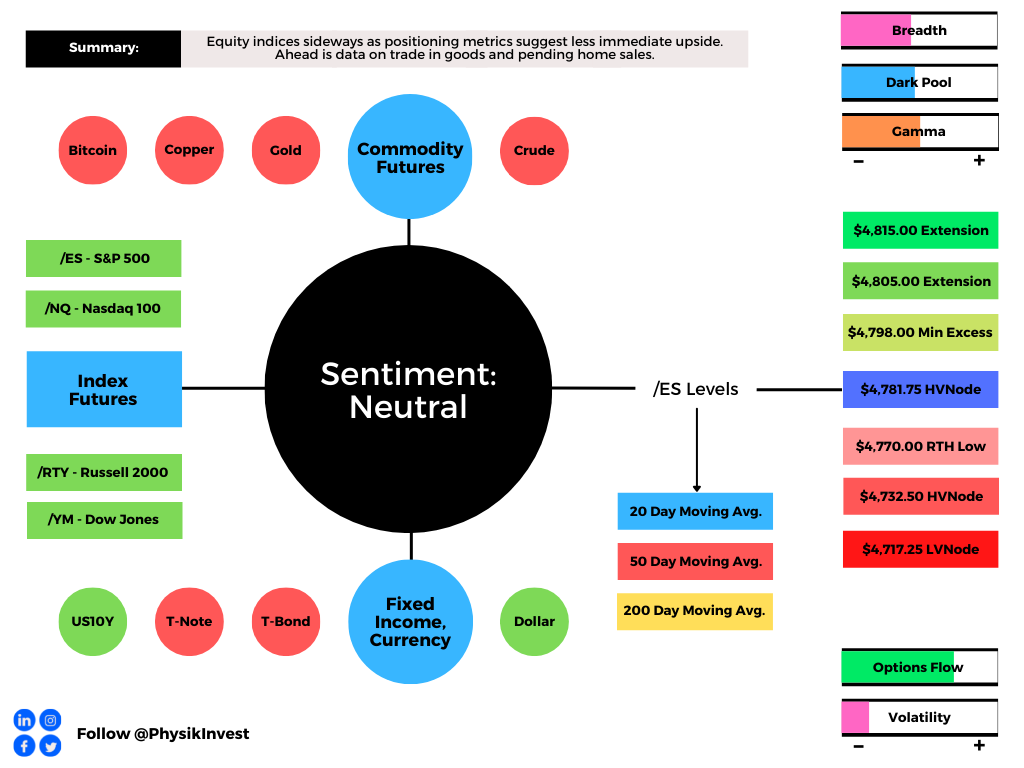
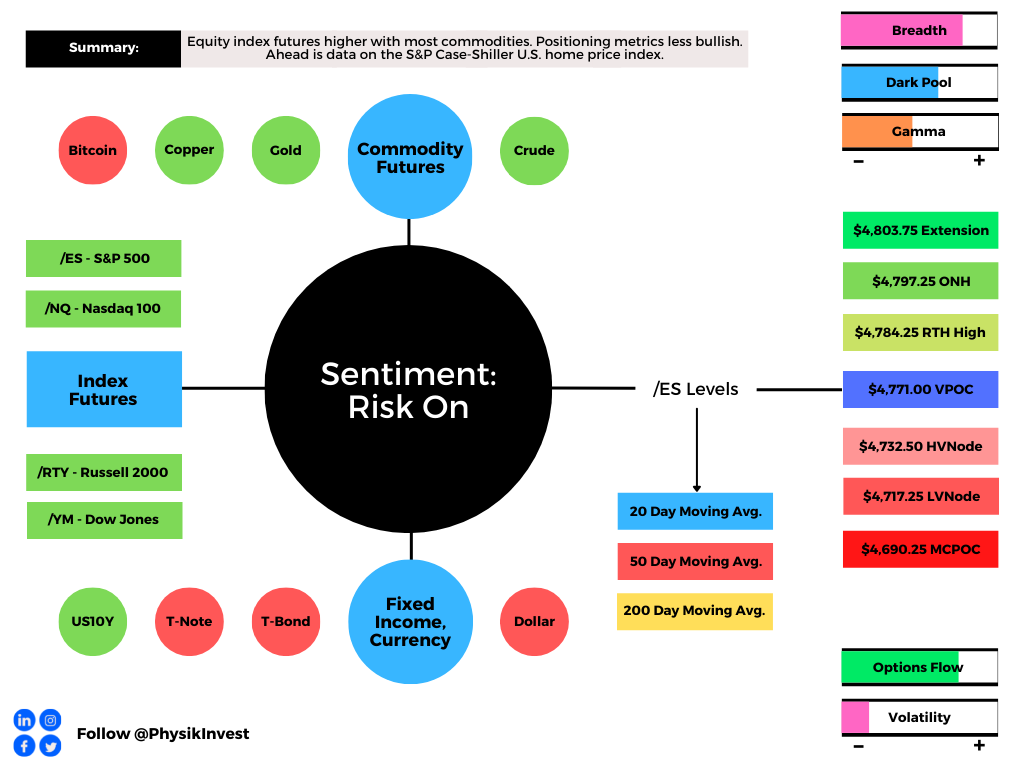
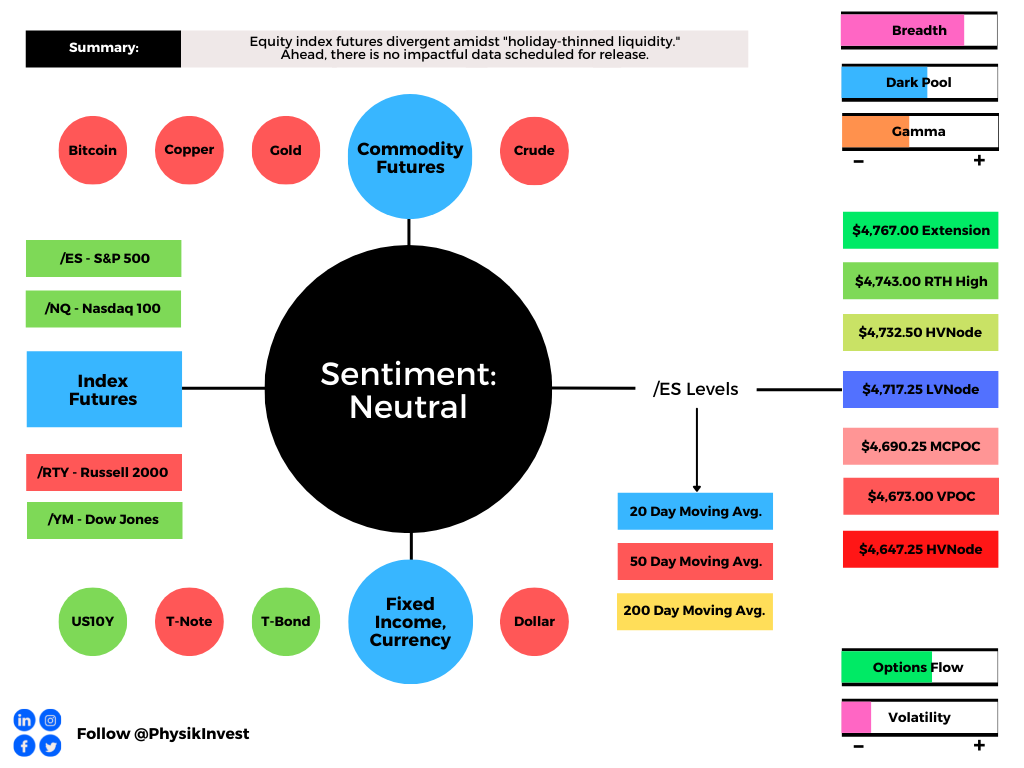
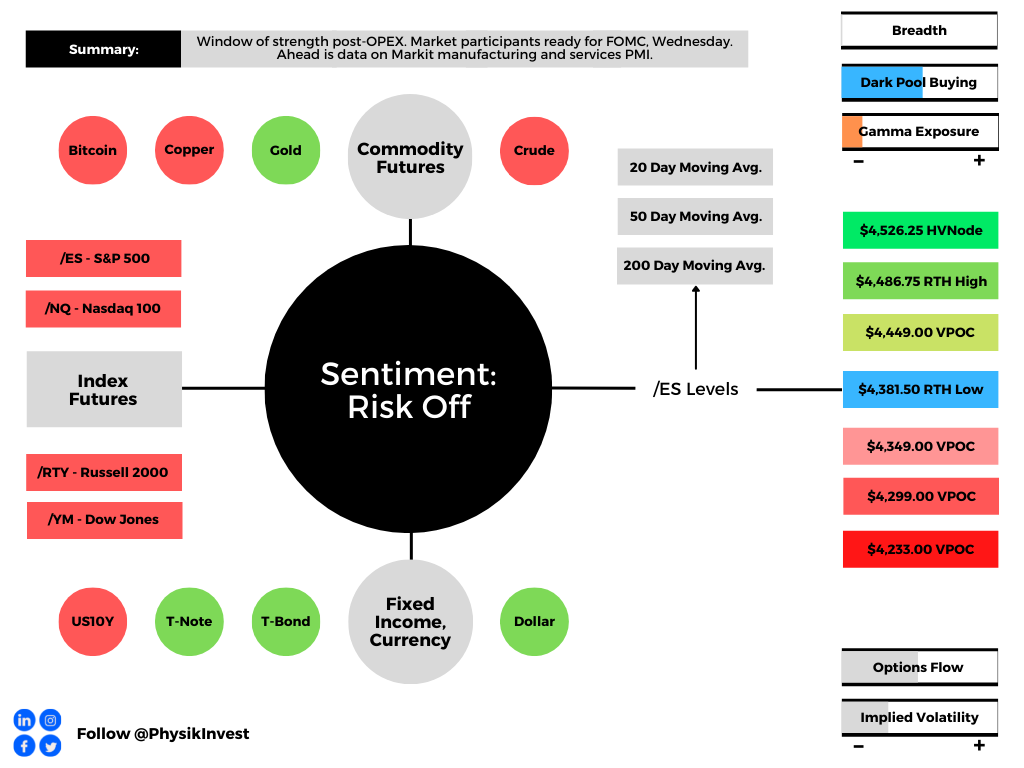
Graphic updated 6:00 AM ET. Sentiment Neutral if expected /ES open is inside of the prior day’s range. /ES levels are derived from the profile graphic at the bottom of the following section. Levels may have changed since initially quoted; click here for the latest levels. SqueezeMetrics Dark Pool Index (DIX) and Gamma (GEX) calculations are based on where the prior day’s reading falls with respect to the MAX and MIN of all occurrences available. A higher DIX is bullish. At the same time, the lower the GEX, the more (expected) volatility. Learn the implications of volatility, direction, and moneyness. SHIFT data used for S&P 500 (INDEX: SPX) options activity. Note that options flow is sorted by the call premium spent; if more positive, then more was spent on call options. Breadth reflects a reading of the prior day’s NYSE Advance/Decline indicator. VIX reflects a current reading of the CBOE Volatility Index (INDEX: VIX) from 0-100.

What To Expect

Fundamental: Comments shared by the Federal Open Market Committee (FOMC) revealed asset purchases would stop in March.

After, the Fed is likely to hike the fed funds rate, but this is in the face of an economy that’s stronger than at the start of the last hiking cycle.
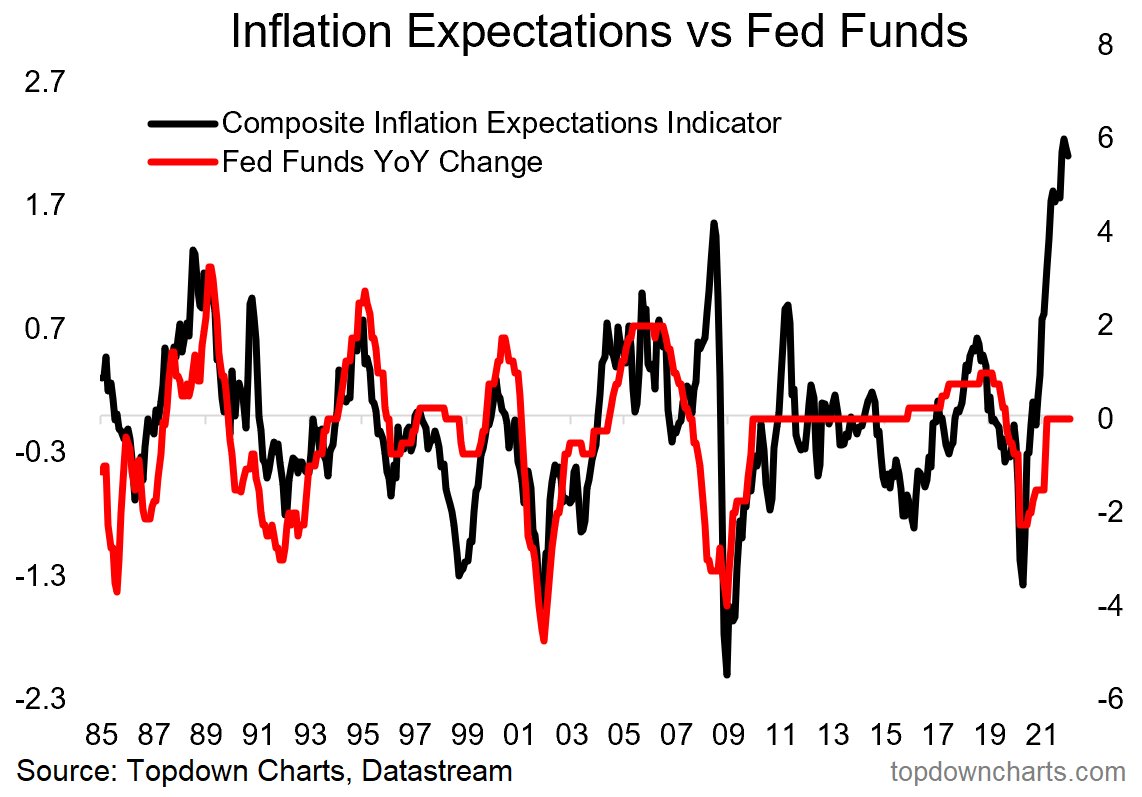
Graphic: Per Topdown Charts, “the Fed has placed itself behind the curve, and needs to catch up.”

Still, despite expectations being met, the hawkish tone was enough to tip the equity market

Graphic: Per Bloomberg, “the message Powell gave in his press conference was clear and loud enough to drive a massive reversal.”

This wasn’t unexpected. 

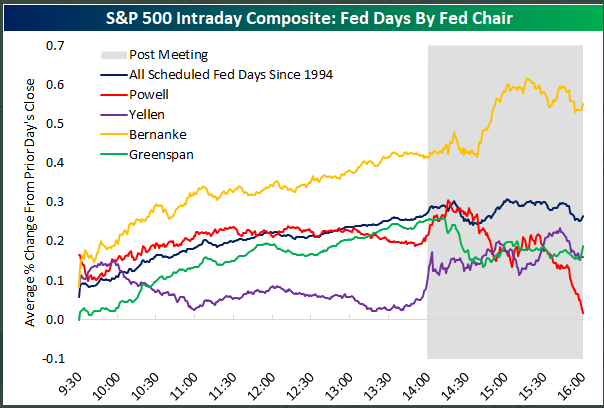
On average, under Chair Jerome Powell, the market tends to give up its intraday gains after an FOMC announcement.
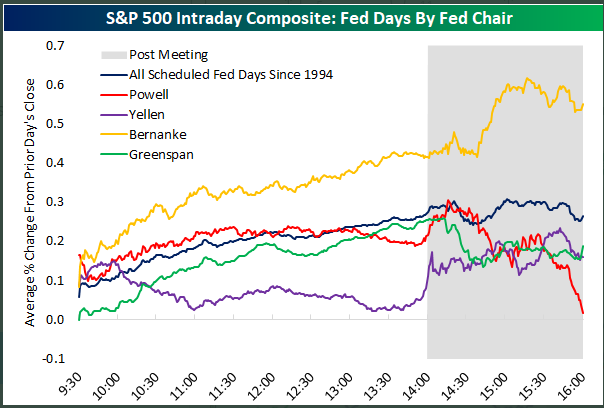
Graphic: “[S]tock markets don’t like listening to Jay Powell.”

With the flatter yield curve (spread of 10-year over two-year Treasury yields), per Bloomberg, this implies that “rates will need to rise in the short term but won’t have to stay high.”

“In other words, the bond market still thinks that the Fed will beat inflation without breaking anything, … and the words at the press conference were enough to engineer a noticeable tightening of financial conditions while still leaving stock markets close to their all-time high.”

Adding, per Goldman Sachs Group Inc (NYSE: GS), rate hikes are set to occur in March, June, September, and December with the balance sheet runoff starting July. 

As noted yesterday, an “abundance of excess liquidity could provide a cushion as the Fed drains liquidity, a cushion that did not exist in 2018.”

Perspectives: Interactive Brokers Group Inc’s (NASDAQ: IBKR) Chief Strategist Steve Sosnick suggests that “Even when we saw relatively higher short-term rates and a flattish curve, equities were able to push to what were then all-time highs. The risk of course is that those highs were about 30% below current levels.”

Also, per Grit Capital, opportunity in growth equities will occur as follows: 

“(1) Investing in free-cash-flow generative names that pull cash flows forward, shortening their duration (i.e., Microsoft Corporation [NASDAQ: MSFT] now trades at a lower P/E multiple than Retail Chain Costco Wholesale Corporation [NASDAQ: COST]). (2) Once the rebound takes hold, invest in high-growth companies that dominate their niche and are positioned in industries with rapid market expansion.”

Positioning: Expectations are for heightened volatility so long implied volatility is bid and markets continue to trade in a negative-gamma environment (wherein an options delta falls with stock price rises and rises when stock prices fall).

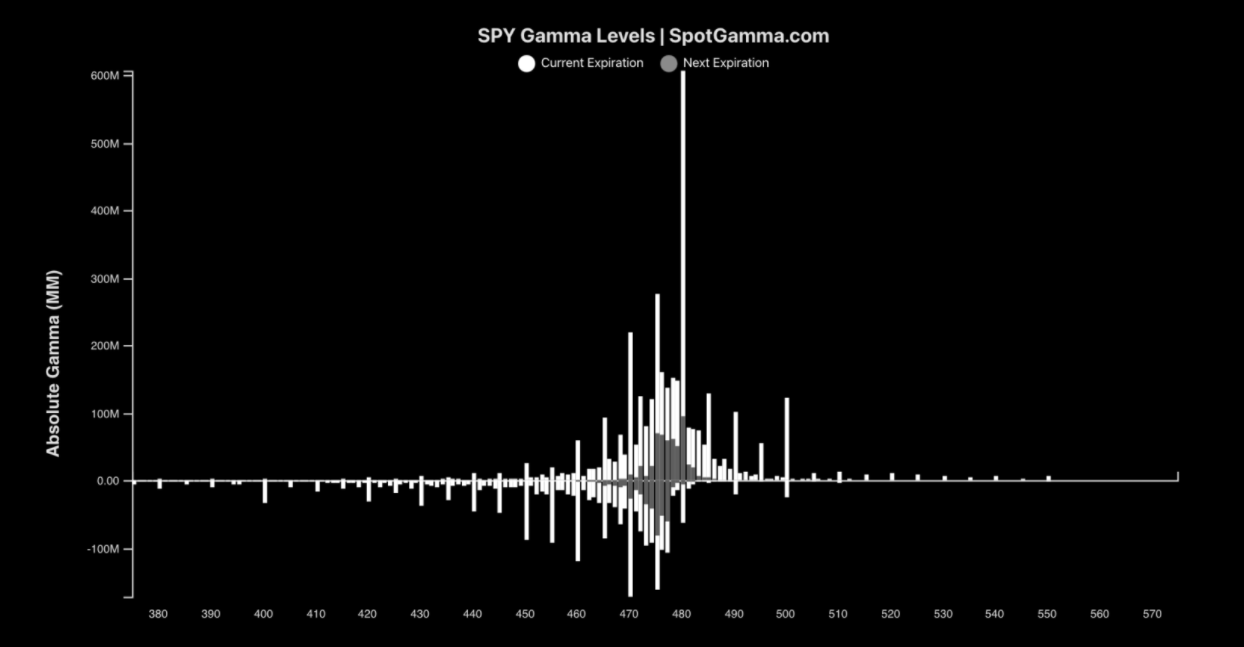
Factors that ought to support a counter-trend rally include the compression in volatility and strong buying support (measured by liquidity provision on the market-making side), after, as SpotGamma suggests, “markets have hit a ‘lower bound.’”

According to comments made by SqueezeMetrics, “traders (professional) bought tons of E-minis, and dealers facilitated.”
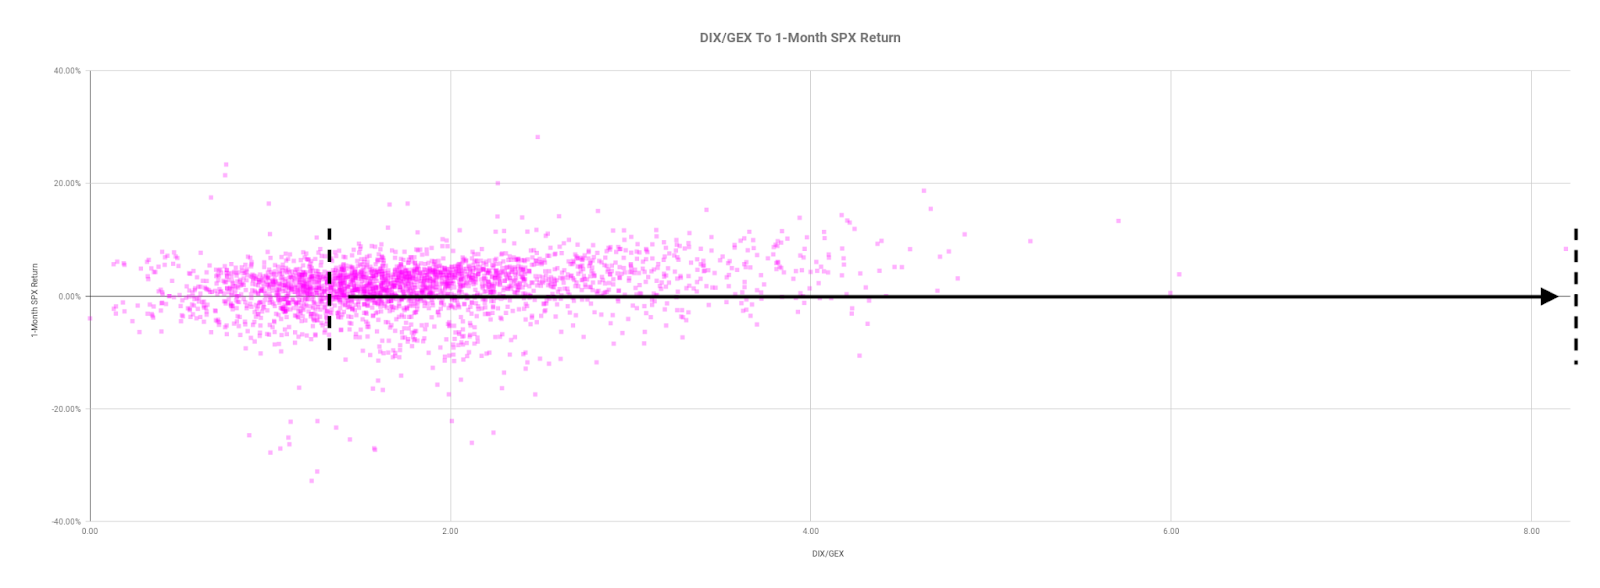
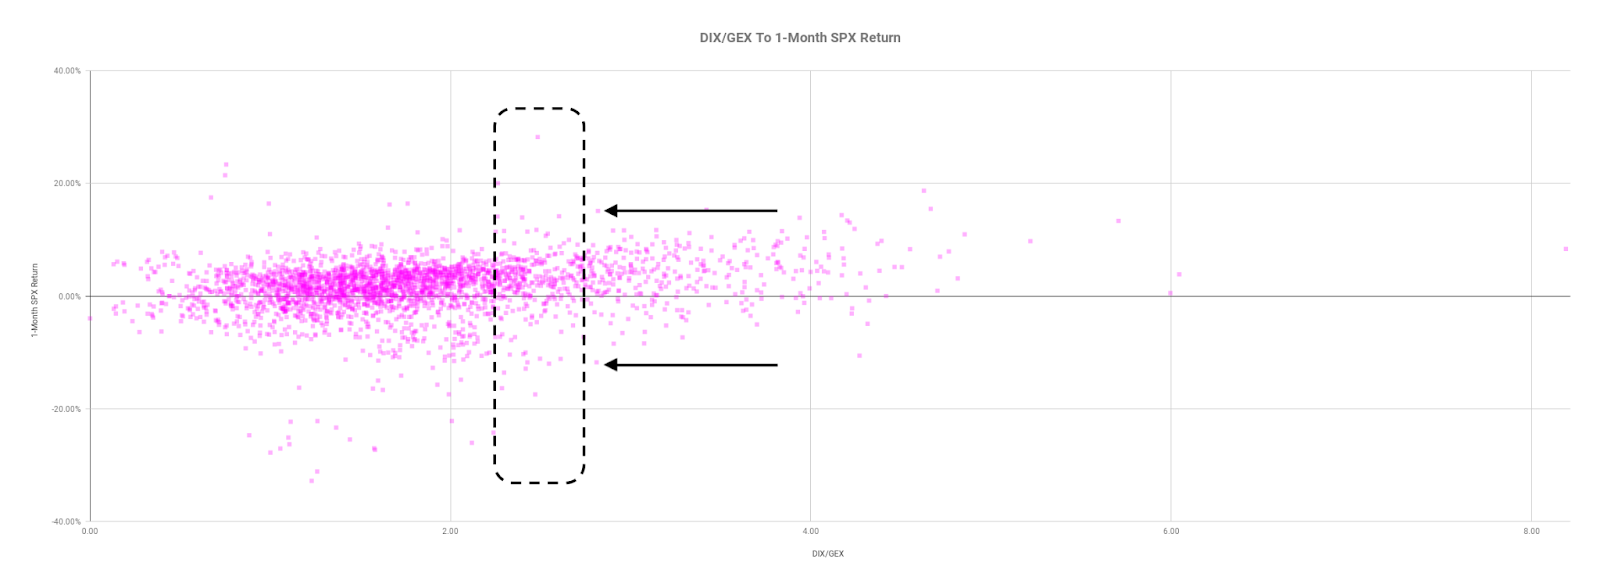
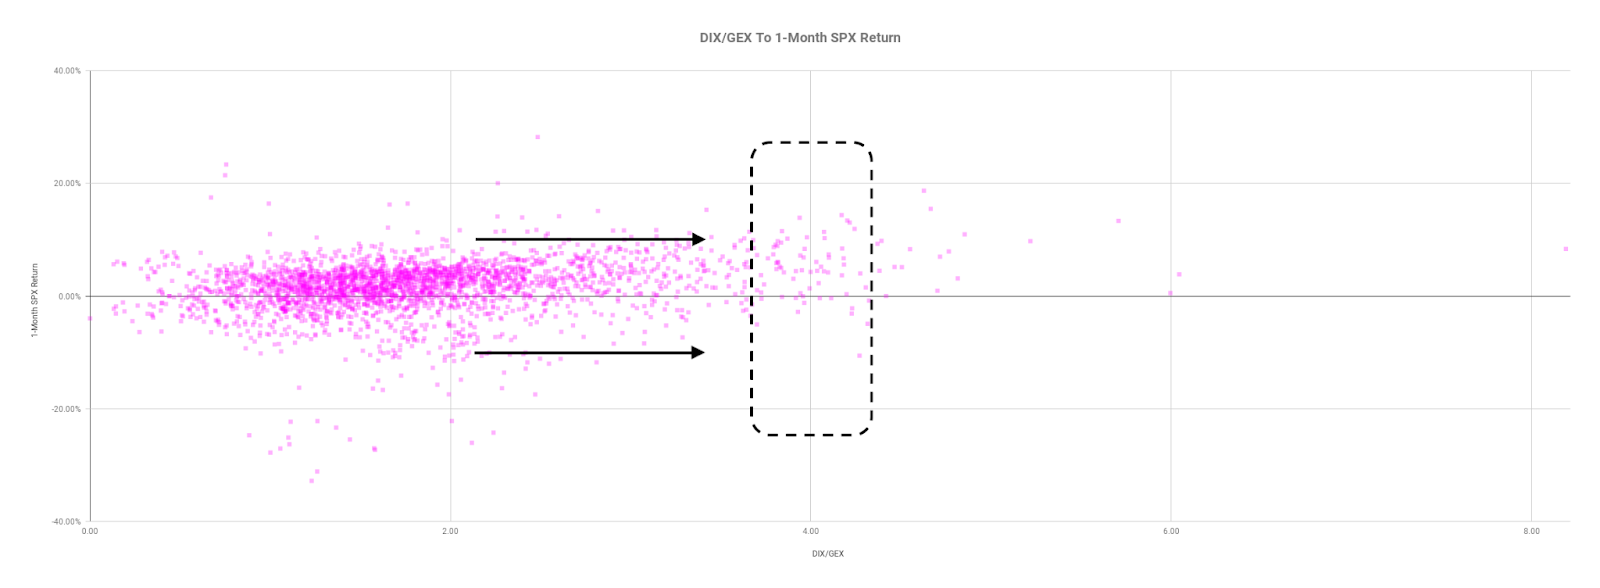
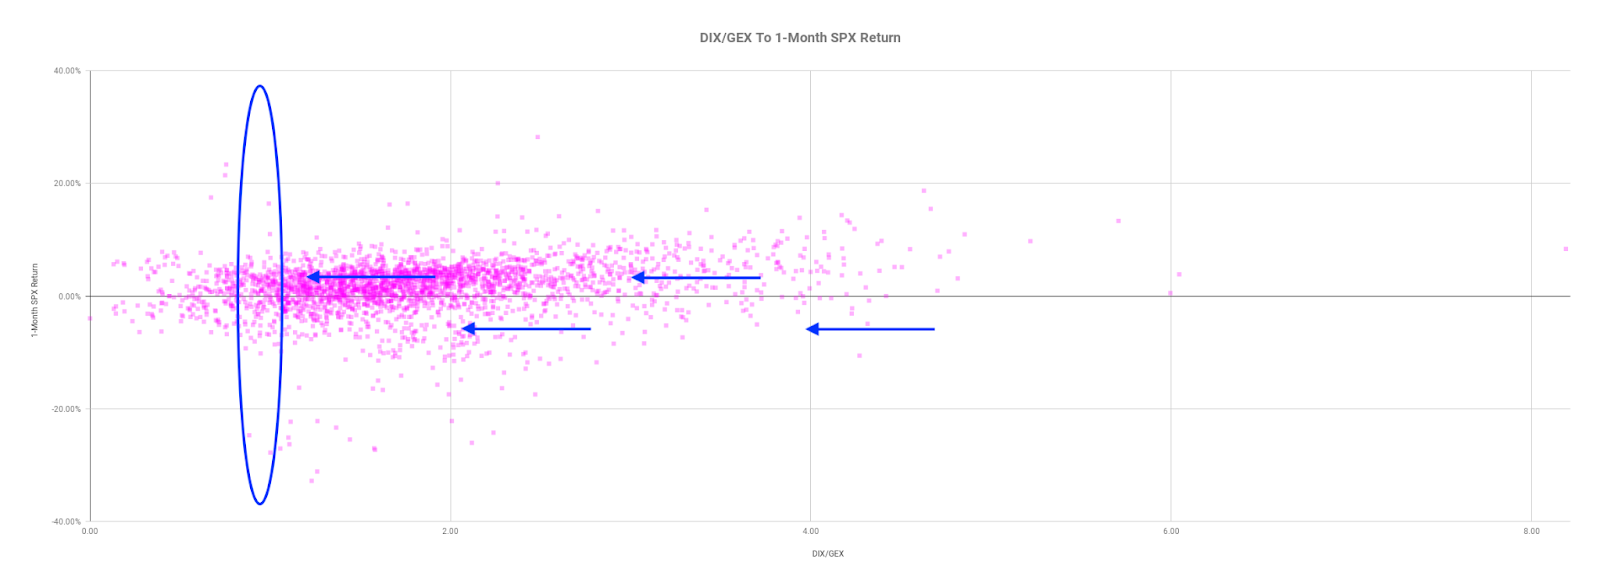
Graphic: Data SqueezeMetrics. Graph via Physik Invest.

A compression in volatility marks down the positive delta (directional exposure) of options counterparties are short. The positive vanna flow – “covering” of short-delta stock/futures hedges – is what could drive markets higher. 

Conversely, volatility could expand and that would have the opposite effect.

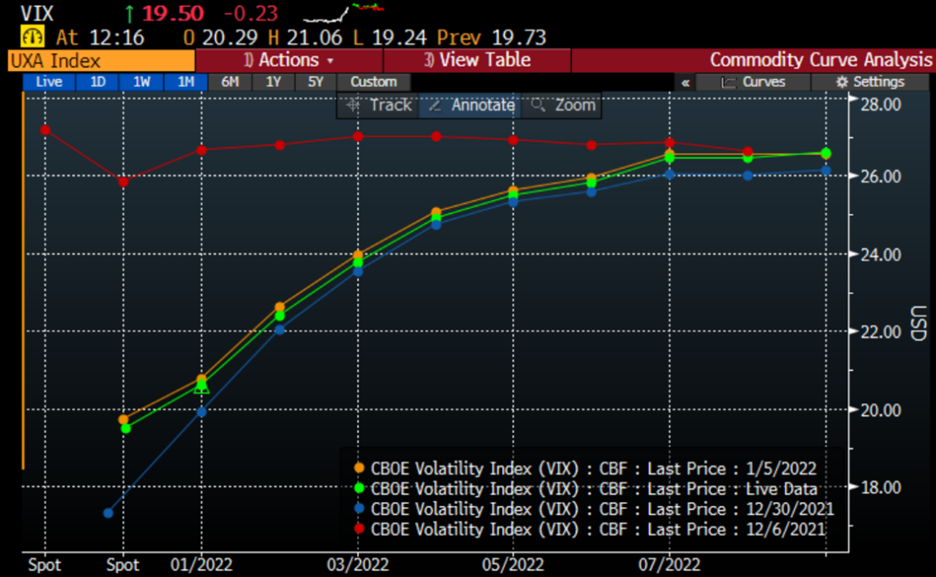
We shall watch the CBOE Volatility Index (INDEX: VIX) and VIX term structure for clues. Backwardation (inversion) in the term structure points to continued fear, instability.

Technical: As of 6:00 AM ET, Thursday’s regular session (9:30 AM – 4:00 PM ET), in the S&P 500, will likely open in the upper part of a negatively skewed overnight inventory, inside of prior-range and -value, suggesting a limited potential for immediate directional opportunity.

Spikes: Spike’s mark the beginning of a break from value. Spikes higher (lower) are validated by trade at or above (below) the spike base (i.e., the origin of the spike). 

The spike base is at $4,381.00 /ES. Above, bullish. Below, bearish.

In the best case, the S&P 500 trades higher; activity above the $4,346.75 high volume area (HVNode) puts in play the $4,415.00 untested point of control (VPOC). Initiative trade beyond the $4,415.00 VPOC could reach as high as the $4,449.00 VPOC and $4,486.75 regular trade high (RTH High), or higher.

In the worst case, the S&P 500 trades lower; activity below the $4,346.75 HVNode puts in play the $4,263.25 overnight low (ONL). Initiative trade beyond the ONL could reach as low as the $4,212.50 RTH Low and $4,177.25 HVNode, or lower.

Click here to load today’s key levels into the web-based TradingView charting platform. Note that all levels are derived using the 65-minute timeframe. New links are produced, daily.
Graphic: 65-minute profile chart of the Micro E-mini S&P 500 Futures.

What People Are Saying

Definitions

Volume Areas: A structurally sound market will build on areas of high volume (HVNodes). Should the market trend for long periods of time, it will lack sound structure, identified as low volume areas (LVNodes). LVNodes denote directional conviction and ought to offer support on any test. 

If participants were to auction and find acceptance into areas of prior low volume (LVNodes), then future discovery ought to be volatile and quick as participants look to HVNodes for favorable entry or exit.

Gamma: Gamma is the sensitivity of an option to changes in the underlying price. Dealers that take the other side of options trades hedge their exposure to risk by buying and selling the underlying. When dealers are short-gamma, they hedge by buying into strength and selling into weakness. When dealers are long-gamma, they hedge by selling into strength and buying into weakness. The former exacerbates volatility. The latter calms volatility.

Vanna: The rate at which the delta of an option changes with respect to volatility.

Charm: The rate at which the delta of an option changes with respect to time.

POCs: POCs are valuable as they denote areas where two-sided trade was most prevalent in a prior day session. Participants will respond to future tests of value as they offer favorable entry and exit.

Inversion Of VIX Futures Term Structure: Longer-dated VIX expiries are less expensive; is a warning of elevated near-term risks for equity market stability.

About

After years of self-education, strategy development, mentorship, and trial-and-error, Renato Leonard Capelj began trading full-time and founded Physik Invest to detail his methods, research, and performance in the markets.

Capelj is also a Benzinga finance and technology reporter interviewing the likes of Shark Tank’s Kevin O’Leary, JC2 Ventures’ John Chambers, FTX’s Sam Bankman-Fried, and ARK Invest’s Catherine Wood, as well as a SpotGamma contributor developing insights around impactful options market dynamics.

Disclaimer

Physik Invest does not carry the right to provide advice.

In no way should the materials herein be construed as advice. Derivatives carry a substantial risk of loss. All content is for informational purposes only.

Categories
Commentary

Daily Brief For January 24, 2022

The Daily Brief is a free glimpse into the prevailing fundamental and technical drivers of U.S. equity market products. Join the 200+ that read this report daily, below!

What Happened

Overnight, equity index futures auctioned sideways to lower while measures of implied volatility expanded, which suggests increased fear and demand for protection.

This is in the context of an environment wherein the equity market, in particular, is positioned for heightened volatility, albeit potential strength, after Friday’s large monthly options expiration.

Ahead is data on Markit Manufacturing and Services PMI (9:45 AM ET).

Graphic updated 6:15 AM ET. Sentiment Risk-Off if expected /ES open is below the prior day’s range. /ES levels are derived from the profile graphic at the bottom of the following section. Levels may have changed since initially quoted; click here for the latest levels. SqueezeMetrics Dark Pool Index (DIX) and Gamma (GEX) calculations are based on where the prior day’s reading falls with respect to the MAX and MIN of all occurrences available. A higher DIX is bullish. At the same time, the lower the GEX, the more (expected) volatility. Learn the implications of volatility, direction, and moneyness. SHIFT data used for S&P 500 (INDEX: SPX) options activity. Note that options flow is sorted by the call premium spent; if more positive, then more was spent on call options. Breadth reflects a reading of the prior day’s NYSE Advance/Decline indicator. VIX reflects a current reading of the CBOE Volatility Index (INDEX: VIX) from 0-100.

What To Expect

Fundamental: “The ratio of stocks hitting 52-week lows is at the highest since March 2020,” according to The Market Ear

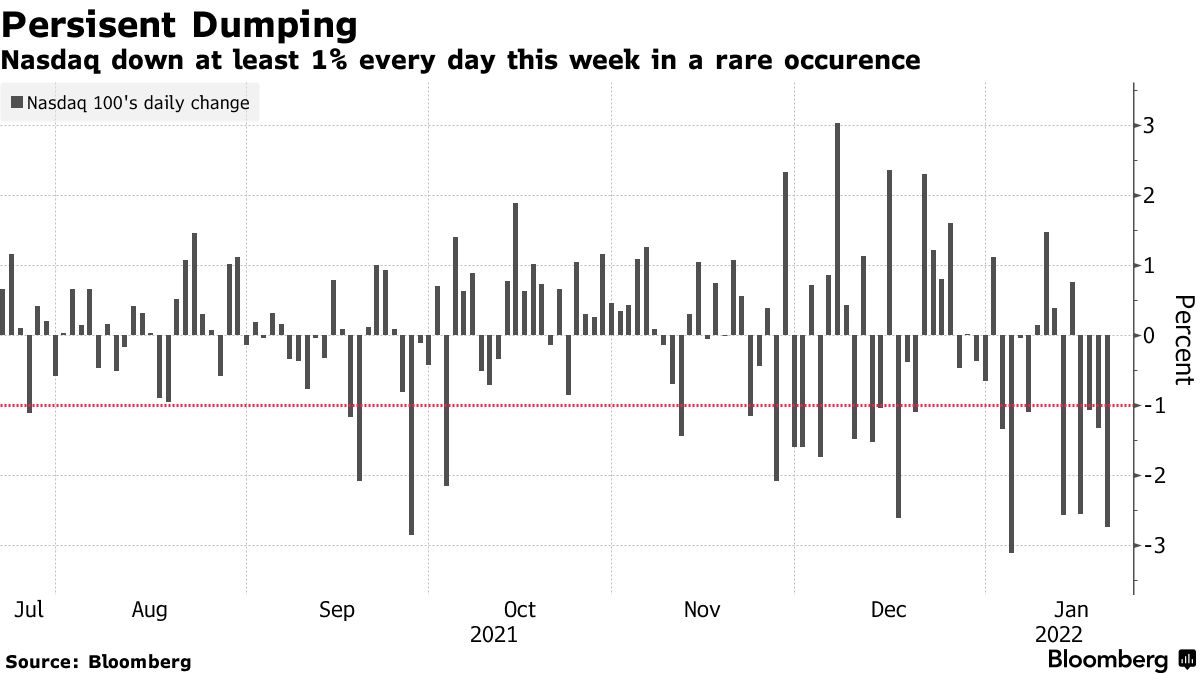
In fact, in the face of a traditionally bullish period, seasonally, this is the worst January on record for the Nasdaq.

Graphic: Per Bloomberg, “Down almost 12% in January, the Nasdaq 100 is on course for its worst month since the 2008 global financial crisis. On any four-day basis, the current streak of 1% drops was the first since 2018.”

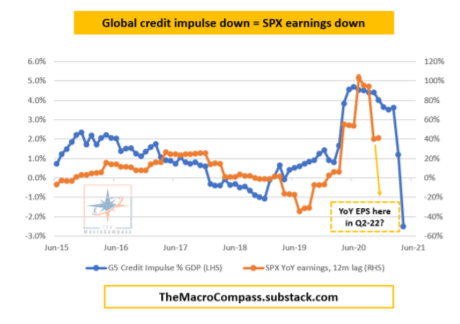
This weakness is in the context of months of divergent breadth by lesser weighted index constituents, geopolitical tensions, the prospects of reduced stimulus to combat high inflation, poor responses to earnings results, and disappointments in real demand and growth.

Graphic: @MacroAlf plots credit impulse as a percent of GDP and SPX year-over-year earnings.

The tone amongst retail participants is changing, too, with outflows starting for the first time since a major rush in account openings. When asked whether the selling is over, JPMorgan Chase & Co’s (NYSE: JPM) prime brokerage data suggests no.

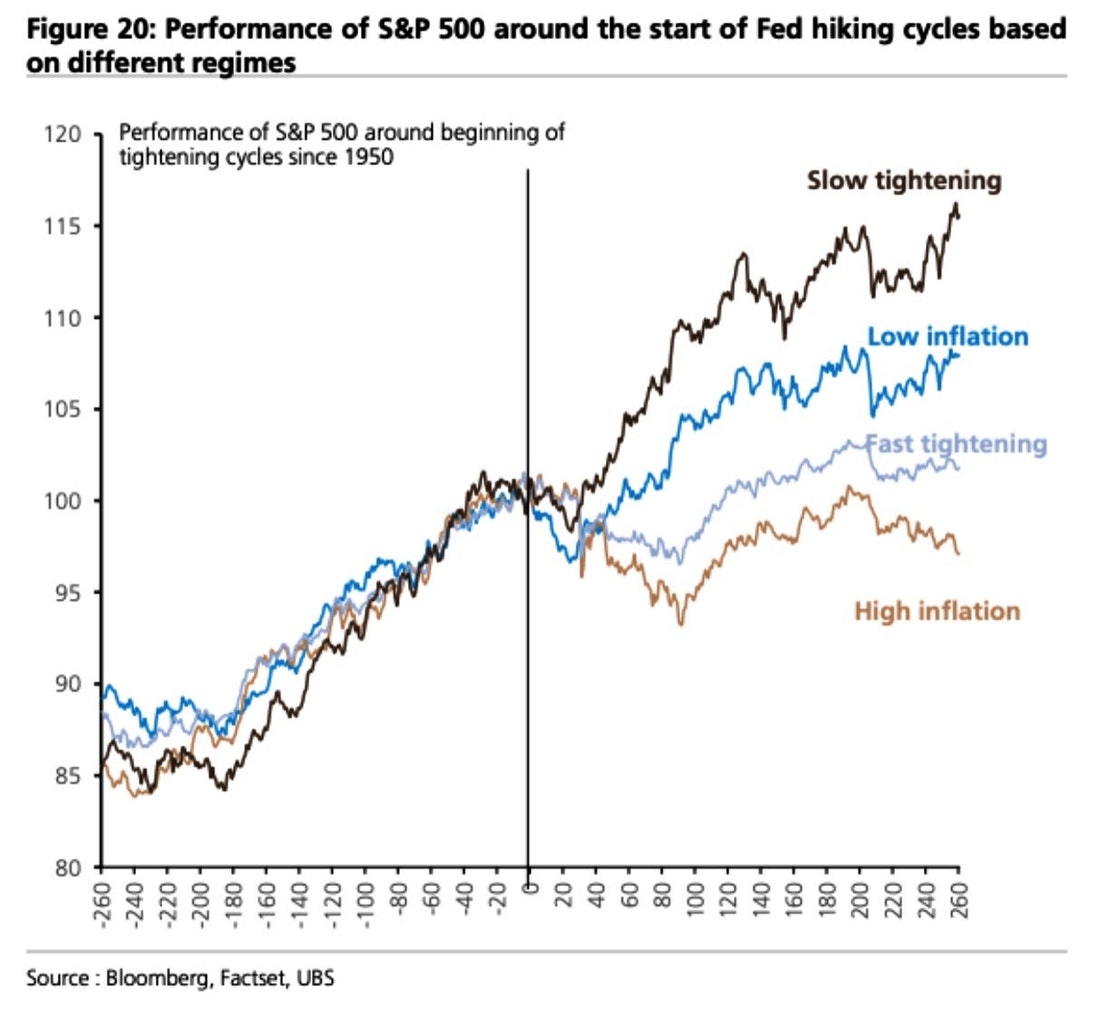
This is in opposition to the typical trend into the start of the Federal Reserve (Fed) hiking cycles.

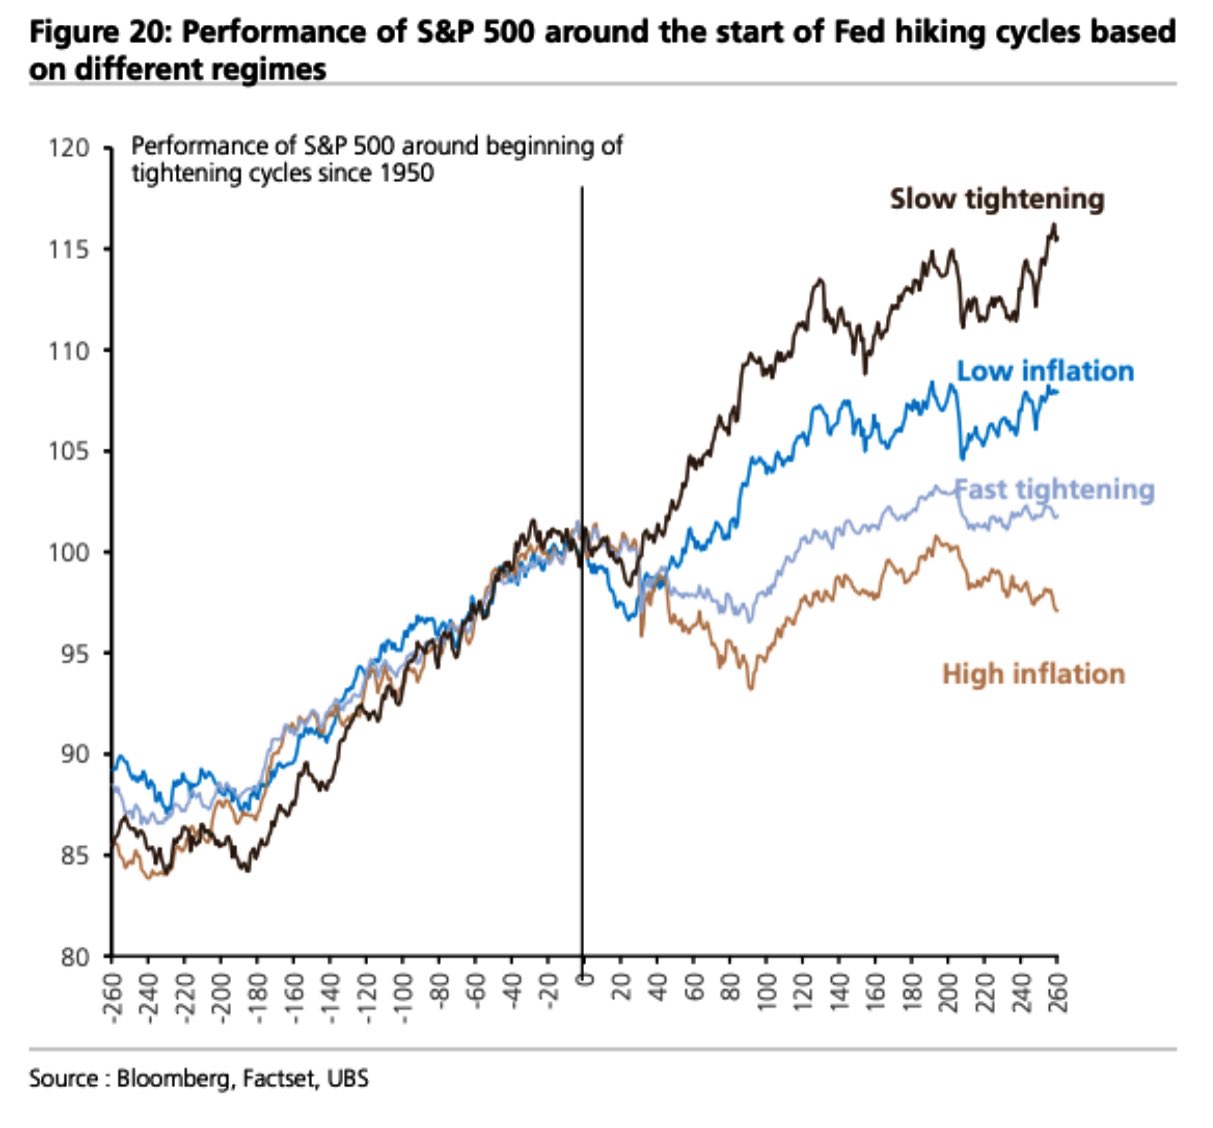
“U.S. equities have stumbled significantly on their way toward the first hike of this cycle, which is not the norm,” Jefferies Financial Group (NYSE: JEF) explained. “Performance tends to be poor immediately after the first hike, and can be worse if stocks are weakly into the first hike.”

Notwithstanding, Jefferies adds, “the SPX was higher in the 12 months that followed the start of each of the last 7 hike cycles.”

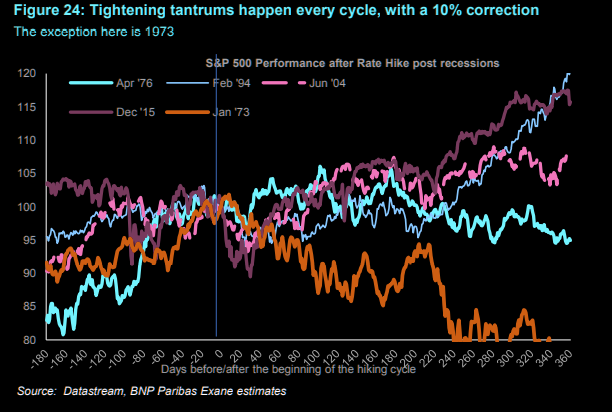
Graphic: S&P 500 performance before and after rate hikes.

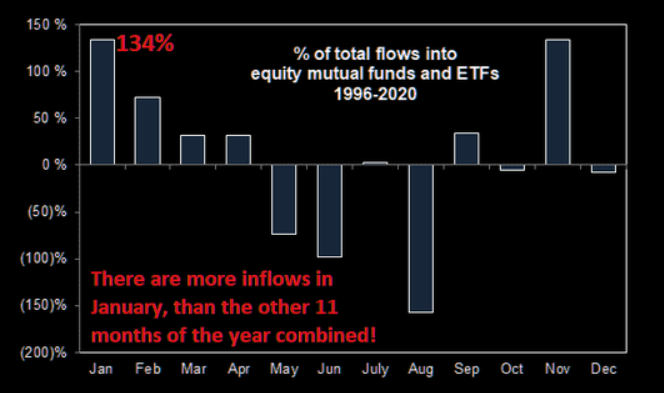
With some of that context in mind, what is there to look forward to? The corporate buyback blackout window ended after the close of business, Friday, and equity inflows remain robust.

What is there to be wary of? 

Well, given that “risk is being repriced to fit the world where real rates are a lot higher, and the Fed put [is] much lower thanks to the Fed’s need to fight inflation,” this week’s Federal Open Market Committee (FOMC) meeting shall provide market participants more context as to the “timing and pace of QT” which may assuage fears unless the Fed is all out to “drop QE next week itself.”

The odds of that happening are low.

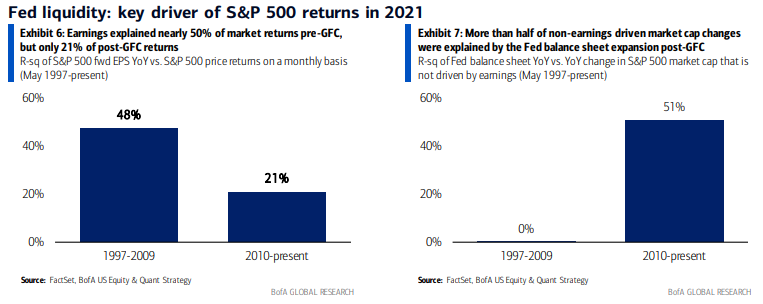
Graphic: Per Bloomberg, “As Savita Subramanian of Bank of America Corporation (NYSE: BAC) shows in the following chart, expected earnings are far less helpful in explaining market outcomes since 2010 than they were before. Meanwhile, changes in the Fed’s balance sheet, the amount of money it’s making available to markets, have become hugely important.”

As Bloomberg’s John Authers puts it well: “Despite many scares, money has stayed plentiful for the last decade, rates have fallen, and anyone who did much to protect themselves against the risk of a decline would have done badly by it.”

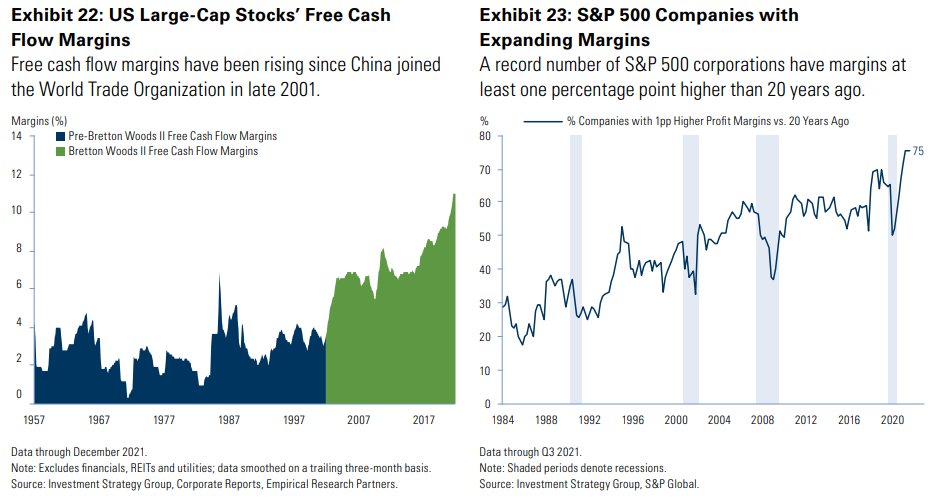
Graphic: As Goldman Sachs Group Inc (NYSE: GS) “shows in this chart, companies are becoming ever more profitable in a way that seems to be sustained.”

Positioning: The major broad market indices – the S&P 500, Nasdaq 100, and Russell 2000 – are in an environment characterized by negative gamma and heightened volumes. 

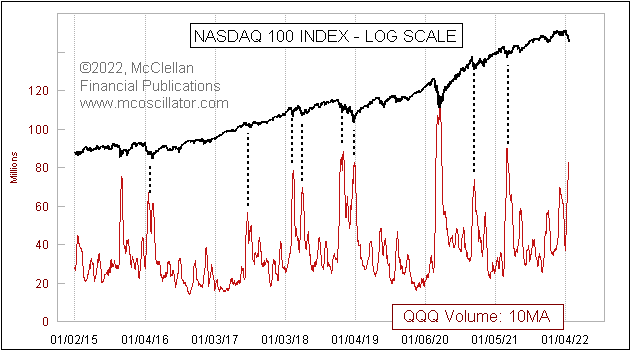
Graphic: Per Tom McClellan, “Persistently high volume late in QQQ is a sign of overly bearish sentiment worthy of a bottom. Key caveat: just because one notices a sentiment indication which should matter does not mean it has to matter right away.”

The negative gamma – in reference to the options counterparties reaction “when a position’s delta falls (rises) with stock or index price rises (falls)” – is what compounds the selling. 

With measures of implied volatility expanding, as is the case when there is heightened demand for downside put protection (a positive-delta trade for the dealers), protection is bid and the dealer’s exposure to positive delta rises, which solicits more selling in the underlying (addition of short-delta hedges).

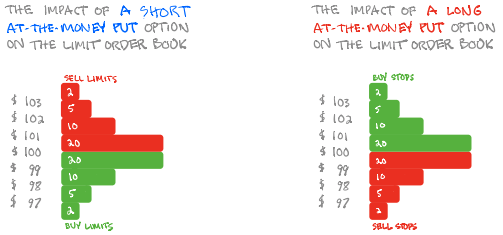
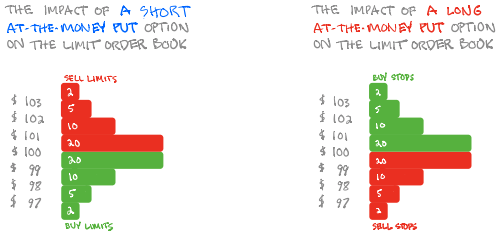
Graphic: SqueezeMetrics details the implications of customer activity in the options market, on the underlying’s order book. For instance, in selling a put, customers add liquidity and stabilize the market. How? The market maker long the put will buy (sell) the underlying to neutralize directional risk as price falls (rises).

Moreover, in negative-gamma, dealers are selling weakness and buying strength, taking liquidity. 

That’s destabilizing but it appears that “Friday in the markets did not have abnormal liquidity across S&P500 stocks.”

Graphic: Per @HalfersPower on Twitter, liquidity rankings for S&P 500 components. 

High readings in indicators like the put/call volume ratio, which denotes heightened trade of puts, relative to calls, as well as how calm equity market volatility is relative to rate volatility, could be the result of adequate hedging into the monthly options expiration (OPEX) and this week’s FOMC meeting.

“A very nasty flush out on a key polarized psychological level (S&P 500 $4,500.00) on the highest negative gamma day on an OPEX,” said Kris Sidial of The Ambrus Group on the increased potential for relief as a result of aggressive dip-buying. 

“Aggressive shorts piling in on an already dismantled tech selloff, leading into FOMC meeting after an 8% decline in the market, and Apple Inc (NASDAQ: AAPL) reporting earnings.”

Sidial’s opinion that the market is due for a counter-trend rally, in the face of an environment in which “there does not seem to be a direct hazard,” is aligned with the expectation that removal of put-heavy exposure, post-OPEX, and a reduction in embedded event premiums tied to the approaching FOMC, opens up a window of strength, wherein dealers have less positive delta exposure to sell against.

Technical: As of 6:15 AM ET, Monday’s regular session (9:30 AM – 4:00 PM ET), in the S&P 500, will likely open in the lower part of a balanced skewed overnight inventory, outside of prior-range and -value, suggesting a potential for immediate directional opportunity.

Gap Scenarios: Gaps ought to fill quickly. Should they not, that’s a signal of strength; do not fade. Leaving value behind on a gap-fill or failing to fill a gap (i.e., remaining outside of the prior session’s range) is a go-with indicator.

Auctioning and spending at least 1-hour of trade back in the prior range suggests a lack of conviction; in such a case, do not follow the direction of the most recent initiative activity.

In the best case, the S&P 500 trades higher; activity above the $4,381.50 regular trade low (RTH Low) puts in play the $4,449.00 untested point of control (VPOC). Initiative trade beyond the VPOC could reach as high as the $4,486.75 RTH High and $4,526.25 high volume area (HVNode), or higher.

In the worst case, the S&P 500 trades lower; activity below the $4,381.50 RTH Low puts in play the $4,349.00 VPOC. Initiative trade beyond the $4,349.00 VPOC could reach as low as the $4,299.00 and $4,233.00 VPOC, or lower.

Considerations: The daily, weekly, and monthly charts are in alignment. 

The loss of trend across higher timeframes suggests a clear change in tone. This does not discount the potential for fast, but short-lived counter-trend rallies.

Click here to load today’s key levels into the web-based TradingView charting platform. Note that all levels are derived using the 65-minute timeframe. New links are produced, daily.
Graphic: 65-minute profile chart of the Micro E-mini S&P 500 Futures.

Definitions

Volume Areas: A structurally sound market will build on areas of high volume (HVNodes). Should the market trend for long periods of time, it will lack sound structure, identified as low volume areas (LVNodes). LVNodes denote directional conviction and ought to offer support on any test. 

If participants were to auction and find acceptance into areas of prior low volume (LVNodes), then future discovery ought to be volatile and quick as participants look to HVNodes for favorable entry or exit.

POCs: POCs are valuable as they denote areas where two-sided trade was most prevalent in a prior day session. Participants will respond to future tests of value as they offer favorable entry and exit.

Options Expiration (OPEX): Traditionally, option expiries mark an end to pinning (i.e, the theory that market makers and institutions short options move stocks to the point where the greatest dollar value of contracts will expire) and the reduction dealer gamma exposure.

About

After years of self-education, strategy development, mentorship, and trial-and-error, Renato Leonard Capelj began trading full-time and founded Physik Invest to detail his methods, research, and performance in the markets.

Capelj is also a Benzinga finance and technology reporter interviewing the likes of Shark Tank’s Kevin O’Leary, JC2 Ventures’ John Chambers, FTX’s Sam Bankman-Fried, and ARK Invest’s Catherine Wood, as well as a SpotGamma contributor developing insights around impactful options market dynamics.

Disclaimer

Physik Invest does not carry the right to provide advice.

In no way should the materials herein be construed as advice. Derivatives carry a substantial risk of loss. All content is for informational purposes only.
Categories
Commentary

Daily Brief For January 18, 2022

The Daily Brief is a free glimpse into the prevailing fundamental and technical drivers of U.S. equity market products. Join the 200+ that read this report daily, below!

What Happened

Overnight, equity index futures auctioned lower alongside a surge in bond yields. Rate-sensitive sectors were weakest in pre-market trade, in comparison to the value and cyclical names. 

Earnings are now in focus. Participants shall use earnings updates to gauge how companies are performing in spite of omicron, among other challenges.

Ahead is data on the Empire Manufacturing Index (8:30 AM ET) and NAHB Home Builders Index (10:00 AM ET). 

Graphic updated 6:30 AM ET. Sentiment Risk-Off if expected /ES open is below the prior day’s range. /ES levels are derived from the profile graphic at the bottom of the following section. Levels may have changed since initially quoted; click here for the latest levels. SqueezeMetrics Dark Pool Index (DIX) and Gamma (GEX) calculations are based on where the prior day’s reading falls with respect to the MAX and MIN of all occurrences available. A higher DIX is bullish. At the same time, the lower the GEX, the more (expected) volatility. Learn the implications of volatility, direction, and moneyness. SHIFT data used for S&P 500 (INDEX: SPX) options activity. Note that options flow is sorted by the call premium spent; if more positive, then more was spent on call options. Breadth reflects a reading of the prior day’s NYSE Advance/Decline indicator. VIX reflects a current reading of the CBOE Volatility Index (INDEX: VIX) from 0-100.

What To Expect

Fundamental: Ahead of earnings releases from Goldman Sachs Group (NYSE: GS), Morgan Stanley (NYSE: MS), Bank of America (NYSE: BAC), and Netflix (NASDAQ: NFLX), as well as key rate decisions, indices sold heavy. 

The Nasdaq 100 led the decline after holiday-trade, Monday, as yields surged alongside concerns central banks would tighten monetary policy sooner than expected.

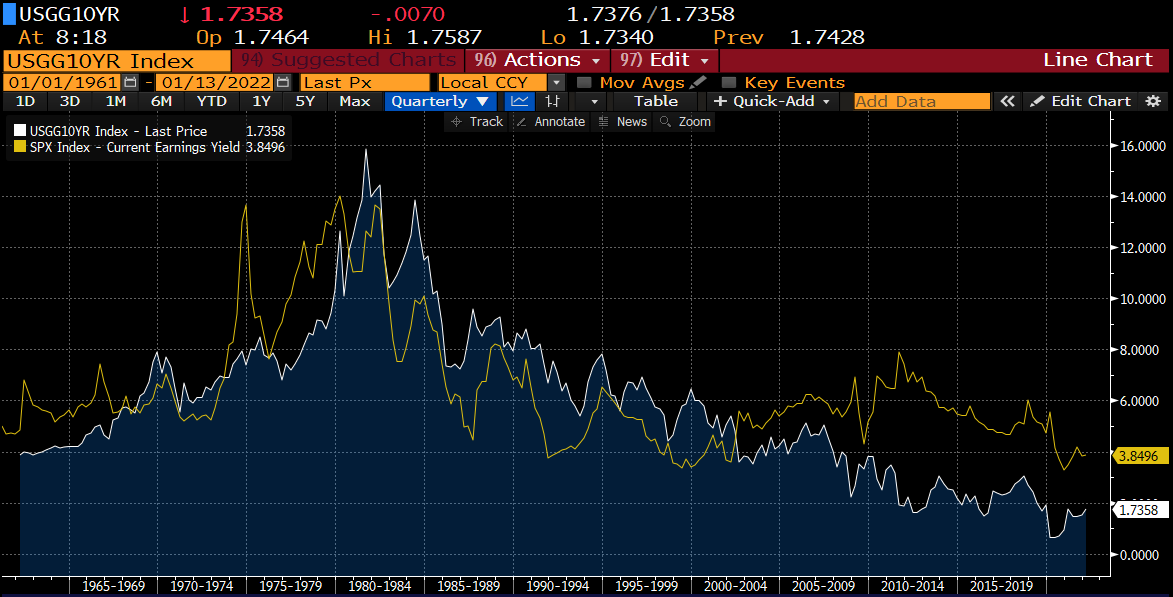
This is as higher rates have the potential to decrease the present value of future earnings, making stocks, especially those that are high growth, less attractive. 

“The rationale behind this is the trade-off,” Grit Capital put well in a recent newsletter

“Why would I park my money somewhere that is only yielding 1%, when I can invest in riskier assets that can raise my return?”

Graphic: Per Grit Capital, “A common proxy that a lot of people look at is the S&P500’s earnings yield (yellow) vs. the 10yr (white).”

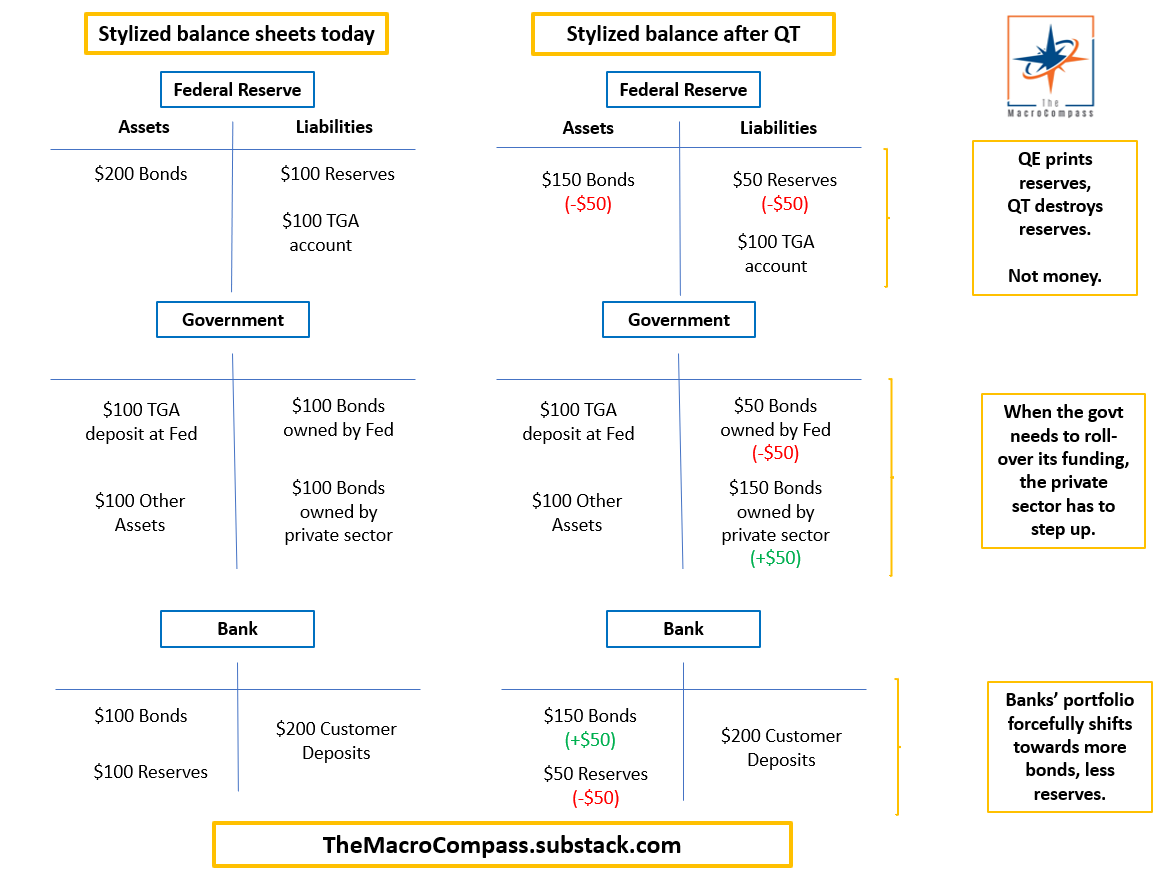
At the same time, narratives around quantitative tightening (i.e., the reduction in the size of the Federal Reserve’s balance sheet) are growing louder.

Graphic: QT mechanics per The Macro Compass.

This is what Andy Constan of Damped Spring Advisors refers to as the QT drumbeat. 

This drumbeat is to intensify in spite of strong economic and earnings growth, as well as a moderation in inflation, Constan says

“The lack of additional liquidity provided by Fed purchase will also remove a damper for the market and the economy keeping asset volatility well bid, while also causing asset diversification benefit to fall, generating rising portfolio volatility and the risk demanded to hold assets.”

Note: Check out this Constan’s really interesting story, below!

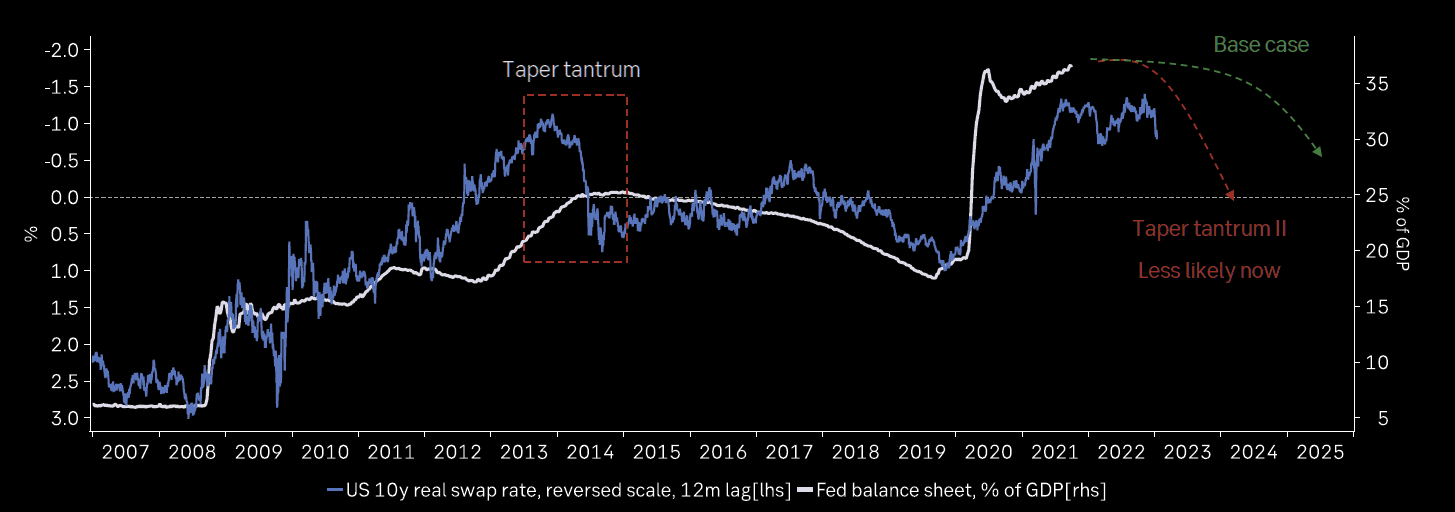
Graphic: Via The Market Ear, “Temporary relief from Powell – slow reverse QE’ confirmed. Powell says Fed will stop replacing maturing bonds, but will not sell holdings: slow QT.”

“If current, priced in, inflation and growth expectations are exactly realized we predict that risk premiums on 30-year yields will increase by 15bp and equity risk premium by 30bp,” Constan adds. “These risk premium expansions will generate a 2% headwind on long bond prices and a 10% headwind for equity prices.”

Constan’s comments line up with that of Morgan Stanley’s which sees markets selling down 10-20% during H1 2022, as expectations call for five 25 bp hikes. History is in alignment, below.

Graphic: S&P 500 performance before and after rate hikes, via The Market Ear.

So, despite recent inflows and “light positioning,” taking all of the above comments together, the window for stocks to rally is closing.

Positioning: The coming January 19 expiration of options on the Cboe Volatility Index (INDEX: VIX) and January 21 monthly equity options expiration (OPEX) has major implications.

According to Constan, the “[o]ptions expiration which includes lots of LEAP contracts will be a catalyst for a squeeze rally and a post-OpEx sell-off.”

This is as, according to Kai Volatility’s Cem Karsan, there is a constant structural positioning that naturally drives markets higher.

“I use this analogy of a jet,” he explained, referencing the three factors – the change in the underlying price (gamma), implied volatility (vanna), and time (charm) – that are well known to impact an options exposure to directional risk or delta. 

“[T]he hedging vanna and charm flows, and whatnot will push the markets higher.”

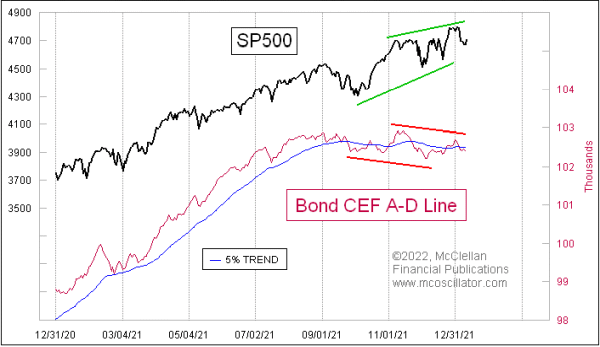
To note, though, with narratives around higher rates and QT strengthening, so to speak, divergences between the S&P 500 and metrics like the Bond Closed-End Fund (CEF) Advance-Decline line have already appeared.

As McClellan Financial Publications explains, “liquidity has suddenly become a problem, and it is affecting the more liquidity-sensitive issues first. That can be a prelude to that same illiquidity coming around and biting the big cap stocks that drive the major averages.”

Graphic: Bond CEF A-D showing liquidity problems, via McClellan Financial Publications.

As an aside, some believe that the Fed’s removal of liquidity has the potential to prick the bubble, prompting a cascading reaction that exacerbates underlying price movements.

“It’s not a coincidence that the mid-February to mid-March 2020 downturn literally started the day after February expiration and ended the day of March quarterly expiration,” Karsan adds. 

“These derivatives are incredibly embedded in how the tail reacts and there’s not enough liquidity, given the leverage, if the Fed were to taper.”

Technical: As of 6:30 AM ET, Tuesday’s regular session (9:30 AM – 4:00 PM ET), in the S&P 500, will likely open in the lower part of a negatively skewed overnight inventory, outside of prior-range and -value, suggesting a potential for immediate directional opportunity.

Gap Scenarios: Gaps ought to fill quickly. Should they not, that’s a signal of strength; do not fade. Leaving value behind on a gap-fill or failing to fill a gap (i.e., remaining outside of the prior session’s range) is a go-with indicator.

Auctioning and spending at least 1-hour of trade back in the prior range suggests a lack of conviction; in such a case, do not follow the direction of the most recent initiative activity.

In the best case, the S&P 500 trades higher; activity above the $4,593.00 point of control (POC) puts in play the $4,624.75 low volume area (LVNode). Initiative trade beyond the LVNode could reach as high as the $4,633.00 POC and $4,650.75 regular trade low (RTH Low), or higher.

In the worst case, the S&P 500 trades lower; activity below the $4,593.00 POC puts in play the $4,574.25 high volume area (HVNode). Initiative trade beyond the HVNode could reach as low as the $4,549.00 VPOC and $4,520.00 RTH Low, or lower.

Considerations: The S&P 500 remains above its 200-day simple moving average. The long-term trend remains up.

Click here to load today’s key levels into the web-based TradingView charting platform. Note that all levels are derived using the 65-minute timeframe. New links are produced, daily.
Graphic: 65-minute profile chart of the Micro E-mini S&P 500 Futures.

Definitions

Volume Areas: A structurally sound market will build on areas of high volume (HVNodes). Should the market trend for long periods of time, it will lack sound structure, identified as low volume areas (LVNodes). LVNodes denote directional conviction and ought to offer support on any test. 

If participants were to auction and find acceptance into areas of prior low volume (LVNodes), then future discovery ought to be volatile and quick as participants look to HVNodes for favorable entry or exit.

POCs: POCs are valuable as they denote areas where two-sided trade was most prevalent in a prior day session. Participants will respond to future tests of value as they offer favorable entry and exit.

MCPOCs: POCs are valuable as they denote areas where two-sided trade was most prevalent over numerous day sessions. Participants will respond to future tests of value as they offer favorable entry and exit.

Options Expiration (OPEX): Traditionally, option expiries mark an end to pinning (i.e, the theory that market makers and institutions short options move stocks to the point where the greatest dollar value of contracts will expire) and the reduction dealer gamma exposure.

About

After years of self-education, strategy development, mentorship, and trial-and-error, Renato Leonard Capelj began trading full-time and founded Physik Invest to detail his methods, research, and performance in the markets.

Capelj is also a Benzinga finance and technology reporter interviewing the likes of Shark Tank’s Kevin O’Leary, JC2 Ventures’ John Chambers, FTX’s Sam Bankman-Fried, and ARK Invest’s Catherine Wood, as well as a SpotGamma contributor developing insights around impactful options market dynamics.

Disclaimer

Physik Invest does not carry the right to provide advice.

In no way should the materials herein be construed as advice. Derivatives carry a substantial risk of loss. All content is for informational purposes only.
Categories
Commentary

Daily Brief For January 14, 2022

The Daily Brief is a free glimpse into the prevailing fundamental and technical drivers of U.S. equity market products. Join the 200+ that read this report daily, below!

Updates: Hi everyone! To start, I wanted to sincerely apologize for the below graphic being inaccurate, yesterday. Technology problems! I have since updated the graphic. My bad – egg on my face.

As always, for checks on quoted levels, and the like, just read on below. I try to build in as many redundancies to ensure we have the most information to trade on as possible.

If levels do not make sense, I assure you that they are either (A) updated in the attached real-time charts or (B) in the “Technical” section, below.

Feedback and questions are always encouraged/appreciated!

What Happened

Overnight, equity index futures rotated, lower, validating the end-of-day, knee-jerk price exploration. Commodities were mixed, bonds fell, and volatility was bid.

Ahead is data on retail sales and import prices (8:30 AM ET), industrial production and capacity utilization (9:15 AM ET), University of Michigan consumer sentiment figures and business inventories (10:00 AM ET), as well as some speech by New York Fed President John Williams (11:00 AM ET).

Note that in observance of Martin Luther King Jr. Day, markets will be closed on Monday, January 17.

There will be no commentary published, as a result.

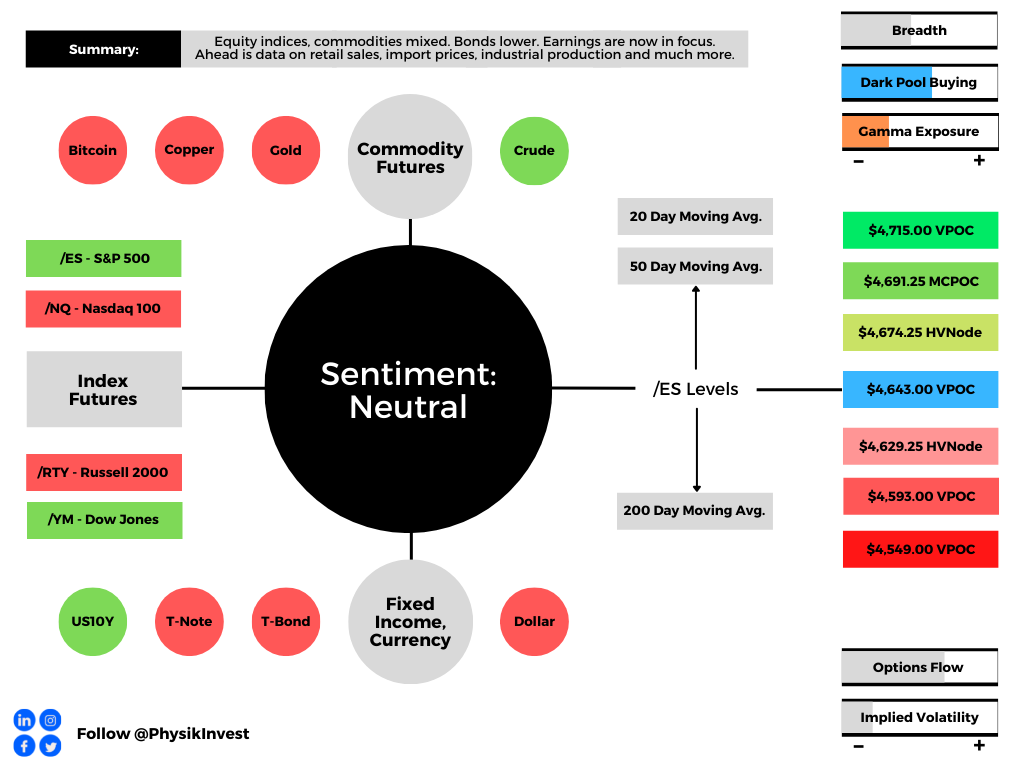
Graphic updated 6:30 AM ET. Sentiment Neutral if expected /ES open is inside of the prior day’s range. /ES levels are derived from the profile graphic at the bottom of the following section. Levels may have changed since initially quoted; click here for the latest levels. SqueezeMetrics Dark Pool Index (DIX) and Gamma (GEX) calculations are based on where the prior day’s reading falls with respect to the MAX and MIN of all occurrences available. A higher DIX is bullish. At the same time, the lower the GEX, the more (expected) volatility. Learn the implications of volatility, direction, and moneyness. SHIFT data used for S&P 500 (INDEX: SPX) options activity. Note that options flow is sorted by the call premium spent; if more positive, then more was spent on call options. Breadth reflects a reading of the prior day’s NYSE Advance/Decline indicator. VIX reflects a current reading of the CBOE Volatility Index (INDEX: VIX) from 0-100.

What To Expect

Fundamental: Markets sold heavy, yesterday, on the heels of hawkish commentary from monetary policymakers. 

The Federal Reserve’s Lael Brainard said the central bank would be in a position to start hiking rates as soon as it wound down bond purchases. This is to happen in March. 

“The (Fed’s policy-setting) committee has projected several hikes over the course of the year,” Brainard said in testimony. 

“Of course, we will be in a position to do that I think as soon as our purchases are terminated, and we’ll simply have to see what the data requires over the course of the year, and you know we started to discuss shrinking our balance sheet.”

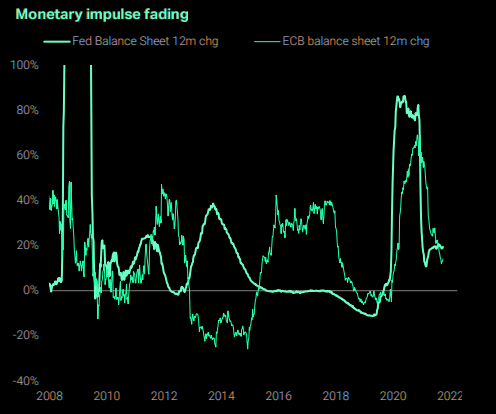
Graphic: Via The Market Ear, “balance sheet delta continues fading. The obvious question is, what is priced in?”

The Fed is moving more quickly to “save itself from having to hike too far and make rates so expensive that they slow down the economy.”

“We understand the Fed’s paralysis given the massive uncertainty coming out of the pandemic,” says Jim Bianco of Bianco Research. “However, the longer they wait to address inflation, the worse this conundrum will become.”

So, what’s the major concern with tightening and eventual balance sheet compression?

It has much to do with left-tail risks. Prevailing monetary frameworks and max liquidity promoted a large divergence in price from fundamentals. 

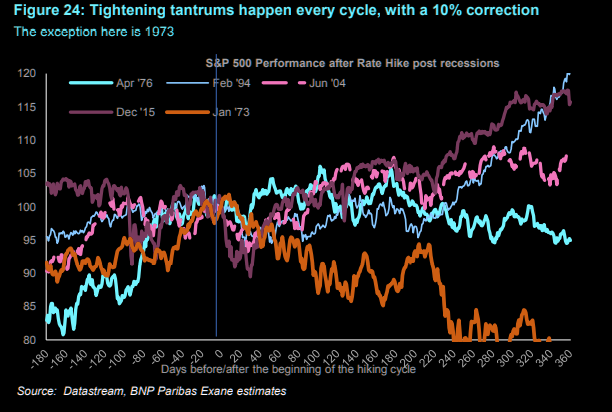
With expected monetary policy evolution, however, valuations are much less justifiable. Many institutions, as a result, see peaks in 2022, just as rate hikes are initiated.

Graphic: S&P 500 performance before and after rate hikes, via The Market Ear.

“The decline in stock prices is forecast to be orderly but it could turn into something worse,” Moody’s Corporation (NYSE: MCO) explains in reference to the growth of passive investing – the effect of increased moneyness among nonmonetary assets – and derivatives trading. 

“A drop in stock prices could trigger margin calls.”

Notwithstanding, as stated in the prior day’s, according to JPMorgan Chase & Co (NYSE: JPM) strategists, “[p]olicy tightening is likely to be gradual and at a pace, that risk assets should be able to handle, and is occurring in an environment of strong cyclical recovery.”

This is as Moody’s also notes that “there will still be a lot of excess liquidity—a little less than $1 trillion— when the central bank’s balance sheet does begin to decline.”

Note that over the next weeks, a focus will be the release of earnings, in the face of inflation, supply-chain challenges, and the like. We will cover this in later commentaries.

Positioning: Thursday’s trade did little to upset the narratives discussed in the “Positioning” section of this commentary over the past few days.

As stated, metrics that overlay options positioning and buying pressure (via short sales or liquidity provision on the market-making side) are positively skewed, albeit less so than before.

At the same time, we have trading desks suggesting “the conditions are not in place for a larger correction (>5%),” while volatility remains compressed, relatively so, at the index level.

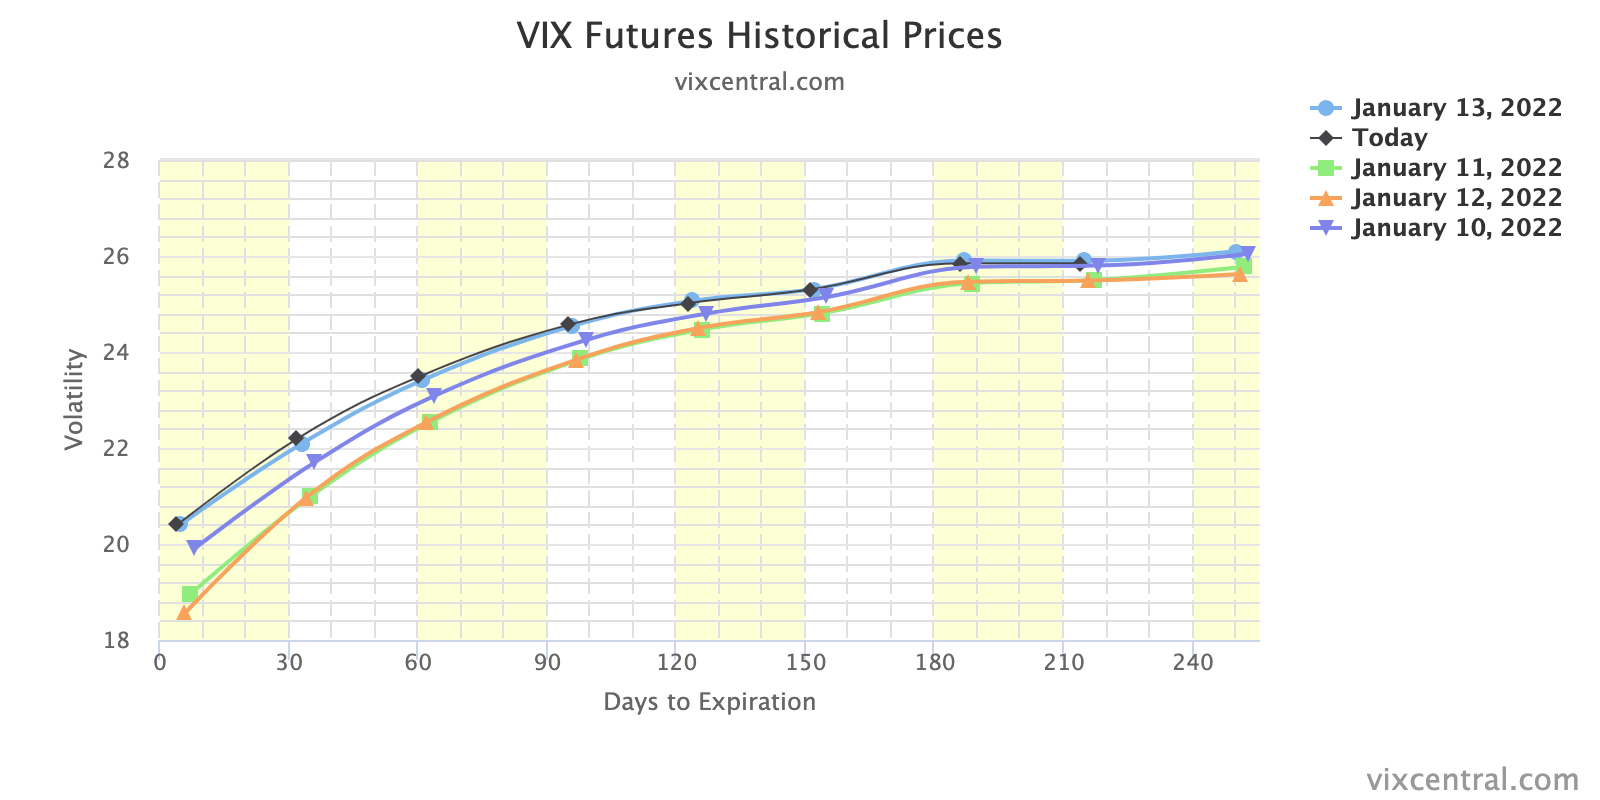
Graphic: Upward sloping VIX term structure. Per Interactive Brokers Group Inc (NASDAQ: IBKR), “An inverted curve, or even a flattish one, indicates a shortage of available volatility protection. We saw that as recently as a month ago, but not now.” Still, short-dated implied volatility is bid and this is taking away from the supportive “vanna” flows you would expect with declining volatility.

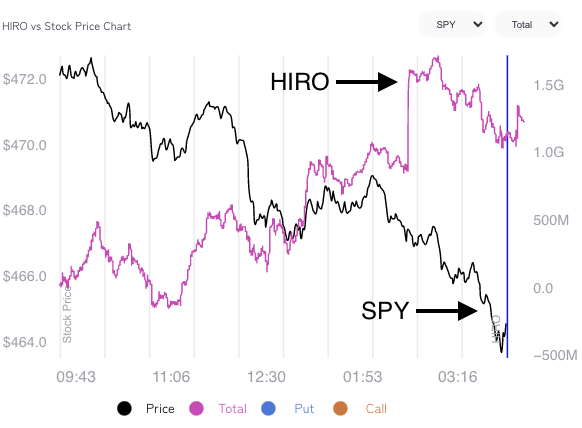
For instance, SpotGamma’s (beta) Hedging Impact of Real-Time options indicator suggested S&P 500 options activity diverged, markedly, from what underlying prices were doing. 

This could mean that Thursday’s news-driven sell-off did not change the status quo. 

Graphic: SpotGamma’s Hedging Impact of Real-Time Options (HIRO) indicator.

Obviously, elsewhere, in single stock land, conditions are different. Metrics suggest options were a contributing factor in the weakness of rate-sensitive names, yesterday.

This is as many products are in lower liquidity and short-gamma (wherein an options delta rises with stock prices rises and falls when stock prices drop) in which moves are more erratic.

Note: As a position’s delta rises with stock or index price rises, gamma (or how an option’s delta is expected to change given a change in the underlying) is added to the delta.

Therefore, coming into weighty options expiration, correlations may (continue to) be off (as that is the only reconciliation in an environment where, at the index level, hedging pressures are sticky, whereas elsewhere they aren’t).

After the large January monthly options expiration (OPEX), correlations ought to fall back in line.

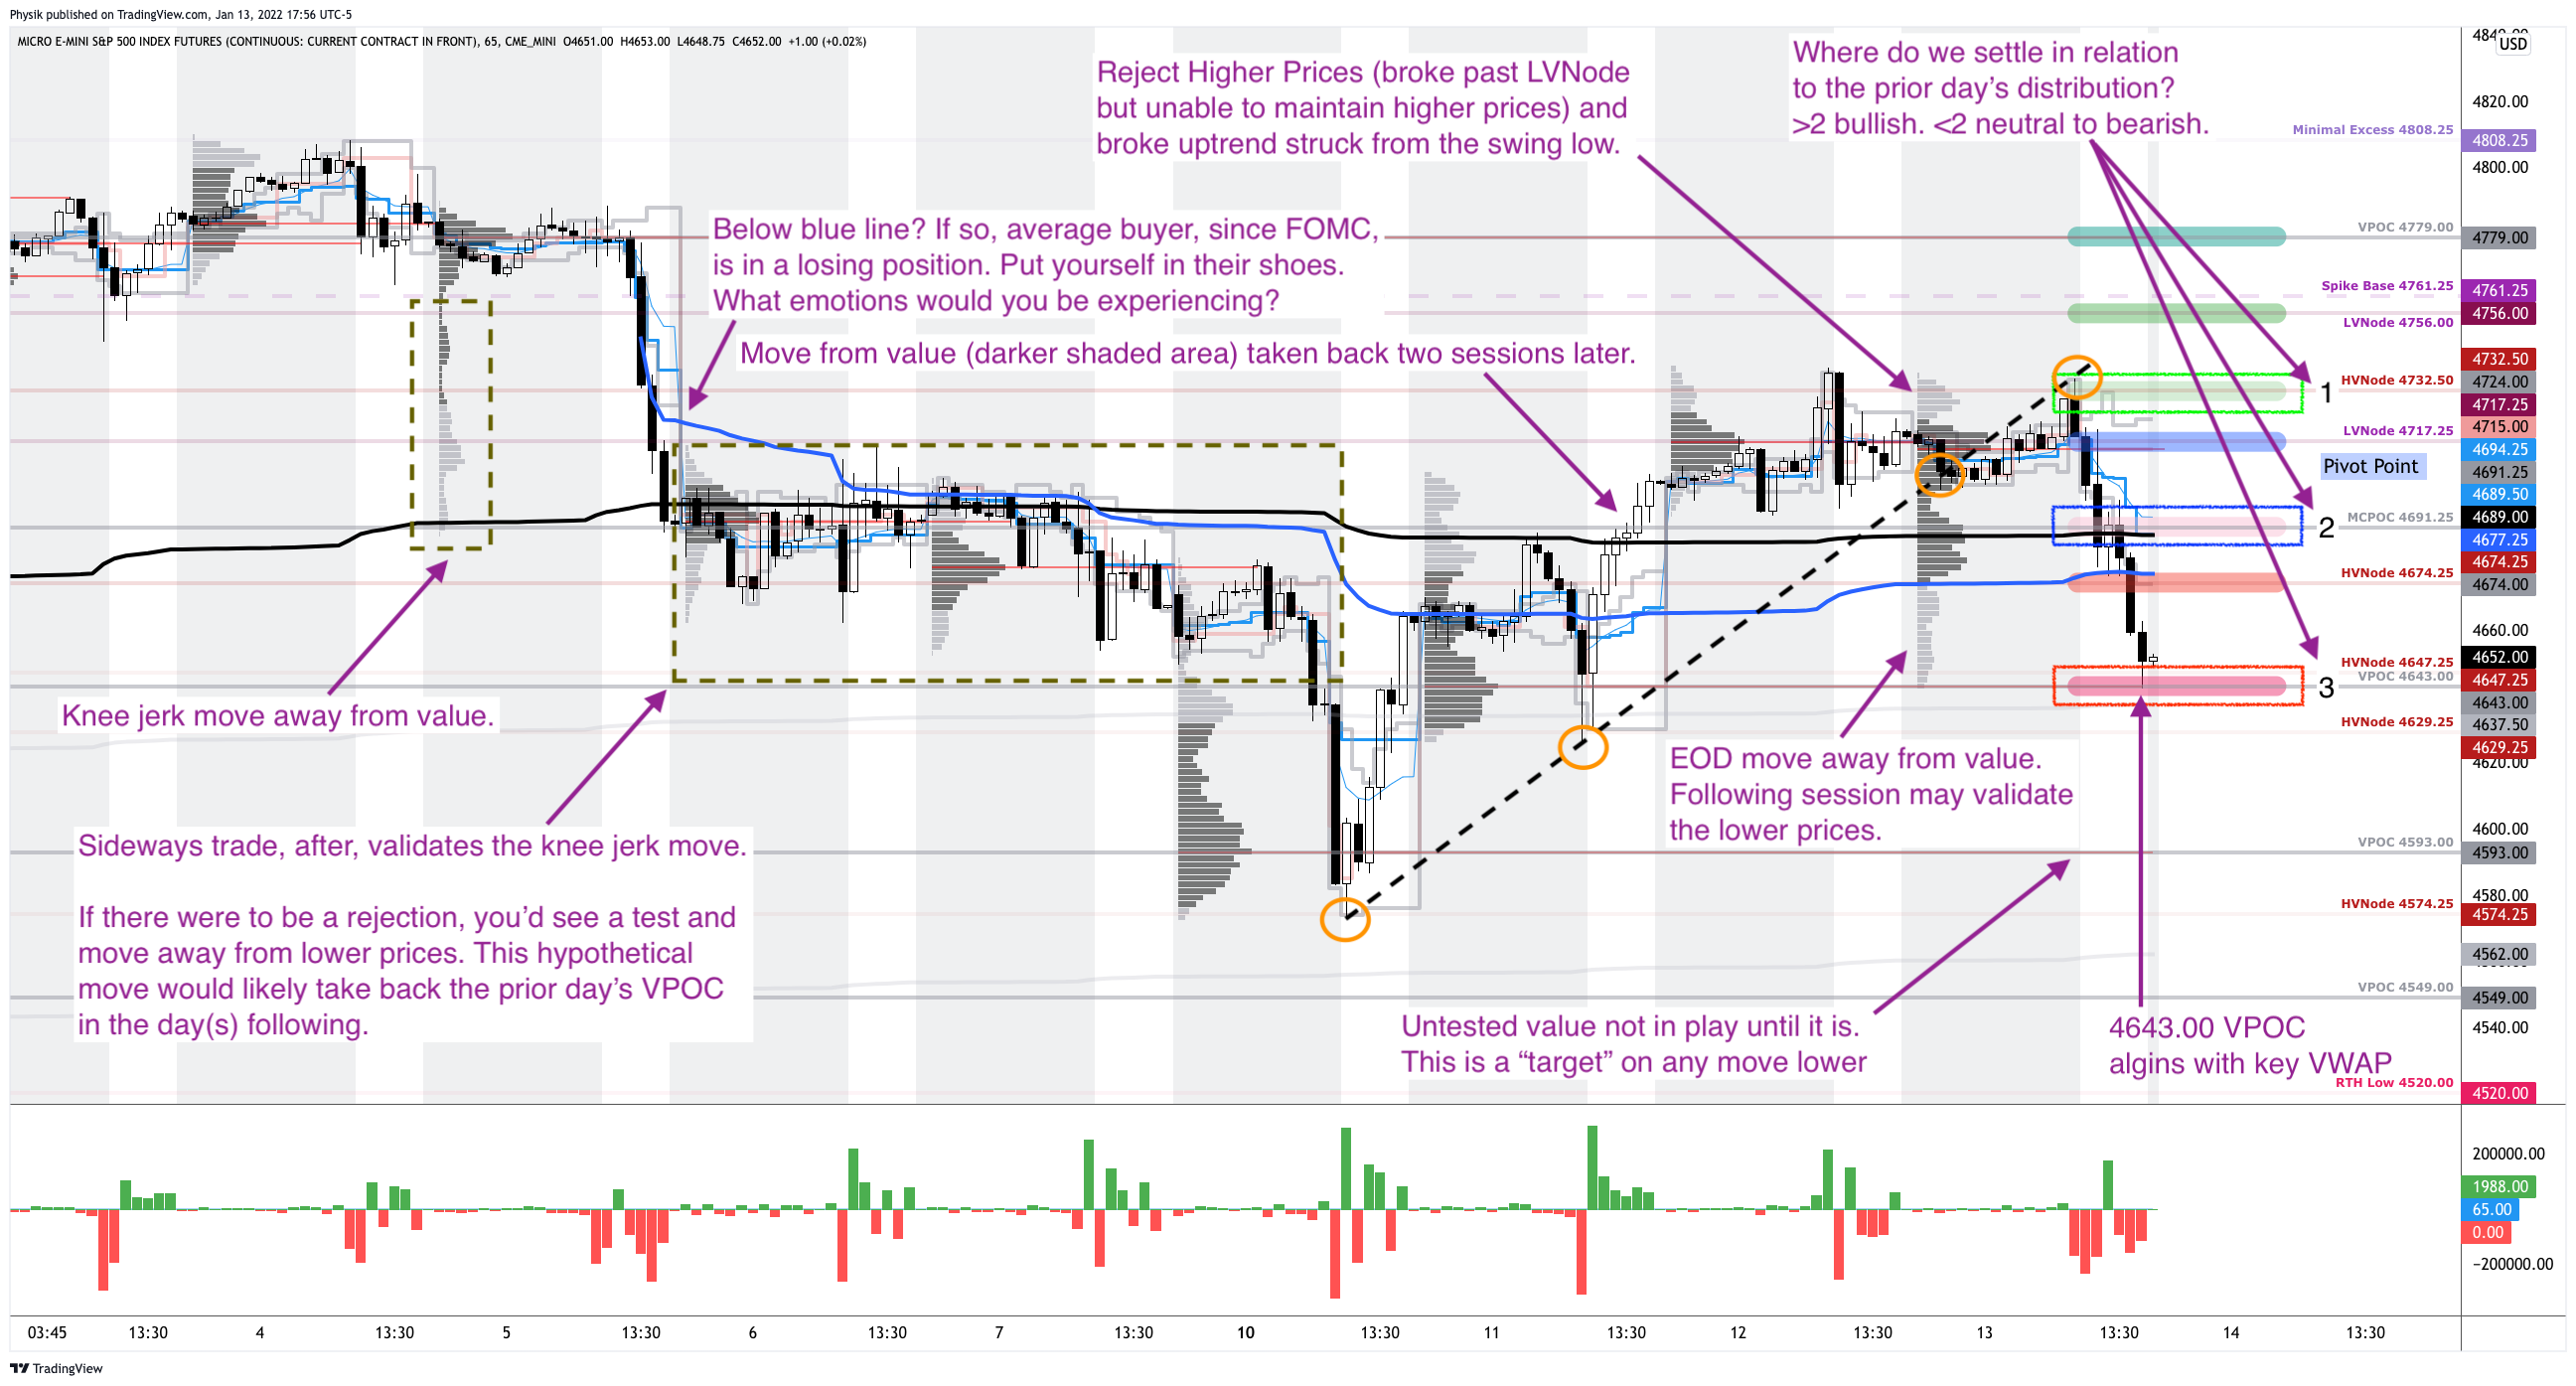
Technical: As of 6:30 AM ET, Friday’s regular session (9:30 AM – 4:00 PM ET), in the S&P 500, will likely open in the middle part of a balanced skewed overnight inventory, just of prior-range and -value, suggesting a limited potential for immediate directional opportunity.

In the best case, the S&P 500 trades higher; activity above the $4,643.00 untested point of control (VPOC) puts in play the $4,674.25 high volume area (HVNode). Initiative trade beyond the HVNode could reach as high as the $4,691.25 micro composite point of control (MCPOC) and $4,715.00 VPOC, or higher.

In the worst case, the S&P 500 trades lower; activity below the $4,643.00 VPOC puts in play the $4,629.25 HVNode. Initiative trade beyond the HVNode could reach as low as the $4,593.00 and $4,549.00 VPOC, or lower.

Click here to load today’s key levels into the web-based TradingView charting platform. Note that all levels are derived using the 65-minute timeframe. New links are produced, daily.
Graphic: 65-minute profile chart of the Micro E-mini S&P 500 Futures.

Considerations: Recent trade is more so dominated by visually-driven, weaker-handed momentum players that mechanically respond to key technical levels like the 20-day simple moving average or profile levels. 

Simply put, the other time frame participants are waiting for more information before committing to substantial expansion of range via large sales or buys.

Graphic: Despite selling, heavy, the S&P 500 is “sound” so to speak.

Definitions

Volume Areas: A structurally sound market will build on areas of high volume (HVNodes). Should the market trend for long periods of time, it will lack sound structure, identified as low volume areas (LVNodes). LVNodes denote directional conviction and ought to offer support on any test. 

If participants were to auction and find acceptance into areas of prior low volume (LVNodes), then future discovery ought to be volatile and quick as participants look to HVNodes for favorable entry or exit.

POCs: POCs are valuable as they denote areas where two-sided trade was most prevalent in a prior day session. Participants will respond to future tests of value as they offer favorable entry and exit.

MCPOCs: POCs are valuable as they denote areas where two-sided trade was most prevalent over numerous day sessions. Participants will respond to future tests of value as they offer favorable entry and exit.

Options Expiration (OPEX): Traditionally, option expiries mark an end to pinning (i.e, the theory that market makers and institutions short options move stocks to the point where the greatest dollar value of contracts will expire) and the reduction dealer gamma exposure.

Inversion Of VIX Futures Term Structure: Longer-dated VIX expiries are less expensive; is a warning of elevated near-term risks for equity market stability.

Volume-Weighted Average Prices (VWAPs): A metric highly regarded by chief investment officers, among other participants, for quality of trade. Additionally, liquidity algorithms are benchmarked and programmed to buy and sell around VWAPs.

About

After years of self-education, strategy development, mentorship, and trial-and-error, Renato Leonard Capelj began trading full-time and founded Physik Invest to detail his methods, research, and performance in the markets.

Capelj is also a Benzinga finance and technology reporter interviewing the likes of Shark Tank’s Kevin O’Leary, JC2 Ventures’ John Chambers, FTX’s Sam Bankman-Fried, and ARK Invest’s Catherine Wood, as well as a SpotGamma contributor developing insights around impactful options market dynamics.

Disclaimer

Physik Invest does not carry the right to provide advice.

In no way should the materials herein be construed as advice. Derivatives carry a substantial risk of loss. All content is for informational purposes only.
Categories
Commentary

Daily Brief For January 13, 2022

The Daily Brief is a free glimpse into the prevailing fundamental and technical drivers of U.S. equity market products. Join the 200+ that read this report daily, below!

What Happened

Overnight, equity index futures diverged from commodity and bond products. Measures of implied volatility showed signs of bottoming. The dollar continued a plunge. 

Overall, the stance is neutral as the “hottest U.S. inflation in 39 years sets up March rate liftoff.”

Ahead is data on jobless claims and producer prices (8:30 AM ET). The Federal Reserve’s Lael Brainard will have a confirmation hearing (10:00 AM ET), Tom Barkin will speak later (12:00 PM ET), with Charles Evans speaking last (1:00 PM ET).

Graphic updated 5:55 AM ET. Sentiment Neutral if expected /ES open is inside of the prior day’s range. /ES levels are derived from the profile graphic at the bottom of the following section. Levels may have changed since initially quoted; click here for the latest levels. SqueezeMetrics Dark Pool Index (DIX) and Gamma (GEX) calculations are based on where the prior day’s reading falls with respect to the MAX and MIN of all occurrences available. A higher DIX is bullish. At the same time, the lower the GEX, the more (expected) volatility. Learn the implications of volatility, direction, and moneyness. SHIFT data used for S&P 500 (INDEX: SPX) options activity. Note that options flow is sorted by the call premium spent; if more positive, then more was spent on call options. Breadth reflects a reading of the prior day’s NYSE Advance/Decline indicator. VIX reflects a current reading of the CBOE Volatility Index (INDEX: VIX) from 0-100.

What To Expect

Fundamental: The consumer price index printed 7%, rising 0.5% from November. 

Much of the increases were attributed to shelter, used vehicles, and food.

With unemployment falling and inflation proving stubborn, monetary policymakers have been emboldened to tighten, raising rates in March and (later) shrinking the balance sheet. 

“In terms of where the Fed is on their dual mandate — inflation and the labor market — they’re basically there,” Michael Gapen, chief U.S. economist at Barclays Plc (NYSE: BCS), said on Bloomberg Television. “I don’t really think anything stops them going in March except one of these kind of outlier events. I think they’re ready.”

Market reaction was muted, mostly, with commodities bearing the brunt of the bullishness.

The calm reaction in equities, ahead of the earnings season, and bonds “showed that there was nothing particularly surprising in the [CPI] report, and that traders were confident that prices already covered the risks,” Bloomberg’s John Authers explained

“Fed funds futures barely budged, leaving a first rate hike in March almost fully priced. As they did before these numbers came out, dealers feel certain that the Fed will hike at least three times this year, while a fourth in December is seen as a 50-50 call.”

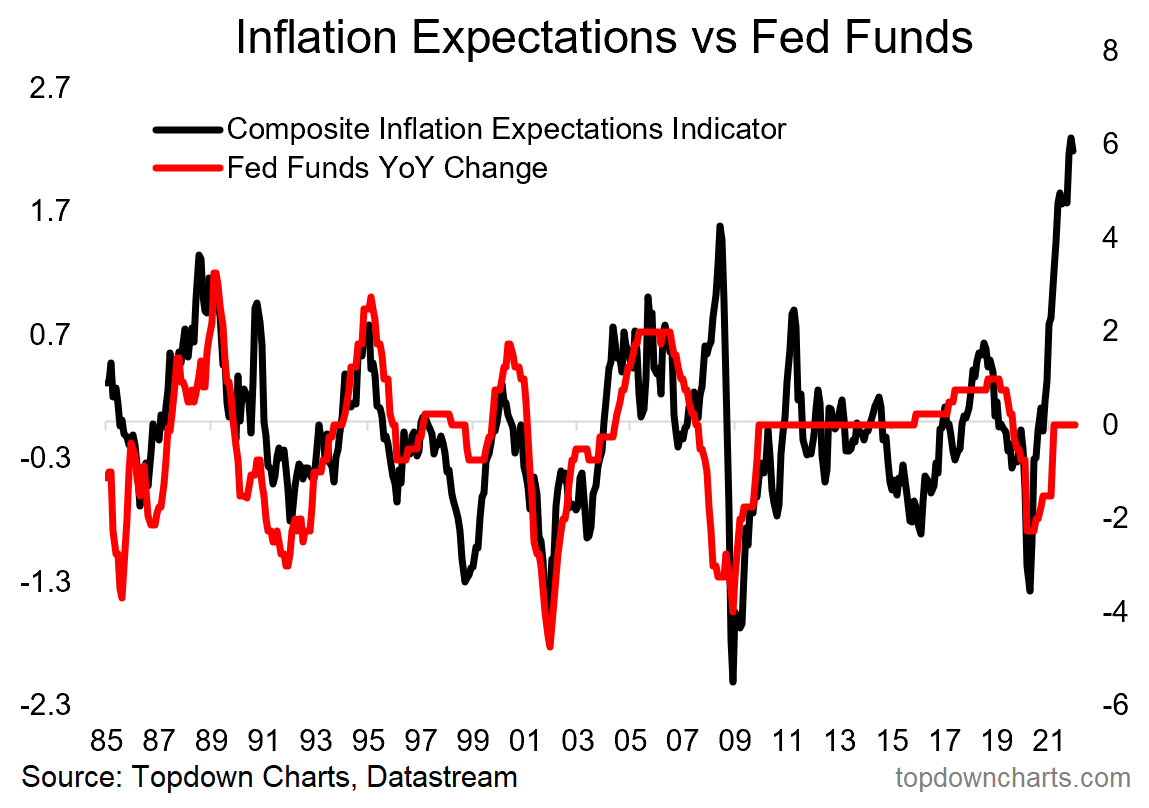
Graphic: Via Callum Thomas of Topdown Charts, “With the composite measure of inflation expectations at 40-year highs it’s fair to suggest that the Fed may have some catching up to do as it kicks off the transition away from easing.”

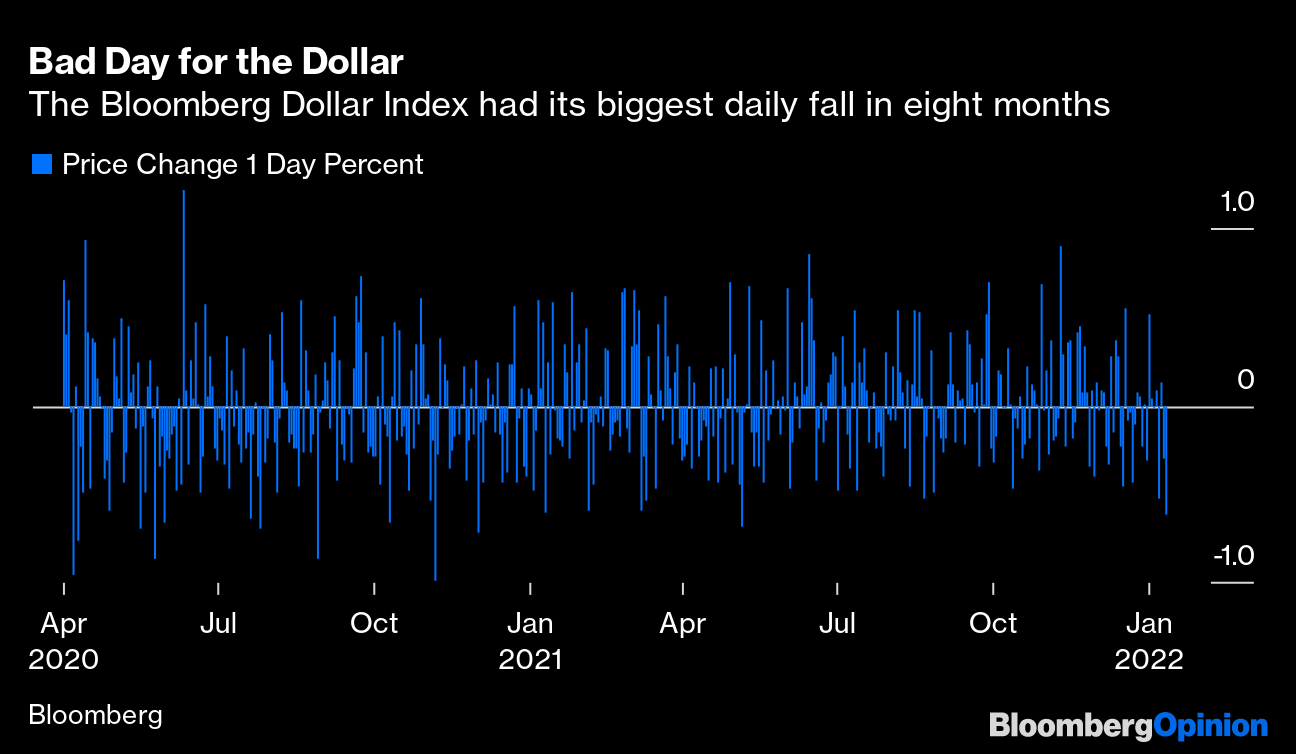
As an aside, there was a big drop in the dollar. In raising rates, currencies ought to attract money. Right? 

“[T]he combination of another really bad inflation number and an insouciant bond market response has been enough to knock the dollar off course. Many factors drive currencies, but this is consistent with a view that the rate hikes already priced in, and supporting the dollar until now, won’t be enough to head off inflation.”

Graphic: Via Bloomberg, “a weaker dollar makes imports more expensive and increases inflation.”

Positioning: On January 7, this commentary suggested metrics of options positioning, versus buying pressure (measured via short sales or liquidity provision on the market-making side) were positively skewed, even more so than before.

What followed was upside resolve, exacerbated in part by the compression in volatility and unwind of hedges to destabilizing customer options activity (i.e., put buying and call selling).

What now?

Scott Rubner of Goldman Sachs Group Inc (NYSE: GS) had the following to say.

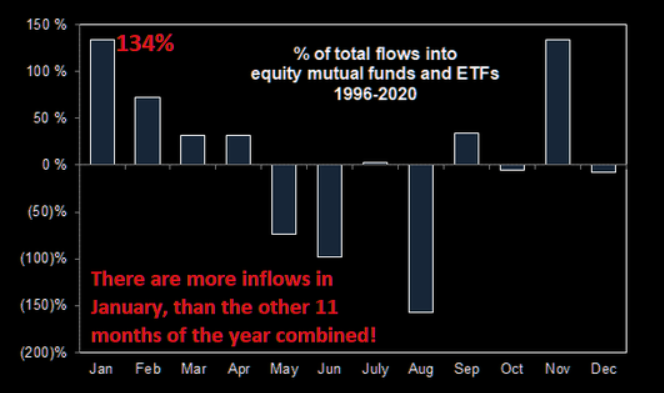
“I am in the process of writing flow-of-funds note for February. My gut tells me to be bearish in February for when the ‘January Inflows’ run out. However, I just re-ran the CURRENT SET-UP for January and the conditions are not in place for a larger correction (>5%). Said another way, I want to be bearish, but this is the consensus. Investors are short, hedges are too big, everyone has on the puts, sentiment is negative (lowest in 86 weeks), I think everyone is already looking for the correction, and this may shift into buying dip alpha.”

So, what does all that mean? 

Demand for downside protection, as already touched on, coincided with customers indirectly taking liquidity and destabilizing the market as the participant short the put sold underlying to neutralize risk.

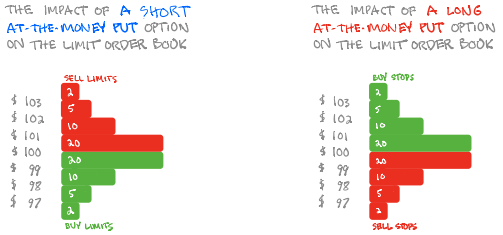
Graphic: SqueezeMetrics details the implications of customer activity in the options market, on the underlying’s order book. For instance, in selling a put, customers add liquidity and stabilize the market. How? The market maker long the put will buy (sell) the underlying to neutralize directional risk as price falls (rises).

Expansion in implied volatility increases the directional exposure of that protection. 

This is good for put buyers and bad for put sellers, simply put. As a result, in weakness, hedging of these contracts pressures markets further, making for violent up and down trade.

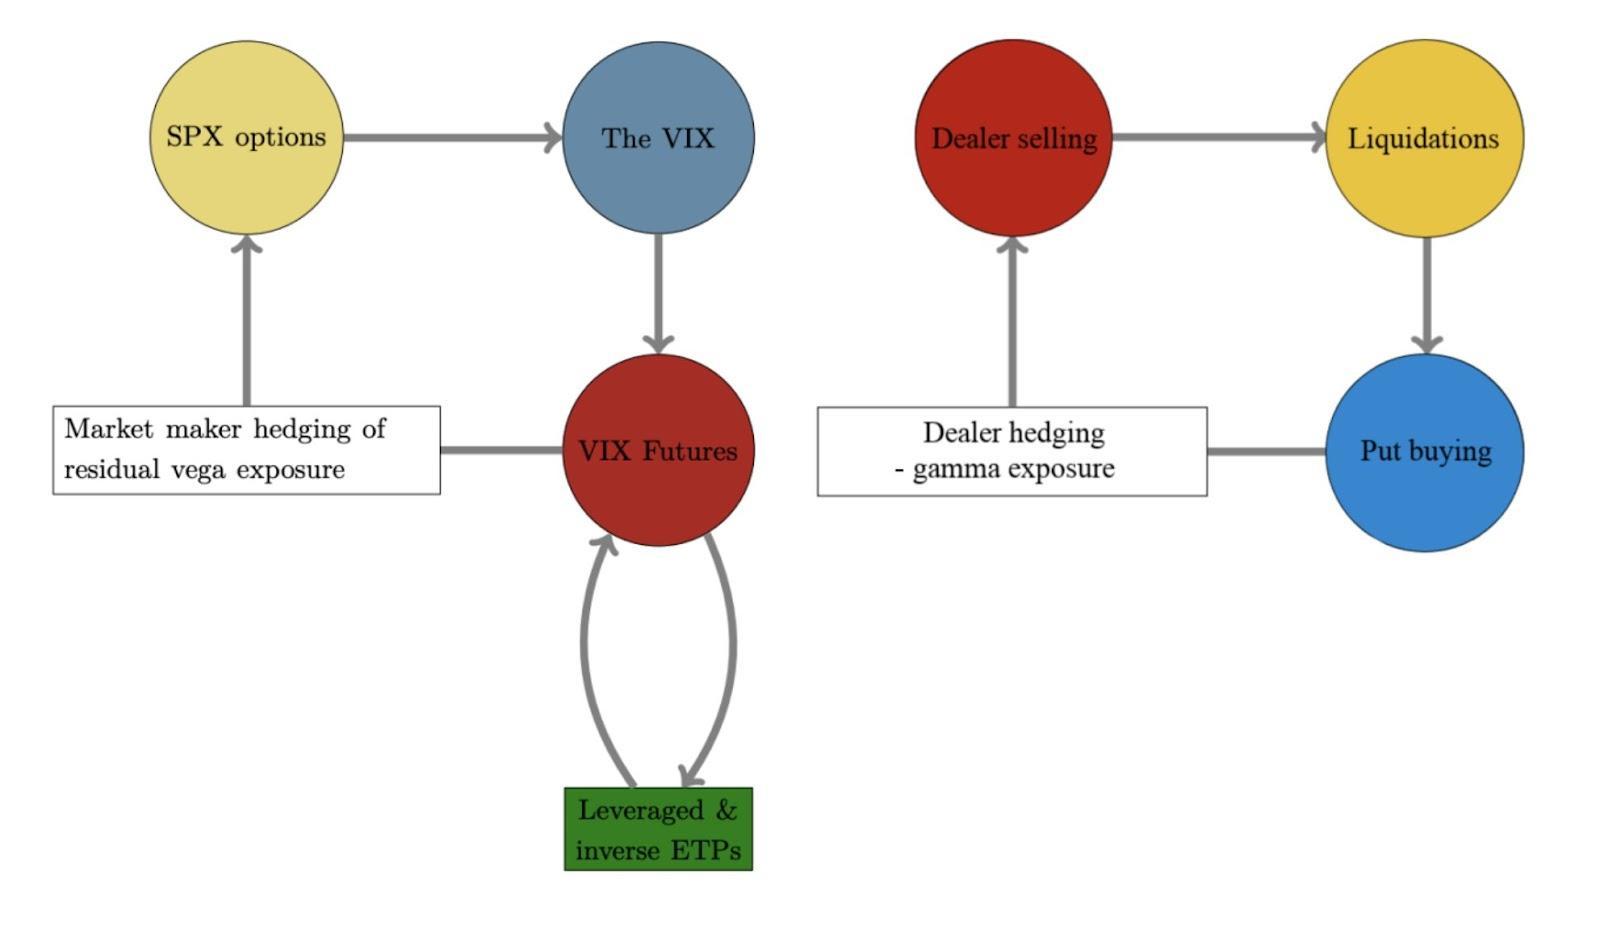
Graphic: The “Biggest tail risk to SPX isn’t any macro data/virus/war but its own options market.”

As volatility contracts, however, and underlying prices rise, the directional exposure of protection declines. This is bad for put buyers and good for put sellers. In offsetting this decline in directional risk, counterparties will unwind earlier hedges to bearish customer options activity. 

The unwind of these hedges, as SpotGamma explains, “likely invokes supportive dealer hedging flows with respect to time (‘charm’) and volatility (‘vanna’).”

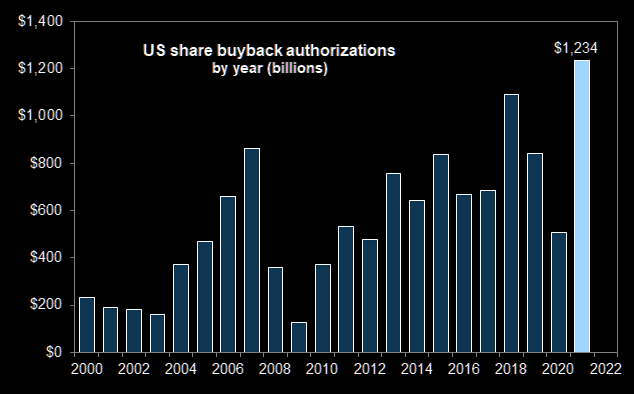
Couple this flow with strong passive buying support, as evidenced by metrics quoted elsewhere in this newsletter (e.g., DIX), the odds that markets continue to rally (or trade sideways, at least, short-term), in the face of “above-trend growth” and a record year of buybacks, as well as other things, seem good.

Graphic: Taken from The Market Ear. Goldman Sachs’ Scott Rubner: “The GS corporate buyback desk expects a record year for executions of $975B or >$4B per day.”

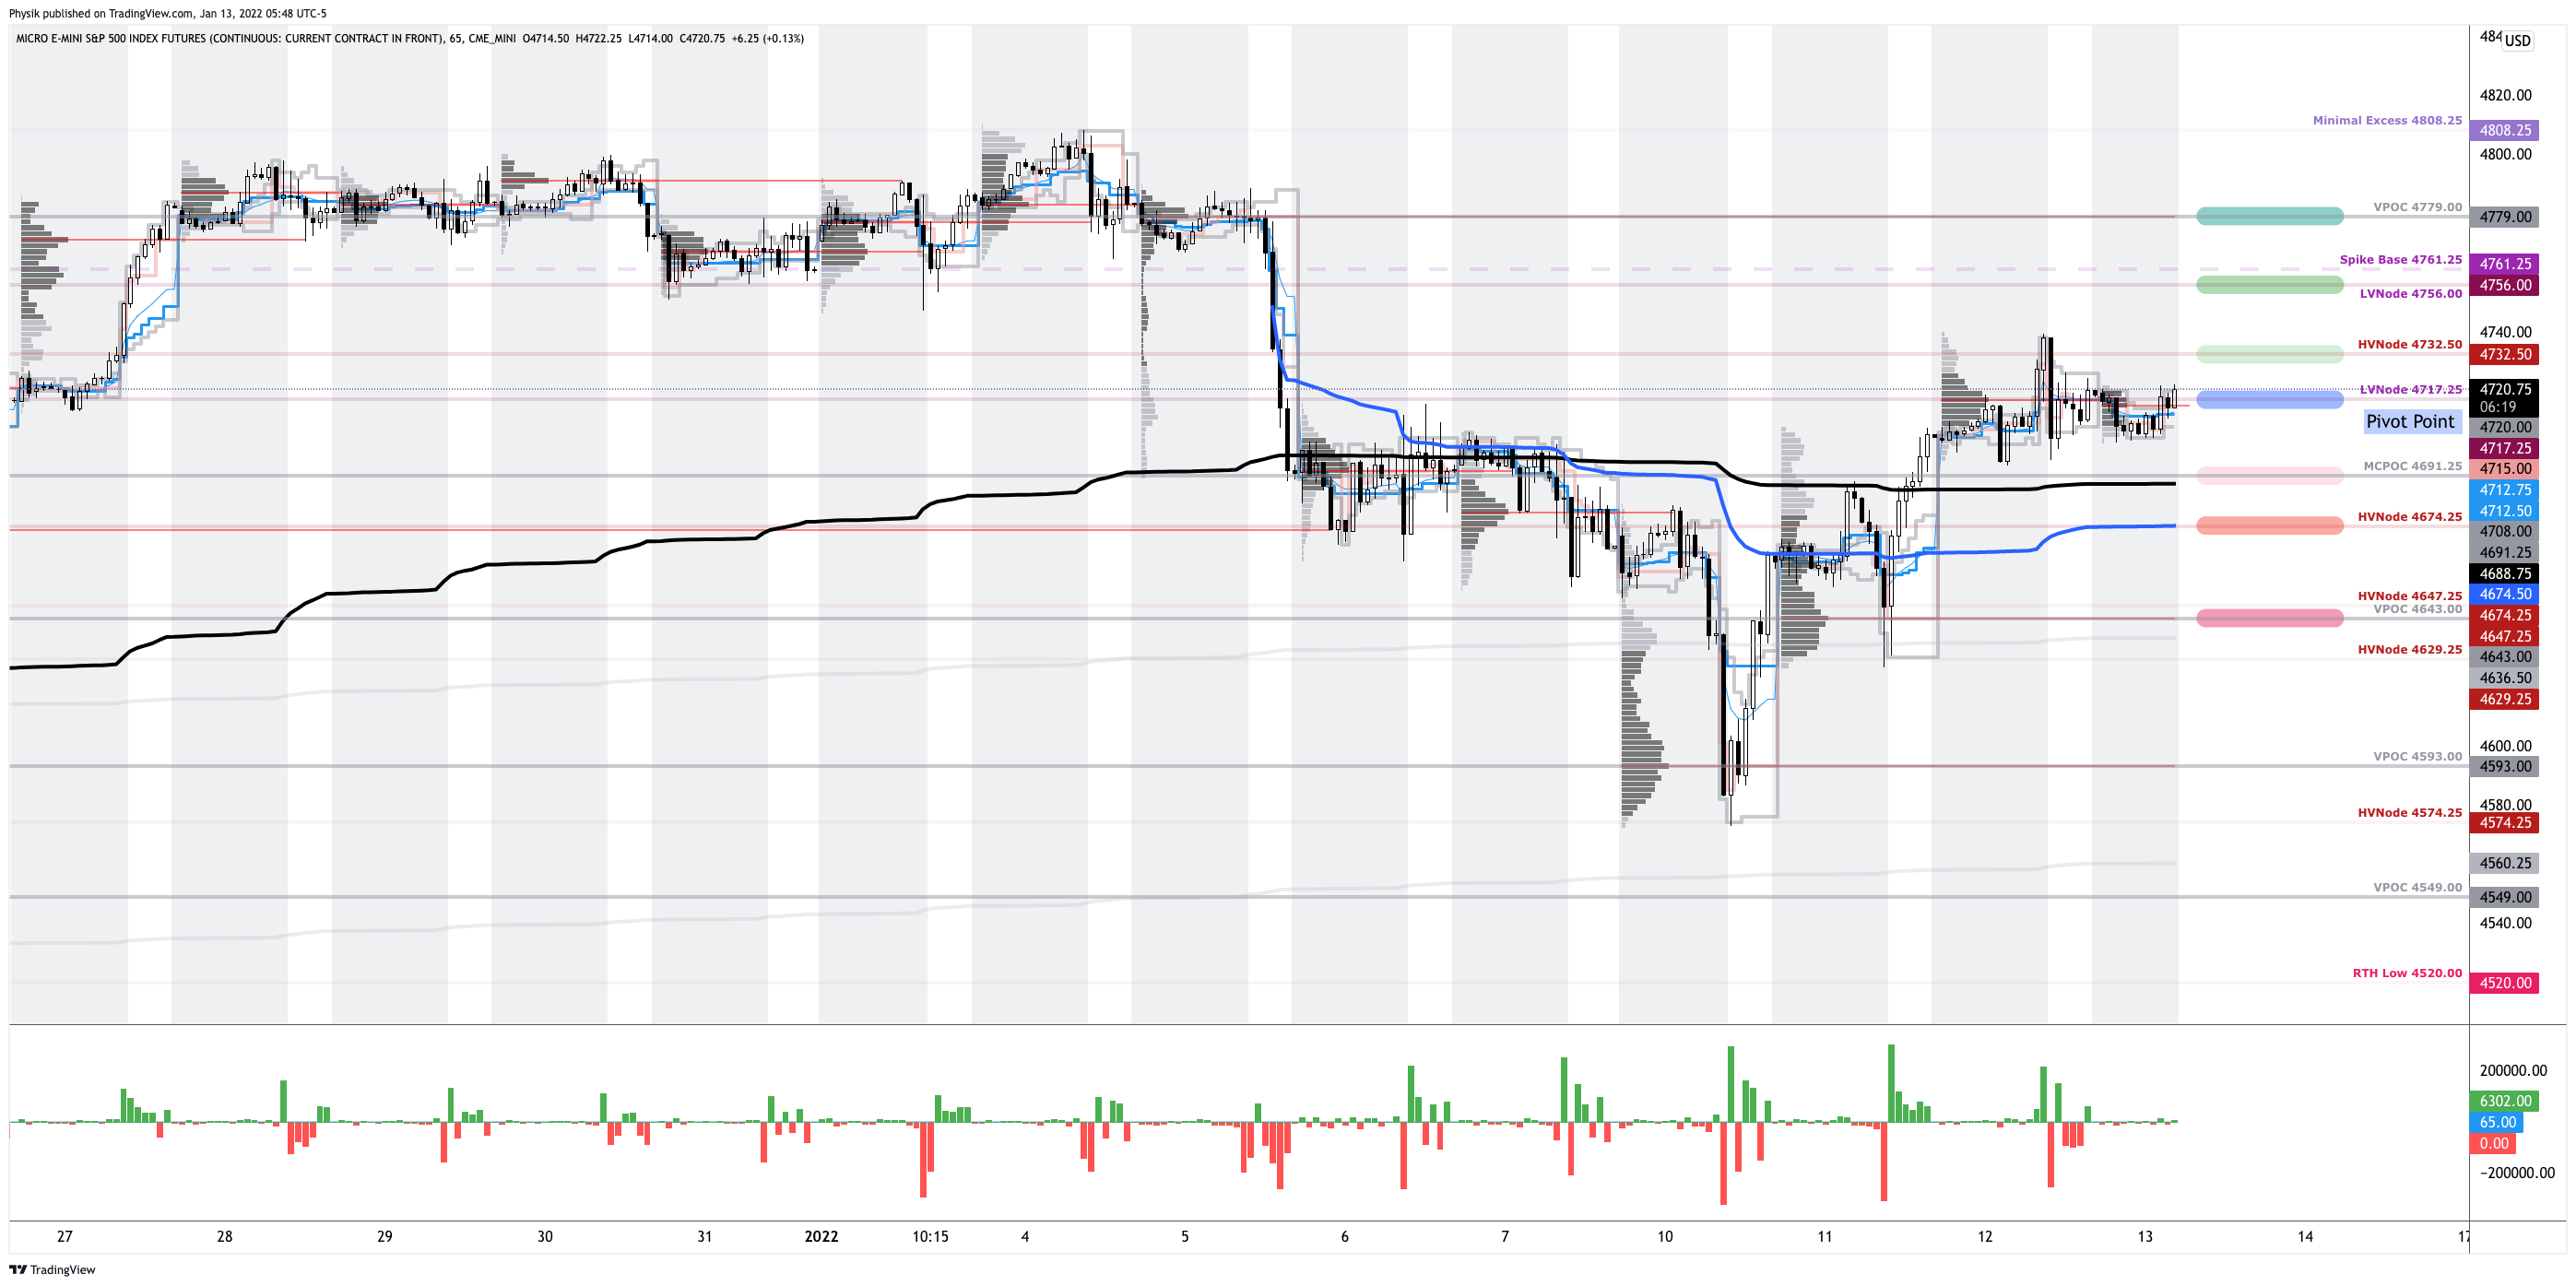
Technical: As of 5:55 AM ET, Thursday’s regular session (9:30 AM – 4:00 PM ET), in the S&P 500, will likely open in the middle part of a negatively skewed overnight inventory, inside of prior-range and -value, suggesting a limited potential for immediate directional opportunity.

In the best case, the S&P 500 trades higher; activity above the $4,717.25 low volume area (LVNode) puts in play the $4,732.50 high volume area (HVNode). Initiative trade beyond the HVNode could reach as high as the $4,756.00 LVNode and $4,779.00 untested point of control (VPOC), or higher.

In the worst case, the S&P 500 trades lower; activity below the $4,717.25 LVNode puts in play the $4,691.25 micro composite point of control (MCPOC). Initiative trade beyond the MCPOC could reach as low as the $4,674.25 HVNode and $4,643.00 VPOC, or lower.

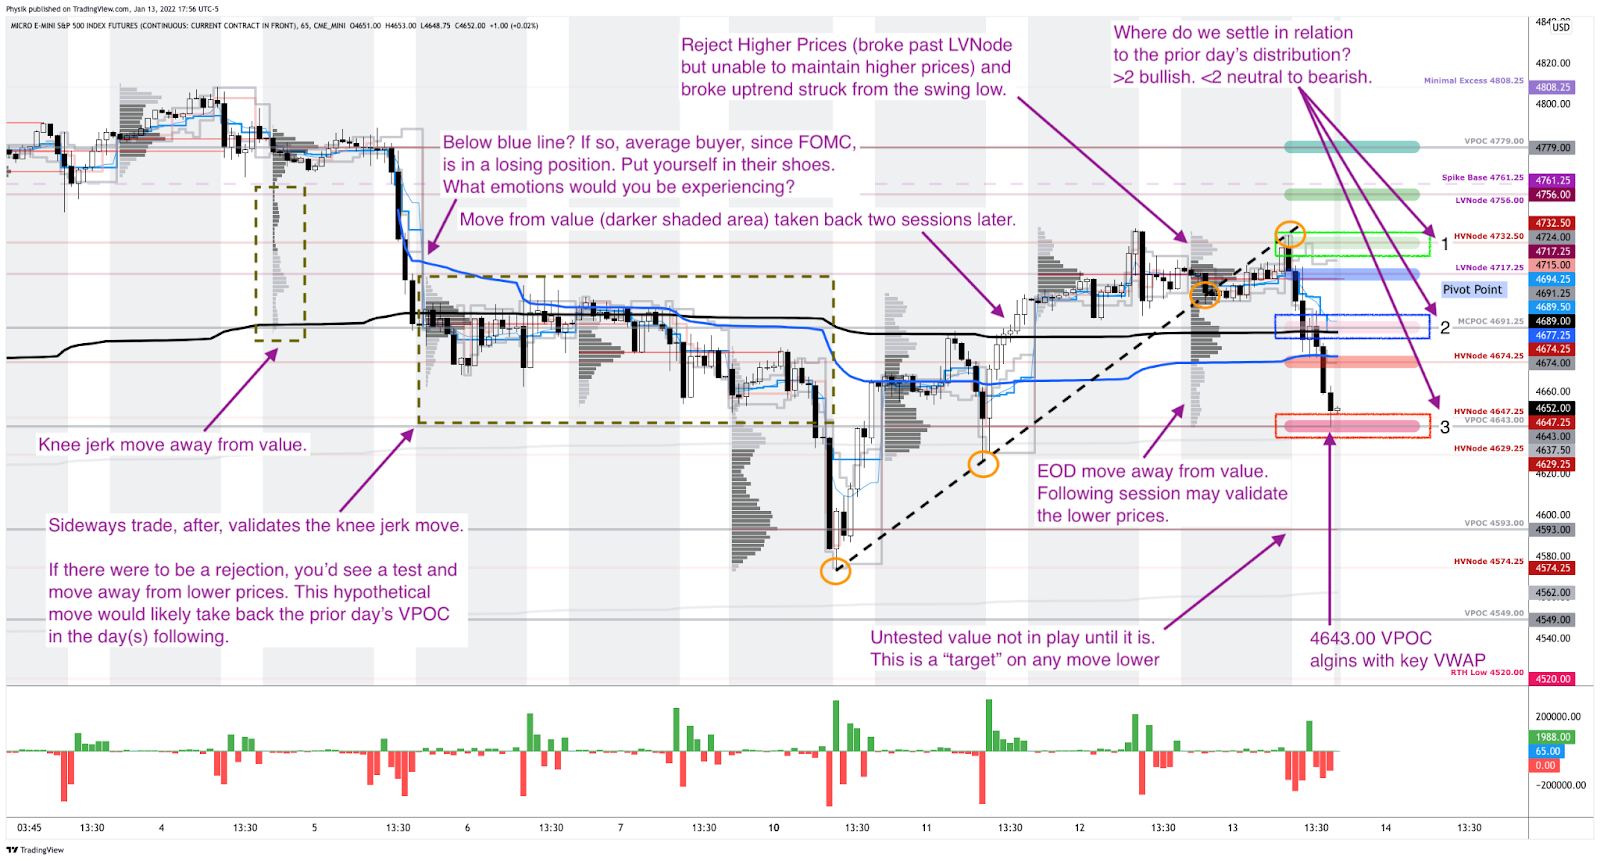
Considerations: As evidenced by the volume-weighted average price anchored from the release of FOMC minutes (blue color, below), the average buyer, since that, is winning.

Click here to load today’s key levels into the web-based TradingView charting platform. Note that all levels are derived using the 65-minute timeframe. New links are produced, daily.
Graphic: 65-minute profile chart of the Micro E-mini S&P 500 Futures.

What People Are Saying

Definitions

Volume Areas: A structurally sound market will build on areas of high volume (HVNodes). Should the market trend for long periods of time, it will lack sound structure, identified as low volume areas (LVNodes). LVNodes denote directional conviction and ought to offer support on any test. 

If participants were to auction and find acceptance into areas of prior low volume (LVNodes), then future discovery ought to be volatile and quick as participants look to HVNodes for favorable entry or exit.

DIX: For every buyer is a seller (usually a market maker). Using DIX — which is derived from short sales (i.e., liquidity provision on the market-making side) — we can measure buying pressure.

Gamma: Gamma is the sensitivity of an option to changes in the underlying price. Dealers that take the other side of options trades hedge their exposure to risk by buying and selling the underlying. When dealers are short-gamma, they hedge by buying into strength and selling into weakness. When dealers are long-gamma, they hedge by selling into strength and buying into weakness. The former exacerbates volatility. The latter calms volatility.

Vanna: The rate at which the delta of an option changes with respect to volatility.

Charm: The rate at which the delta of an option changes with respect to time.

Options: If an option buyer was short (long) stock, he or she would buy a call (put) to hedge upside (downside) exposure. Option buyers can also use options as an efficient way to gain directional exposure.

POCs: POCs are valuable as they denote areas where two-sided trade was most prevalent in a prior day session. Participants will respond to future tests of value as they offer favorable entry and exit.

MCPOCs: POCs are valuable as they denote areas where two-sided trade was most prevalent over numerous day sessions. Participants will respond to future tests of value as they offer favorable entry and exit.

Options Expiration (OPEX): Traditionally, option expiries mark an end to pinning (i.e, the theory that market makers and institutions short options move stocks to the point where the greatest dollar value of contracts will expire) and the reduction dealer gamma exposure.

Volume-Weighted Average Prices (VWAPs): A metric highly regarded by chief investment officers, among other participants, for quality of trade. Additionally, liquidity algorithms are benchmarked and programmed to buy and sell around VWAPs.

Rates: Low rates have to potential to increase the present value of future earnings making stocks, especially those that are high growth, more attractive. To note, inflation and rates move inversely to each other. Low rates stimulate demand for loans (i.e., borrowing money is more attractive).

About

After years of self-education, strategy development, mentorship, and trial-and-error, Renato Leonard Capelj began trading full-time and founded Physik Invest to detail his methods, research, and performance in the markets.

Capelj is also a Benzinga finance and technology reporter interviewing the likes of Shark Tank’s Kevin O’Leary, JC2 Ventures’ John Chambers, FTX’s Sam Bankman-Fried, and ARK Invest’s Catherine Wood, as well as a SpotGamma contributor developing insights around impactful options market dynamics.

Disclaimer

Physik Invest does not carry the right to provide advice.

In no way should the materials herein be construed as advice. Derivatives carry a substantial risk of loss. All content is for informational purposes only.
Categories
Commentary

Daily Brief For January 10, 2022

The Daily Brief is a free glimpse into the prevailing fundamental and technical drivers of U.S. equity market products. Join the 200+ that read this report daily, below!

What Happened

Overnight, equity index futures auctioned lower alongside bonds and most commodities.

Ahead is data on wholesale inventories (10:00 AM ET) and Fed-speak (12:00 PM ET).

Graphic updated 6:30 AM ET. Sentiment Neutral if expected /ES open is inside of the prior day’s range. /ES levels are derived from the profile graphic at the bottom of the following section. Levels may have changed since initially quoted; click here for the latest levels. SqueezeMetrics Dark Pool Index (DIX) and Gamma (GEX) calculations are based on where the prior day’s reading falls with respect to the MAX and MIN of all occurrences available. A higher DIX is bullish. At the same time, the lower the GEX, the more (expected) volatility. Learn the implications of volatility, direction, and moneyness. SHIFT data used for S&P 500 (INDEX: SPX) options activity. Note that options flow is sorted by the call premium spent; if more positive, then more was spent on call options. Breadth reflects a reading of the prior day’s NYSE Advance/Decline indicator. VIX reflects a current reading of the CBOE Volatility Index (INDEX: VIX) from 0-100.

What To Expect

Fundamental: Improvements in the U.S. labor market and increased hawkishness from the Federal Reserve are some of the factors playing into a recent rotation.

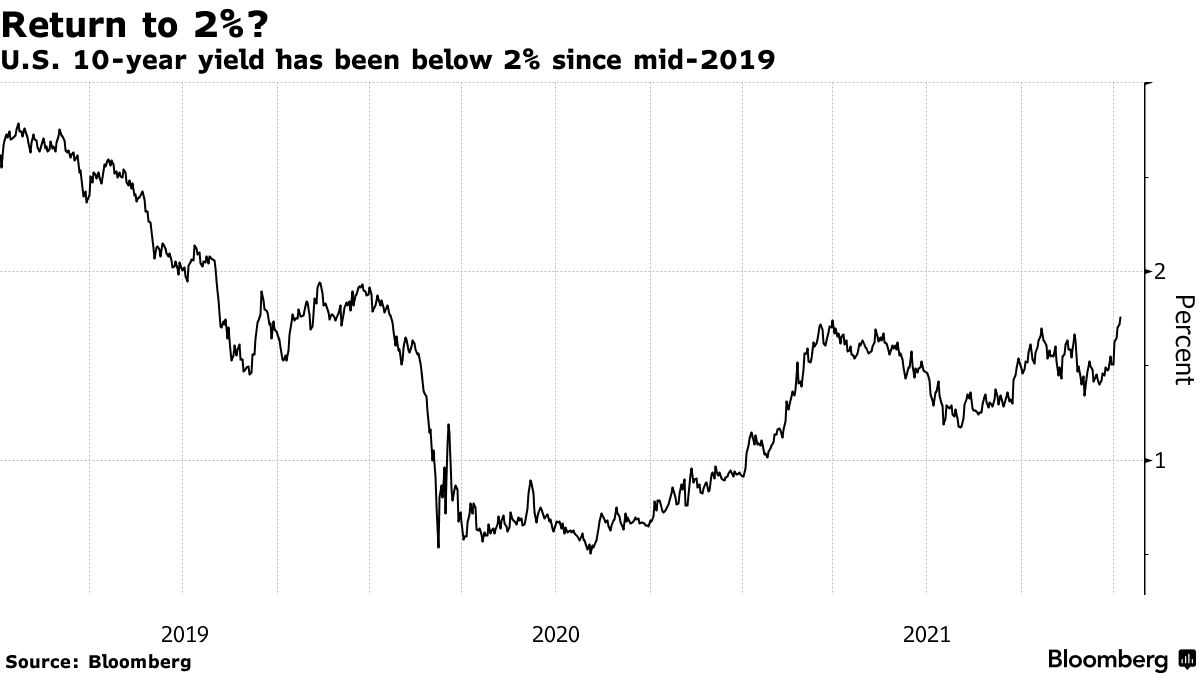
With yields climbing and the 10-year benchmark breaking out toward 2.00%, there’s been a clear move out of growth- and innovation-names to value- and cyclical-type stocks.

Graphic: Via Bloomberg, “Markets face increasing volatility as investors grapple with how to reprice assets as the pandemic liquidity that helped drive equities to record highs is withdrawn.”

This is just as Goldman Sachs Group Inc (NYSE: GS) announced that it expects four interest rate hikes this year (in MAR, JUN, SEP, and DEC) and a balance sheet runoff to begin in July.

“Valuations are at historical highs, companies are raising billions based on fairy dust, and the Fed is signaling a tightening cycle,” said Jason Goepfert of Sundial Capital Research. “All of these are scaring investors that we’re on the cusp of a repeat of 1999-2000.”

Why are higher rates scary? 

Though higher rates are to fend off inflation, they have the potential to decrease the present value of future earnings making stocks (especially high growth) less attractive.

For context, at no other point since the dot-com bubble has so many constituents have fallen while the index was so close to its peak.

Graphic: From Sundial Capital Research. Posted by Bloomberg.

Despite participation continuing to narrow, equities should be able to withstand rate hikes and balance sheet runoff amidst above-trend growth and a looming rebound in some international markets, JPMorgan Chase & Co (NYSE: JPM) adds.

“As long as yields are rising for the right reasons, including better growth, we believe that equities should be able to tolerate the move,” a JPMorgan note said. 

“The rise in real rates should not be hurting equity markets, or economic activity, at least until they move into positive territory, or even as long as real rates are below the real potential growth.”

Positioning: As discussed in Friday’s detailed write-up, bonds and equities are down.

That’s due in part to the bond-stock relationship being upended as a result of monetary tightening to combat inflation.

“At stake are trillions of dollars that are managed at risk parity funds, balanced mutual funds, and pension funds that follow the framework of 60/40 asset allocation.”

As explained Friday, we mention this (broken) relationship as it forces us (participants, in general) to look elsewhere for protection. 

The growing asset class of volatility, so to speak, is that protection. Investors are aware of both the protective and speculative efficiency afforded to them by options and that is the primary reason option volumes are so comparable to stock volumes, now.

If interested, read this primer on “Trading Volatility, Correlation, Term Structure, and Skew.”

With option volumes higher, related hedging flows can represent an increased share of volume in underlying stocks; the correlation of stock moves, versus options activity, is pronounced.

All that means is that we can look to the options market for context on where to next.

According to options modeling and data service SpotGamma (learn more here), the S&P 500, in particular, based on an earlier demand for protection is set up for higher volatility.

“End-of-week compression in volatility, in spite of a high-volatility, negative-gamma regime characterized by dealer hedging that exacerbates movement, sets markets up for instability in case of even lower prices and demand for protection.”

Why? 

Knowing that demand for downside protection coincides with customers indirectly taking liquidity and destabilizing the market as the participant short the put will sell underlying to neutralize risk, participants ought to keep their eye out on whether implied volatility expands or contracts.

All else equal, higher implied volatility marks up options delta (exposure to direction) and this leads to more selling as hedging pressures exacerbate weakness.

Graphic: SqueezeMetrics details the implications of customer activity in the options market, on the underlying’s order book.
Graphic: Per Interactive Brokers Group Inc (NASDAQ: IBKR), VIX futures show little concern; “An inverted curve, or even a flattish one, indicates a shortage of available volatility protection.  We saw that as recently as a month ago, but not now.”

Taking into account options positioning, versus buying pressure (measured via short sales or liquidity provision on the market-making side), positioning metrics remain positively skewed.

Graphic: Data SqueezeMetrics. Graph via Physik Invest.

In ending this section, Friday’s put-heavy expiration removed some negative gamma that was adding to instability, at least at the index level. 

Though markets will tend toward instability so long as volatility is heightened and products (especially some constituents) remain in negative gamma, the dip lower and demand for protection may serve to prime the market for upside (when volatility starts to compress again and counterparties unwind hedges thus supporting any attempt higher).

“Failure to expand the range, lower, on the index level, at least, likely invokes supportive dealer hedging flows with respect to time (‘charm’) and volatility (‘vanna’),” SpotGamma adds.

At present, there’s a push-and-pull; “no-touch” garbage stocks in the S&P and Nasdaq 100 are gaining strength. If this dynamic persists, in light of what was discussed above, what happens?

Technical: As of 6:30 AM ET, Monday’s regular session (9:30 AM – 4:00 PM ET), in the S&P 500, will likely open in the lower part of a negatively skewed overnight inventory, just inside of prior-range and -value, suggesting a limited potential for immediate directional opportunity.

Spike Scenario Still In Play: Spike’s mark the beginning of a break from value. Spikes higher (lower) are validated by trade at or above (below) the spike base (i.e., the origin of the spike).

Spike base is at $4,761.25. Above, bullish. Below, bearish.

In the best case, the S&P 500 trades higher; activity above the $4,647.25 high volume area (HVNode) puts in play the $4,674.25 HVNode. Initiative trade beyond the latter could reach as high as the $4,691.25 micro composite point of control (MCPOC) and $4,717.25 low volume area (LVNode).

In the worst case, the S&P 500 trades lower; activity below the $4,647.25 HVNode puts in play the $4,629.25 HVNode. Initiative trade beyond the latter could reach as low as the $4,585.00 and $4,549.00 untested point of control (VPOC), or lower.

Click here to load today’s key levels into the web-based TradingView charting platform. Note that all levels are derived using the 65-minute timeframe. New links are produced, daily.
Graphic: 65-minute profile chart of the Micro E-mini S&P 500 Futures.

What People Are Saying

Definitions

Volume Areas: A structurally sound market will build on areas of high volume (HVNodes). Should the market trend for long periods of time, it will lack sound structure, identified as low volume areas (LVNodes). LVNodes denote directional conviction and ought to offer support on any test. 

If participants were to auction and find acceptance into areas of prior low volume (LVNodes), then future discovery ought to be volatile and quick as participants look to HVNodes for favorable entry or exit.

DIX: For every buyer is a seller (usually a market maker). Using DIX — which is derived from short sales (i.e., liquidity provision on the market-making side) — we can measure buying pressure.

Gamma: Gamma is the sensitivity of an option to changes in the underlying price. Dealers that take the other side of options trades hedge their exposure to risk by buying and selling the underlying. When dealers are short-gamma, they hedge by buying into strength and selling into weakness. When dealers are long-gamma, they hedge by selling into strength and buying into weakness. The former exacerbates volatility. The latter calms volatility.

Vanna: The rate at which the delta of an option changes with respect to volatility.

Charm: The rate at which the delta of an option changes with respect to time.

Options: If an option buyer was short (long) stock, he or she would buy a call (put) to hedge upside (downside) exposure. Option buyers can also use options as an efficient way to gain directional exposure.

POCs: POCs are valuable as they denote areas where two-sided trade was most prevalent in a prior day session. Participants will respond to future tests of value as they offer favorable entry and exit.

MCPOCs: POCs are valuable as they denote areas where two-sided trade was most prevalent over numerous day sessions. Participants will respond to future tests of value as they offer favorable entry and exit.

About

After years of self-education, strategy development, mentorship, and trial-and-error, Renato Leonard Capelj began trading full-time and founded Physik Invest to detail his methods, research, and performance in the markets.

Capelj is also a Benzinga finance and technology reporter interviewing the likes of Shark Tank’s Kevin O’Leary, JC2 Ventures’ John Chambers, FTX’s Sam Bankman-Fried, and ARK Invest’s Catherine Wood, as well as a SpotGamma contributor developing insights around impactful options market dynamics.

Disclaimer

Physik Invest does not carry the right to provide advice.

In no way should the materials herein be construed as advice. Derivatives carry a substantial risk of loss. All content is for informational purposes only.
Categories
Commentary

Daily Brief For January 7, 2022

The Daily Brief is a free glimpse into the prevailing fundamental and technical drivers of U.S. equity market products. Join the 200+ that read this report daily, below!

What Happened

Equity index futures auctioned sideways, mostly, ahead of important economic releases such as data on Nonfarm payrolls, the unemployment rate, and average hourly earnings (8:30 AM ET), as well as Fed-speak (10:00 AM and 12:15 PM ET), and consumer credit data (3:00 PM ET).

Graphic updated 6:30 AM ET. Sentiment Neutral if expected /ES open is inside of the prior day’s range. /ES levels are derived from the profile graphic at the bottom of the following section. Levels may have changed since initially quoted; click here for the latest levels. SqueezeMetrics Dark Pool Index (DIX) and Gamma (GEX) calculations are based on where the prior day’s reading falls with respect to the MAX and MIN of all occurrences available. A higher DIX is bullish. At the same time, the lower the GEX, the more (expected) volatility. Learn the implications of volatility, direction, and moneyness. SHIFT data used for S&P 500 (INDEX: SPX) options activity. Note that options flow is sorted by the call premium spent; if more positive, then more was spent on call options. Breadth reflects a reading of the prior day’s NYSE Advance/Decline indicator. VIX reflects a current reading of the CBOE Volatility Index (INDEX: VIX) from 0-100.

What To Expect

Fundamental: Participants will receive further clarity around payrolls data.

According to Bloomberg, the expectation is that Friday’s jobs report ought to show the addition of about 450,000 workers, last month. 

“[T]he so-called whisper number has already jumped to 500,000,” in light of this “Wednesday’s consensus-busting ADP Research Institute data that showed U.S. companies added the most jobs in seven months.”

This is all the while major equity indices are down on the week, “fueled by one of the most intense bouts of selling by professional speculators since the financial crisis.”

Per Goldman Sachs Group Inc (NYSE: GS) prime broker data, the sale of highly valued growth stocks reached levels not seen in more than 10 years. Selling worsened after minutes to the Federal Reserve’s last policy meeting pointed to faster hikes and balance sheet normalization.

As higher rates are to fend off inflation, they, too, have the potential to decrease the present value of future earnings making stocks (especially high growth) less attractive. 

“A strong [payrolls] print will see the market factor in hikes/quantitative tightening even earlier,” strategists at Mizuho International Plc said. “We’d therefore prefer to be positioned for more equity downside, and for higher yields.”

Positioning: Bonds down, equities down. Interesting, right?

Fresh in my mind is a conversation I had with Karan Sood, CEO and Managing Director, Head of Product Development at Cboe Vest Financial LLC, regarding his firm’s packaged options and volatility targeting strategies that help investors manage their portfolio volatility.

Moreover, over the past 40 or so years, monetary policy was used as a crutch to support the economy. This promoted deflation, innovation, and the subsequent rise in valuations.

“Bonds have been giving you really good returns because interest rates have been going down since the 1970s when they peaked at about 11%,” Sood explained to me. 

“That’s changing now; we’re at the zero bound, and it’s unlikely that will be as a strong of a tailwind. Worse, it could be a headwind if interest rates start to rise.”

As a result of this dynamic, coupled with participants’ increased exposure to rate and equity market risk which can play into cross-market hedging and de-leveraging cascades, 60/40 can be somewhat of a poor hedge.

“Now, with the Fed poised to hike interest rates to combat raging inflation, the bond-stock relationship could be upended,” Bloomberg explains

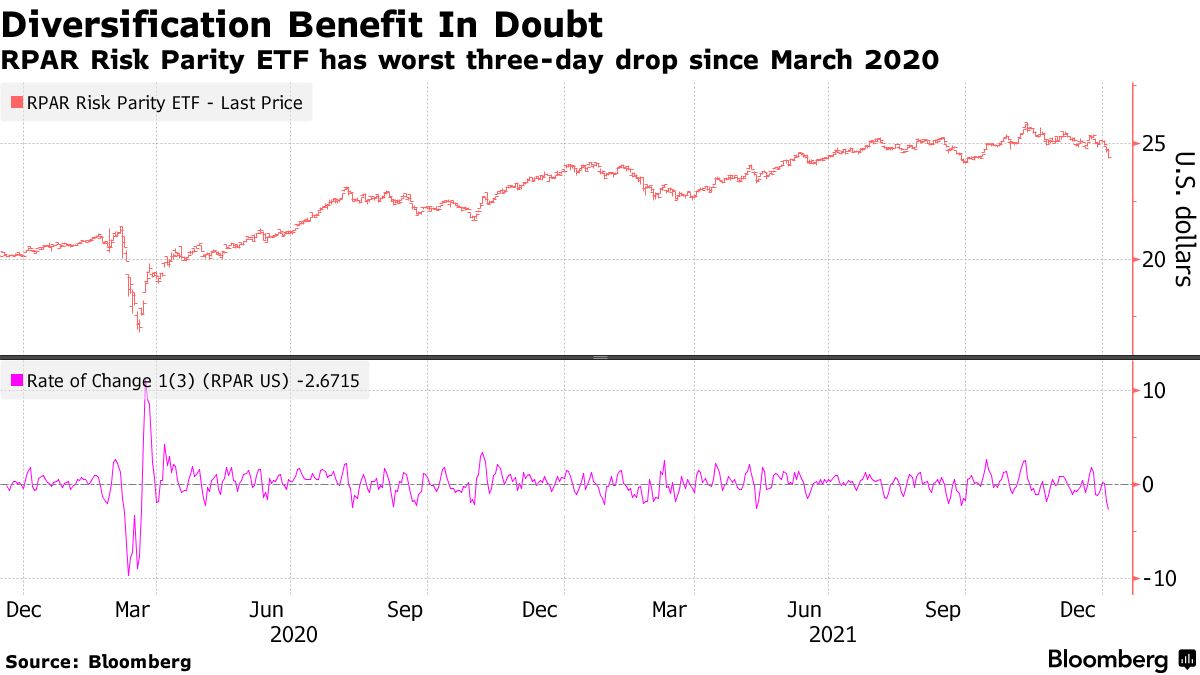
“At stake are trillions of dollars that are managed at risk parity funds, balanced mutual funds, and pension funds that follow the framework of 60/40 asset allocation.”

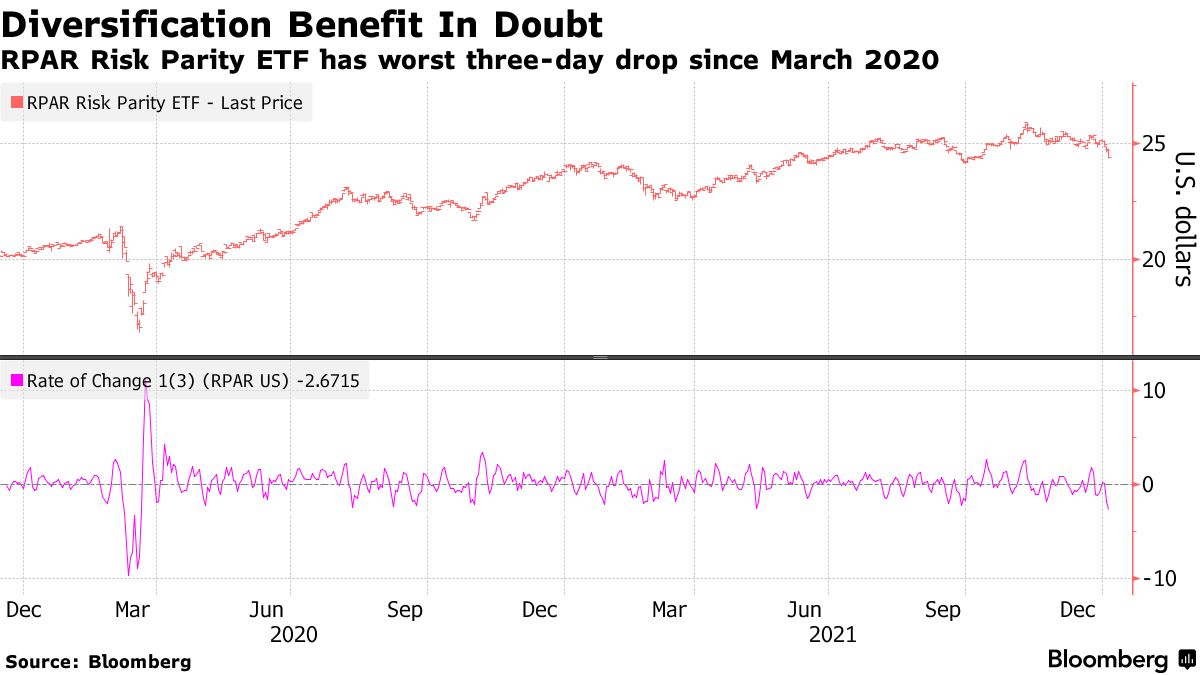
Graphic: Via Bloomberg.

Why mention any of this? Well, it forces us to look elsewhere for protection. 

In this case, the growing asset class of volatility, so to speak, is that protection. Investors are aware of both the protective and speculative efficiency afforded to them by options and that is the primary reason option volumes are so comparable to stock volumes, now.

Notwithstanding, with option volumes higher, related hedging flows can represent an increased share of volume in underlying stocks. Therefore, the correlation of stock moves, versus options activity, is more pronounced.

To put it simply, we can look to the options market for clues on where to next, for lack of better phrasing. So, let’s do that!

Wednesday’s session unwound some of the single-stock bullishness (in stocks like Tesla) that fed into the S&P 500, itself; an expansion in volatility coincided with the demand for downside (put) protection and supply of upside (call) protection.

Conditions settled, Thursday. Though positioning metrics had little to offer in terms of predicting movement, implied volatility remained heightened and many products did not expand range.

All else equal, higher implied volatility marks up options delta (exposure to direction). 

Knowing that demand for downside protection coincides with customers indirectly taking liquidity and destabilizing the market as the participant short the put will sell underlying to neutralize risk, participants ought to keep their eye out on whether implied volatility expands or contracts.

Graphic: SqueezeMetrics details the implications of customer activity in the options market, on the underlying’s order book.

Higher implied volatility, higher delta, more selling. Hedging pressures will exacerbate weakness, as a result of real selling (as talked about above), at the index and single-stock level.

Graphic: The “Biggest tail risk to SPX isn’t any macro data/virus/war but its own options market.”

Taking into account options positioning, versus buying pressure (measured via short sales or liquidity provision on the market-making side), positioning metrics remain positively skewed, even more so than before.

Graphic: Data SqueezeMetrics. Graph via Physik Invest.

As stated yesterday, though the dip lower and demand for protection may serve to prime the market for upside (when volatility starts to compress again and counterparties unwind hedges thus supporting any attempt higher), markets will tend toward instability so long as volatility is heightened and the market remains in short-gamma territory.

Technical: As of 6:30 AM ET, Friday’s regular session (9:30 AM – 4:00 PM ET), in the S&P 500, will likely open in the middle part of a balanced overnight inventory, inside of prior-range and -value, suggesting a limited potential for immediate directional opportunity.

Spike Scenario In Play: Spike’s mark the beginning of a break from value. Spikes higher (lower) are validated by trade at or above (below) the spike base (i.e., the origin of the spike).

Spike base is at $4,761.25. Above, bullish. Below, bearish.

In the best case, the S&P 500 trades higher; activity above the $4,691.25 micro composite point of control (MCPOC) puts in play the $4,717.25 low volume area (LVNode). Initiative trade beyond the LVNode could reach as high as the $4,732.50 high volume area (HVNode) and $4,756.00 LVNode, or higher.

In the worst case, the S&P 500 trades lower; activity below the $4,691.25 MCPOC puts in play the $4,674.25 HVNode. Initiative trade beyond the latter could reach as low as the $4,647.25 and $4,629.25 HVNode, or lower.

Click here to load today’s key levels into the web-based TradingView charting platform. Note that all levels are derived using the 65-minute timeframe. New links are produced, daily.
Graphic: 65-minute profile chart of the Micro E-mini S&P 500 Futures.

What People Are Saying

Definitions

Volume Areas: A structurally sound market will build on areas of high volume (HVNodes). Should the market trend for long periods of time, it will lack sound structure, identified as low volume areas (LVNodes). LVNodes denote directional conviction and ought to offer support on any test. 

If participants were to auction and find acceptance into areas of prior low volume (LVNodes), then future discovery ought to be volatile and quick as participants look to HVNodes for favorable entry or exit.

DIX: For every buyer is a seller (usually a market maker). Using DIX — which is derived from short sales (i.e., liquidity provision on the market-making side) — we can measure buying pressure.

Gamma: Gamma is the sensitivity of an option to changes in the underlying price. Dealers that take the other side of options trades hedge their exposure to risk by buying and selling the underlying. When dealers are short-gamma, they hedge by buying into strength and selling into weakness. When dealers are long-gamma, they hedge by selling into strength and buying into weakness. The former exacerbates volatility. The latter calms volatility.

Vanna: The rate at which the delta of an option changes with respect to volatility.

Charm: The rate at which the delta of an option changes with respect to time.

Options: If an option buyer was short (long) stock, he or she would buy a call (put) to hedge upside (downside) exposure. Option buyers can also use options as an efficient way to gain directional exposure.

POCs: POCs are valuable as they denote areas where two-sided trade was most prevalent in a prior day session. Participants will respond to future tests of value as they offer favorable entry and exit.

MCPOCs: POCs are valuable as they denote areas where two-sided trade was most prevalent over numerous day sessions. Participants will respond to future tests of value as they offer favorable entry and exit.

About

After years of self-education, strategy development, mentorship, and trial-and-error, Renato Leonard Capelj began trading full-time and founded Physik Invest to detail his methods, research, and performance in the markets.

Capelj is also a Benzinga finance and technology reporter interviewing the likes of Shark Tank’s Kevin O’Leary, JC2 Ventures’ John Chambers, FTX’s Sam Bankman-Fried, and ARK Invest’s Catherine Wood, as well as a SpotGamma contributor developing insights around impactful options market dynamics.

Disclaimer

Physik Invest does not carry the right to provide advice.

In no way should the materials herein be construed as advice. Derivatives carry a substantial risk of loss. All content is for informational purposes only.
Categories
Commentary

Daily Brief For December 29, 2021

Notice: Given travel commitments, commentaries will be suspended until January 3, 2022. 

As an aside, I’m sincerely honored to have you as a subscriber. 

This newsletter began as a tool to hold myself accountable for objectively assessing dominant narratives and market-generated information. 

Since launching, this commentary has grown. Content and engagement have improved.

Now, with many of the 200 or so of you that are reading this actively, I have spoken with via email, and the like, regarding trader development, among many other things.

When it comes to markets, at the end of the day, whether you’re at a bank (as some of you are) or at home, we’re all alone. The implications of this are staggering.

How are we to objectively assess and act on what the market is signaling to us with no framework or community to work off of?

That’s the problem and I hope to make a bigger impact, going forward.

Wishing you good health and success next year and beyond!

Best, 

Renato

What Happened

In the face of a “stealth correction,” and an “off-loading of risk” by professionals, the S&P 500 remains strong further bolstered by options selling and volatility compression.

This is as less heavily-weighted constituents remain volatile; with hedging pressures sticky at the index level, the only reconciliation can be a decline in correlation. 

As liquidity remains “holiday-thinned,” so to speak, coming into Friday’s weighty “Quarterlys” options expiration, positioning metrics suggest indices ought to stick at higher prices.

Thereafter, expect increased movement.

Moreover, ahead is data on trade in goods (8:30 AM ET) and pending home sales (10:00 AM ET).

Graphic updated 6:30 AM ET. Sentiment Neutral if expected /ES open is inside of the prior day’s range. /ES levels are derived from the profile graphic at the bottom of the following section. Levels may have changed since initially quoted; click here for the latest levels. SqueezeMetrics Dark Pool Index (DIX) and Gamma (GEX) calculations are based on where the prior day’s reading falls with respect to the MAX and MIN of all occurrences available. A higher DIX is bullish. At the same time, the lower the GEX, the more (expected) volatility. Learn the implications of volatility, direction, and moneyness. SHIFT data used for S&P 500 (INDEX: SPX) options activity. Note that options flow is sorted by the call premium spent; if more positive then more was spent on call options. Breadth reflects a reading of the prior day’s NYSE Advance/Decline indicator. VIX reflects a current reading of the CBOE Volatility Index (INDEX: VIX) from 0-100.

What To Expect

Given the persistence of responses to technical levels, weaker-handed participants (which seldom bear the wherewithal to defend retests) carry a heavier hand in recent price discovery.

Via volume profile analysis, we see a plethora of low-volume pockets – voids, if you will – that likely hold virgin tests. Successful penetration often portends follow-through as the participants that were most active at those levels (quickly run for the exits when wrong).

Context: In the face of market internals that look weaker than at any time since March of last year, the S&P 500 remains strong, relative to its counterparts.

As alluded to in a prior section, the commitment of capital on lower volatility is upping the dealers’ addition of liquidity, which supports high prices but may limit further price discovery.

Why? When a position’s delta rises with stock or index price rises, gamma – the expected change in delta given movement in the underlying – is added to delta. 

According to SpotGamma, “[a]s participants keep adding to their bets at $4,800.00, the dealer only takes on more exposure to positive gamma.”

Graphic: Via SpotGamma. “Based on the fact that we are at the S&P Call Wall and are approaching this large OPEX, we look for a pause and some consolidation in markets here.”

So, with liquidity “holiday-thinned,” so to speak, and participants’ concentration of activity in near-the-money options strikes, coming into this week’s “Quarterlys” options expiration, indices are to remain pinned.

After Friday, the market is more susceptible to fundamental forces as, according to SpotGamma, there will be “a decrease in sticky gamma hedging.”

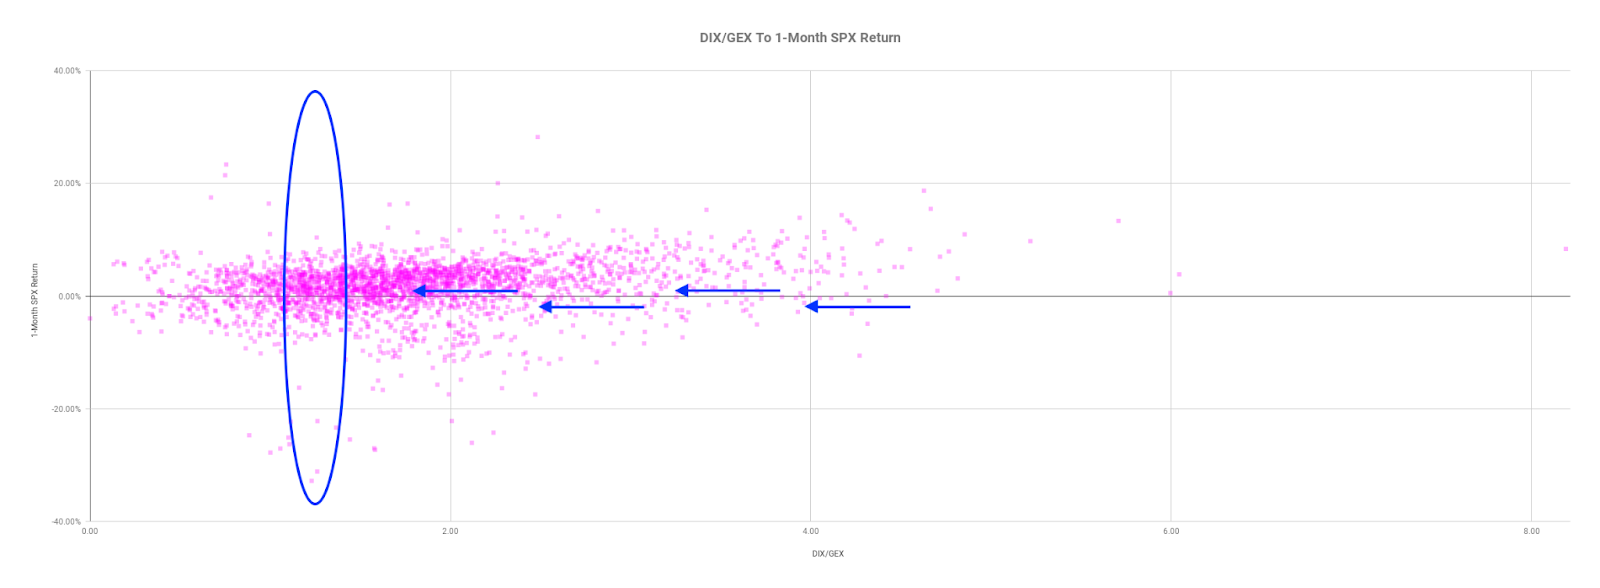
Couple current options positioning and buying pressure – via short sales or liquidity provision on the market-making side – metrics suggest middling returns 1-month out, or so.

Graphic: Data SqueezeMetrics. Graph via Physik Invest.

Moreover, the expectation is that positive fundamental forces and dealers’ covering of hedges to remaining “put-heavy” positioning bolster seasonally-aligned price rise in January.

Graphic: Per The Market Ear, “January typically sees 134% of inflows (the rest of the 11 months -34%). And with every private wealth manager in the world right now pitching increased allocations into equities (out of cash and out of bonds), Goldman calculates that keeping 2021 pace, This would be $125BN worth of inflows quickly in January.”

In anticipation of higher prices, low cost, complex options structures like call-side calendars, butterflies, and ratio spreads are still top of mind. 

After a fast move higher over the past week or so, with positioning metrics as they are, it does not make sense to commit massive debits to static or variable long-delta trades. Cost matters.

Graphic: Via Banco Santander SA (NYSE: SAN) research, the return profile, at expiry, of a classic 1×2 (long 1, short 2 further away) ratio spread.

Expectations: As of 6:30 AM ET, Wednesday’s regular session (9:30 AM – 4:00 PM ET), in the S&P 500, will likely open in the middle part of a balanced overnight inventory, inside of prior-range and -value, suggesting a limited potential for immediate directional opportunity.

Spike Rules In Play: Spike’s mark the beginning of a break from value. Spikes higher (lower) are validated by trade at or above (below) the spike base (i.e., the origin of the spike). 

The spike base is $4,776.00. Below bearish (change in tone). Above bullish (status quo).

In the best case, the S&P 500 trades sideways or higher; activity above the $4,781.75 high volume area (HVNode) puts in play the $4,798.00 minimal excess. Initiative trade beyond the minimal excess could reach as high as the $4,805.50 and $4,815.00 extension, or higher.

In the worst case, the S&P 500 trades lower; activity below the $4,781.75 HVNode puts in play the $4,770.50 regular trade low (RTH Low). Initiative trade beyond the RTH Low could reach as low as the $4,732.50 HVNode and $4,717.25 low volume area (LVNode), or lower.

Click here to load today’s key levels into the web-based TradingView charting platform. Note that all levels are derived using the 65-minute timeframe. New links are produced, daily.
Graphic: 65-minute profile chart of the Micro E-mini S&P 500 Futures. Learn about the profile.

What People Are Saying

Definitions

Volume Areas: A structurally sound market will build on areas of high volume (HVNodes). Should the market trend for long periods of time, it will lack sound structure, identified as low volume areas (LVNodes). LVNodes denote directional conviction and ought to offer support on any test. 

If participants were to auction and find acceptance into areas of prior low volume (LVNodes), then future discovery ought to be volatile and quick as participants look to HVNodes for favorable entry or exit.

Excess: A proper end to price discovery; the market travels too far while advertising prices. Responsive, other-timeframe (OTF) participants aggressively enter the market, leaving tails or gaps which denote unfair prices.

Volume-Weighted Average Prices (VWAPs): A metric highly regarded by chief investment officers, among other participants, for quality of trade. Additionally, liquidity algorithms are benchmarked and programmed to buy and sell around VWAPs.

About

After years of self-education, strategy development, and trial-and-error, Renato Leonard Capelj began trading full-time and founded Physik Invest to detail his methods, research, and performance in the markets.

Additionally, Capelj is a Benzinga finance and technology reporter interviewing the likes of Shark Tank’s Kevin O’Leary, JC2 Ventures’ John Chambers, and ARK Invest’s Catherine Wood, as well as a SpotGamma contributor, helping develop insights around impactful options market dynamics.

Disclaimer

At this time, Physik Invest does not carry the right to provide advice. In no way should the materials herein be construed as advice. Derivatives carry a substantial risk of loss. All content is for informational purposes only.
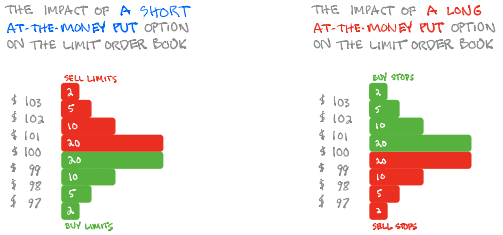
Categories
Commentary

Daily Brief For December 28, 2021

Notice: Up to January 3, 2022, any commentaries published will be lighthearted and, generally, shorter in length.

What Happened

Overnight, equity index futures were sideways to higher with most commodities, yields. 

This is as volatility implodes; the CBOE Volatility Index, from December 20, went as low as 17.55 this week [down 9.84 (35.93%)]. This coincides with a compression in the VIX’s term structure, and that has so-called bullish/supportive implications.

Ahead is data on the S&P Case-Shiller U.S. home price index (9:00 AM ET).

Graphic updated 7:00 AM ET. Sentiment Risk-On if expected /ES open is above the prior day’s range. /ES levels are derived from the profile graphic at the bottom of the following section. Levels may have changed since initially quoted; click here for the latest levels. SqueezeMetrics Dark Pool Index (DIX) and Gamma (GEX) calculations are based on where the prior day’s reading falls with respect to the MAX and MIN of all occurrences available. A higher DIX is bullish. At the same time, the lower the GEX, the more (expected) volatility. Learn the implications of volatility, direction, and moneyness. SHIFT data used for S&P 500 (INDEX: SPX) options activity. Note that options flow is sorted by the call premium spent; if more positive then more was spent on call options. Breadth reflects a reading of the prior day’s NYSE Advance/Decline indicator. VIX reflects a current reading of the CBOE Volatility Index (INDEX: VIX) from 0-100.

What To Expect

On lackluster breadth and divergent market liquidity metrics, the S&P 500 continues to auction away from intraday value, the levels at which participants found it most favorable to transact.

Moreover, given the persistence of mechanical responses to technical levels, visually-driven, weaker-handed participants (which seldom bear the wherewithal to defend retests) likely carry a heavier hand in recent price discovery.

Via volume profile analysis, we see a plethora of low-volume pockets – voids, if you will – that likely hold virgin tests. 

As stated over the past few days, successful penetration often portends follow-through as the participants that were most active at those levels (quickly run for the exits when wrong).

Context: Recall that a collapse in implied volatility, coupled with relentless, seasonally-aligned passive buying would bring in positive flows that would bolster any attempt higher.

At the same time “options selling strategies [became] attractive,” according to Goldman Sachs Group Inc (NYSE: GS); the commitment of capital to options strikes at higher prices implies participants are pushing up their bets on S&P 500 movement. That’s bullish.

Graphic: Shift Search S&P 500 data (excluding weeklies) suggests participants are likely initiating box spreads and rolling their call exposure out in time (as much as 6 months).

According to SpotGamma, “[s]ince, customers are thought to be net short calls (short-delta), as the index moves toward the high activity $4,800.00 strike, they become longer delta.”

Why? When a position’s delta rises with stock or index price rises, gamma – the expected change in delta given movement in the underlying – is added to delta. 

“As participants keep adding to their bets at $4,800.00, the dealer only takes on more exposure to positive gamma, which they hedge by selling futures and adding liquidity to the market.”

The commitment of capital on lower volatility ups the dealers’ exposure to positive gamma; this will be offset through a supply of liquidity (via short futures), which weighs on price discovery.

Taking into account this positioning, versus buying pressure (measured via short sales or liquidity provision on the market-making side), positioning metrics remain positively skewed, albeit less so than before.

Graphic: Data SqueezeMetrics. Graph via Physik Invest.

Going forward, coming into Friday’s weighty options expirations, at the index level, hedging pressures ought to be sticky and weigh on the upside. 

Thereafter, positive fundamental forces and dealers’ covering of hedges to remaining “put-heavy” positioning could bolster any seasonally-aligned price rise into the very first interest rate hikes.

Graphic: Per The Market Ear, “January typically sees 134% of inflows (the rest of the 11 months -34%). And with every private wealth manager in the world right now pitching increased allocations into equities (out of cash and out of bonds), Goldman calculates that keeping 2021 pace, This would be $125BN worth of inflows quickly in January.”

Moody’s Corporation’s (NYSE: MCO) forecast is in agreement: “the Dow Jones Industrial Average increases this quarter and peaks in early 2022, … [followed by] steady decline through 2022.”

Graphic: S&P 500 performance before and after rate hikes.

Expectations: As of 7:00 AM ET, Tuesday’s regular session (9:30 AM – 4:00 PM ET), in the S&P 500, will likely open in the upper part of a positively skewed overnight inventory, just outside of prior-range and -value, suggesting a potential for immediate directional opportunity.

Gap Scenarios: Gaps ought to fill quickly. Should they not, that’s a signal of strength; do not fade. Leaving value behind on a gap-fill or failing to fill a gap (i.e., remaining outside of the prior session’s range) is a go-with indicator.

Auctioning and spending at least 1-hour of trade back in the prior range suggests a lack of conviction; in such a case, do not follow the direction of the most recent initiative activity.

In the best case, the S&P 500 trades sideways or higher; activity above the $4,771.00 untested point of control (VPOC) puts in play the $4,784.25 regular trade high (RTH High). Initiative trade beyond the RTH High could reach as high as the $4,797.25 overnight high (ONH) and $4,803.75 extension, or higher.

In the worst case, the S&P 500 trades lower; activity below the $4,771.00 VPOC puts in play the $4,732.50 high volume area (HVNode). Initiative trade beyond the HVNode could reach as low as the $4,717.25 low volume area (LVNode) and $4,690.25 micro composite point of control (MCPOC), or lower.

Click here to load today’s key levels into the web-based TradingView charting platform. Note that all levels are derived using the 65-minute timeframe. New links are produced, daily.
Graphic: 65-minute profile chart of the Micro E-mini S&P 500 Futures. Learn about the profile.

Definitions

Overnight Rally Highs (Lows): Typically, there is a low historical probability associated with overnight rally-highs (lows) ending the upside (downside) discovery process.

Volume Areas: A structurally sound market will build on areas of high volume (HVNodes). Should the market trend for long periods of time, it will lack sound structure, identified as low volume areas (LVNodes). LVNodes denote directional conviction and ought to offer support on any test. 

If participants were to auction and find acceptance into areas of prior low volume (LVNodes), then future discovery ought to be volatile and quick as participants look to HVNodes for favorable entry or exit.

POCs: POCs are valuable as they denote areas where two-sided trade was most prevalent in a prior day session. Participants will respond to future tests of value as they offer favorable entry and exit.

MCPOCs: POCs are valuable as they denote areas where two-sided trade was most prevalent over numerous day sessions. Participants will respond to future tests of value as they offer favorable entry and exit.

Options Expiration (OPEX): Traditionally, option expiries mark an end to pinning (i.e, the theory that market makers and institutions short options move stocks to the point where the greatest dollar value of contracts will expire) and the reduction dealer gamma exposure.

Volume-Weighted Average Prices (VWAPs): A metric highly regarded by chief investment officers, among other participants, for quality of trade. Additionally, liquidity algorithms are benchmarked and programmed to buy and sell around VWAPs.

About

After years of self-education, strategy development, and trial-and-error, Renato Leonard Capelj began trading full-time and founded Physik Invest to detail his methods, research, and performance in the markets.

Additionally, Capelj is a Benzinga finance and technology reporter interviewing the likes of Shark Tank’s Kevin O’Leary, JC2 Ventures’ John Chambers, and ARK Invest’s Catherine Wood, as well as a SpotGamma contributor, helping develop insights around impactful options market dynamics.

Disclaimer

At this time, Physik Invest does not carry the right to provide advice. In no way should the materials herein be construed as advice. Derivatives carry a substantial risk of loss. All content is for informational purposes only.
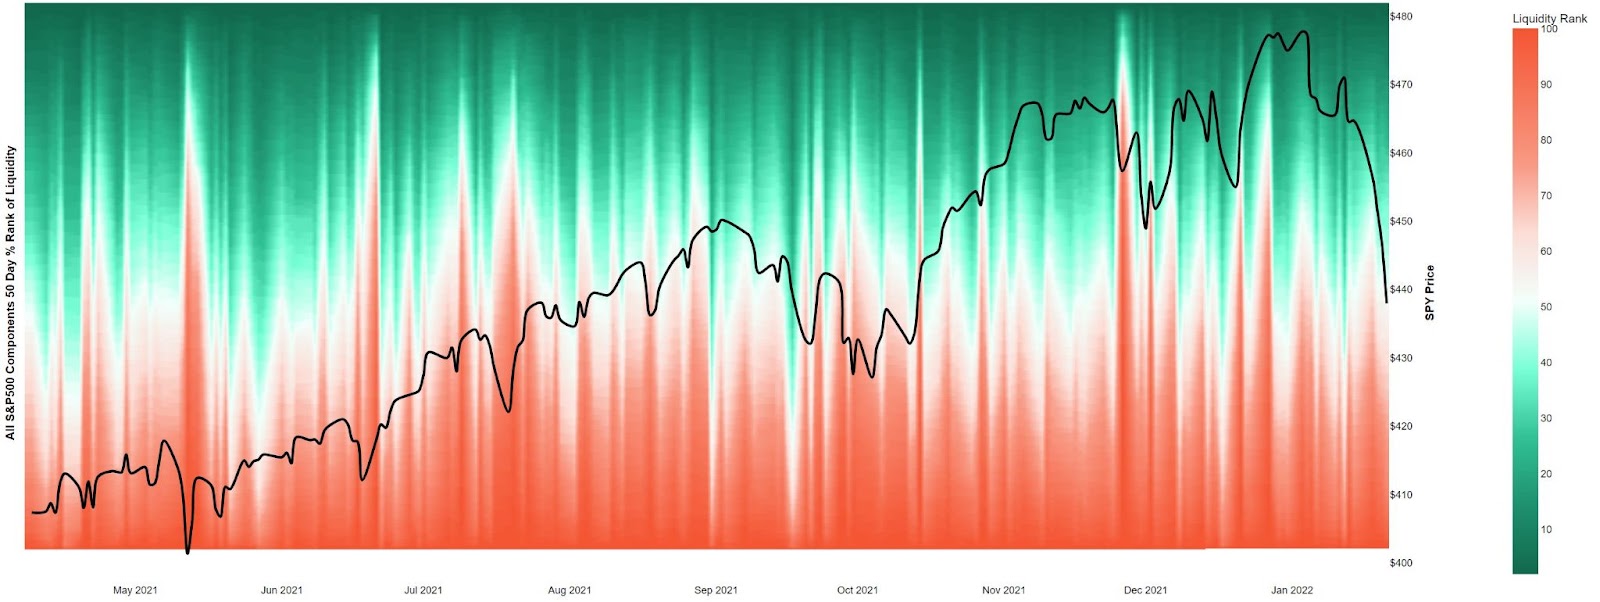
Categories
Commentary

Daily Brief For December 27, 2021

Notice: Up to January 3, 2022, any commentaries published will be lighthearted and, generally, shorter in length.

What Happened

Overnight, equity index and bond futures were divergent while most commodities traded lower.

In the face of “holiday-thinned liquidity,” the CBOE Volatility Index (INDEX: VIX) rose ~1.15; this week, the expectation is (A) flatlined volatility or (B) ugly, headline-driven intraday moves.

Ahead, there is no data scheduled for release.

Graphic updated 5:45 AM ET. Sentiment Neutral if expected /ES open is inside of the prior day’s range. /ES levels are derived from the profile graphic at the bottom of the following section. Levels may have changed since initially quoted; click here for the latest levels. SqueezeMetrics Dark Pool Index (DIX) and Gamma (GEX) calculations are based on where the prior day’s reading falls with respect to the MAX and MIN of all occurrences available. A higher DIX is bullish. At the same time, the lower the GEX, the more (expected) volatility. Learn the implications of volatility, direction, and moneyness. SHIFT data used for S&P 500 (INDEX: SPX) options activity. Note that options flow is sorted by the call premium spent; if more positive then more was spent on call options. Breadth reflects a reading of the prior day’s NYSE Advance/Decline indicator. VIX reflects a current reading of the CBOE Volatility Index (INDEX: VIX) from 0-100.

What To Expect

Last week, on lackluster intraday breadth and market liquidity metrics, the best case outcome occurred via an expansion of range and separation of value, the levels at which participants found it most favorable to transact.

The aforementioned activity, which marks the continuation of a trend, is built on poor structure. 

That, ultimately, adds to technical instability.

Why? As explained, Thursday, given the persistence of mechanical responses to key technical levels, visually-driven, weaker-handed participants (which seldom bear the wherewithal to defend retests) carry a heavier hand in recent price discovery. 

Via volume profile analysis, we see a plethora of low-volume pockets – voids, if you will – that likely hold virgin tests. As stated, yesterday, successful penetration portends follow-through given the participants that were most active at those technical levels. Caution is still warranted.

Graphic: Divergent delta (i.e., non-committed buying and selling as measured by volume delta or buying and selling power as calculated by the difference in volume traded at the bid and offer) in SPDR S&P 500 ETF Trust (NYSE: SPY), one of the largest ETFs that track the S&P 500 index, via Bookmap. The readings are supportive of responsive trade (i.e., rotational trade that suggests current prices may offer favorable entry/exit; the market is attempting to balance).

Context: In the face of a “stealth correction,” and an “off-loading of risk by professional speculators,” the S&P 500 closed beyond a visual resistance level, last week, on light volume.

Graphic: A multi-month divergence (and downtrend) in breadth metrics stabilize as participants attempt to discover higher prices in the S&P 500. 

This is as, according to Ryan Detrick of LPL Financial, the “official Santa Claus Rally starts this Monday (last 5 days of the year and the first two of the following year).”

Kai Volatility’s Cem Karsan echoes Detrick’s remarks.

“Since 1980, there have been 10 instances where the S&P 500 was up 20% or more going into the last stretch of trading, and in 9 of those years, it ended the final 6 days higher.”

Moreover, despite an eventual decline in fiscal support, negative adjustments to the EPS guidance of more index constituents, and revisions lower in growth forecasts, Morgan Stanley’s (NYSE: MS) saw flows shift in high-growth, rate-sensitive names – “flows have reversed in recent sessions as there have been small levels of net buying.”

The change in tone with respect to flows is seasonally-aligned, so to speak; per Goldman Sachs Group (NYSE: GS), January sees more inflows than all other months combined.

Graphic: Per The Market Ear, “January typically sees 134% of inflows (the rest of the 11 months -34%). And with every private wealth manager in the world right now pitching increased allocations into equities (out of cash and out of bonds), Goldman calculates that keeping 2021 pace, This would be $125BN worth of inflows quickly in January.”

Adding, in the face of this week’s weighty “Quarterlys” expiry, Goldman Sachs sees options selling attractive, near term; a commitment of capital on lower volatility likely results in counterparties to customer options trades taking on more exposure to sticky positive gamma. 

Note: As a position’s delta rises with stock or index price rises, gamma (or how an option’s delta is expected to change given a change in the underlying) is added to the delta.

This is while many products are in lower liquidity and short-gamma (wherein an options delta decreases with stock prices rises and increases when stock prices drop) in which moves are more erratic.

Therefore, coming into weighty options expiration, correlations may be off (as that is the only reconciliation in an environment where, at the index level, hedging pressures are sticky, whereas elsewhere they aren’t).

Thereafter, participants ought to monitor the sides and levels capital is committed for clues as to where we go next. 

Continued compression of volatility, as well as a commitment to options higher in prices and further out in time, supports upward price discovery.

Expectations: As of 5:45 AM ET, Monday’s regular session (9:30 AM – 4:00 PM ET), in the S&P 500, will likely open in the upper part of a balanced overnight inventory, inside of prior-range and -value, suggesting a limited potential for immediate directional opportunity.

In the best case, the S&P 500 trades sideways or higher; activity above the $4,717.25 low volume area (LVNode) puts in play the $4,732.50 high volume area (HVNode). Initiative trade beyond the HVNode could reach as high as the $4,743.00 regular trade high (RTH High) and $4,767.00 extension, or higher.

In the worst case, the S&P 500 trades lower; activity below the $4,717.25 LVNode puts in play the $4,690.25 micro composite point of control (MCPOC). Initiative trade beyond the MCPOC could reach as low as the $4,673.00 untested point of control (VPOC) and $4,647.25 HVNode, or lower.

Click here to load today’s key levels into the web-based TradingView charting platform. Note that all levels are derived using the 65-minute timeframe. New links are produced, daily.
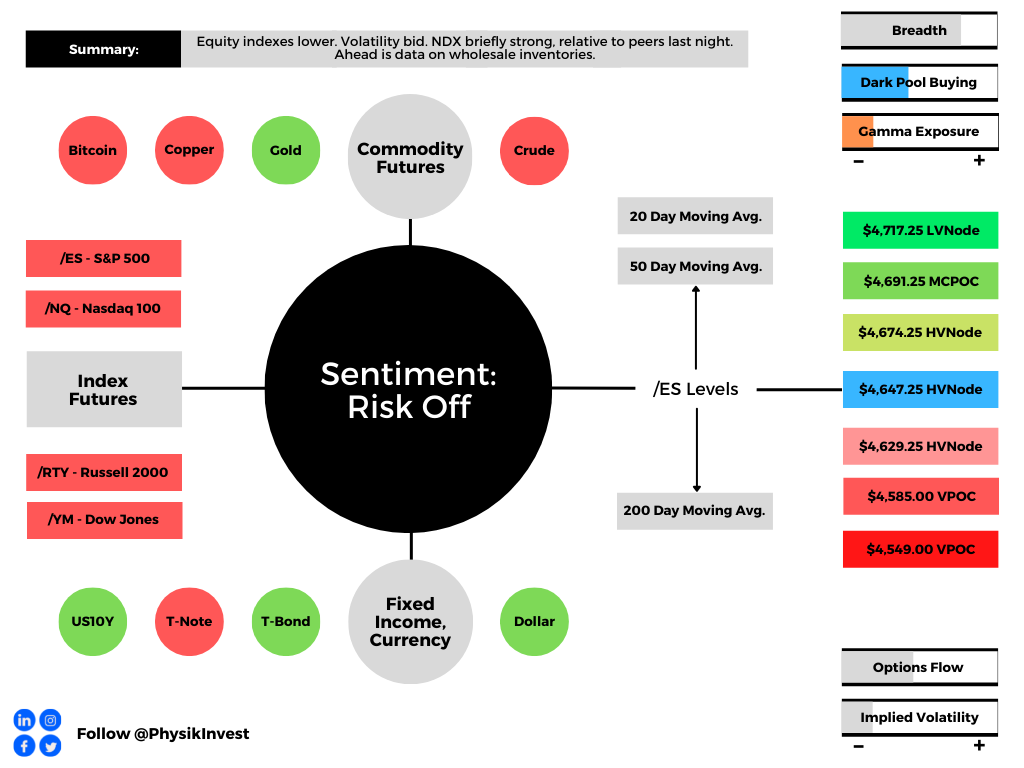
Graphic: 65-minute profile chart of the Micro E-mini S&P 500 Futures. Learn about the profile.
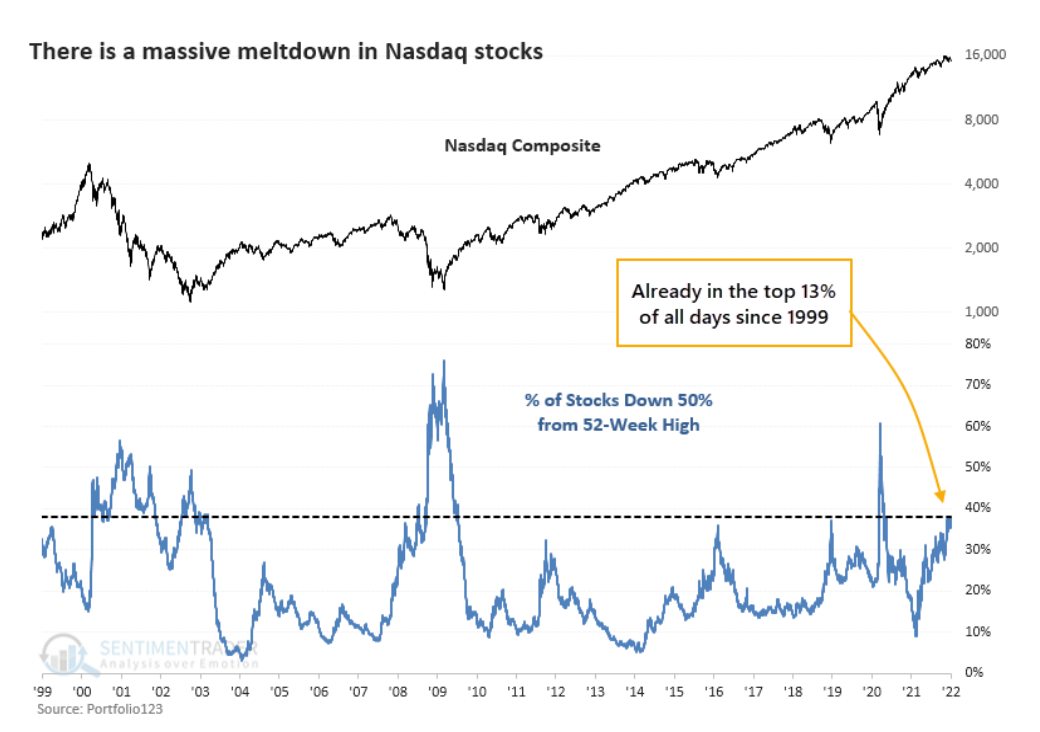
What People Are Saying

Definitions

Volume Areas: A structurally sound market will build on areas of high volume (HVNodes). Should the market trend for long periods of time, it will lack sound structure, identified as low volume areas (LVNodes). LVNodes denote directional conviction and ought to offer support on any test. 

If participants were to auction and find acceptance into areas of prior low volume (LVNodes), then future discovery ought to be volatile and quick as participants look to HVNodes for favorable entry or exit.

POCs: POCs are valuable as they denote areas where two-sided trade was most prevalent in a prior day session. Participants will respond to future tests of value as they offer favorable entry and exit.

MCPOCs: POCs are valuable as they denote areas where two-sided trade was most prevalent over numerous day sessions. Participants will respond to future tests of value as they offer favorable entry and exit.

Volume-Weighted Average Prices (VWAPs): A metric highly regarded by chief investment officers, among other participants, for quality of trade. Additionally, liquidity algorithms are benchmarked and programmed to buy and sell around VWAPs.

About

After years of self-education, strategy development, and trial-and-error, Renato Leonard Capelj began trading full-time and founded Physik Invest to detail his methods, research, and performance in the markets.

Additionally, Capelj is a Benzinga finance and technology reporter interviewing the likes of Shark Tank’s Kevin O’Leary, JC2 Ventures’ John Chambers, and ARK Invest’s Catherine Wood, as well as a SpotGamma contributor, helping develop insights around impactful options market dynamics.

Disclaimer

At this time, Physik Invest does not carry the right to provide advice. In no way should the materials herein be construed as advice. Derivatives carry a substantial risk of loss. All content is for informational purposes only.