Categories
Commentary

Daily Brief For December 23, 2021

What Happened

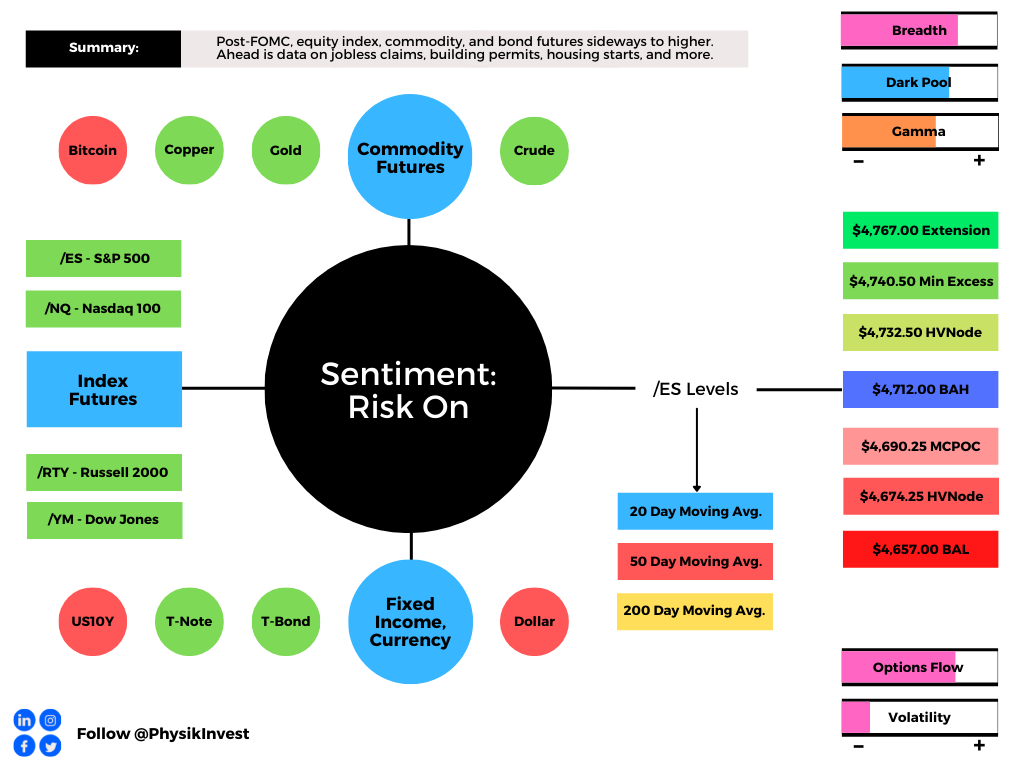
Led by the Russell 2000, overnight, equity index futures continued higher while commodities were mixed and bonds were a touch lower. Friday, December 24, markets are closed.

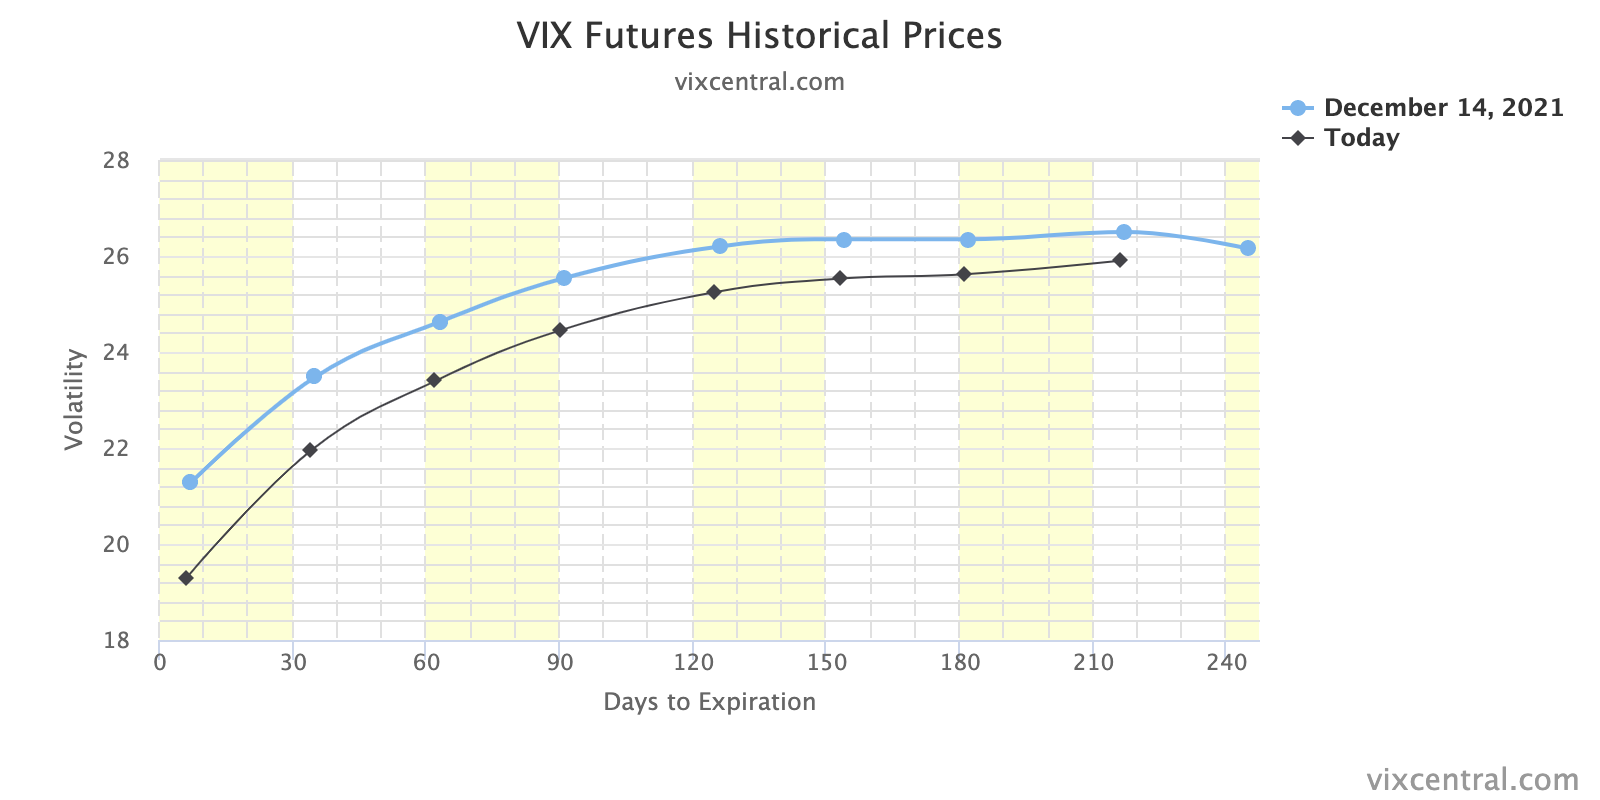
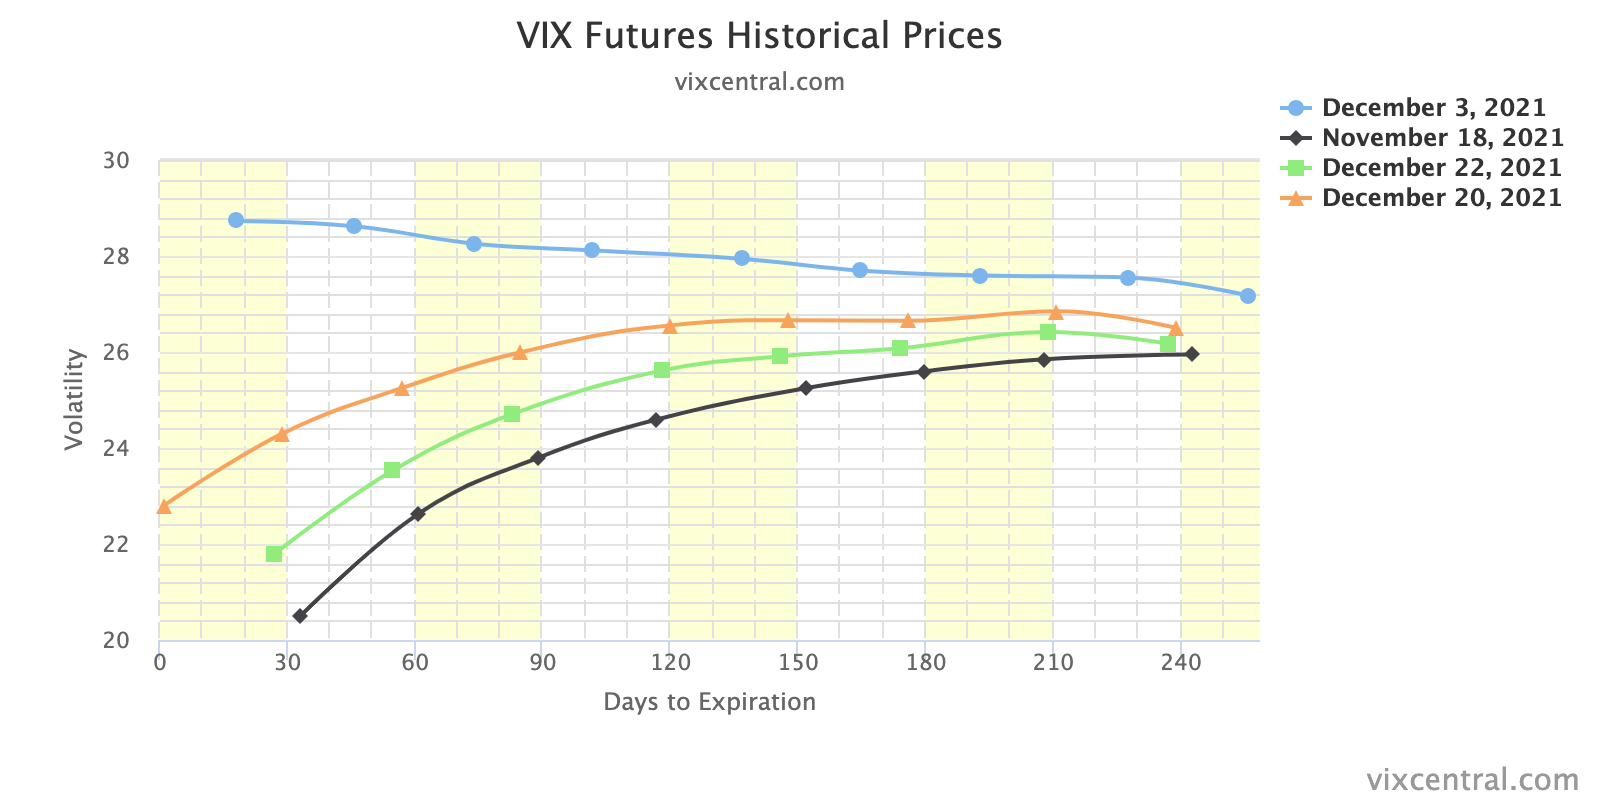
Pursuant to comments made earlier this week, volatility was sold aggressively; the CBOE Volatility Index (INDEX: VIX) dropped ~9.00. This coincides with a compression in the VIX’s term structure, and that has so-called bullish/supportive implications.

Ahead is data on jobless claims, personal income, consumer spending, inflation, disposable income, goods orders (8:30 AM ET), as well as new home sales, University of Michigan sentiment, and five-year inflation expectations (10:00 AM ET).

Graphic updated 6:40 AM ET. Sentiment Risk-On if expected /ES open is above the prior day’s range. /ES levels are derived from the profile graphic at the bottom of the following section. Levels may have changed since initially quoted; click here for the latest levels. SqueezeMetrics Dark Pool Index (DIX) and Gamma (GEX) calculations are based on where the prior day’s reading falls with respect to the MAX and MIN of all occurrences available. A higher DIX is bullish. At the same time, the lower the GEX, the more (expected) volatility. Learn the implications of volatility, direction, and moneyness. SHIFT data used for S&P 500 (INDEX: SPX) options activity. Note that options flow is sorted by the call premium spent; if more positive then more was spent on call options. Breadth reflects a reading of the prior day’s NYSE Advance/Decline indicator. VIX reflects a current reading of the CBOE Volatility Index (INDEX: VIX) from 0-100.

What To Expect

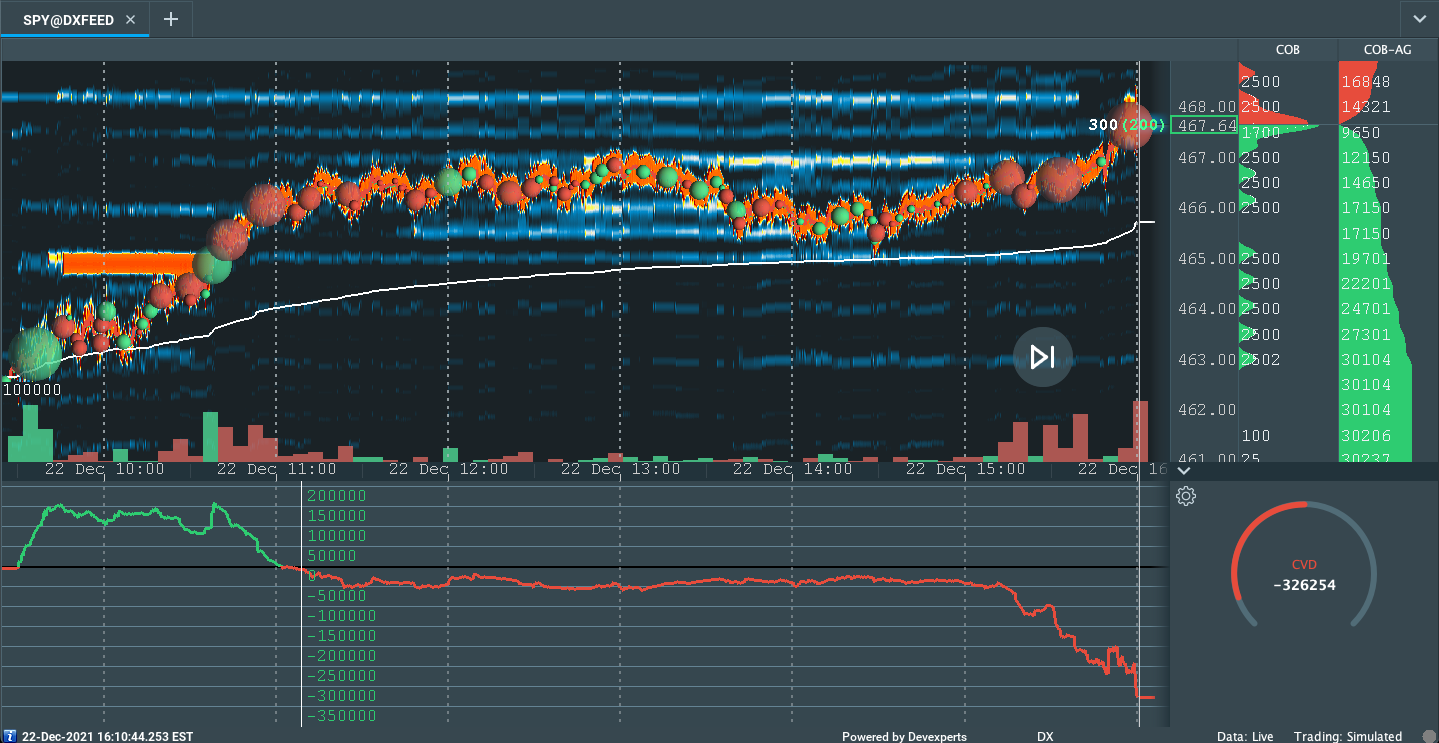
On lackluster intraday breadth and divergent market liquidity metrics, the best case outcome occurred, via the S&P 500’s spike close higher, away from intraday value, the levels at which participants found it most favorable to transact.

This activity, which marks the continuation of an earlier trend change, is built on poor structure. 

That, ultimately, adds to technical instability.

Why? If you haven’t noticed, the levels quoted daily in this particular commentary seem to be holding to the tick. Given the persistence of mechanical responses to key technical levels, visually-driven, weaker-handed participants (which seldom bear the wherewithal to defend retests) carry a heavier hand in recent price discovery. 

Via volume profile analysis, we see a plethora of low-volume pockets – voids, if you will – that likely hold virgin tests. As stated, yesterday, successful penetration portends follow-through given the participants that were most active at those technical levels. Caution is warranted.

Graphic: Divergent delta (i.e., non-committed buying as measured by volume delta or buying and selling power as calculated by the difference in volume traded at the bid and offer) in SPDR S&P 500 ETF Trust (NYSE: SPY), one of the largest ETFs that track the S&P 500 index, via Bookmap. The readings are supportive of responsive trade (i.e., rotational trade that suggests current prices offer favorable entry and exit; the market is in balance).

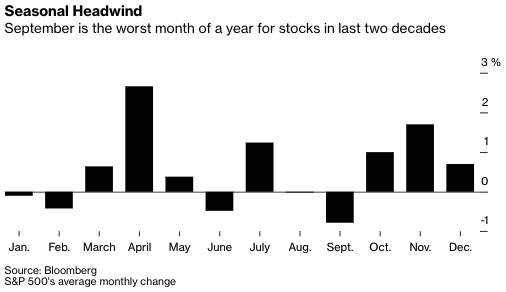
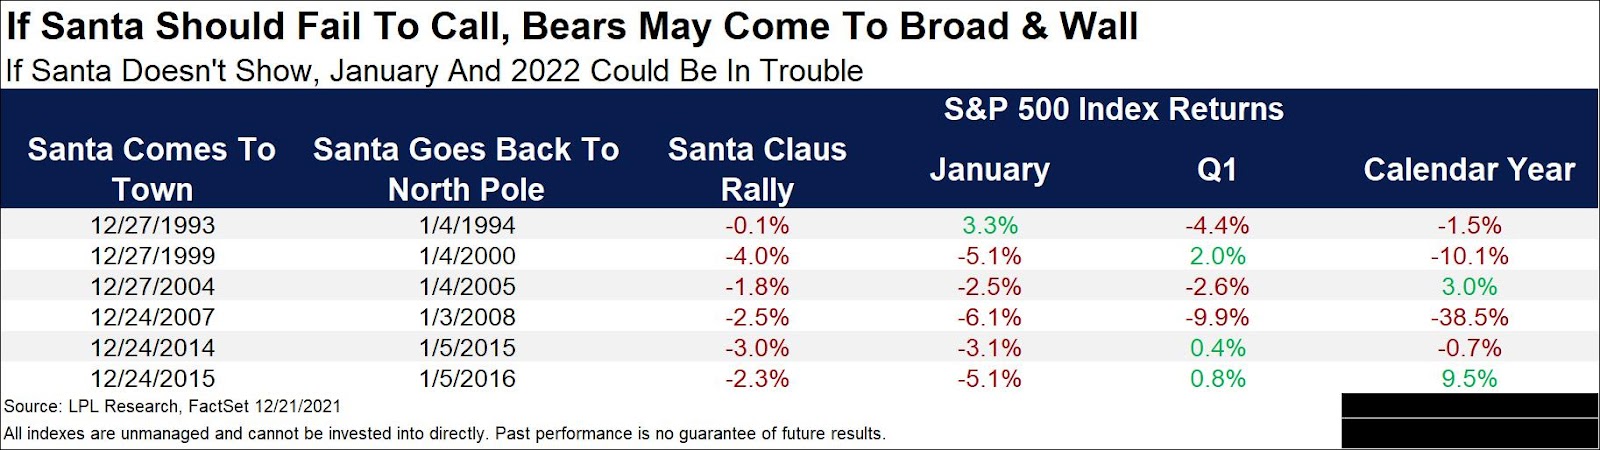
Context: According to Ryan Detrick of LPL Financial, the “official Santa Claus Rally starts this Monday (last 5 days of the year and the first two of the following year).”

The 7 days (after this Monday) are up nearly 79% of the time. 

However, in the past 5 occurrences, “Jan was also in the red and Q1 been weak as well.”

Graphic: LPL Financial on the so-called Santa Claus rally.

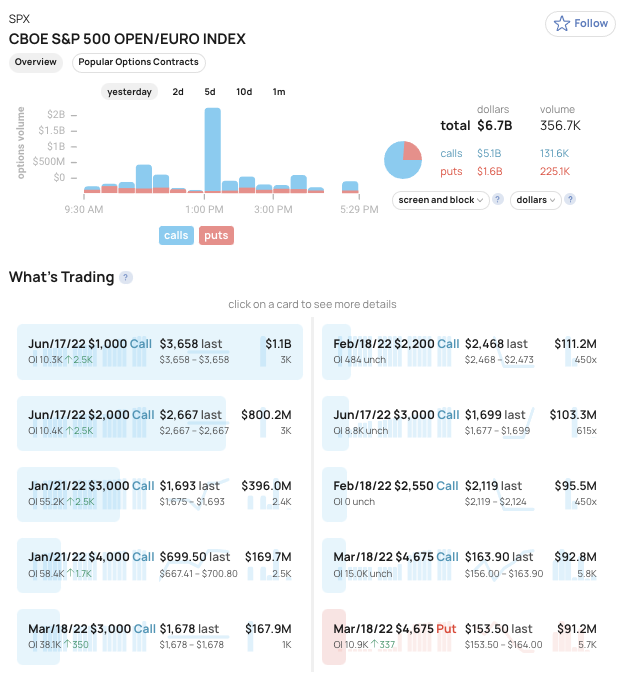
This activity comes after last week’s weighty “quad-witching” and ahead of the December “Quarterlys” expiry.

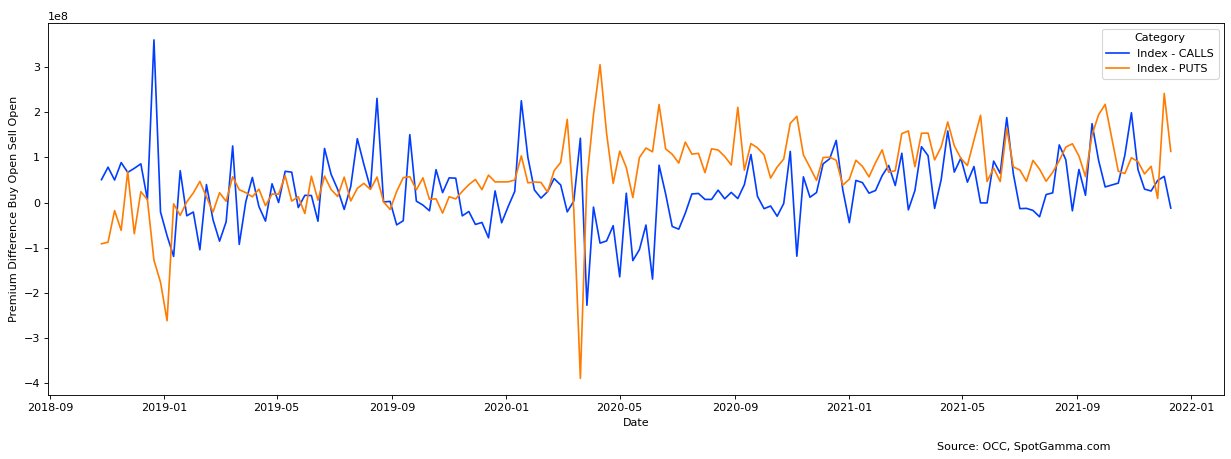
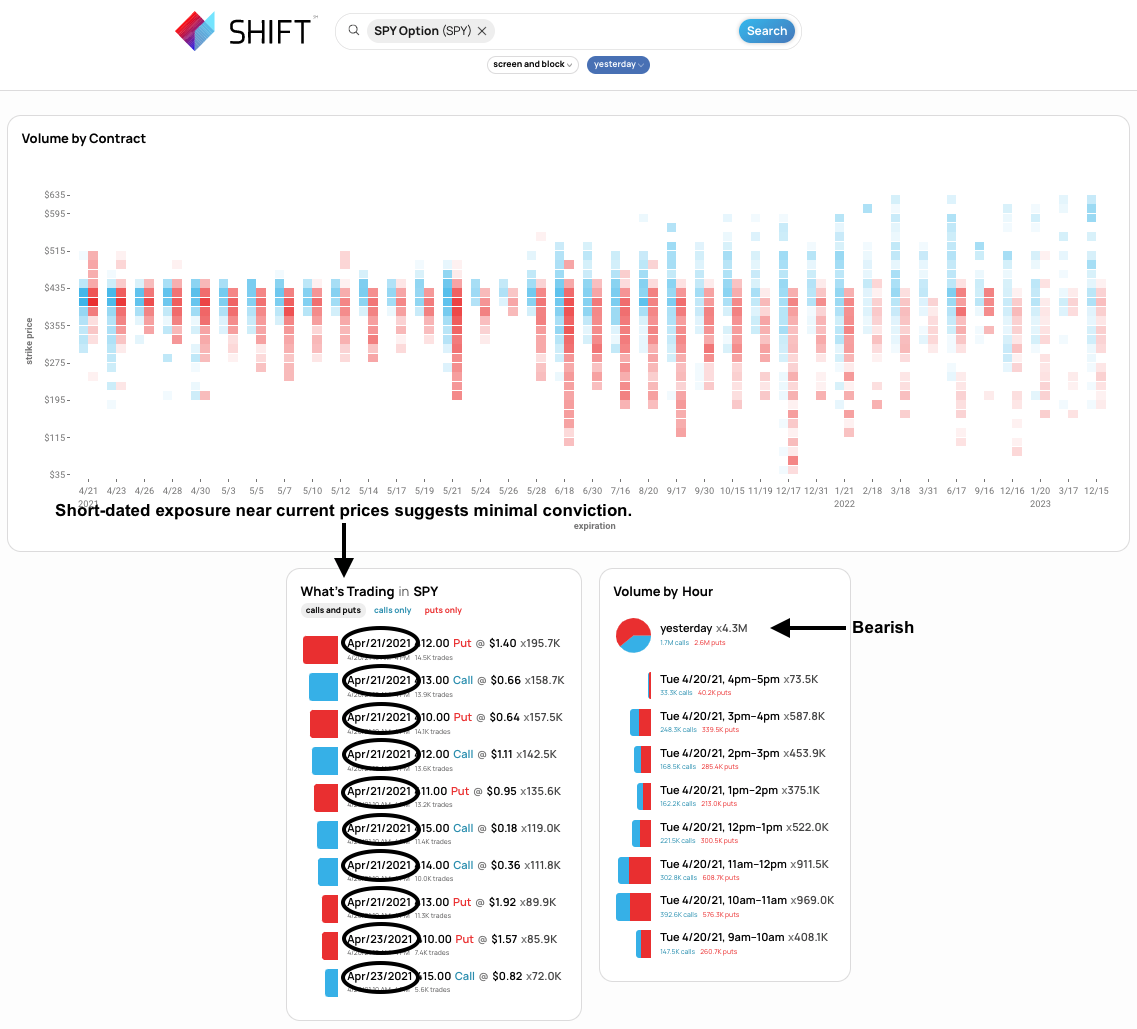
The exposure that rolled (and is to roll) off was “put-heavy.”

Participants’ commitment to capital at strikes lower in price and out in time – in the face of weak breadth and bearish fundamental developments – in single stocks, fed into the indices, also. 

According to SpotGamma, the December 17 expiration cleared quite a bit of negative delta (e.g., the ARK Innovation ETF [NYSE: ARKK] had $1.5 billion in notional put delta expire).

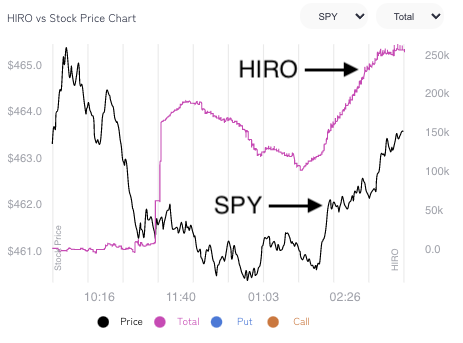
This opened a window of strength and realized volatility, wherein positive fundamental forces and dealers’ covering of hedges could bolster any recovery.

So, it is this week’s collapse in implied volatility (and associated collapse in term structure), coupled with the pending management of large S&P positions, and relentless, seasonally-aligned “passive buying support,” which brought positive flows bolstering this “Santa Claus rally.”

Graphic: Shift Search data suggests participants are likely initiating box spreads and rolling their call exposure out in time (as much as 6 months).

Notwithstanding, as mentioned, yesterday, Goldman Sachs Group (NYSE: GS) saw “options selling strategies as attractive in the near term,” estimating “a 12% probability of a 1-month 5% down-move in the SPX in this economic environment based on [the] GS-EQMOVE model.”

“Options are pricing a 22% probability of that size move indicating that puts are overvalued.”

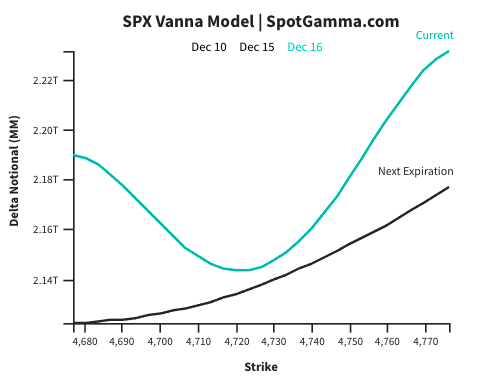
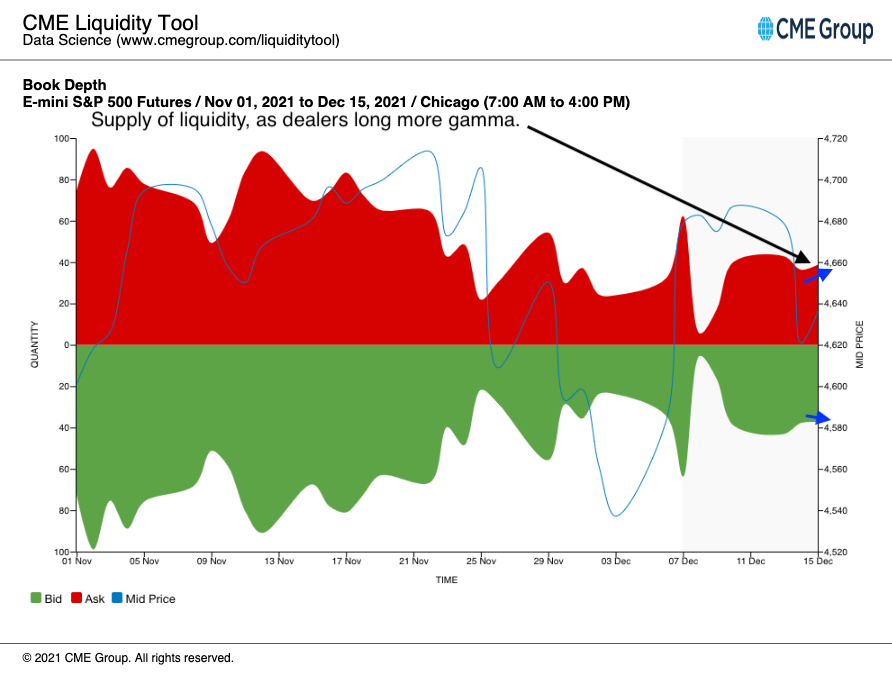
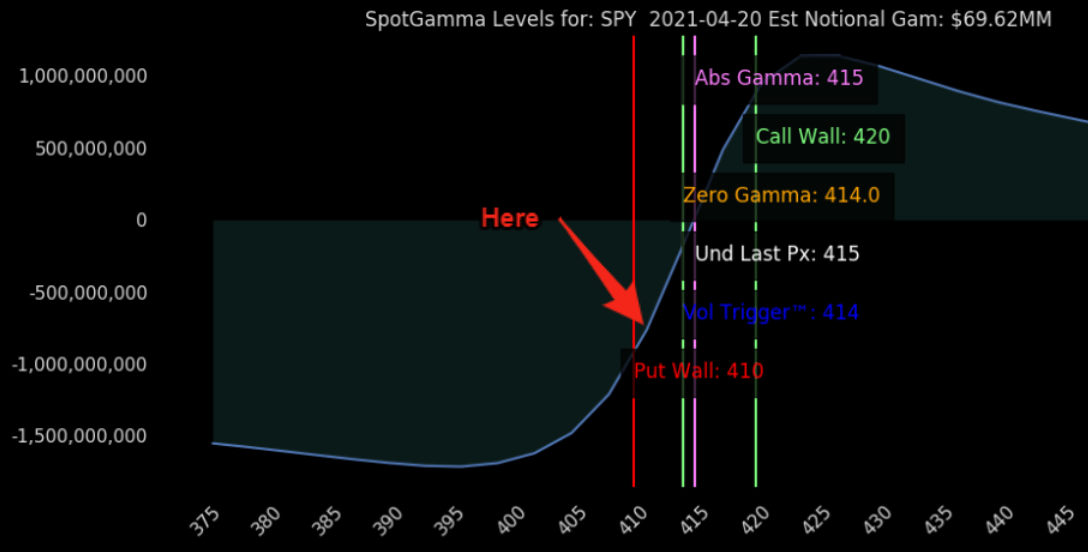
As noted Tuesday, the commitment of capital on lower volatility results in counterparties taking on more exposure to positive gamma. The growth in positive gamma (as the data is showing) will be offset through the dealers’ supply of liquidity, pressuring the price discovery process.

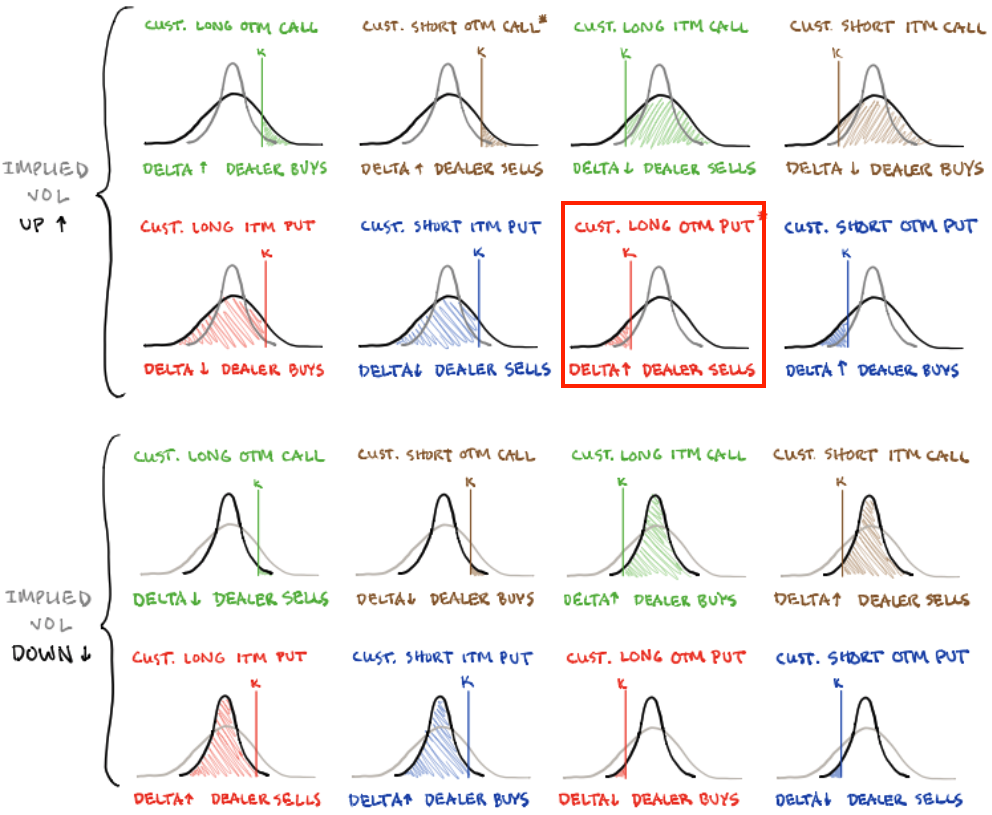
Note: As a position’s delta rises with stock or index price rises, gamma (or how an option’s delta is expected to change given a change in the underlying) is added to the delta.

This is while many products are in lower liquidity and short-gamma (wherein an options delta decreases with stock prices rises and increases when stock prices drop) in which moves are more erratic.

Therefore, coming into weighty options expirations, correlations may be off (as that is the only reconciliation in an environment where, at the index level, hedging pressures are sticky, whereas elsewhere they aren’t).

Thereafter, participants ought to monitor the sides and levels capital is committed for clues as to where we go next. Continued compression of volatility, as well as a commitment to options higher in prices and further out in time, supports upward price discovery.

Graphic: Via The Market Ear, “There have been five prior years since 1953 (when we went to the 5-day trading week) that have seen December as the most volatile month: 1973, 1978, 1985, 1995, and 2018. The January following these five prior years was BIG positive four out of five times, with January 2019 seeing the biggest gain.”

Weakness (alongside a commitment to strikes lower in price and out in time) likely sets the market up for another round of instability, as realized in late November and early December.

Graphic: A compression in the VIX term structure would provide markets with a boost.

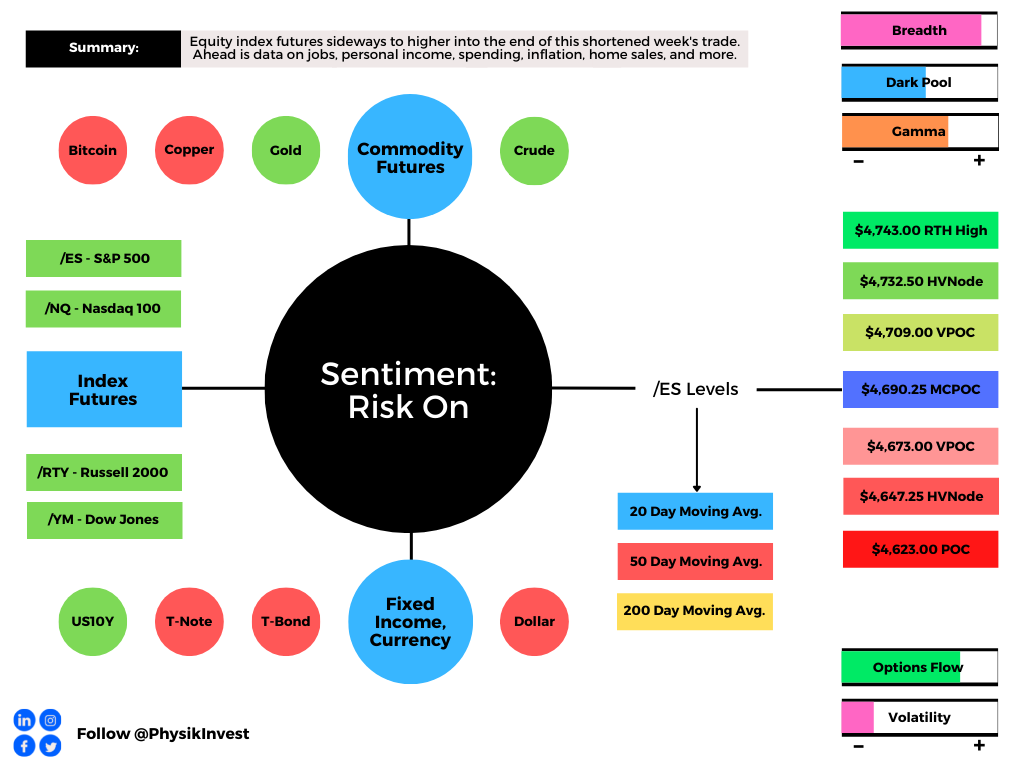
Expectations: As of 6:30 AM ET, Thursday’s regular session (9:30 AM – 4:00 PM ET), in the S&P 500, will likely open in the upper part of a positively skewed overnight inventory, outside of prior-range and -value, suggesting a potential for immediate directional opportunity.

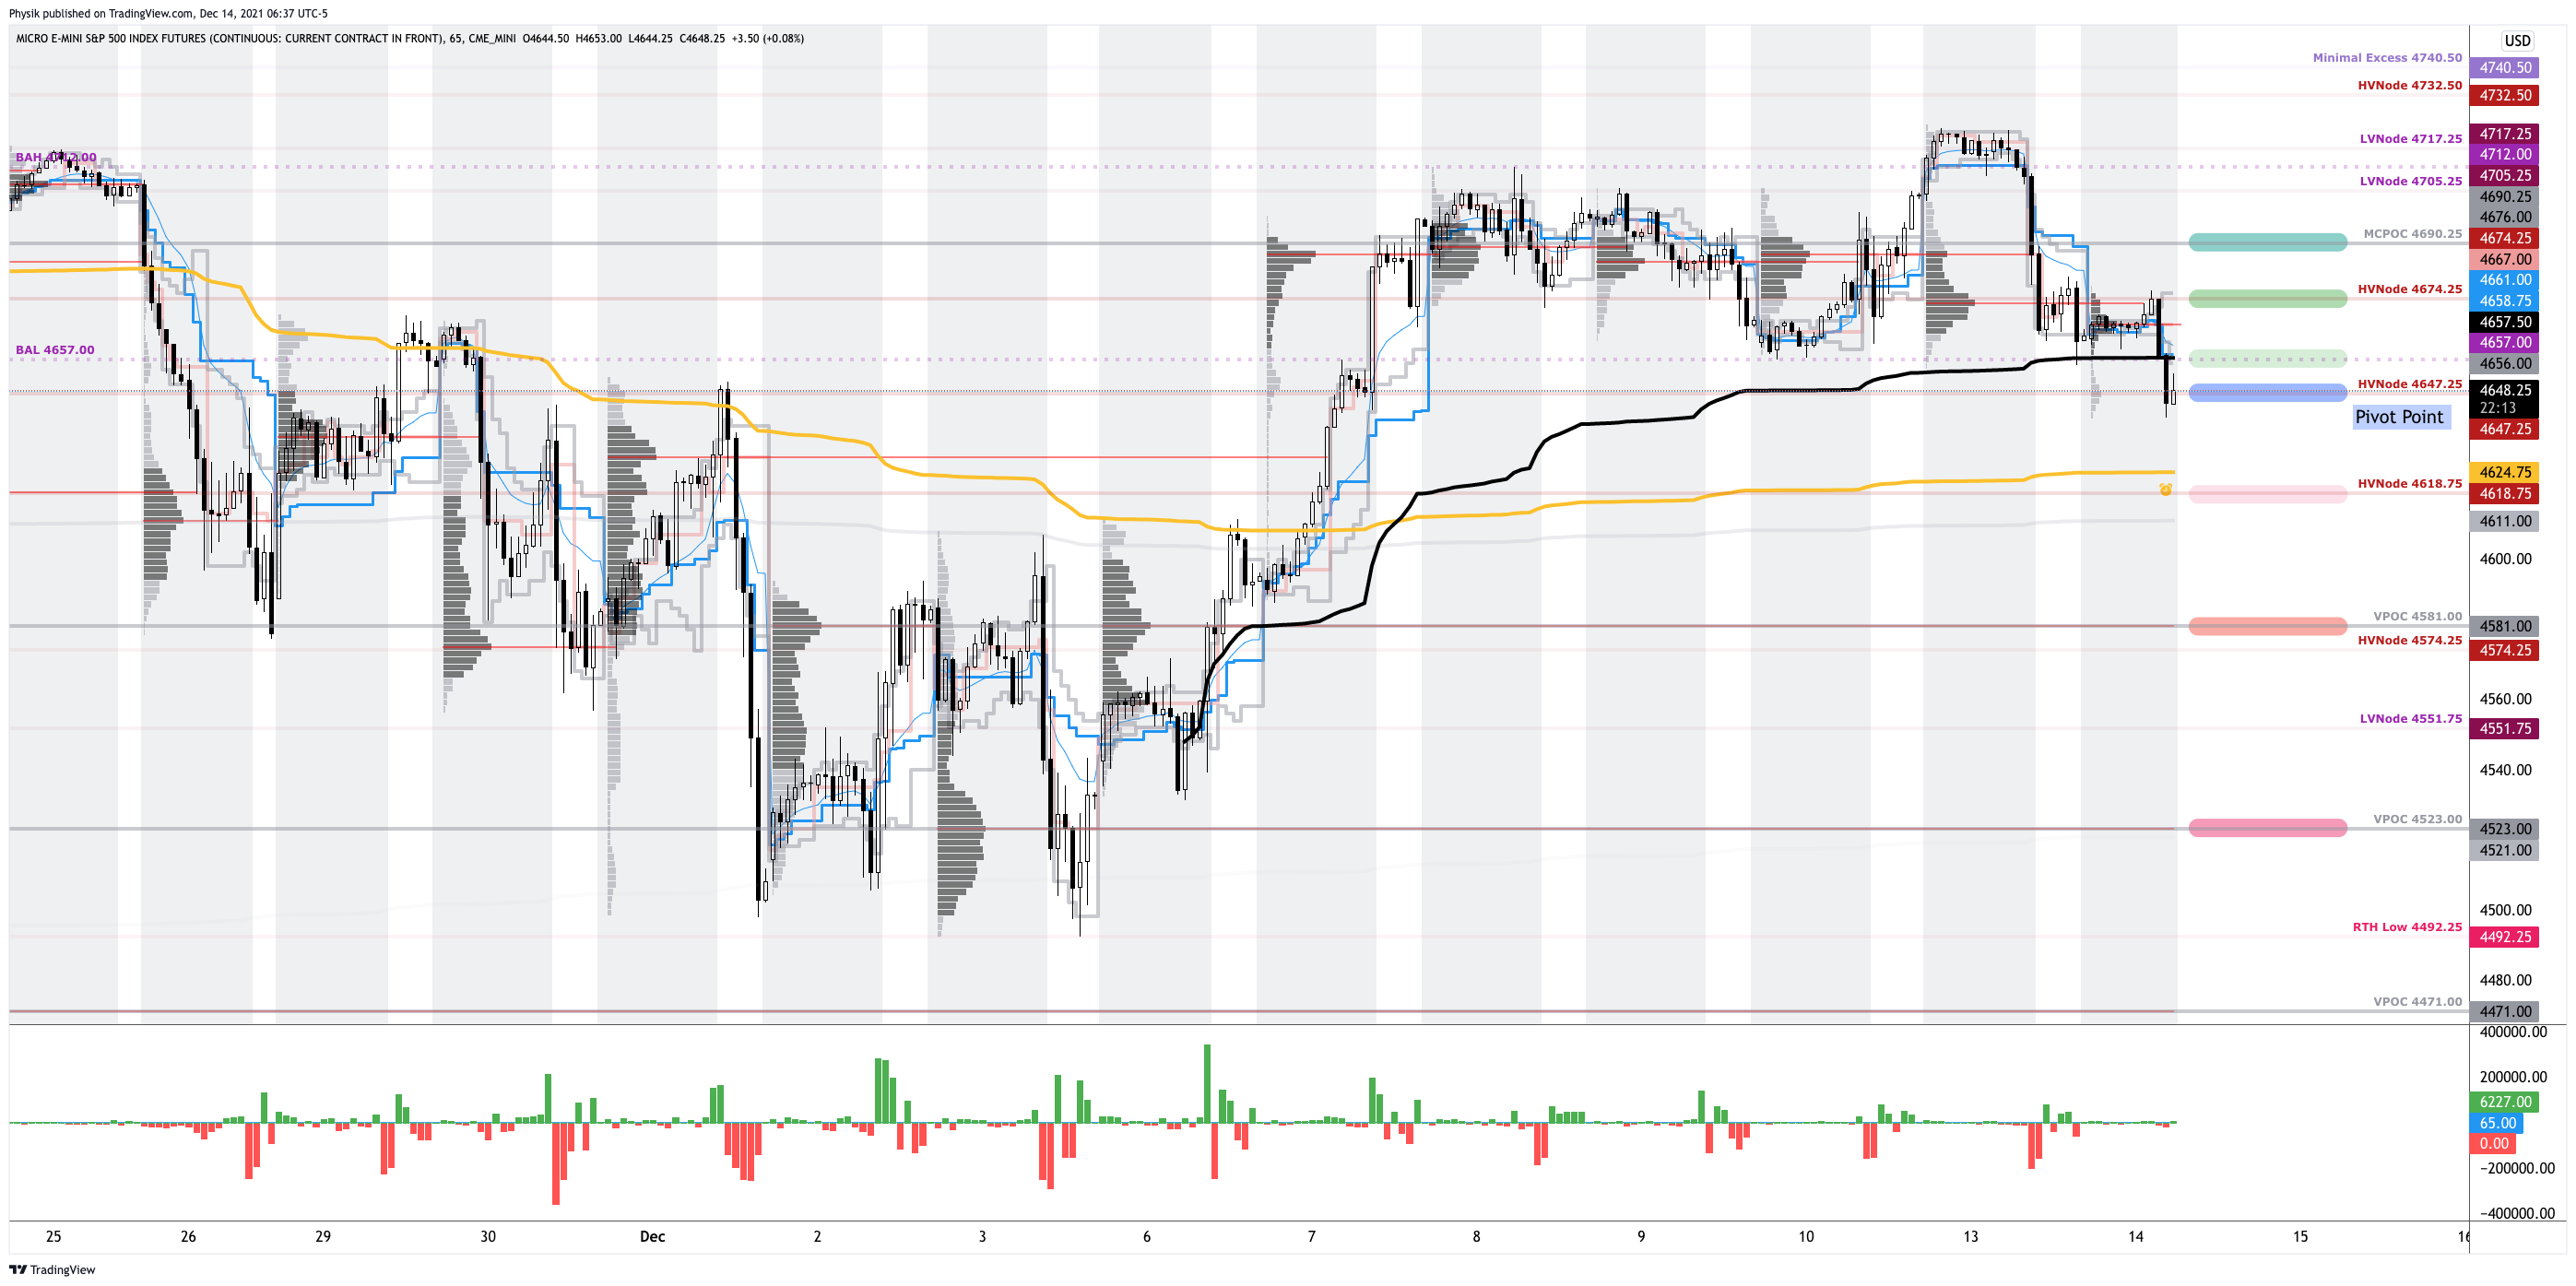
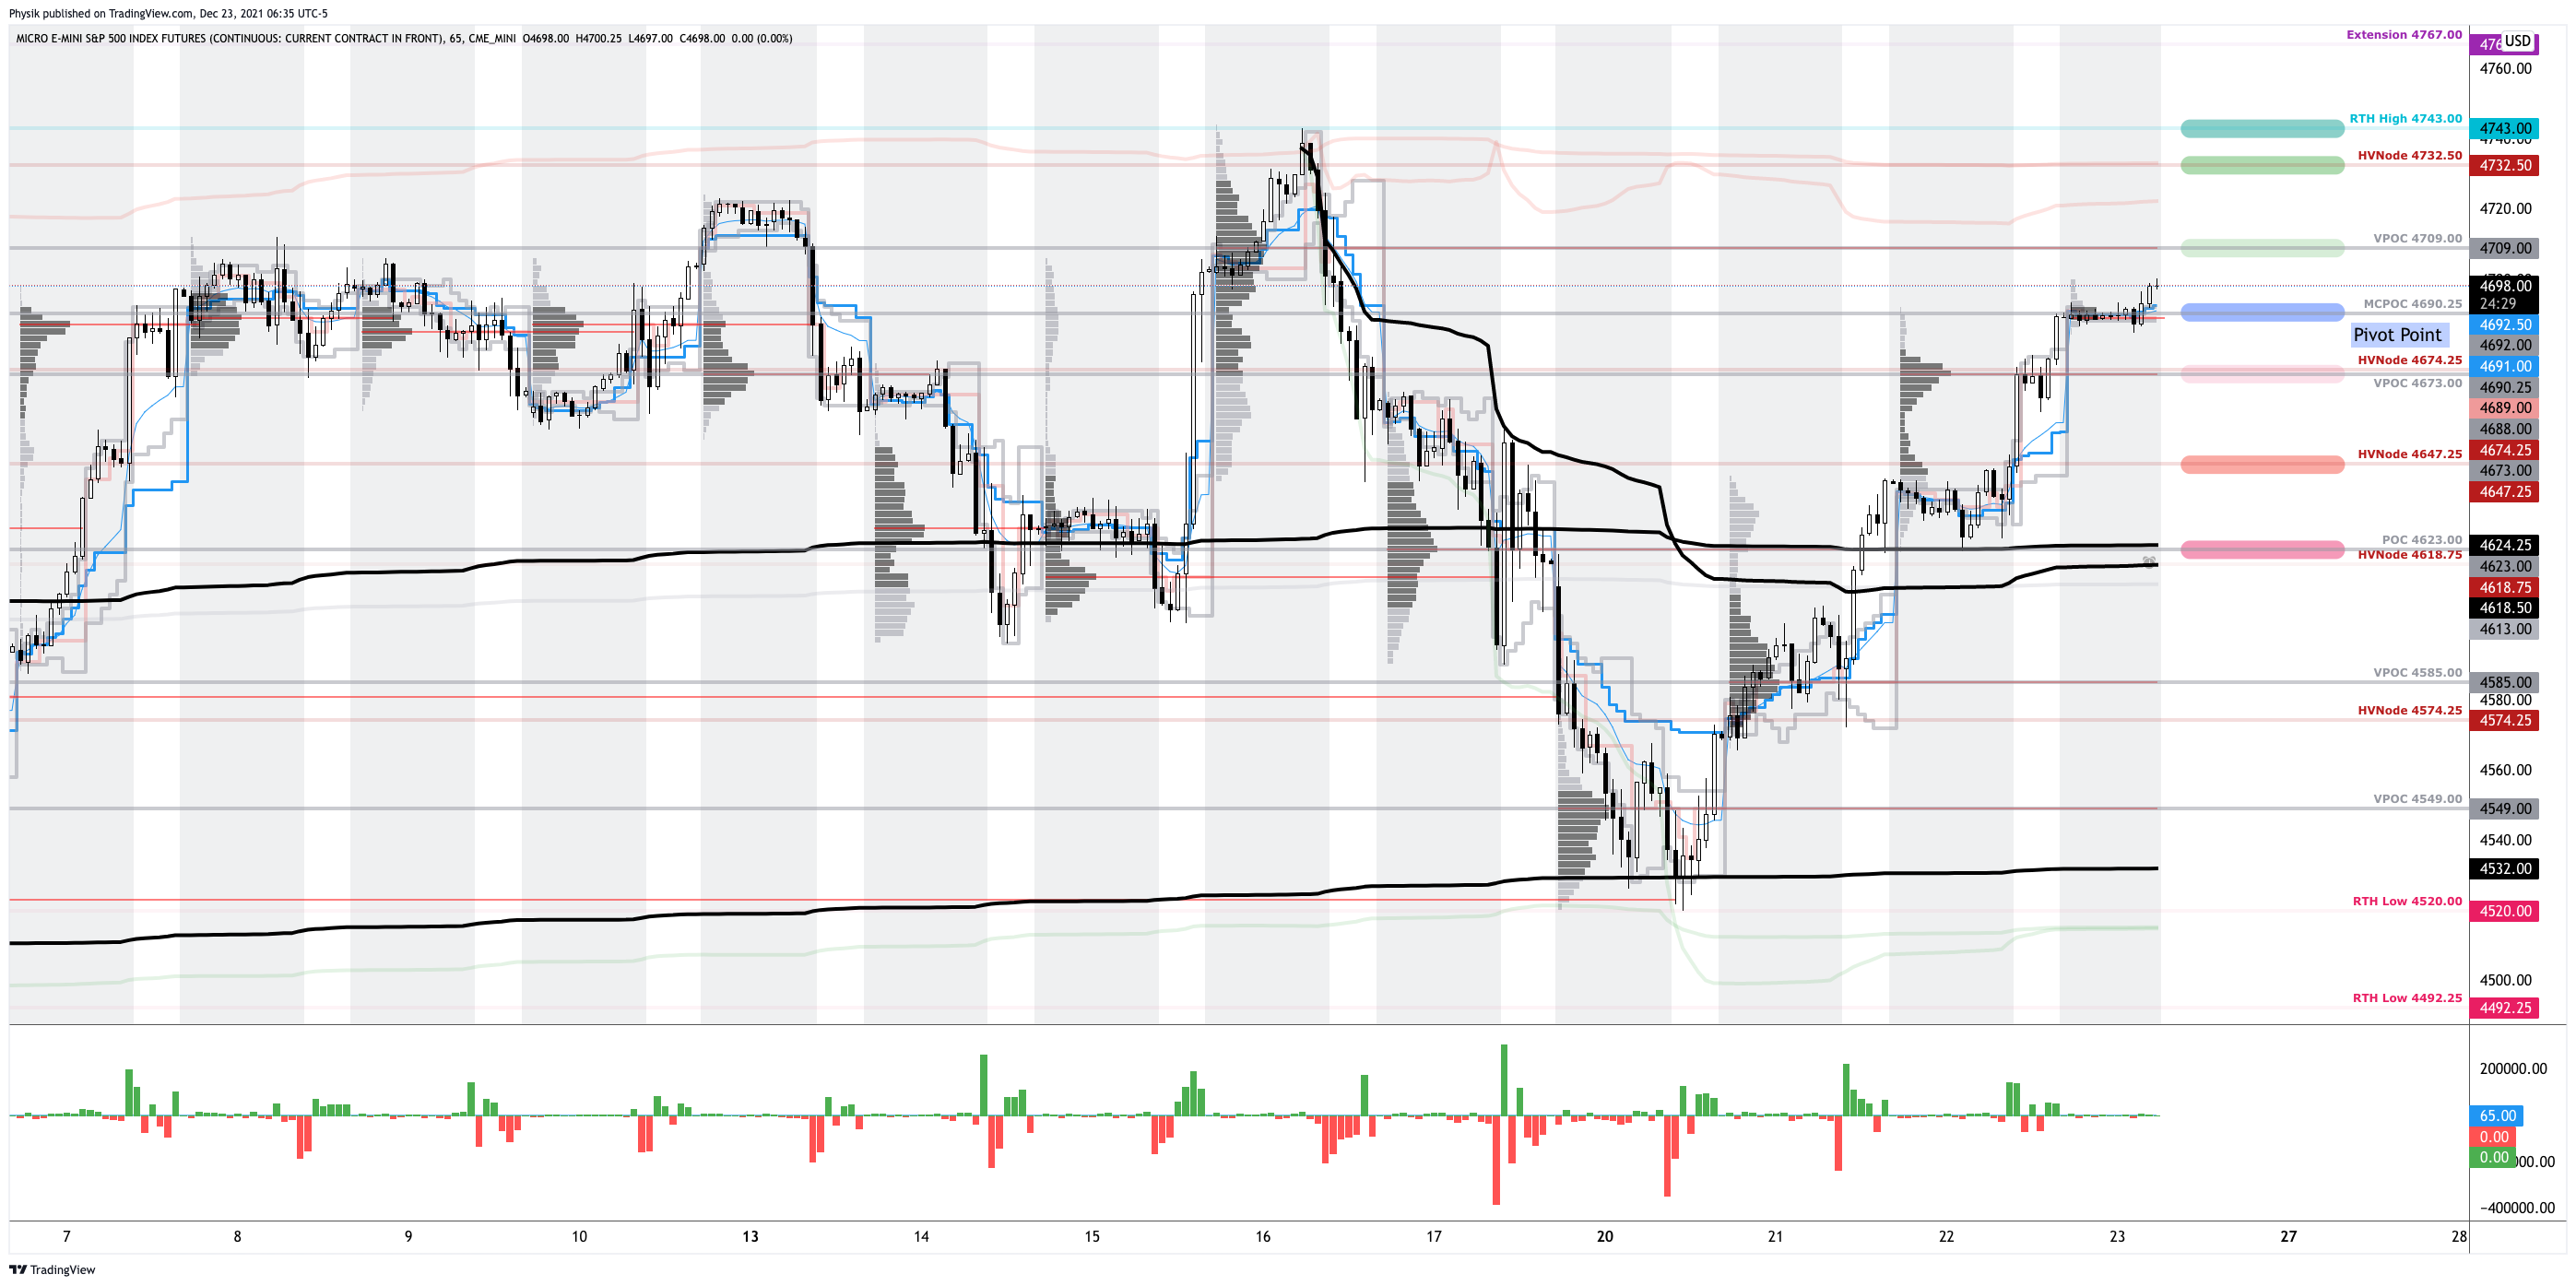
Spike Rules In Play: Spike’s mark the beginning of a break from value. Spikes higher (lower) are validated by trade at or above (below) the spike base (i.e., the origin of the spike). 

The spike base is $4,678.50. Below bearish (change in tone). Above bullish (status quo).

In the best case, the S&P 500 trades sideways or higher; activity above the $4,690.75 micro composite point of control (MCPOC) puts in play the $4,709.00 untested point of control (VPOC). Initiative trade beyond the VPOC could reach as high as the $4,732.50 high volume area (HVNode) and $4,743.00 regular trade high (RTH High), or higher.

In the worst case, the S&P 500 trades lower; activity below the $4,690.25 MCPOC puts in play the $4,673.00 VPOC. Initiative trade beyond the VPOC could reach as low as the $4,647.25 HVNode and $4,623.00 POC, or lower.

Click here to load today’s key levels into the web-based TradingView charting platform. Note that all levels are derived using the 65-minute timeframe. New links are produced, daily.
Graphic: 65-minute profile chart of the Micro E-mini S&P 500 Futures. Learn about the profile.

Definitions

Volume Areas: A structurally sound market will build on areas of high volume (HVNodes). Should the market trend for long periods of time, it will lack sound structure, identified as low volume areas (LVNodes). LVNodes denote directional conviction and ought to offer support on any test. 

If participants were to auction and find acceptance into areas of prior low volume (LVNodes), then future discovery ought to be volatile and quick as participants look to HVNodes for favorable entry or exit.

POCs: POCs are valuable as they denote areas where two-sided trade was most prevalent in a prior day session. Participants will respond to future tests of value as they offer favorable entry and exit.

MCPOCs: POCs are valuable as they denote areas where two-sided trade was most prevalent over numerous day sessions. Participants will respond to future tests of value as they offer favorable entry and exit.

Significance Of Prior ATHs, ATLs: Prices often encounter resistance (support) at prior highs (lows) due to the supply (demand) of old business. These areas take time to resolve. Breaking and establishing value (i.e., trading more than 30-minutes beyond this level) portends continuation.

Price Discovery (One-Timeframe Or Trend): Elongation and range expansion denotes a market seeking new prices to establish value, or acceptance (i.e., more than 30-minutes of trade at a particular price level). 

Volume-Weighted Average Prices (VWAPs): A metric highly regarded by chief investment officers, among other participants, for quality of trade. Additionally, liquidity algorithms are benchmarked and programmed to buy and sell around VWAPs.

About

After years of self-education, strategy development, and trial-and-error, Renato Leonard Capelj began trading full-time and founded Physik Invest to detail his methods, research, and performance in the markets.

Additionally, Capelj is a Benzinga finance and technology reporter interviewing the likes of Shark Tank’s Kevin O’Leary, JC2 Ventures’ John Chambers, and ARK Invest’s Catherine Wood, as well as a SpotGamma contributor, helping develop insights around impactful options market dynamics.

Disclaimer

At this time, Physik Invest does not carry the right to provide advice. In no way should the materials herein be construed as advice. Derivatives carry a substantial risk of loss. All content is for informational purposes only.

Categories
Commentary

Daily Brief For December 16, 2021

What Happened

After the Federal Reserve (Fed) announced it would accelerate its taper to bond-buying, clearing the way for interest-rate hikes, the equity market rallied, broadly. 

With all major U.S. equity index futures trading higher, overnight, it appears that participants’ fears regarding monetary policy have been assuaged

As forecasted, a collapse in event-related implied volatility brought in positive flows that ought to support the market into this week’s weighty “quad-witching” derivatives expiry.

Ahead is data on jobless claims, building permits, housing starts, and manufacturing (8:30 AM ET). Then, there are releases on industrial production, capacity utilization (9:15 AM ET), as well as Markit manufacturing and services PMI (9:45 AM ET). 

Graphic updated 6:15 AM ET. Sentiment Risk-On if expected /ES open is above the prior day’s range. /ES levels are derived from the profile graphic at the bottom of the following section. Levels may have changed since initially quoted; click here for the latest levels. SqueezeMetrics Dark Pool Index (DIX) and Gamma (GEX) calculations are based on where the prior day’s reading falls with respect to the MAX and MIN of all occurrences available. A higher DIX is bullish. At the same time, the lower the GEX, the more (expected) volatility. Learn the implications of volatility, direction, and moneyness. SHIFT data used for S&P 500 (INDEX: SPX) options activity. Note that options flow is sorted by the call premium spent; if more positive then more was spent on call options. Breadth reflects a reading of the prior day’s NYSE Advance/Decline indicator. VIX reflects a current reading of the CBOE Volatility Index (INDEX: VIX) from 0-100.

What To Expect

Market hammered out a low, yesterday. 

This was after, to start the week, customers had been increasing their exposure to short-delta (call selling and put buying). The counterparty inventorying the opposite (long-delta) exposure sold (bought) futures into price discovery higher (lower).

Graphic: Customers increased their exposure to short-delta call exposure. “Last week was about selling index calls,” SpotGamma’s Brent Kochuba said on Twitter. “This is likely why the $SPX stopped at $4,700.00.”

This dynamic had the effect of pinning the market; was the S&P 500 to remain in consolidation, customers’ (dealers’) short-delta (long-delta) would have risen which would have made for even more pinning.

That didn’t happen, though.

Into Wednesday’s FOMC event, demand for protection expanded (as evidenced by a higher CBOE Volatility Index reading). That knocked most of the major indexes out of sideways trade.

However, as revealed Tuesday by SpotGamma’s (beta) Hedging Impact of Real-Time Options (HIRO) indicator, “participants saw lower prices as an opportunity to express their opinion of lower volatility into Wednesday’s Federal Open Market Committee (FOMC) update.”

From there on, as Ambrus Group’s Kris Sidial best explained, “vols were static in anticipation of the fed talk,” taking away from supportive flows (as a result of options sliding down their term structure [vanna]) and promoting sideways trade.

Graphic: SpotGamma’s Hedging Impact of Real-Time Options (HIRO) indicator, which is pink in color, was sideways to higher. This suggests positive options delta trades likely had dealers buying stock/futures into the close.

Context: Wednesday’s commentary really hit the nail on the head, so to speak. 

Therefore, I offer some light updates.

As expected, per Nordea, the Fed will “accelerate its tapering process, and is now set to conclude net purchases already by mid-March vs mid-June with the earlier pace.”

“The dot plot was revised significantly higher, and the plot now shows three hikes for next year, a further three for 2023 and another two for 2024.”

Graphic: “[T]he terminal rate being priced in by financial markets is closer to 1.5% vs. 2.5% for the Fed,” Nordea explained. “The market is now pricing that rate hikes could start already in the mid-March 2022 meeting.”

That said, today’s rates support validations better than in the ‘90s.

At the same time, equity markets tend to rally into the first hike; Moody’s Corporation’s (NYSE: MCO) forecast aligns with that – “the Dow Jones Industrial Average increases this quarter and peaks in early 2022, … [followed by] steady decline through 2022.”

Graphic: S&P 500 performance before and after rate hikes.

This positive take is in the face of what has been markedly divergent breadth and extreme relative weakness, especially in rate-sensitive names. 

Why? Rising rates, among other factors, have the potential to decrease the present value of future earnings, thereby making stocks, especially those that are high growth, less attractive. 

Graphic: As U.S. stocks’ inflation-adjusted earnings yield turns negative, as seen near the peak of the tech bubble, via Bloomberg, “Investors in the Nasdaq increasingly seem to think that only a few companies have much of a chance. With a growing possibility of more aggressive attempts to prosecute antitrust issues, that’s a riskier position than it appears.”

With the equity market moving higher, here, into the end of the week, we ought to not discount participants’ increasing exposure to leveraged products.

This increases the speed with which volatility is realized and was cited as a risk in one of Moody’s recent commentaries.

So, despite having seasonally-aligned “passive buying support” and supportive positioning metrics, as well as expectations of “the strongest quarterly nominal [economic] growth in more than three decades,” offsides positioning ought to exacerbate underlying price movements.

So what? As stated, yesterday, the market is in a positive-gamma environment wherein the counterparties to customer options trades add market liquidity and temper realized volatility.

With participants’ fears surrounding monetary policy assuaged, there are positive flows that ought to support the market into this week’s weighty “quad-witching” derivatives expiry.

Graphic: VIX term shifts inward; as short-dated protection quickly was monetized or expired, volatility collapsed and dealers’ exposure to positive delta declined which meant they would cover their short futures hedges. This “vanna” flow bolstered an SPX rally into the end-of-day.

Into the end of the week, the expectation is that participants continue to step in and commit increased capital on lower directional volatility (as they had into this week).

With activity concentrated in shorter-dated tenors, counterparties will take on more exposure to positive gamma which they will offset by supplying the market with more liquidity, thereby pressuring the price discovery process.

Graphic: Via SpotGamma data, the above model’s tilt suggests dealers will increasingly sell into strength and buy into weakness, pressuring any price discovery into the end of this week.

Moreover, the decrease in dealer supply (short delta) post-OPEX, via the covering of short stock/futures hedges to put-heavy positioning, ought to bolster any attempt higher.

Below: Though book depth “in isolation is not the correct method to gauge liquidity,” it can help in assessing participants’ demand/supply as volatility (and stress, by that token) increases.

Graphic: Analysis of book depth for the E-mini S&P 500 futures contract, via CME Group Inc’s (NASDAQ: CME) Liquidity Tool. For more on the implications of participants’ options positioning and dealer hedging, read here.

In anticipation of higher prices, low cost, complex options structures like call-side calendars, butterflies, and ratio spreads are top of mind.

Graphic: Via Banco Santander SA (NYSE: SAN) research, the return profile, at expiry, of a classic 1×2 (long 1, short 2 further away) ratio spread.

Expectations: As of 6:15 AM ET, Thursday’s regular session (9:30 AM – 4:00 PM ET), in the S&P 500, will likely open in the upper part of a positively skewed overnight inventory, outside of prior-range and -value, suggesting a potential for immediate directional opportunity.

Balance-Break + Gap Scenarios: A change in the market (i.e., the transition from two-time frame trade, or balance, to one-time frame trade, or trend) is occurring.

Monitor for acceptance (i.e., more than 1-hour of trade) outside of the balance area. 

Leaving value behind on a gap-fill or failing to fill a gap (i.e., remaining outside of the prior session’s range) is a go-with indicator. 

Rejection (i.e., return inside of balance) portends a move to the opposite end of the balance.

In the best case, the S&P 500 trades sideways or higher; activity above the $4,712.00 balance area boundary (BAH) puts in play the $4,732.50 high volume area (HVNode). Initiative trade beyond the HVNode could reach as high as the $4,740.50 minimal excess high and $4,767.00 extension, or higher.

In the worst case, the S&P 500 trades lower; activity below the $4,712.00 BAH puts in play the $4,690.25 micro composite point of control (MCPOC). Initiative trade beyond the MCPOC could reach as low as the $4,674.25 HVNode and $4,657.00 balance low (BAL), or lower.

Click here to load today’s key levels into the web-based TradingView charting platform. Note that all levels are derived using the 65-minute timeframe. New links are produced, daily.
Graphic: 65-minute profile chart of the Micro E-mini S&P 500 Futures. Learn about the profile.
Graphic: V-pattern recovery in SPDR S&P 500 ETF Trust (NYSE: SPY), one of the largest ETFs that track the S&P 500 index, portends continuation. The red, black, and yellow-colored lines are anchored volume-weighted average price levels (VWAPs), metric highly regarded by chief investment officers, among other participants, for quality of trade. Additionally, liquidity algorithms are benchmarked and programmed to buy and sell around VWAPs.

Definitions

V-Pattern: A pattern that forms after a market establishes a high, retests some support, and then breaks above said high. In most cases, this pattern portends continuation.

Volume Areas: A structurally sound market will build on areas of high volume (HVNodes). Should the market trend for long periods of time, it will lack sound structure, identified as low volume areas (LVNodes). LVNodes denote directional conviction and ought to offer support on any test. 

If participants were to auction and find acceptance into areas of prior low volume (LVNodes), then future discovery ought to be volatile and quick as participants look to HVNodes for favorable entry or exit.

Gamma: Gamma is the sensitivity of an option to changes in the underlying price. Dealers that take the other side of options trades hedge their exposure to risk by buying and selling the underlying. When dealers are short-gamma, they hedge by buying into strength and selling into weakness. When dealers are long-gamma, they hedge by selling into strength and buying into weakness. The former exacerbates volatility. The latter calms volatility.

Vanna: The rate at which the delta of an option changes with respect to volatility.

Charm: The rate at which the delta of an option changes with respect to time.

MCPOCs: POCs are valuable as they denote areas where two-sided trade was most prevalent over numerous day sessions. Participants will respond to future tests of value as they offer favorable entry and exit.

Price Discovery (One-Timeframe Or Trend): Elongation and range expansion denotes a market seeking new prices to establish value, or acceptance (i.e., more than 30-minutes of trade at a particular price level). 

Excess: A proper end to price discovery; the market travels too far while advertising prices. Responsive, other-timeframe (OTF) participants aggressively enter the market, leaving tails or gaps which denote unfair prices.

About

After years of self-education, strategy development, and trial-and-error, Renato Leonard Capelj began trading full-time and founded Physik Invest to detail his methods, research, and performance in the markets.

Additionally, Capelj is a Benzinga finance and technology reporter interviewing the likes of Shark Tank’s Kevin O’Leary, JC2 Ventures’ John Chambers, and ARK Invest’s Catherine Wood, as well as a SpotGamma contributor, helping develop insights around impactful options market dynamics.

Disclaimer

At this time, Physik Invest does not carry the right to provide advice. In no way should the materials herein be construed as advice. Derivatives carry a substantial risk of loss. All content is for informational purposes only.

Categories
Commentary

Daily Brief For December 14, 2021

What Happened

Overnight, equity index futures were mixed after Monday’s failed balance-area breakout in the S&P 500 had that index rotate to and through the opposite end of a multi-day consolidation.

This is as market participants await clarity on monetary policy from the Federal Reserve and the weighty “quad-witching” derivatives expiry, late this week. 

Ahead is data on the producer price index (8:30 AM ET).

Graphic updated 6:40 AM ET. Sentiment Risk-Off if expected /ES open is below the prior day’s range. /ES levels are derived from the profile graphic at the bottom of the following section. Levels may have changed since initially quoted; click here for the latest levels. SqueezeMetrics Dark Pool Index (DIX) and Gamma (GEX) calculations are based on where the prior day’s reading falls with respect to the MAX and MIN of all occurrences available. A higher DIX is bullish. At the same time, the lower the GEX, the more (expected) volatility. Learn the implications of volatility, direction, and moneyness. SHIFT data used for S&P 500 (INDEX: SPX) options activity. Note that options flow is sorted by the call premium spent; if more positive then more was spent on call options. Breadth reflects a reading of the prior day’s NYSE Advance/Decline indicator. VIX reflects a current reading of the CBOE Volatility Index (INDEX: VIX) from 0-100.

What To Expect

A change in the market was occurring, yesterday, as participants sought to break the S&P 500 out of a multi-day balance area and discover higher prices.

Shortly after the U.S. cash open, however, there was no follow-through; the index liquidated to the opposite end of the balance with sellers turning aggressive into the close.

Selling carried-forward, overnight, as the S&P 500 made it through the low-end of balance before finding responsive buyers at an anchored volume-weighted average price (VWAP) level, at which liquidity algorithms are benchmarked and programmed to buy and sell.

As noted many sessions ago, prior discovery left gaps and p-shaped emotional, multiple-distribution profile structures (i.e., old-money covering shorts).

Participants are now revisiting, repairing, and strengthening – building out areas of high volume (HVNodes) via the cave-fill process – these areas of low volume (LVNodes).

Graphic: Supportive delta (i.e., committed selling into end-of-day as measured by volume delta or buying and selling power as calculated by the difference in volume traded at the bid and offer) in SPDR S&P 500 ETF Trust (NYSE: SPY), one of the largest ETFs that track the S&P 500 index, via Bookmap. Though initial readings were supportive of responsive trade (i.e., rotational trade that suggests current prices offer favorable entry and exit), selling turned aggressive with the S&P 500 breaking its multi-day consolidation low, overnight.

Context: The S&P 500 can’t seem to crack the pin beneath $4,700.00.

This pin is the result of customers committing capital to bets on low volatility into this week’s Federal Open Market Committee (FOMC) meeting and Friday’s large derivatives expiry.

Graphic: Customers increased their exposure to short-delta call exposure. “Last week was about selling index calls,” SpotGamma’s Brent Kochuba said on Twitter. “This is likely why the $SPX stopped at $4,700.00.”

According to SpotGamma, participants are increasing their short-delta exposure (via a lot of call selling and a bit of put buying). 

In hedging their rising (declining) long-delta exposure, the dealer or counterparty to this positioning will sell (buy) futures into strength (weakness)

This forces the market into a consolidation

This trend ought to continue until (A) there’s a collapse in event-related implied volatility which would bring in positive flows as dealers cover static hedges, (B) the poor breadth and single-stock weakness feeds into feverishly destabilizing demand for downside protection, or (C) participants commit more capital to calls further out in time and higher in price.

We talk about the implications of options positioning mainly because it is a growing market that provides a clear indication of how participants (no matter how large) are positioned. 

Also, with FOMC approaching, the “other” timeframe participant (e.g., the hedge funds and institutions behind impactful buy/sell programs) is likely awaiting policy clarity to reposition.

As Mind Over Markets author James Dalton best explained: “Market participants balance their positions in expectation of the market’s reaction to the external stimuli – there is simply no activity. Trade is not being facilitated in any direction, for there is little participation and no confidence.”

Notwithstanding, last night, we broke a multi-session balance area. Based on profile theory, a new trend may begin. Context, though, suggests otherwise. 

Participants (large in size) are seeking clarity and, given the market’s responsiveness to technical levels, weaker, less well-capitalized short-term participants are in control

Therefore, we ought to discount (give less weight to) what happens in the coming days.

If later this week, participants are assuaged of their fears surrounding monetary policy, a collapse in event-related implied volatility ought to bring in positive flows as the long delta (from dealers’ exposure to short puts) decreases.

The decrease in dealer supply (short delta), via covering of short stock/futures hedges, would bolster any attempt higher

According to SpotGamma, if “interest in call options was to grow (evidenced by a shift higher in the Call Wall), a rally into (and beyond) end-of-year is further affirmed.”

That’s not to say that some of the vulnerabilities like participants’ large exposure to leveraged products (which increases the speed with which volatility is realized) couldn’t prompt a round of destabilizing demand for downside protection.

So, the question is whether the few companies leading this year’s rally can continue to lead? 

Or, in light of recent exuberance in heavy-weights like Apple Inc (NASDAQ: AAPL), in which participants are underexposed to downside protection, post-FOMC demand for protection bids volatility and results in a destabilizing, reflexive reaction on the part of dealers.

Graphic: As U.S. stocks’ inflation-adjusted earnings yield turns negative, as seen near the peak of the tech bubble, via Bloomberg, “Investors in the Nasdaq increasingly seem to think that only a few companies have much of a chance. With a growing possibility of more aggressive attempts to prosecute antitrust issues, that’s a riskier position than it appears.”

Expectations: As of 6:30 AM ET, Tuesday’s regular session (9:30 AM – 4:00 PM ET), in the S&P 500, will likely open in the lower part of a balanced overnight inventory, outside of prior-range and -value, suggesting a potential for immediate directional opportunity.

Balance-Break + Gap Scenarios: A change in the market (i.e., the transition from two-time frame trade, or balance, to one-time frame trade, or trend) is occurring.

Monitor for acceptance (i.e., more than 1-hour of trade) outside of the balance area. 

Leaving value behind on a gap-fill or failing to fill a gap (i.e., remaining outside of the prior session’s range) is a go-with indicator. 

Rejection (i.e., return inside of balance) portends a move to the opposite end of the balance.

In the best case, the S&P 500 trades sideways or higher; activity above the $4,647.25 HVNode puts in play the $4,657.00 balance area low (BAL). Initiative trade beyond the BAL could reach as high as the $4,674.25 HVNode and $4,690.25 micro composite point of control (MCPOC), or higher.

In the worst case, the S&P 500 trades lower; activity below the $4,647.25 HVNode puts in play the $4,618.75 HVNode. Initiative trade beyond the latter could reach as low as the $4,581.00 and $4,523.00 untested point of control (VPOC), or lower.

Click here to load today’s key levels into the web-based TradingView charting platform. Note that all levels are derived using the 65-minute timeframe. New links are produced, daily.
Graphic: 65-minute profile chart of the Micro E-mini S&P 500 Futures. Learn about the profile.

What People Are Saying

Definitions

Cave-Fill Process: Widened the area deemed favorable to transact at by an increased share of participants. This is a good development.

Volume Areas: A structurally sound market will build on areas of high volume (HVNodes). Should the market trend for long periods of time, it will lack sound structure, identified as low volume areas (LVNodes). LVNodes denote directional conviction and ought to offer support on any test. 

If participants were to auction and find acceptance into areas of prior low volume (LVNodes), then future discovery ought to be volatile and quick as participants look to HVNodes for favorable entry or exit.

Liquidation Breaks: The profile shape suggests participants were “too” long and had poor location.

POCs: POCs are valuable as they denote areas where two-sided trade was most prevalent in a prior day session. Participants will respond to future tests of value as they offer favorable entry and exit.

MCPOCs: POCs are valuable as they denote areas where two-sided trade was most prevalent over numerous day sessions. Participants will respond to future tests of value as they offer favorable entry and exit.

Options Expiration (OPEX): Traditionally, option expiries mark an end to pinning (i.e, the theory that market makers and institutions short options move stocks to the point where the greatest dollar value of contracts will expire) and the reduction dealer gamma exposure.

Initiative Buying (Selling): Buying (selling) within or above (below) the previous day’s value area.

Responsive Buying (Selling): Buying (selling) in response to prices below (above) an area of recent price acceptance.

Price Discovery (One-Timeframe Or Trend): Elongation and range expansion denotes a market seeking new prices to establish value, or acceptance (i.e., more than 30-minutes of trade at a particular price level). 

Balance (Two-Timeframe Or Bracket): Rotational trade that denotes current prices offer favorable entry and exit. Balance-areas make it easy to spot a change in the market (i.e., the transition from two-time frame trade, or balance, to one-time frame trade, or trend). 

Modus operandi is responsive trade (i.e., fade the edges), rather than initiative trade (i.e., play the break).

Excess: A proper end to price discovery; the market travels too far while advertising prices. Responsive, other-timeframe (OTF) participants aggressively enter the market, leaving tails or gaps which denote unfair prices.

Value-Area Placement: Perception of value unchanged if value overlapping (i.e., inside day). Perception of value has changed if value not overlapping (i.e., outside day). Delay trade in the former case.

About

After years of self-education, strategy development, and trial-and-error, Renato Leonard Capelj began trading full-time and founded Physik Invest to detail his methods, research, and performance in the markets.

Additionally, Capelj is a Benzinga finance and technology reporter interviewing the likes of Shark Tank’s Kevin O’Leary, JC2 Ventures’ John Chambers, and ARK Invest’s Catherine Wood, as well as a SpotGamma contributor, helping develop insights around impactful options market dynamics.

Disclaimer

At this time, Physik Invest does not carry the right to provide advice. In no way should the materials herein be construed as advice. Derivatives carry a substantial risk of loss. All content is for informational purposes only.

Categories
Commentary

Daily Brief For September 1, 2021

Market Commentary

Equity index futures trade sideways to higher overnight. VIX, bonds, dollar were all lower.

  • Inflows and options and peak growth, oh my!
  • Ahead: Employment and manufacturing data.
  • Indexes are positioned for directional resolve.

What Happened: U.S. stock index futures auctioned sideways to higher overnight as participants get past reports of European hawkishness, as well as position for directional resolve on the basis of new fundamental data.

Ahead is data on ADP employment (8:15 AM ET), Markit manufacturing PMI (9:45 AM ET), ISM manufacturing index, and construction spending (10:00 AM ET).

Graphic updated 6:30 AM ET. Sentiment Risk-On if expected /ES open is above the prior day’s range. SqueezeMetrics Dark Pool Index (DIX) and Gamma (GEX) calculations are based on where the prior day’s reading falls with respect to the MAX and MIN of all occurrences available. A higher DIX is bullish. At the same time, the lower the GEX, the more (expected) volatility. SHIFT data used for S&P 500 (INDEX: SPX) options activity approximation. Note that options flow is sorted by the call premium spent; if more positive then more was spent on call options. Breadth reflects a reading of the prior day’s NYSE Advance/Decline indicator. VIX reflects a current reading of the CBOE Volatility Index (INDEX: VIX) from 0-100.

What To Expect: As of 6:30 AM ET, Wednesday’s regular session (9:30 AM – 4:00 PM EST) in the S&P 500 will likely open outside of prior-range and -value, suggesting a potential for immediate directional opportunity.

Adding, during the prior day’s regular trade, on positive but weak intraday breadth and middling market liquidity metrics, the best case outcome occurred, evidenced by trade within Monday’s range. This is significant because it was a validation of Monday’s emotional price discovery.

Graphic: Divergent delta (i.e., non-committed buying as measured by volume delta or buying and selling power as calculated by the difference in volume traded at the bid and offer) in SPDR S&P 500 ETF Trust (NYSE: SPY), one of the largest ETFs that track the S&P 500 index, via Bookmap. The readings are supportive of responsive trade or balance (i.e., rotational trade that suggests current prices offer favorable entry and exit). 
Graphic: Market Internals (Advance/Decline, Up-Volume/Down-Volume, Tick) displayed as Peter Reznicek at ShadowTrader teaches. Though positive, readings were weak and supportive of responsive trade, similar to what market liquidity (via Bookmap) was showing.
Gap Scenarios In Play: Gaps ought to fill quickly. Should they not, that’s a signal of strength; do not fade. Leaving value behind on a gap-fill or failing to fill a gap (i.e., remaining outside of the prior session’s range) is a go-with indicator.

Auctioning and spending at least 1-hour of trade back in the prior range suggests a lack of conviction; in such a case, do not follow the direction of the most recent initiative activity.

Further, the aforementioned responsive trade is happening in the context of peak growth and a moderation in the economic recovery, as well as some of the dynamics unpacked in-depth yesterday (e.g., non-seasonally aligned inflows, impactful options market dynamics, divergent sentiment, and fears of a mid-cycle transition). 

The implications of these themes on price are contradictory; to elaborate, on one hand, yes, inflows and divergent sentiment are a green light with respect to the advance in equities (i.e., markets tend to climb a wall of worry given – all else equal – a decay in options skew and removal of hedges, among other things). 

“I use this analogy of a jet,” Kai Volatility’s Cem Karsan explained, referencing the three factors – the change in the underlying price (gamma), implied volatility (vanna), and time (charm) – that are well known to impact an options exposure to directional risk or delta. “As volatility is compressed, those jets will keep firing because … the hedging vanna and charm flows, and whatnot will push the markets higher.”

On the other hand, as Moody’s Corporation (NYSE: MCO) believes, “The Dow is forecast to have peaked and will gradually decline during the next year. Risks are heavily weighted to the upside, but peak growth, inflation and Fed tapering could weigh on equity markets.”

Graphic: Bloomberg data on S&P 500 seasonality.

Moreover, for today, given the increased potential for balanced trade, participants may make use of the following frameworks.

In the best case, the S&P 500 trades sideways or higher; activity above the $4,529.25 low volume area (LVNode) pivot puts in play the $4,542.25 overnight high (ONH). Initiative trade beyond the ONH could reach as high as the $4,556.25 and $4,592.25 Fibonacci extensions.

In the worst case, the S&P 500 trades lower; activity below the $4,529.25 LVNode puts in play the $4,521.00 untested point of control (VPOC). Initiative trade beyond the VPOC could reach as low as the $4,510.00 figure (which corresponds with a regular-trade high and small gap) and $4,481.75 HVNode.

Overnight Rally Highs (Lows): Typically, there is a low historical probability associated with overnight rally-highs (lows) ending the upside (downside) discovery process.

Volume Areas: A structurally sound market will build on past areas of high volume. Should the market trend for long periods of time, it will lack sound structure (identified as a low volume area which denotes directional conviction and ought to offer support on any test). 

If participants were to auction and find acceptance into areas of prior low volume, then future discovery ought to be volatile and quick as participants look to areas of high volume for favorable entry or exit.

POCs: POCs are valuable as they denote areas where two-sided trade was most prevalent. Participants will respond to future tests of value as they offer favorable entry and exit.

Balance (Two-Timeframe Or Bracket): Rotational trade that denotes current prices offer favorable entry and exit. Balance-areas make it easy to spot a change in the market (i.e., the transition from two-time frame trade, or balance, to one-time frame trade, or trend). 

Modus operandi is responsive trade (i.e., fade the edges), rather than initiative trade (i.e., play the break).
Graphic: 65-minute profile chart of the Micro E-mini S&P 500 Futures updated 6:30 AM ET. Note the developing balance area (HVNode) surrounding just short of the ONH. 

News And Analysis

Home prices continue to gain, more double-digit growth.

There is no such thing as an independent central bank.

Beginning to see churn below the surface amid outlook.

Shell plans to install 50,000 U.K. on-street EV chargers.

China manufacturing slows first time since March 2020.

Wall Street traders driving record are loaded on hedges. 

China Evergrande says construction of projects stalled.

‘Forever Changed’: CEOs are dooming business travel.

SEC boss: Crypto platforms need regulation to survive.

‘Egregiously mishandled’: Afghanistan dents Biden team.

SEC boss: Banning Payment for Order Flow is on table.

Euro-area inflation may justify end to ECB’s crisis mode.

What People Are Saying

About

After years of self-education, strategy development, and trial-and-error, Renato Leonard Capelj began trading full-time and founded Physik Invest to detail his methods, research, and performance in the markets. 

Additionally, Capelj is a finance and technology reporter. Some of his biggest works include interviews with leaders such as John Chambers, founder and CEO, JC2 Ventures, Kevin O’Leary, businessman and Shark Tank host, Catherine Wood, CEO and CIO, ARK Invest, among others.

Disclaimer

At this time, Physik Invest does not manage outside capital and is not licensed. In no way should the materials herein be construed as advice. Derivatives carry a substantial risk of loss. All content is for informational purposes only.

Categories
Commentary

Daily Brief For August 31, 2021

Market Commentary

Equity index futures, VIX sideways to higher. Commodities, bonds, dollar lower.

  • Ahead: Home prices, PMI, and more.
  • The path of least resistance is higher.

What Happened: U.S. stock index futures auctioned sideways to higher overnight alongside an absence in fundamental catalysts.

Ahead is data on the Case-Shiller national home price index (9:00 AM ET), Chicago PMI (9:45 AM ET), and consumer confidence index (10:00 AM ET).

Graphic updated 6:30 AM ET. Sentiment Neutral if expected /ES open is inside of the prior day’s range. SqueezeMetrics Dark Pool Index (DIX) and Gamma (GEX) calculations are based on where the prior day’s reading falls with respect to the MAX and MIN of all occurrences available. A higher DIX is bullish. At the same time, the lower the GEX, the more (expected) volatility. SHIFT data used for S&P 500 (INDEX: SPX) options activity approximation. Note that options flow is sorted by the call premium spent; if more positive then more was spent on call options. Breadth reflects a reading of the prior day’s NYSE Advance/Decline indicator. VIX reflects a current reading of the CBOE Volatility Index (INDEX: VIX) from 0-100.

What To Expect: As of 6:30 AM ET, Tuesday’s regular session (9:30 AM – 4:00 PM EST) in the S&P 500 will likely open inside of prior-range and -value, suggesting a limited potential for immediate directional opportunity.

Adding, during the prior day’s regular trade, on weak intraday breadth and middling market liquidity metrics, the best case outcome occurred, evidenced by further price discovery. 

Price Discovery (One-Timeframe Or Trend): Market seeking new prices to establish value, or acceptance (i.e., more than 30-minutes of trade at a particular price level). 

Despite the low volume, p-shaped profile structures (which denote short covering), and a lack of intraday range expansion, the aforementioned trade is significant because it suggests continued bullishness after a v-pattern recovery.

V-Pattern: A pattern that forms after a market establishes a high, retests some support, and then breaks above said high. In most cases, this pattern portends continuation.

Further, the aforementioned trade is happening in the context of non-seasonally aligned inflows, impactful options market dynamics, divergent sentiment, and fears of a mid-cycle transition. 

The implications of these themes on price are contradictory; to elaborate, on one hand, August, over the past 25 years, has historically been the largest month for equity outflows. According to Goldman Sachs Group Inc’s (NYSE: GS) Scott Rubner, “We have seen none of these outflows and it has been buying the dip (TINA).”

Given this divergence from the norm, an advance (such as the one we’re in presently) is not “welcomed and may lead to a quick right tail edging … [as] option volume notional is 120% of stock volume notional.”

To put it simply, 75% of the options being traded expire within two weeks. The related hedging flows of these directionally sensitive options can represent an increased share of volume in underlying stocks.

To put it simply, option flows impact the underlying’s price, markedly.

We couple this so-called right-tail hedging with the structural positioning that drives the market through the three factors – the change in the underlying price (gamma), implied volatility (vanna), and time (charm) – that are well known to impact an options exposure to directional risk or delta.

“Charm is a major driver for support in the markets,” said Cem Karsan of Kai Volatility Advisors. “All of that support is leading up to and accelerating into that Monday-Wednesday window” ahead of OpEx. “And then the window really opens for lack of support. It’s not like there’s a bunch of selling all of a sudden. It’s a window of non-strength; a lack of these supportive flows that have been there prior.”

With the August monthly options expiration (OPEX) behind, the focus shifts to September, at and around the same time Morgan Stanley’s (NYSE: MS) Michael Wilson expects a formal signal – which would align with Karsan’s window of non-strength – on the taper of asset purchases, leading to a mid-cycle transition and 10% S&P 500 correction.

Options Expiration (OPEX): Option expiries mark an end to pinning (i.e, the theory that market makers and institutions short options move stocks to the point where the greatest dollar value of contracts will expire worthless) and the reduction dealer gamma exposure.

“Assuming a stable equity risk premium at 345bp, P/Es would fall to 19x, or 10% lower.”

Graphic: Morgan Stanley unpacks mid-cycle transition thesis. Image retrieved from ZeroHedge.

Moreover, for today, participants may make use of the following frameworks.

In the best case, the S&P 500 trades sideways or higher; activity above the $4,524.00 low volume area (LVNode) pivot puts in play the $4,542.25 overnight high (ONH). Initiative trade beyond the ONH could reach as high as the $4,556.25 and $4,592.25 Fibonacci extensions.

In the worst case, the S&P 500 trades lower; activity below the $4,524.00 LVNode puts in play $4,510.00, the convergence of a regular-trade high and LVNode. Initiative trade beyond the $4,510.00 figure could reach as low as the $4,481.75 high volume area (HVNode) and $4,454.25 LVNode.

To note, the $4,454.25 LVNode corresponds with an anchored volume-weighted average price (VWAP), a metric highly regarded by chief investment officers, among other participants, for quality of trade. Additionally, liquidity algorithms are benchmarked and programmed to buy and sell around VWAPs.

Overnight Rally Highs (Lows): Typically, there is a low historical probability associated with overnight rally-highs (lows) ending the upside (downside) discovery process.

Volume Areas: A structurally sound market will build on past areas of high volume. Should the market trend for long periods of time, it will lack sound structure (identified as a low volume area which denotes directional conviction and ought to offer support on any test). 

If participants were to auction and find acceptance into areas of prior low volume, then future discovery ought to be volatile and quick as participants look to areas of high volume for favorable entry or exit.
Graphic: 65-minute profile chart of the Micro E-mini S&P 500 Futures updated 6:30 AM ET.

News And Analysis

Inventories continue to constrain home purchase activity.

The Fed now risking too-slow taper after too-fast in 2013.

A fast lane for the ECB to taper purchases ahead of Fed.

OPEC+ faces mixed market signals after U.S. pressures.

Capital raises from infotech sector simmering down July.

Fitch Ratings unpacks commodities and energy research.

Battery storage capacity likely to double inside California.

Moderna creates twice as many antibodies as Pfizer vax.

What People Are Saying

About

After years of self-education, strategy development, and trial-and-error, Renato Leonard Capelj began trading full-time and founded Physik Invest to detail his methods, research, and performance in the markets. 

Additionally, Capelj is a finance and technology reporter. Some of his biggest works include interviews with leaders such as John Chambers, founder and CEO, JC2 Ventures, Kevin O’Leary, businessman and Shark Tank host, Catherine Wood, CEO and CIO, ARK Invest, among others.

Disclaimer

At this time, Physik Invest does not manage outside capital and is not licensed. In no way should the materials herein be construed as advice. Derivatives carry a substantial risk of loss. All content is for informational purposes only.

Categories
Commentary

Daily Brief For June 14, 2021

Market Commentary

Index futures balance and attempt to discover higher prices.

  • Ahead: Fed 2-day policy meeting.
  • Indexes trade sideways to higher.

What Happened: U.S. stock index futures auctioned sideways-to-higher, ahead of an impactful Federal Reserve policy meeting.

Further, it is likely that cost-push inflation will be the main driver of inflation into next year. That is according to Moody’s which suggests the Fed is betting on this, too. If wrong, however, it would be due to a wage-price spiral which is still unlikely to occur given that the economy is not near full employment.

Adding, the Federal Open Market Committee (FOMC) will likely not change its forward guidance on interest rates or asset purchases; “The statement will likely strengthen the FOMC’s assessment of the acceleration in inflation and possibly mention the central bank has the tools to address inflation if needed. This would be an effort to keep long-term inflation expectations in check.”

Graphic updated 6:51 AM ET.

What To Expect: Monday’s regular session (9:30 AM – 4:00 PM EST) in the S&P 500 may open just outside of prior-range and -value, suggesting the potential for immediate directional opportunity. 

Adding, during the prior day’s regular trade, the best case outcome occurred, evidenced by initiative trade above the $4,227.00 high volume area (HVNode). This is significant because that particular level marks a pivot (i.e., above = bullish, below = bearish) on the composite profile. 

Volume Areas: A structurally sound market will build on past areas of high volume. Should the market trend for long periods of time, it will lack sound structure (identified as a low volume area which denotes directional conviction and ought to offer support on any test). 

If participants were to auction and find acceptance into areas of prior low volume, then future discovery ought to be volatile and quick as participants look to areas of high volume for favorable entry or exit.

Further, for today, participants can trade from the following frameworks. 

In the best case, the S&P 500 trades sideways or higher; activity above the $4,239.50 regular trade high puts in play the $4,249.00 minimal excess high. Initiative trade beyond that figure could reach as high as the $4,270.00 161.80% Fibonacci price extension and $4,294.75 127.20% extension.

Excess: A proper end to price discovery; the market travels too far while advertising prices. Responsive, other-timeframe (OTF) participants aggressively enter the market, leaving tails or gaps which denote unfair prices.

In the worst case, the S&P 500 trades sideways or lower; activity below the $4,239.50 puts in play the HVNode pivot at $4,227.00. If lower, the $4,213.75 low volume area (LVNode) comes into play first. Thereafter, participants ought to look for responses at the $4,206.25, $4,198.75, and $4,177.25 HVNodes.

Graphic: 65-minute profile chart of the Micro E-mini S&P 500 Futures.
Graphic: Daily candlestick charts of the S&P 500 (top left), Nasdaq 100 (top right), Russell 2000 (bottom left), and Dow Jones Industrial Average (bottom right). Note where each index is trading in relation to resistance.
Graphic: SHIFT search suggests participants were most interested in put strikes at and below current prices in the larger cash-settled S&P 500 Index (INDEX: SPX) and Nasdaq 100 Index (INDEX: NDX), last week.

News And Analysis

Economy | Goldman: ‘Too big to fail’ may not apply in China anymore. (BBG)

Economy | U.K.’s Johnson set to announce a delay to end restrictions. (REU)

Markets | Reasons to question retail-driven meme stock craze narrative. (SG)

Markets | SEC plans market structure review amid meme stock frenzy. (WSJ)

Markets | Russell index rebalancing bringing meme stocks mainstream. (BBG)

Markets | Bitcoin higher on news Tesla will use when mining is cheaper. (BBG)

What People Are Saying

Innovation And Emerging Trends

Economy | Americans hoarded money to survive during the pandemic. (BBG)

Markets | Market veterans are mourning the slow death of historic pits. (FT)

FinTech | Investors are craving more of the payments company Stripe. (WSJ)

Economy | A great resignation wave could be coming for companies. (Axios)

About

Renato founded Physik Invest after going through years of self-education, strategy development, and trial-and-error. His work reporting in the finance and technology space, interviewing leaders such as John Chambers, founder, and CEO, JC2 Ventures, Kevin O’Leary, businessman and Shark Tank host, Catherine Wood, CEO and CIO, ARK Invest, among others, afforded him the perspective and know-how very few come by.

Having worked in engineering and majored in economics, Renato is very detailed and analytical. His approach to the markets isn’t built on hope or guessing. Instead, he leverages the unique dynamics of time and volatility to efficiently act on opportunity.

Disclaimer

At this time, Physik Invest does not manage outside capital and is not licensed. In no way should the materials herein be construed as advice. Derivatives carry a substantial risk of loss. All content is for informational purposes only.

Categories
Commentary

Daily Brief For May 13, 2021

Market Commentary

Index futures in price discovery.

  • Inflation contagion hits pocketbook.
  • Ahead: Claims, PPI, and earnings.
  • Index futures are lower but steady.

What Happened: U.S. stock index futures continued their sell-off, overnight, after a strong move lower, Wednesday.

Graphic updated 7:00 AM EST.

What To Expect: Thursday’s regular session (9:30 AM – 4:00 PM EST), in the S&P 500, will likely open just outside of prior -range and -value, suggesting the potential for immediate directional opportunity.

Adding, during the prior day’s regular trade, the worst-case outcome occurred, evidenced by initiative trade below Tuesday’s excess low. This is significant because that reference marked the start of a prior intermediate-term bounce.

Excess: A proper end to price discovery; the market travels too far while advertising prices. Responsive, other-timeframe (OTF) participants aggressively enter the market, leaving tails or gaps which denote unfair prices.

This downside price discovery comes alongside the release of poor employment and payroll data. 

Price Discovery (One-Timeframe Or Trend): Elongation and range expansion denotes a market seeking new prices to establish value, or acceptance (i.e., more than 30-minutes of trade at a particular price level). 

“‘Markets have lost a little bit of confidence that the Fed has control of inflation’ and the concern was that the central bank might wait too long to address the rise,” Victoria Fernandez, Crossmark Global Investments chief market strategist, said. “I am not sure the market is extremely comfortable with that at this point.”

However, that said, stock indexes may be positioned for a vicious rebound as near-term downside discovery may have reached a limit, based on market liquidity metrics and the inventory positioning of participants. According to SqueezeMetrics, the steepness of the GammaVol (GXV) curve suggests that there’s more risk to the upside than the downside, at the S&P 500’s present juncture.

More On Gamma: In the simplest way, gamma is the sensitivity of an option to changes in underlying price. Dealers that take the other side of option trades hedge their exposure to risk by buying and selling the underlying. When dealers are short-gamma, they hedge by buying into strength and selling into weakness. When dealers are long-gamma, they hedge by selling into strength and buying into weakness. The former exacerbates volatility. The latter calms volatility.

Knowing the above, for today, participants can trade from the following frameworks. 

In the best case, the S&P 500 trades sideways or higher; activity above the $4,051.00 regular trade low targets the $4,069.25 high volume area (HVNode). Initiative trade beyond the HVNode could reach as high as $4,082.75 HVNode, $4,105.75 low volume area (LVNode), and then the $4,117.00 POC. 

Volume Areas: A structurally sound market will build on past areas of high volume. Should the market trend for long periods of time, it will lack sound structure (identified as a low-volume area which denotes directional conviction and ought to offer support on any test). 

If participants were to auction and find acceptance into areas of prior low-volume, then future discovery ought to be volatile and quick as participants look to areas of high volume for favorable entry or exit.

POCs: POCs (like HVNodes described above) are valuable as they denote areas where two-sided trade was most prevalent. Participants will respond to future tests of value as they offer favorable entry and exit.

In the worst case, the S&P 500 trades lower; activity below $4,051.00 puts the index within a composite low-volume zone, a situation in which follow-through, to the next high-volume area, is likely. Further, participants, in such a case, should look for responses at the $4,015.00 and $4,001.00 POCs, the $3,980.00 50% Fibonacci retracement, the $3,943.00 HVNode, and lastly, the $3,918.25-$3,908.00 Fibonacci and volume area confluence zone.

Graphic: 4-hour profile chart of the Micro E-mini S&P 500 Futures.
Graphic: Daily candlestick charts of the S&P 500 (top left), Nasdaq 100 (top right), Russell 2000 (bottom left), and Dow Jones Industrial Average (bottom right).
Graphic: Physik Invest maps out the purchase of call and put options in the SPDR S&P 500 ETF Trust (NYSE: SPY), for May 12. Activity in the options market was primarily concentrated in short-dated tenors, in put strikes as low as $389.00, which corresponds with ~$4,000.00 in the cash-settled S&P 500 Index (INDEX: SPX).
Graphic: SHIFT search suggests participants were most interested in short-dated put strikes at and below current prices in the cash-settled S&P 500 Index (INDEX: SPX), Wednesday. 
Graphic: SHIFT search suggests participants were most interested in long-dated call strikes at and above current prices in the cash-settled Nasdaq 100 Index (INDEX: NDX), Wednesday.

News And Analysis

Crypto | Musk splits from Cathie Wood’s Ark on Bitcoin’s environment cost. (BBG)

Economy | Travel bookings are surging as vaccines unleash pent-up demand. (Axios)

Markets | The SPAC King doing just fine even as the bubble starts to burst. (BBG)

Energy | Top U.S. pipeline recovering from a devastating ransomware attack. (REU)

Markets | Hedging gets frantic as puts soar amid stock market hammering. (BBG)

Economy | April’s inflation surge wasn’t as drastic as it looked. Real test ahead. (CNBC)

What People Are Saying

Innovation And Emerging Trends

MedTech | Unpacking how mRNA molecule became a vaccine game-changer. (FT)

Energy | Nuclear reactions are increasing in an inaccessible Chernobyl chamber. (CNET)

Climate | The Fed privately presses big banks on risks from climate change. (REU)

Economy | China bets on productivity, over population, to drive its economy. (BBG)

Crypto | Fintech giant Ant Group’s MYbank joins China’s digital yuan platform. (SCMP)

About

Renato founded Physik Invest after going through years of self-education, strategy development, and trial-and-error. His work reporting in the finance and technology space, interviewing leaders such as John Chambers, founder, and CEO, JC2 Ventures, Kevin O’Leary, businessman and Shark Tank host, Catherine Wood, CEO and CIO, ARK Invest, among others, afforded him the perspective and know-how very few come by.

Having worked in engineering and majored in economics, Renato is very detailed and analytical. His approach to the markets isn’t built on hope or guessing. Instead, he leverages the unique dynamics of time and volatility to efficiently act on opportunity.

Disclaimer

At this time, Physik Invest does not manage outside capital and is not licensed. In no way should the materials herein be construed as advice. Derivatives carry a substantial risk of loss. All content is for informational purposes only.

Categories
Commentary

Daily Brief For April 21, 2021

Market Commentary

Index futures auction within prior range, position for directional resolve.

  • Virus surges, earnings accelerate.
  • Calendar light. ECB rate decision.
  • Buyers responded to lower prices.

What Happened: U.S. stock index futures auctioned sideways, overnight, after strong downside discovery the day prior.

ING Group Strategists“Markets remain very much caught between the rock of improving macroeconomic conditions and the treacherous waters of geopolitical risks and alarming Covid-19 case growth in some corners of the world.”

What To Expect: Wednesday’s regular session (9:30 AM – 4:00 PM EST) will likely open inside of prior-range and -value, suggesting a limited potential for immediate directional opportunity. 

Adding, during the prior day’s regular trade, the worst-case outcome occurred, evidenced by initiative trade beyond the $4,142.00 regular trade low, down to the $4,122.75 HVNode, which is significant because denotes an area of prior two-sided trade.

Volume Areas: A structurally sound market will build on past areas of high volume. Should the market trend for long periods of time, it will lack sound structure (identified as a low-volume area which denotes directional conviction and ought to offer support on any test).

If participants were to auction and find acceptance into areas of prior low-volume, then future discovery ought to be volatile and quick as participants look to areas of high volume for favorable entry or exit.

Further, in a nutshell, the market explored higher prices and is now probing into pockets of old value to drum up increased participation. The market is doing what it is supposed to — move to the area where participants want to do business. Given the remaining price targets at $4,200.00 and minimal excess (i.e., flat high) left behind last Friday’s price discovery, odds are participants lacked conviction and the market was unable to advertise higher prices.

Excess: A proper end to price discovery; the market travels too far while advertising prices. Responsive, other-timeframe (OTF) participants aggressively enter the market, leaving tails or gaps which denote unfair prices.

Price Discovery (One-Timeframe Or Trend): Elongation and range expansion denotes a market seeking new prices to establish value, or acceptance (i.e., more than 30-minutes of trade at a particular price level). 

This is generally a bullish dynamic. Why? Think of there being unfinished business at the all-time high. As stated earlier, a market moves to where there is business to be conducted.

Moving on, the two-day liquidation has pushed the S&P 500 down into short-gamma territory. This is not good. Why? Short-gamma is opposite to the forces that crush volatility and promote lengthy bursts of momentum.

Liquidation Breaks: The profile shape suggests participants were “too” long and had poor location.

Gamma: Gamma is the sensitivity of an option to changes in the underlying price. Dealers that take the other side of options trades hedge their exposure to risk by buying and selling the underlying. When dealers are short-gamma, they hedge by buying into strength and selling into weakness. When dealers are long-gamma, they hedge by selling into strength and buying into weakness. The former exacerbates volatility. The latter calms volatility.
Graphic: SPDR S&P 500 ETF Trust (NYSE: SPY) in short-gamma territory, via SpotGamma.

Due to occurrences discussed in the weekend commentary, such as increased put selling during market strength, volatility expansion and a rise in delta (i.e., exposure to the underlying asset) will force put-side option sellers to sell into weakness, to hedge off their risk, thereby exacerbating volatility.

Graphic: SqueezeMetrics highlights implications of volatility, direction, and moneyness.

In the event that some exogenous event (e.g., COVID-19 resurgence, tax-hike) was to surface, odds favor increased volatility and potential for downside.

Moreover, for today, participants can trade from the following frameworks. 

In the best case, the S&P 500 trades higher; activity higher than the $4,142.00 regular trade low targets the $4,155 high volume area (HVNode). Initiative trade beyond the HVNode could reach as high as the $4,171 VPOC. In the worst case, the S&P 500 trades lower; activity below $4,122.75 targets the $4,104.00 low volume area (LVNode). Initiative trade beyond that figure puts in play the $4,082.75 and $4,069.25 HVNodes.

POCs: POCs (like HVNodes described above) are valuable as they denote areas where two-sided trade was most prevalent. Participants will respond to future tests of value as they offer favorable entry and exit.
Graphic: 65-minute profile chart of the Micro E-mini S&P 500 Futures.
Graphic: Physik Invest maps out the purchase of call and put options in the SPDR S&P 500 ETF Trust (NYSE: SPY), for April 20. Activity in the options market was primarily concentrated in short-dated tenors, in strikes as low as $381, which corresponds with $3,810 in the cash-settled S&P 500 Index (INDEX: SPX).
Graphic: SHIFT search suggests participants lack directional conviction in the SPDR S&P 500 ETF Trust (NYSE: SPY).

News And Analysis

Science | Man-made lakes in U.S. West and Mexico to shrink to historical lows. (AP)

Markets | Mortgage rates come down as the bond market regains strength. (MND)

Markets | Federal Reserve will limit any overshoot of inflation target, Powell says. (REU)

Travel | Washington says travel warnings will cover 80% of the world’s nations. (BBG)

Policy | On the verge of a realignment of politics, economic policy, and living. (Ritholtz)

Markets | MIAX expanding futures division with new hires from Cboe and Citi. (TT)

Markets | U.K. scaps MiFID II requirements in ambitious capital markets reform. (TT)

Economy | While lumber prices are soaring, actual logs remain very dirt cheap. (BBG)

What People Are Saying

Innovation And Emerging Trends

Innovation | Lessons from Jeff Bezos’ annual letters to Amazon shareholders. (CB)

Markets | How Robinhood made trading easy and maybe even too hard to resist. (BBG)

Space | International crew, recycled capsule: SpaceX is preparing to launch. (AMN)

Venture | A look at Stripe, the most highly valued venture-backed private company. (CN)

FinTech | Fintech IPOs: Four foundational keys to success, preparing for IPO. (FM)

FinTech | U.K. creates a new fintech sandbox for distributed ledger technology. (S&P

FinTech | Venture capital interest in Latin America swells as fintech takes flight. (PB)

FinTech | Insurtech startups are leveraging rapid growth to raise big money. (TC)

FinTech | China’s central bank plans to build out a fintech cloud infrastructure. (SCMP)

 About

Renato founded Physik Invest after going through years of self-education, strategy development, and trial-and-error. His work reporting in the finance and technology space, interviewing leaders such as John Chambers, founder, and CEO, JC2 Ventures, Kevin O’Leary, Canadian businessman and Shark Tank host, Catherine Wood, CEO and CIO, ARK Invest, among others, afforded him the perspective and know-how very few come by.

Having worked in engineering and majored in economics, Renato is very detailed and analytical. His approach to the markets isn’t built on hope or guessing. Instead, he leverages the unique dynamics of time and volatility to efficiently act on opportunity.

 Disclaimer

At this time, Physik Invest does not manage outside capital and is not licensed. In no way should the materials herein be construed as advice. Derivatives carry a substantial risk of loss. All content is for informational purposes only.

Categories
Commentary

Daily Brief For April 20, 2021

Market Commentary

Index futures auction lower, attempt to validate higher prices.

  • Investors weigh earnings, taxes.
  • Light calendar, earnings pick up.
  • Indices correct in time and price.

What Happened: U.S. stock index futures auctioned lower overnight as investors weighed the risks of exposure given the potential for surprise earnings results and a recent spike in virus cases, among other factors. 

What To Expect: Tuesday’s regular session (9:30 AM – 4:00 PM EST) in the S&P 500 will likely open outside of prior-range and -value, suggesting a higher-than-normal potential for directional opportunity. 

During the prior day’s regular trade, the worst-case outcome occurred, evidenced by trade below the $4,171.00 VPOC, which is significant because it marks an area where participants found it most valuable to conduct business during a prior session. Thereafter, overnight, participants discovered lower prices and solicited responsive buying at the $4,137.00 high-volume area (HVNode).

Volume Areas: A structurally sound market will build on past areas of high volume. Should the market trend for long periods of time, it will lack sound structure (identified as a low-volume area which denotes directional conviction and ought to offer support on any test).

If participants were to auction and find acceptance into areas of prior low-volume, then future discovery ought to be volatile and quick as participants look to areas of high volume for favorable entry or exit.

This price action is occurring on the heels of an outstanding rally, fueled by vaccine rollouts, supportive central banks, and improved consumer finances. In a statement, JPMorgan Chase & Co (NYSE: JPM) expressed its optimism on a sustained equity market boom. 

“We would not be cutting stocks exposure on a 6-9 months horizon, and continue to see any dips as buying opportunities,” JPMorgan analysts said. “We would not expect to see a more sustained pullback before Q4.”

Further, as stated in prior commentaries, equity markets are positioned bullish, but there exists an increased potential to correct in time and price. Should there be a drastic turn and spike in volatility, participants must be ready to accept the possibility of a violent liquidation, given poor structure left behind prior price discovery and increased put selling, among other factors

Price Discovery (One-Timeframe Or Trend): Elongation and range expansion denotes a market seeking new prices to establish value, or acceptance (i.e., more than 30-minutes of trade at a particular price level).

For today, participants can trade from the following frameworks. 

In the best case, the S&P 500 trades sideways or higher; activity above the $4,142.00 regular trade low (RTH Low) targets the $4,155.00 HVNode. Initiative trade beyond the HVNode could reach as high as $4,167.50 overnight high (ONH).

In the worst case, the S&P 500 trades lower; activity below $4,142.00 targets the $4,122.75 HVNode. Thereafter, if lower, participants can look for a repair of the poor structure sitting at the $4,113.00 low. Trading below $4,104.00 suggests a test as low as the $4,069.25 HVNode is likely.

Graphic: 65-minute profile chart of the Micro E-mini S&P 500 Futures.
Graphic: Physik Invest maps out the purchase of call and put options in the SPDR S&P 500 ETF Trust (NYSE: SPY), for April 19, 2021. Activity in the options market was primarily concentrated in short-dated tenors, in strikes as low as $403, which corresponds with $4,030 in the cash-settled S&P 500 Index (INDEX: SPX).

News And Analysis

Economy | Equity markets haven’t priced in Biden’s corporate tax hikes, yet. (BBG)

Recovery | More than half of U.S. adults vaccinated. Why are cases rising? (AB)

Trade | Why the chip shortage is so hard to overcome despite recent efforts. (WSJ)

Economy | Fannie Mae seeing a brighter outlook for housing and economy. (MND)

Economy | Fearing foreclosure crisis, watchdog cracks down on servicers. (REU)

Politics | Xi is challenging U.S. global leadership, warns against decoupling. (BBG)

Markets | Dogecoin’s surge was fueled by retail and institutional participants. (TB)

Markets | Credit Suisse halts trader’s fund on risk concerns, post-Archegos. (BBG)

Markets | China’s yuan is overvalued, and that could stoke global inflation. (BBG)

Markets | Stock shorts collapsed as no hedge fund wants head ripped off. (BBG)

What People Are Saying

Innovation And Emerging Trends

Markets | Large hidden bond market problem poses a whole new set of risks. (BBG)

FinTech | Here is how the big brokerage firms are breaking into bitcoin trading. (TB)

FinTech | Intercontinental Exchange-owned Bakkt targeting innovation, NFTs. (BZ)

Markets | The OCC has announced a reduction of its clearing fee to two cents. (TM)

Venture | Where the startup world sees money in the $2.3T infrastructure plan. (CN)

 About

Renato founded Physik Invest after going through years of self-education, strategy development, and trial-and-error. His work reporting in the finance and technology space, interviewing leaders such as John Chambers, founder, and CEO, JC2 Ventures, Kevin O’Leary, Canadian businessman and Shark Tank host, Catherine Wood, CEO and CIO, ARK Invest, among others, afforded him the perspective and know-how very few come by.

Having worked in engineering and majored in economics, Renato is very detailed and analytical. His approach to the markets isn’t built on hope or guessing. Instead, he leverages the unique dynamics of time and volatility to efficiently act on opportunity.

 Disclaimer

At this time, Physik Invest does not manage outside capital and is not licensed. In no way should the materials herein be construed as advice. Derivatives carry a substantial risk of loss. All content is for informational purposes only.

Categories
Commentary

Daily Brief For April 19, 2021

Market Commentary

Index futures are attempting to balance and validate higher prices.

  • Global pandemic recovery uneven. 
  • Investors await corporate earnings.
  • Indices to correct in time and price.

What Happened: U.S. stock index futures balanced ahead of a fresh round of corporate earnings.

What To Expect: Monday’s regular session (9:30 AM – 4:00 PM EST) will likely open inside of prior-range and -value, suggesting a limited potential for directional opportunity. 

Adding, during the prior week, the best case outcome occurred, evidenced by initiative trade that established new all-time highs in the S&P 500, Nasdaq-100, and Dow Jones Industrial Average.

Coming into this week, though equity markets are positioned bullishly, there exists an increased potential to correct in time and price. Adding, should there be a turn and spike in volatility, participants must be ready to accept the possibility of a violent liquidation, given the poor structure left behind prior price discovery and increased put selling, among other factors highlighted in Sunday’s commentary.

Price Discovery (One-Timeframe Or Trend): Elongation and range expansion denotes a market seeking new prices to establish value, or acceptance (i.e., more than 30-minutes of trade at a particular price level). 

For today, participants can trade from the following frameworks. 

In the best case, the S&P 500 trades sideways or higher; activity above the $4,161.75 regular trade low targets the $4,171.00 VPOC. Initiative trade beyond the VPOC could reach as high as the $4,183.50 regular-trade high and the cluster of Fibonacci price extensions above $4,187.00. In the worst case, the S&P 500 trades lower; activity below $4,171.00 is likely to solicit responsive buying near the $4,157.00 high-volume area (HVNode). Thereafter, if lower, $4,137.00 and $4,123.00 are other valuable areas to do business. 

Volume Areas: A structurally sound market will build on past areas of high-volume. Should the market trend for long periods of time, it will lack sound structure (identified as a low-volume area which denotes directional conviction and ought to offer support on any test). 

If participants were to auction and find acceptance into areas of prior low-volume, then future discovery ought to be volatile and quick as participants look to areas of high-volume for favorable entry or exit.

POCs: POCs (like HVNodes described above) are valuable as they denote areas where two-sided trade was most prevalent. Participants will respond to future tests of value as they offer favorable entry and exit.

Responsive Buying: Buying in response to prices below area of recent price acceptance.
Graphic: 4-hour profile chart of the Micro E-mini S&P 500 Futures.
Graphic: Physik Invest maps out the purchase of call and put options in the SPDR S&P 500 ETF Trust (NYSE: SPY), for the week ending April 16. Activity in the options market was primarily concentrated in short-dated tenors, in strikes as low as $364, which corresponds with $3,640 in the cash-settled S&P 500 Index (INDEX: SPX).

News And Analysis

Markets | Crypto stock mania tested by sliding prices, bitcoin drop. (BBG)

Markets | China opens borders to billions of dollars of gold imports. (REU)

Markets | Key takeaways from Q1 results of the investment banks. (Moody’s)

Travel | Airlines can’t get the world flying despite a big U.S. boom. (BBG)

Trade | TSMC says trade tensions may disrupt chip equipment supply. (BBG)

What People Are Saying

Innovation And Emerging Trends

Startups | Tips for those that are joining a startup for the first time. (FRR)

Space | Why flying a four-pound helicopter on Mars is a big deal. (BBG)

FinTech | U.S. banks deploy AI to monitor customers and workers. (REU)

Spirits | Whisky world at war as tech allows for instant spirit aging. (FT)

Crypto | Bank of England, HM Treasury create a CBDC taskforce. (BoE)

Technology | Clubhouse closes round of funding, raising value. (REU)

 About

Renato founded Physik Invest after going through years of self-education, strategy development, and trial-and-error. His work reporting in the finance and technology space, interviewing leaders such as John Chambers, founder, and CEO, JC2 Ventures, Kevin O’Leary, Canadian businessman and Shark Tank host, Catherine Wood, CEO and CIO, ARK Invest, among others, afforded him the perspective and know-how very few come by.

Having worked in engineering and majored in economics, Renato is very detailed and analytical. His approach to the markets isn’t built on hope or guessing. Instead, he leverages the unique dynamics of time and volatility to efficiently act on opportunity.

 Disclaimer

At this time, Physik Invest does not manage outside capital and is not licensed. In no way should the materials herein be construed as advice. Derivatives carry a substantial risk of loss. All content is for informational purposes only.