Equity index futures trade sideways to lower staying within the prior day’s range.
China has deemed crypto illegal.
Equity market enduring outflows.
Positioning risks are back in line.
What Happened: U.S. stock index futures auctioned sideways to lower overnight after a series of outlier moves; despite global equity funds seeing their first outflows in 2021, positioning risks, among other things, cooled.
In other news, China deemed all crypto-related transactions illegal and holders of China Evergrande Group’s dollar bonds haven’t received a coupon payment due Thursday.
Ahead is Fed-speak by Loretta Mester (8:45 AM ET), alongside data on new home sales (10:00 AM ET), and other Fed-speak by Jerome Powell and Esther George (10:00 AM ET).
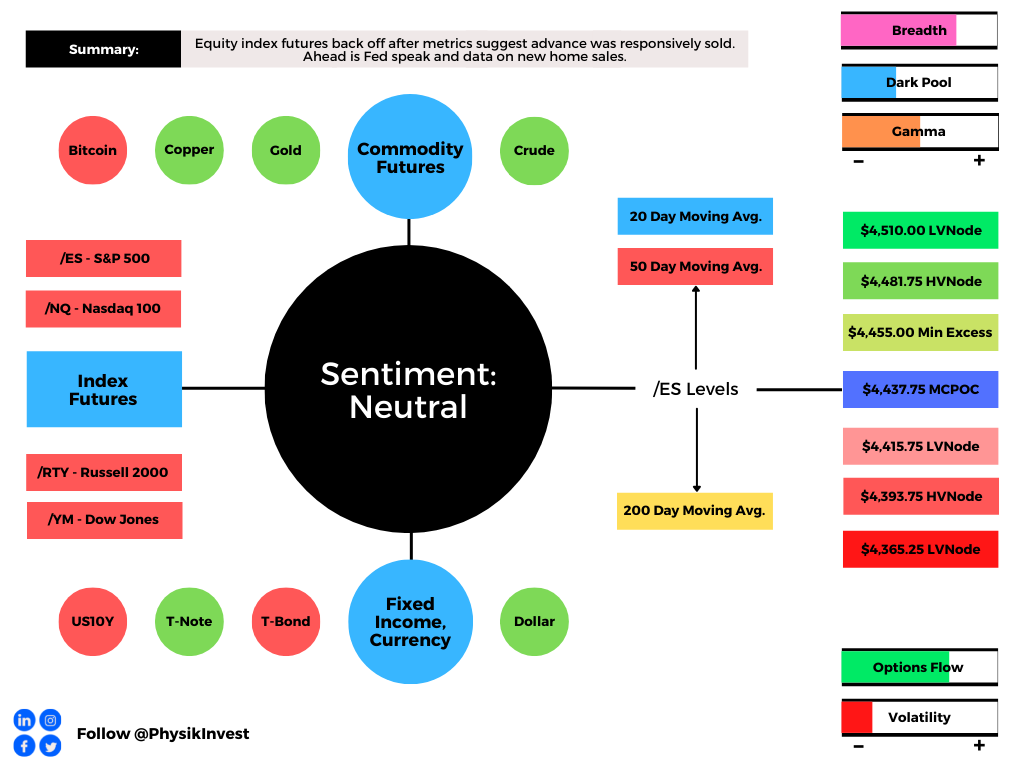
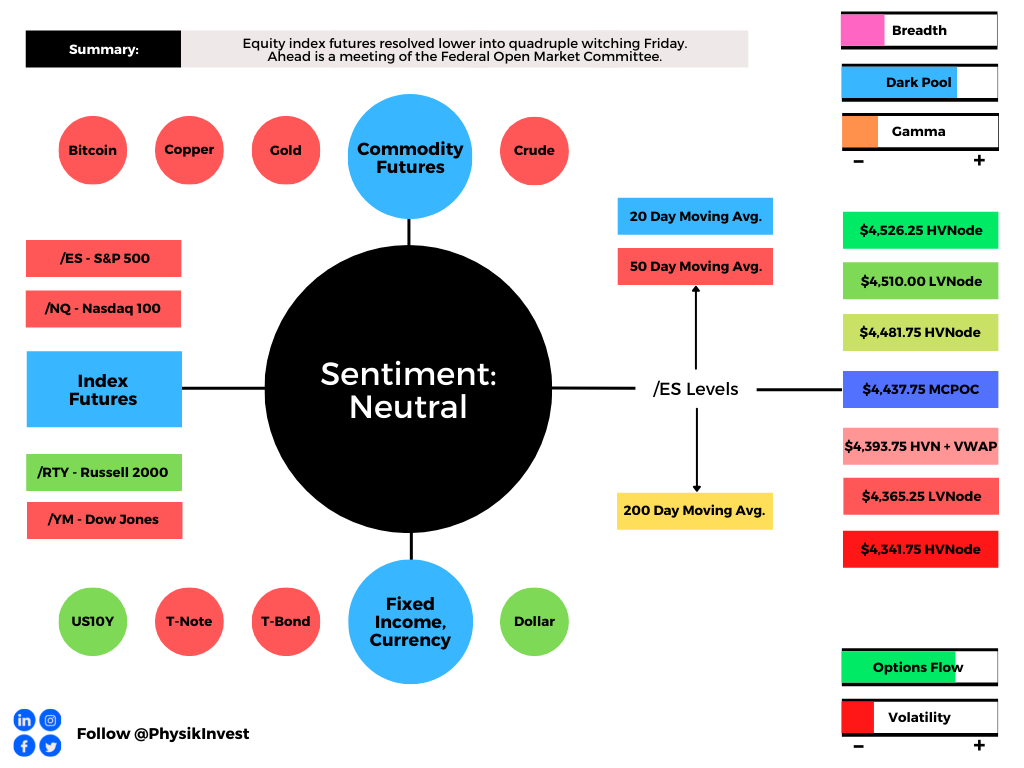
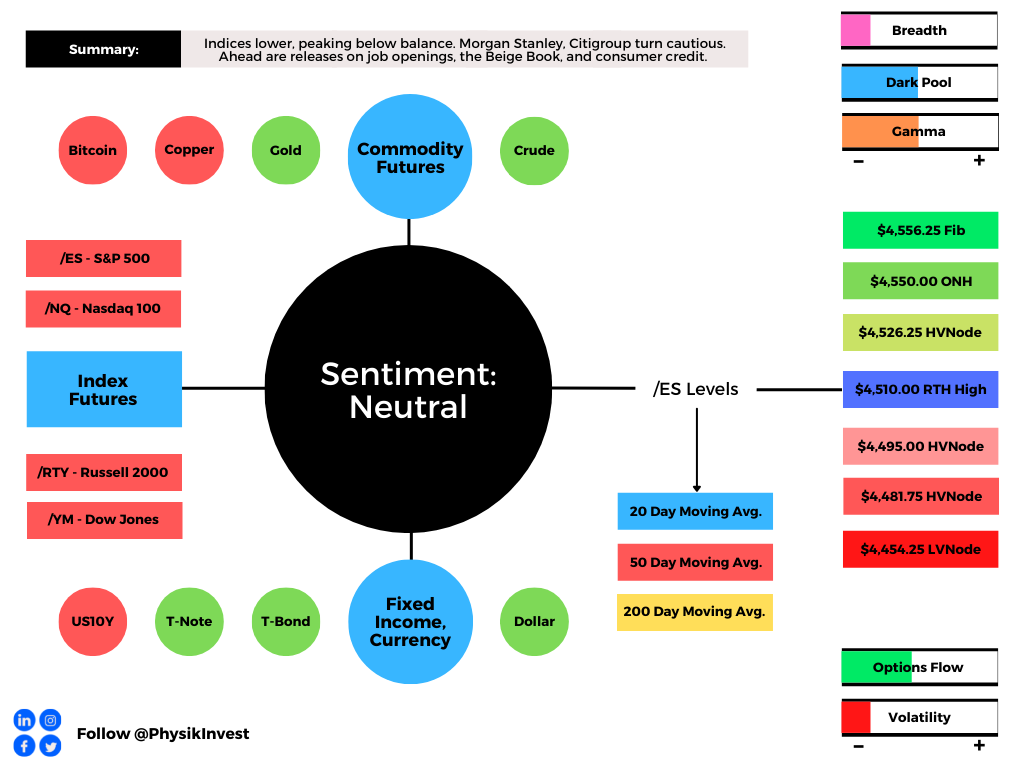
Graphic updated 6:30 AM ET. Sentiment Neutral if expected /ES open is inside of the prior day’s range. /ES levels are derived from the profile graphic at the bottom of the following section. SqueezeMetrics Dark Pool Index (DIX) and Gamma (GEX) calculations are based on where the prior day’s reading falls with respect to the MAX and MIN of all occurrences available. A higher DIX is bullish. At the same time, the lower the GEX, the more (expected) volatility. SHIFT data used for S&P 500 (INDEX: SPX) options activity. Note that options flow is sorted by the call premium spent; if more positive then more was spent on call options. Breadth reflects a reading of the prior day’s NYSE Advance/Decline indicator. VIX reflects a current reading of the CBOE Volatility Index (INDEX: VIX) from 0-100.
What To Expect: As of 6:30 AM ET, Friday’s regular session (9:30 AM – 4:00 PM EST) in the S&P 500 will likely open inside of prior-range and -value, suggesting a limited potential for immediate directional opportunity.
Adding, during the prior day’s regular trade, on positive but lighter intraday breadth and divergent market liquidity metrics, the best case outcome occurred, evidenced by initiative buying that ceased at $4,455.00.
This trade is significant because it resolved the $4,425.00 untested point of control (VPOC), an area of unfinished business so to speak.
In the process of resolve, the S&P 500 – as evidenced by emotional, multiple distribution profile structures – established a minimal excess rally high at $4,455.00 before the momentum from covering shorts was overpowered by responsive selling at key areas of resting liquidity, at and around $4,455.00, or so.
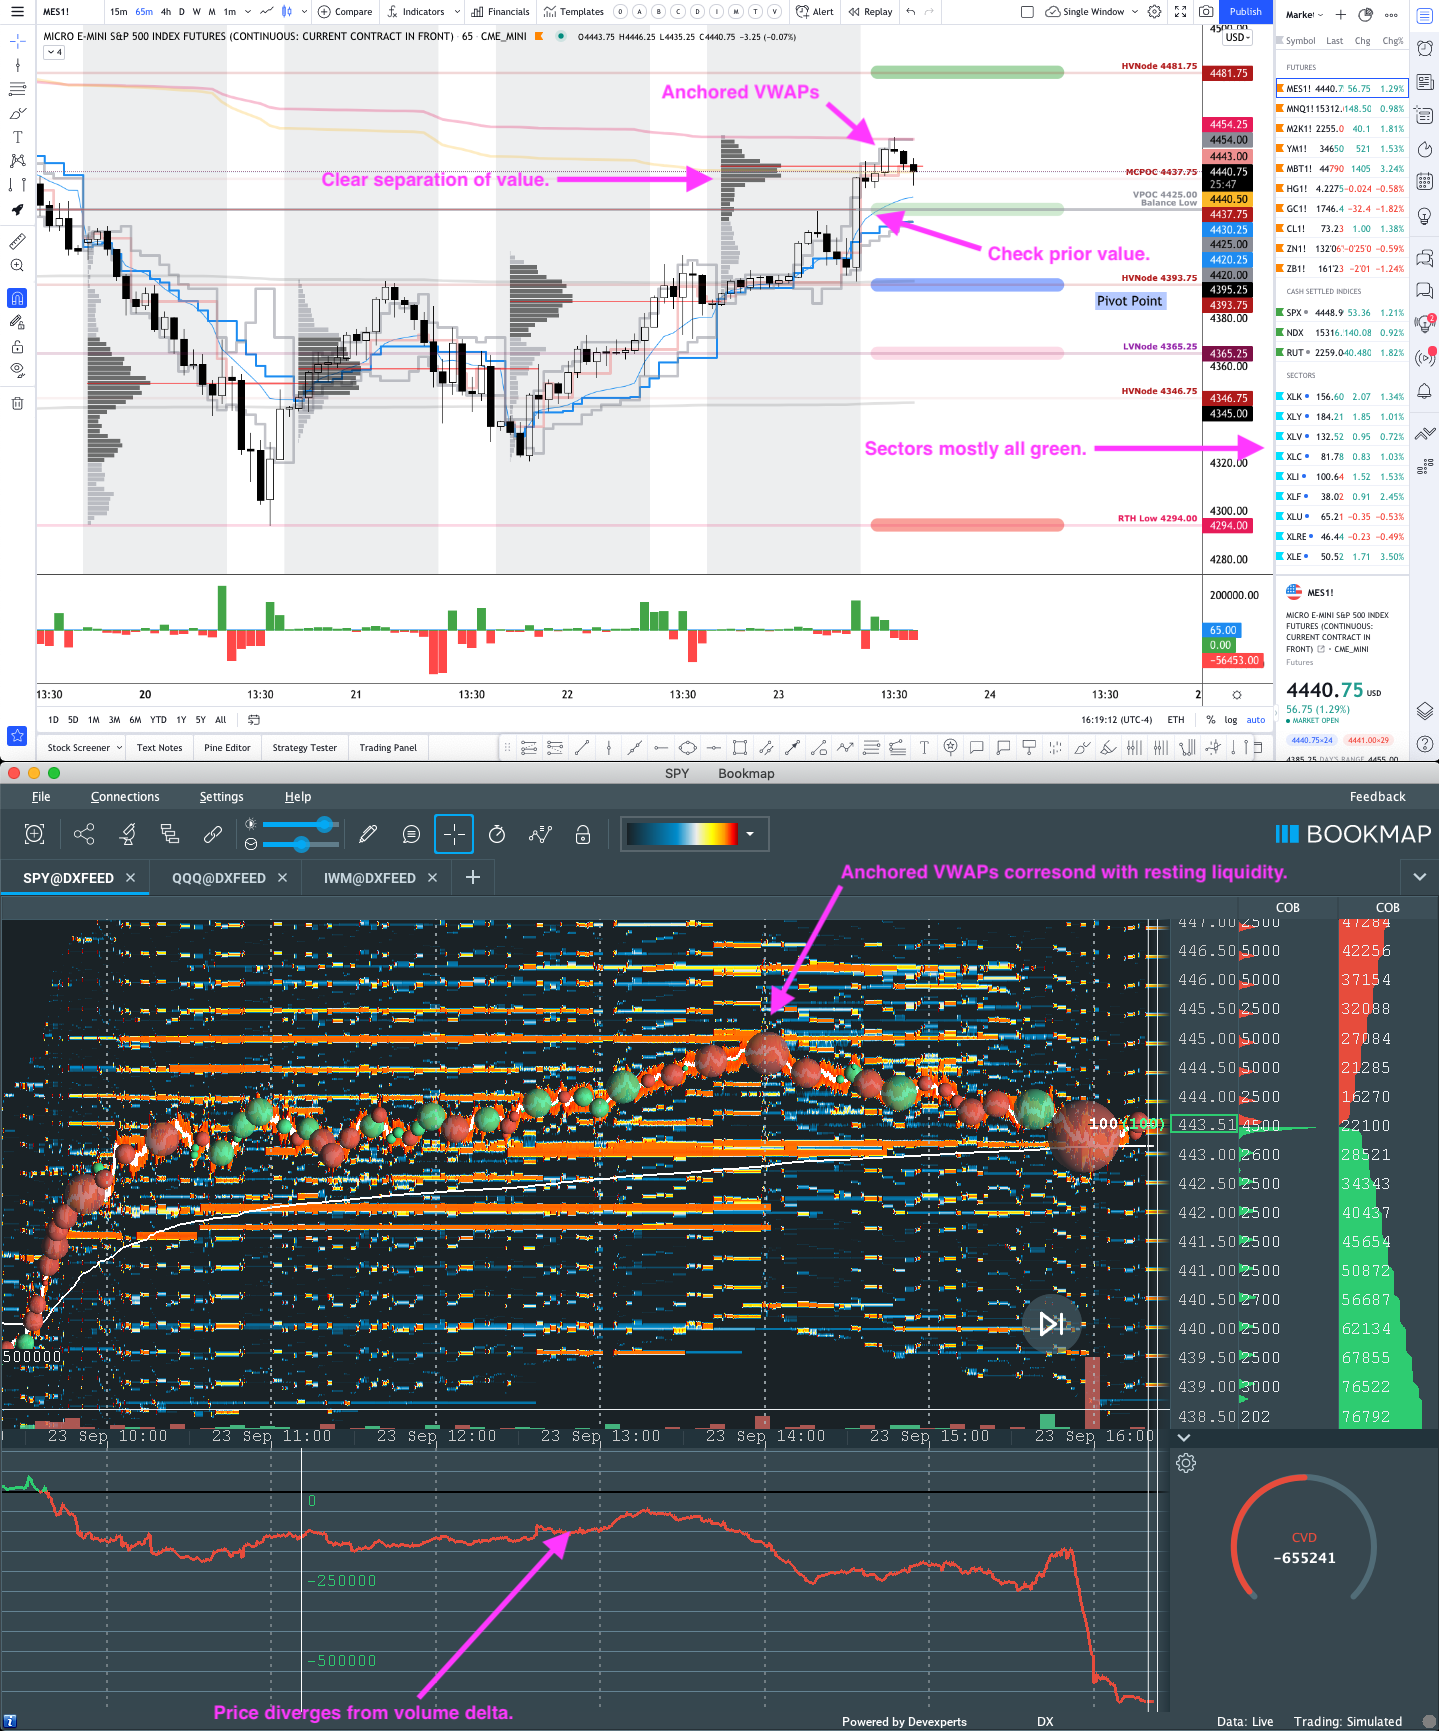
Graphic: Divergent delta (i.e., non-committed buying as measured by volume delta or buying and selling power as calculated by the difference in volume traded at the bid and offer) in SPDR S&P 500 ETF Trust (NYSE: SPY), one of the largest ETFs that track the S&P 500 index, via Bookmap. The readings are supportive of responsive trade or balance (i.e., rotational trade that suggests current prices offer favorable entry and exit).
Further, the aforementioned trade is happening in the context of global equity fund outflows, a theme in line with a recent fraying in the buy-the-dip psychology.
The implications of this theme on price are contradictory; to elaborate, according to Reuters, “With outflows of $24.2 billion, global stock funds lost the most since March 2020 as investors moved in [favor] of cash where they [plowed] in $39.6 billion of funds, Bank of America Corporation (NYSE: BAC) said, citing EPFR data. Bond funds saw inflows of $10 billion.”
Bank of America’s Michael Hartnett commented: “Pessimism over passage of the $1 billion bipartisan infrastructure bill and $3.5 trillion build back better Reconciliation caused the second-biggest outflow ever from infrastructure funds and largest from consumer funds on a year-to-date basis.”
Nevertheless, Goldman Sachs Group Inc’s (NYSE: GS) Peter Oppenheimer, alongside HSBC Holdings Plc (NYSE: HSBC) strategists, believes dip-buying is a go as “we’re still in the relatively early stages of this economic cycle.”
We saw some large participant(s) take advantage of the recent dip; there was a “flurry of [bullish] trades with the SPDR S&P 500 ETF Trust (NYSE: SPY) … involved call spreads maturing in each of the next three months. The total cost was about $50 million.”
There were large $SPY call spreads ($50mm notional) which fired off pre-FOMC yesterday AM.
This view from shows those ~10:40Am ET trades from a delta perspective. You can see just how large they were relative to the rest of day thru a hedging lens.https://t.co/m1fCzF93qxpic.twitter.com/nfgwv72AaF
Moreover, for today, given expectations of lower volatility, participants may make use of the following frameworks.
In the best case, the S&P 500 trades sideways or higher; activity above the $4,437.75 micro composite point of control (MCPOC) puts in play the $4,455.00 minimal excess high. Initiative trade beyond the minimal excess high could reach as high as the $4,481.75 high volume area (HVNode) and $4,510.00 low volume area (LVNode), or higher.
In the worst case, the S&P 500 trades lower; activity below the $4,437.75 MCPOC puts in play the $4,415.75 LVNode. Initiative trade beyond the $4,415.75 LVNode could reach as low as the $4,393.75 HVNode and $4,365.25 LVNode, or lower.
Graphic: 65-minute profile chart of the Micro E-mini S&P 500 Futures updated 6:30 AM ET.
Definitions
Volume Areas: A structurally sound market will build on areas of high volume (HVNodes). Should the market trend for long periods of time, it will lack sound structure, identified as low volume areas (LVNodes). LVNodes denote directional conviction and ought to offer support on any test.
If participants were to auction and find acceptance into areas of prior low volume (LVNodes), then future discovery ought to be volatile and quick as participants look to HVNodes for favorable entry or exit.
POCs: POCs are valuable as they denote areas where two-sided trade was most prevalent in a prior day session. Participants will respond to future tests of value as they offer favorable entry and exit.
MCPOCs: POCs are valuable as they denote areas where two-sided trade was most prevalent over numerous day sessions. Participants will respond to future tests of value as they offer favorable entry and exit.
Excess: A proper end to price discovery; the market travels too far while advertising prices. Responsive, other-timeframe (OTF) participants aggressively enter the market, leaving tails or gaps which denote unfair prices.
News And Analysis
Global equity funds see their first outflows in 2021.
Trader spent $50M on options betting on SPX rally.
China: I’m forever blowing bubbles. How bad is it?
What People Are Saying
As we press against upside 2 sigma threshold (4442.75) in #ES_F worth noting that over the past yr we have only closed above this level 3 times ~1% occurrence. And distro of returns has been fairly normal, particularly upside. Argument to lighten intraday longs, NOT to fade. $SPYpic.twitter.com/iSgeq92Mtb
Remind: RTH session for US indices is now defined as 9:30 AM to 4 PM Eastern US time. Reasons: 1) The CME changed official settlement time to the close of cash + 2) Last 15 min pit bracket is no longer relevant. Pits are not relevant/closing soon. #ES_F#NQ_F#futures#trading
{Without typos} No surprise that $VIX has flopped today. But $VIX futures being a little sticky. Spread of Oct to spot is wider than usual with 18 DTE. Could have further to fall if $SPX continues higher. pic.twitter.com/cLbzLgXfsf
After years of self-education, strategy development, and trial-and-error, Renato Leonard Capelj began trading full-time and founded Physik Invest to detail his methods, research, and performance in the markets.
Additionally, Capelj is a finance and technology reporter. Some of his biggest works include interviews with leaders such as John Chambers, founder and CEO, JC2 Ventures, Kevin O’Leary, businessman and Shark Tank host, Catherine Wood, CEO and CIO, ARK Invest, among others.
Disclaimer
At this time, Physik Invest does not manage outside capital and is not licensed. In no way should the materials herein be construed as advice. Derivatives carry a substantial risk of loss. All content is for informational purposes only.
Equity index futures trade higher with yields. VIX and most commodities sideways to lower.
Buy-the-dip mantra slowly fading.
Fed is eyeing a taper, raise rates.
SPX to 4.7-5K at end of the year.
Positioning: Still at a key juncture.
What Happened: U.S. stock index futures auctioned higher alongside news the Federal Reserve held advanced talks on paring back its asset purchase program and raising rates.
In other news, JPMorgan Chase & Co (NYSE: JPM) strategists suggest the buy-the-dip mantra is at risk.
Ahead is data on jobless claims (8:30 AM ET), Markit manufacturing and services PMI (9:45 AM ET), leading economic indicators (10:00 AM ET), as well as real household net worth and nonfinancial debt (12:00 PM ET).
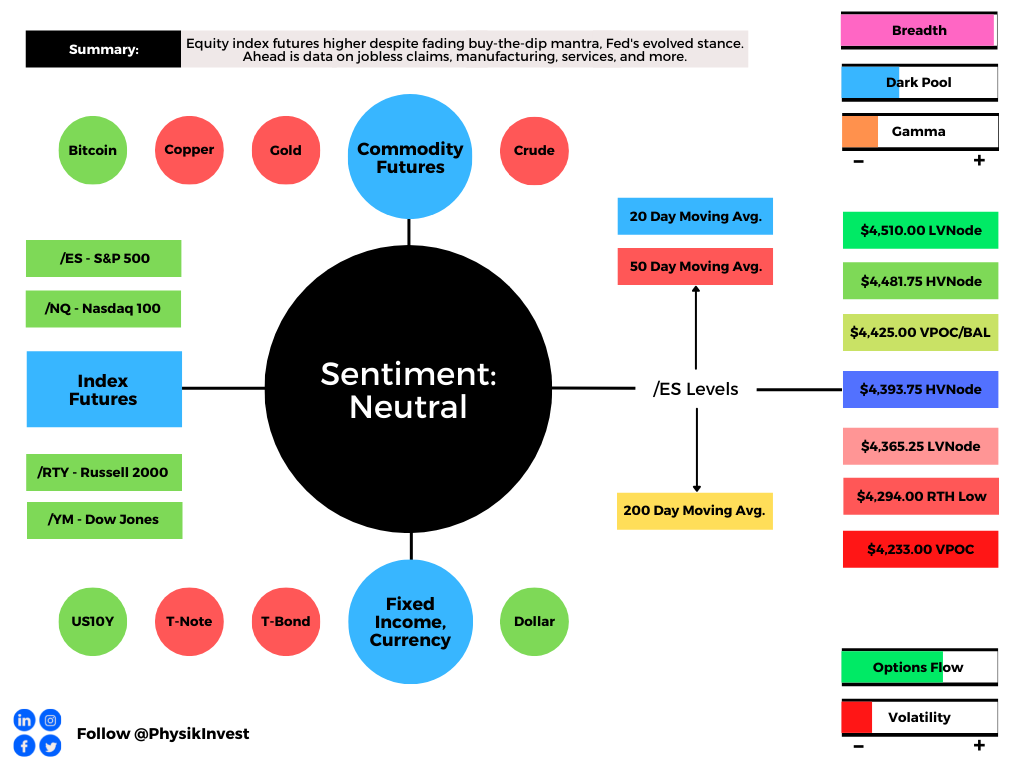
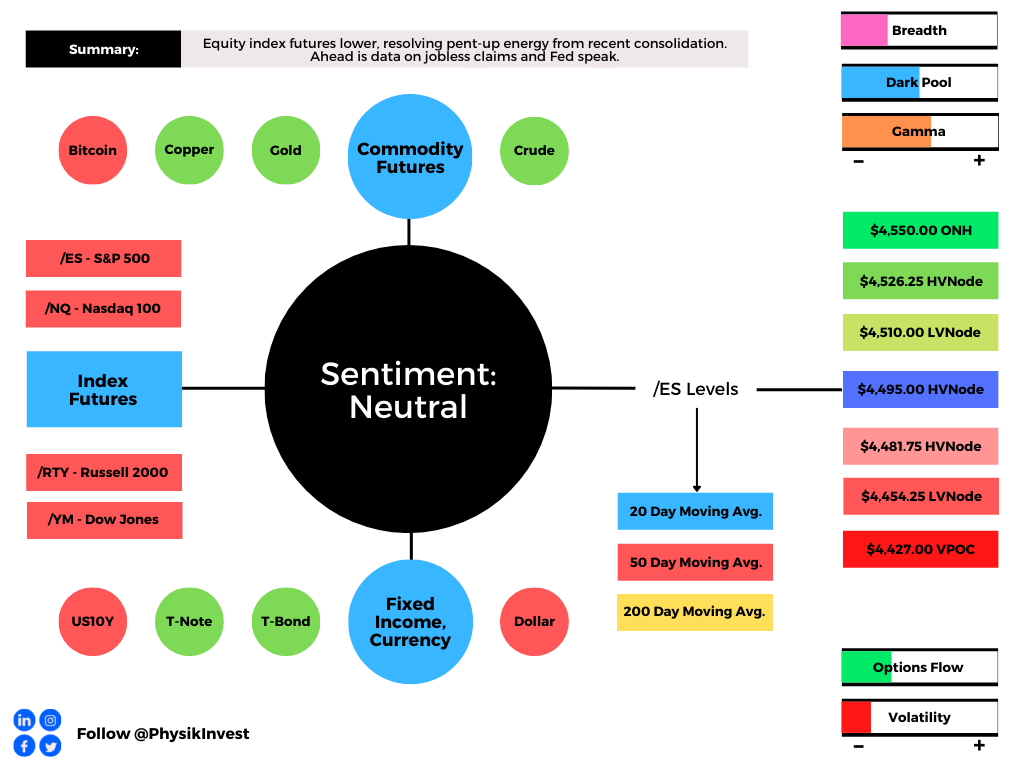
Graphic updated 6:30 AM ET. Sentiment Neutral if expected /ES open is inside of the prior day’s range. /ES levels are derived from the profile graphic at the bottom of the following section. SqueezeMetrics Dark Pool Index (DIX) and Gamma (GEX) calculations are based on where the prior day’s reading falls with respect to the MAX and MIN of all occurrences available. A higher DIX is bullish. At the same time, the lower the GEX, the more (expected) volatility. SHIFT data used for S&P 500 (INDEX: SPX) options activity. Note that options flow is sorted by the call premium spent; if more positive then more was spent on call options. Breadth reflects a reading of the prior day’s NYSE Advance/Decline indicator. VIX reflects a current reading of the CBOE Volatility Index (INDEX: VIX) from 0-100.
What To Expect: As of 6:30 AM ET, Thursday’s regular session (9:30 AM – 4:00 PM EST) in the S&P 500 may open inside of prior-range and -value, suggesting a limited potential for immediate directional opportunity.
Adding, during the prior day’s regular trade, on strong intraday breadth and divergent market liquidity metrics, the best case outcome occurred, evidenced by mostly sideways trade and higher value areas.
This is significant because sideways-to-higher trade and an intent to separate value (i.e., break from balance, higher) reflects a willingness to check and resolve some unfinished business (e.g, $4,425.00 untested point of control or VPOC).
We’re carrying forward the overhead supply; the 20- and 50-day simple moving averages, as well as the anchored volume-weighted average prices (VWAP), north of the $4,425.00 VPOC, are some key dynamic levels that must be taken to change the tone.
Balance (Two-Timeframe Or Bracket) Is The Status Quo: Rotational trade that denotes current prices offer favorable entry and exit. Balance-areas make it easy to spot a change in the market (i.e., the transition from two-time frame trade, or balance, to one-time frame trade, or trend).
Modus operandi is responsive trade (i.e., fade the edges), rather than initiative trade (i.e., play the break).
Further, the aforementioned trade is happening in the context of a fraying in the buy-the-dip psychology, as well as a belief that companies will continue to do good into year-end. The implications of these themes on price are contradictory.
On one hand, as discussed yesterday, JPMorgan Chase & Co’s Marko Kolanovic stated that despite “technical selling flows (CTAs and option hedgers) in an environment of poor liquidity, and overreaction of discretionary traders to perceived risks,” the equity market would continue higher with the S&P 500 ending 2021 at 4,700, with the potential to break 5,000 next year.
On the other hand, strategists led by JPMorgan Chase & Co’s Nikolaos Panigirtzoglou wrote that the psychology of buying the dip is fraying; “Observing flows for signs that this change in behavior would prove more persistent is important over the coming days” as the S&P 500 continues to trade below its 50-day simple moving average alongside concerns over waning stimulus, inflation, the debt ceiling, and China’s debt crisis.
Adding, Goldman Sachs Group Inc’s (NYSE: GS) Peter Oppenheimer, alongside HSBC Holdings Plc (NYSE: HSBC) strategists, believes dip-buying is a go as “we’re still in the relatively early stages of this economic cycle.”
In terms of positioning, SpotGamma data suggests the S&P 500 is still at an intersection (i.e., short gamma) that portends increased volatility, should the index continue lower.
Moreover, for today, participants may make use of the following frameworks.
In the best case, the S&P 500 trades sideways or higher; activity above the $4,393.75 high volume area (HVNode) puts in play the $4,425.00 VPOC and balance area low (BAL). Initiative trade beyond the VPOC could reach as high as the $4,481.75 HVNode and $4,510.00 low volume area (LVNode), or higher.
In the worst case, the S&P 500 trades lower; activity below the $4,393.75 HVNode puts in play the $4,365.25 LVNode. Initiative trade beyond the LVNode could reach as low as the $4,294.00 regular trade low (RTH Low) and $4,233.00 VPOC, or lower.
Graphic: 65-minute profile chart of the Micro E-mini S&P 500 Futures updated 6:30 AM ET.
Definitions
Volume Areas: A structurally sound market will build on areas of high volume (HVNodes). Should the market trend for long periods of time, it will lack sound structure, identified as low volume areas (LVNodes). LVNodes denote directional conviction and ought to offer support on any test.

If participants were to auction and find acceptance into areas of prior low volume (LVNodes), then future discovery ought to be volatile and quick as participants look to HVNodes for favorable entry or exit.

Gamma: Gamma is the sensitivity of an option to changes in the underlying price.

Dealers that take the other side of options trades hedge their exposure to risk by buying and selling the underlying.

When dealers are short-gamma, they hedge by buying into strength and selling into weakness. When dealers are long-gamma, they hedge by selling into strength and buying into weakness.

The former exacerbates volatility. The latter calms volatility.

POCs: POCs are valuable as they denote areas where two-sided trade was most prevalent in a prior day session. Participants will respond to future tests of value as they offer favorable entry and exit.

Value-Area Placement: Perception of value unchanged if value overlapping (i.e., inside day). Perception of value has changed if value not overlapping (i.e., outside day). Delay trade in the former case.

Volume-Weighted Average Prices (VWAPs): A metric highly regarded by chief investment officers, among other participants, for quality of trade. Additionally, liquidity algorithms are benchmarked and programmed to buy and sell around VWAPs.
News And Analysis
U.S. default this fall would cost 6M jobs, wipe $15T.
Central banks aim to limit digital currency disruption.
New York faces more than water-related climate risk.
Fed signals the possibility of 6 to 7 rate hikes, taper.
Building the future depends on building more homes.
Banking sector short interest relatively high…could be one of those sectors that are relatively strong on a seasonality rally (Santa Clause rally). Especially with the fact that the inflation catalyst has been so polarized. pic.twitter.com/v2qyCS2xm1
After years of self-education, strategy development, and trial-and-error, Renato Leonard Capelj began trading full-time and founded Physik Invest to detail his methods, research, and performance in the markets.
Additionally, Capelj is a finance and technology reporter. Some of his biggest works include interviews with leaders such as John Chambers, founder and CEO, JC2 Ventures, Kevin O’Leary, businessman and Shark Tank host, Catherine Wood, CEO and CIO, ARK Invest, among others.
Disclaimer
At this time, Physik Invest does not manage outside capital and is not licensed. In no way should the materials herein be construed as advice. Derivatives carry a substantial risk of loss. All content is for informational purposes only.
Editor’s Note: Late today. So sorry! The main takeaway is that we’re in a window of volatility and participants should focus on leveraging rich skew and complex spreads to hedge or speculate on sideways to lower trade.
Market Commentary
SPX below balance, 50-day SMA.
Ahead is a 2-day FOMC meeting.
Concerns around the debt ceiling.
Rich skew makes hedging easier.
Post OPEX volatility likely in play.
What Happened: U.S. stock index futures auctioned lower, last week, into Friday’s quadruple witching derivatives expiry.
Of interest this week is a meeting of the Federal Open Market Committee (FOMC).
Graphic updated 5:30 PM ET Sunday. Sentiment Neutral if expected /ES open is inside of the prior day’s range. /ES levels are derived from the profile graphic at the bottom of the following section. SqueezeMetrics Dark Pool Index (DIX) and Gamma (GEX) calculations are based on where the prior day’s reading falls with respect to the MAX and MIN of all occurrences available. A higher DIX is bullish. At the same time, the lower the GEX, the more (expected) volatility. SHIFT data used for S&P 500 (INDEX: SPX) options activity. Note that options flow is sorted by the call premium spent; if more positive then more was spent on call options. Breadth reflects a reading of the prior day’s NYSE Advance/Decline indicator. VIX reflects a current reading of the CBOE Volatility Index (INDEX: VIX) from 0-100.
What To Expect: During the prior week’s trade, on weakbreadth, the worst-case outcome occurred, evidenced by a balance-area breakout and separation of value below the S&P 500’s 50-day simple moving average (i.e., a visual level likely paid attention to by short-term, technically-driven market participants who generally are unable to defend retests).
Balance-Break Scenarios: A change in the market (i.e., the transition from two-time frame trade, or balance, to one-time frame trade, or trend) has occurred.

We now monitor for rejection (i.e., return inside of balance) which portends a move to the opposite end of the balance.
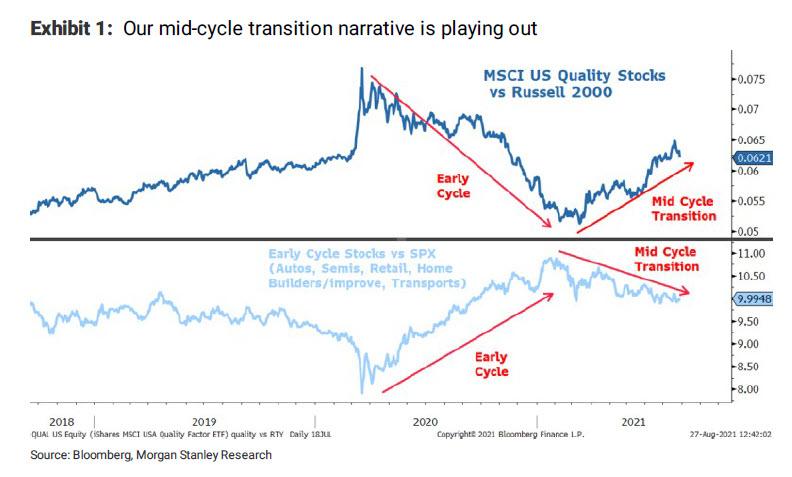
Further, the aforementioned trade is happening in the context of a waning economic recovery, heightened valuations in the face of strong EPS expectations, the prospects of stimulus reduction, non-seasonally aligned flows, impactful options and equity market dynamics, divergent sentiment, as well as fears of a mid-cycle transition.
In a Goldman Sachs Group Inc (NYSE: GS) note posted by The Market Ear, analysts “believe it is a critical period for many investors and companies that manage performance to calendar year-end. Such pressures boost volumes and volatility as investors observe earnings reports, analyst days and managements’ guidance for the following year.”
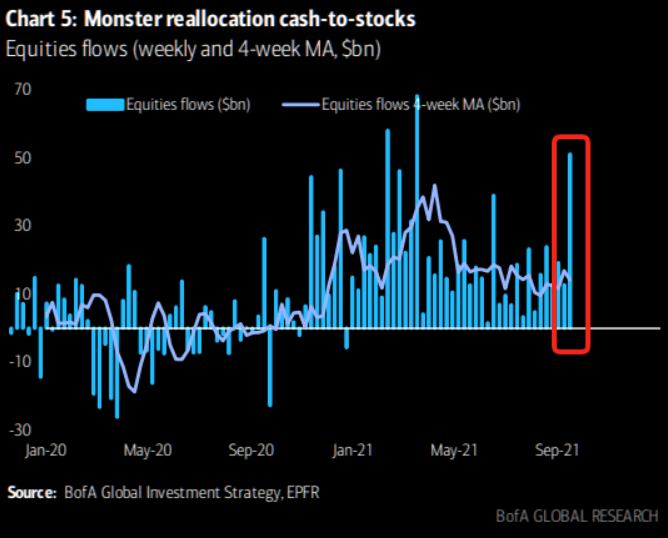
At the same time, inflows into equities are exploding to the upside as JPMorgan Chase & Co (NYSE: JPM) technicians “do not see a pattern on the [S&P 500] chart or any cross-market dynamics that would suggest the market is set for a lasting bearish reversal. The late-Aug systematic sell signals lose statistical significance into next week and the seasonal trends improve into early-Oct.”
Graphic: Bank of America Corporation (NYSE: BAC) charts equity flows, via The Market Ear.
That said, we hone in on risks.
If concerns like the debt ceiling are not resolved, some economists argue, according to Bloomberg, “that an announcement on tapering is likely to be delayed to December, and that Treasury yields could fall further as a result.”
We note that – as Goldman Sachs writes – “The upcoming debt limit deadline is beginning to look as risky as the 2011 debt limit showdown that led to Standard & Poor’s downgrade of the US sovereign rating and eventually to budget sequestration, or the 2013 deadline that overlapped with a government shutdown.”
On the other hand, according to SqueezeMetrics, “the current combination of weak put flows and large customer vanna exposure” is fragile; “people are [still] overexposed to changes in VIX, and will be hurt more than usual if VIX starts moving up. Historically, this means SPX down, VIX up.”
Following SqueezeMetrics’ remarks, SpotGamma adds that “over 50% of stocks [had] their largest gamma position” roll-off Friday. This suggests an increased potential for volatility heading into the September 21-22 FOMC event.
In this post-quad-witching window of non-strength, we may, as a result, use the rich skew to hedge (see below Weekly Trade Idea section).
Today (9/17) is a big OpEx, and SPX dealer gamma (yes, dealers are still long gamma) is getting cut in half by the end of the day.
Moreover, for today, given an increased potential for heightened volatility and initiative trade, participants may make use of the following frameworks.
In the best case, the S&P 500 trades sideways or higher; activity above the $4,437.75 micro-composite point of control (MCPOC) puts in play the $4,481.75 high volume area (HVNode). Initiative trade beyond the $4,481.75 HVNode could reach as high as the $4,510.00 low volume area (LVNode) and $4,526.25 HVNode, or higher.
In the worst case, the S&P 500 trades lower; activity below the $4,437.75 MCPOC puts in play the $4,393.75 HVNode. Initiative trade beyond the $4,393.75 HVNode could reach as low as the $4,365.25 LVNode and $4,341.00 untested point of control (VPOC), or lower.
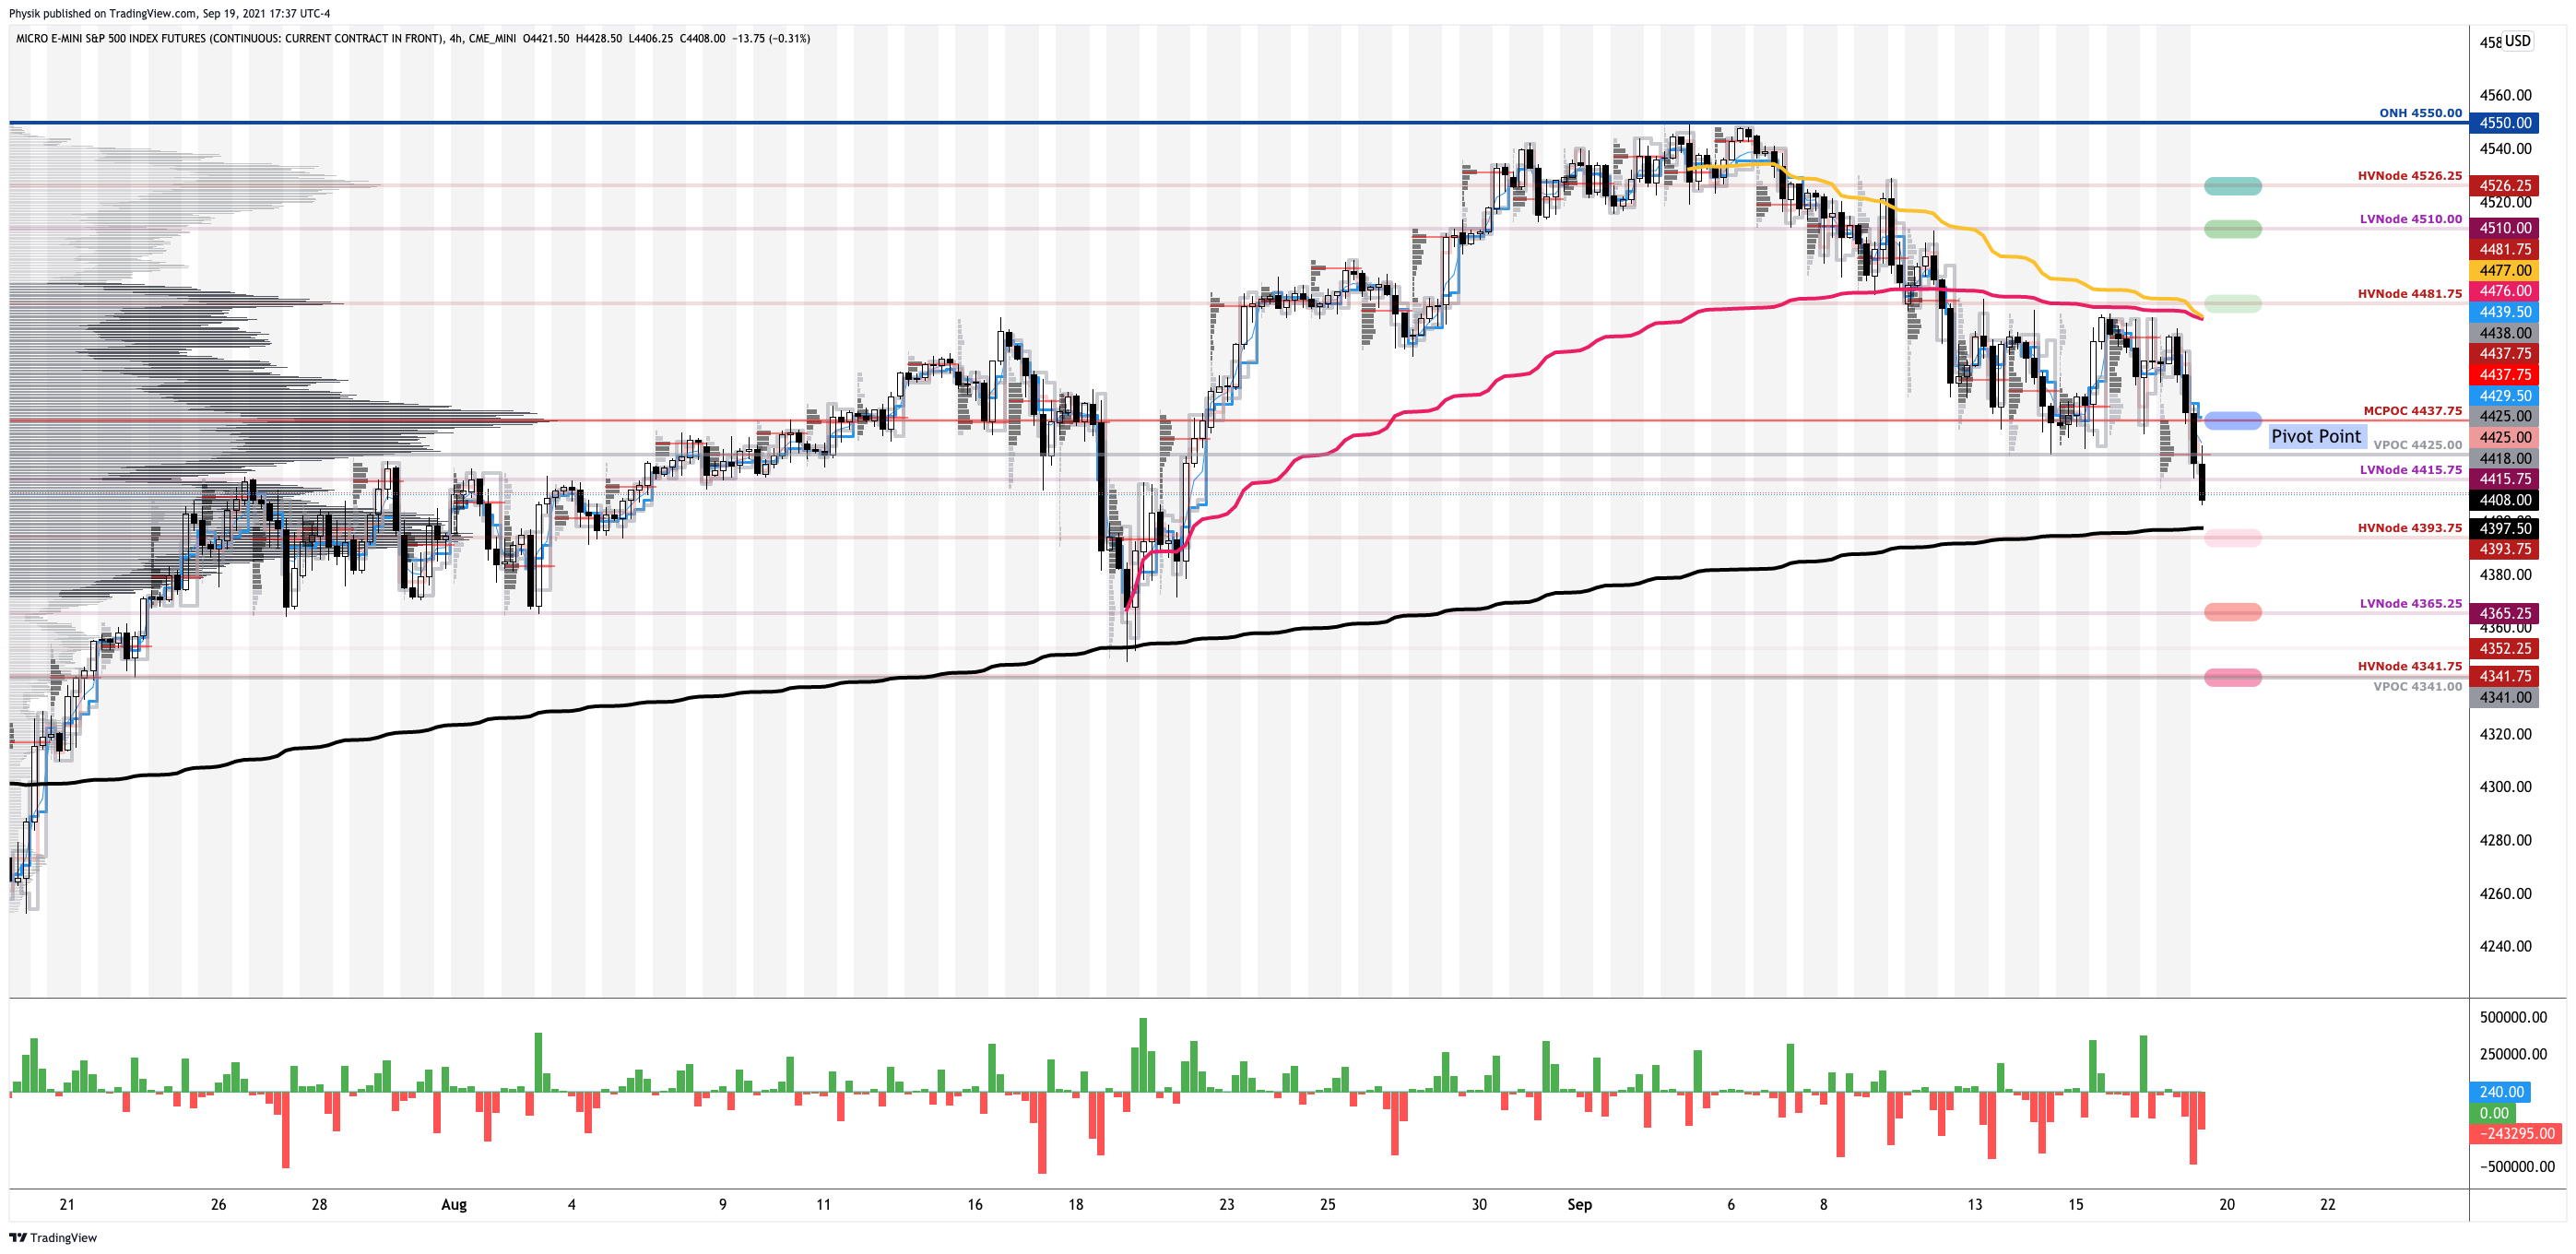
We note that the $4,481.75 and $4,393.75 HVNodes intersect key anchored volume-weighted average price levels. These are metrics highly regarded by chief investment officers, among other participants, for quality of trade. Additionally, liquidity algorithms are benchmarked and programmed to buy and sell around VWAPs.
Graphic: 4-hour profile chart of the Micro E-mini S&P 500 Futures updated 5:30 PM ET Sunday.
Key Definitions
Volume Areas: A structurally sound market will build on areas of high volume (HVNodes). Should the market trend for long periods of time, it will lack sound structure, identified as low volume areas (LVNodes). LVNodes denote directional conviction and ought to offer support on any test.
If participants were to auction and find acceptance into areas of prior low volume (LVNodes), then future discovery ought to be volatile and quick as participants look to HVNodes for favorable entry or exit.
POCs: POCs are valuable as they denote areas where two-sided trade was most prevalent in a prior day session. Participants will respond to future tests of value as they offer favorable entry and exit.
MCPOCs: POCs are valuable as they denote areas where two-sided trade was most prevalent over numerous day sessions. Participants will respond to future tests of value as they offer favorable entry and exit.
Weekly Trade Idea
Please Note: In no way is the below a trade recommendation. Derivatives carry a substantial risk of loss. All content is for informational purposes only.
Options offer an efficient way to gain directional exposure.
If an option buyer was short (long) stock, he or she could buy a call (put) to hedge upside (downside) exposure. Additionally, one can spread, or buy (+) and sell (-) options together, strategically.
Commonly discussed spreads include credit, debit, ratio, back, and calendar.
Credit: Sell -1 option closer to the money. Buy +1 option farther out of the money.
Debit: Buy +1 option closer to the money. Sell -1 option farther out of the money.
Ratio: Buy +1 option closer to the money. Sell -2 options farther out of the money.
Back: Sell -1 option closer to the money. Buy +2 options farther out of the money.
Calendar: Sell -1 option. Buy +1 option farther out in time, at the same strike.
Typically, if bullish (bearish), sell at-the-money put (call) credit spread and/or buy a call (put) debit/ratio spread structured around target price. Alternatively, if the expected directional move is great (small), opt for a back spread (calendar spread). Also, if credit spread, capture 50-75% of the premium collected. If debit spread, capture 2-300% of the premium paid.
Be cognizant of risk exposure to direction (delta), time (theta), and volatility (vega).
Negative (positive) delta = synthetic short (long).
Negative (positive) theta = time decay hurts (helps).
I’m neutral to bearish on the S&P 500 and I think the index may slide toward $4,300. I will structure a spread below the current index price, expiring in about 2 weeks. I will buy the 4400 put option once (+1) and sell the 4300 put option twice (-2) for a $0.65 credit. Should the index not move to my target, I keep the $65 credit. Should it move to $4,300, I could make $10,065.00 at expiry. Should the index move past $4,200.00 or so, I may incur unlimited losses. My goal, with this spread, is to capture the initial credit and close for additional credit if the index moves lower.

If necessary, I will hedge the position by either (A) selling futures, (B) widening strikes, (C) buying a far out-of-the-money put option to cap downside in case of an unpredictable move lower, or (D) roll strikes down in price and out in time.
News And Analysis
An essay on why you keep losing money as a trader.
August retail sales reflect strong consumer demand.
UBS: Resist temptation to time market despite highs.
U.S. debt ceiling fight could cause markets to tumble.
Nasdaq on whether Rule 605 works better in dollars.
Rally driven less by reflation prospects; TINA to stock.
DeFi is disrupting but not derailing traditional finance.
OpenSea admitted recent incident as insider trading.
SEC looks to greater oversight of the crypto markets.
Central bank digital currency; cash for the digital age.
White House to put forward three CFTC nominations.
Some key lessons from NYC’s first SALT conference.
Let’s Hang Out
Salt Lake City, UT September 28-30
About
After years of self-education, strategy development, and trial-and-error, Renato Leonard Capelj began trading full-time and founded Physik Invest to detail his methods, research, and performance in the markets.
Additionally, Capelj is a finance and technology reporter. Some of his biggest works include interviews with leaders such as John Chambers, founder and CEO, JC2 Ventures, Kevin O’Leary, businessman and Shark Tank host, Catherine Wood, CEO and CIO, ARK Invest, among others.
Disclaimer
At this time, Physik Invest does not manage outside capital and is not licensed. In no way should the materials herein be construed as advice. Derivatives carry a substantial risk of loss. All content is for informational purposes only.
Editor’s Note: Keeping it light today; the main takeaway is that we’re in a window of volatility and participants should maintain a cautiously bullish stance, for the time being. Skew makes it so we can hedge for little-to-no cost using complex spreads (more on this below).
Please note that levels in the below graphics should only be relied upon as rough areas of resistance and support due to the December contract roll. Updated levels to come later this week, after daily commentaries resume Thursday, September 16.
Equity index futures trade lower, last week, resolving a multi-week consolidation area.
Narratives around slower recovery rising.
Equity indices falling; SPX above 50-day.
Positioning risks mount case for volatility.
A couple trade ideas for the week ahead.
What Happened: U.S. stock index futures resolved lower, last week, alongside the evolution of some important dynamics with respect to the pace of the pandemic recovery and trend growth, non-seasonally aligned flows and positioning risks, as well as divergent sentiment.
Of interest this week is data on the consumer price index, industrial production, retail sales, and some Fed manufacturing surveys.
Graphic updated 12:00 PM ET Saturday. Sentiment Neutral if expected /ES open is inside of the prior day’s range. SqueezeMetrics Dark Pool Index (DIX) and Gamma (GEX) calculations are based on where the prior day’s reading falls with respect to the MAX and MIN of all occurrences available. A higher DIX is bullish. At the same time, the lower the GEX, the more (expected) volatility. SHIFT data used for S&P 500 (INDEX: SPX) options activity approximation. Note that options flow is sorted by the call premium spent; if more positive then more was spent on call options. Breadth reflects a reading of the prior day’s NYSE Advance/Decline indicator. VIX reflects a current reading of the CBOE Volatility Index (INDEX: VIX) from 0-100.
What To Expect: During the prior week’s regular trade, on weak intraday breadth and mostly divergent market liquidity metrics, the worst-case outcome occurred, evidenced by trade below a key micro-composite high volume area (HVNode).
This activity resolved a multi-week consolidation area (ie., balance).
Volume Areas: A structurally sound market will build on past areas of high volume. Should the market trend for long periods of time, it will lack sound structure (identified as a low volume area which denotes directional conviction and ought to offer support on any test).

If participants were to auction and find acceptance into areas of prior low volume, then future discovery ought to be volatile and quick as participants look to areas of high volume for favorable entry or exit.

Balance (Two-Timeframe Or Bracket): Rotational trade that denotes current prices offer favorable entry and exit. Balance-areas make it easy to spot a change in the market (i.e., the transition from two-time frame trade, or balance, to one-time frame trade, or trend).

Modus operandi is responsive trade (i.e., fade the edges), rather than initiative trade (i.e., play the break).
To note, initially, participants had a tough time separating value and expanding range lower.
This was evidenced by the minimal excess at Wednesday’s regular trade low (RTH Low), coupled with Thursday’s overnight response at the 20-day simple moving average (i.e., a visual level likely paid attention to by short-term, technically-driven market participants who generally are unable to defend retests).
Graphic: S&P 500 loses the 20-day simple moving average. A loss of that level officially changes the tone; “We maintain a cautiously bullish stance.”
Given that action – the difficulty participants had in moving prices out and away from balance – the path of least resistance was not down; stronger sellers were not yet on board, I explained.
Excess: A proper end to price discovery; the market travels too far while advertising prices. Responsive, other-timeframe (OTF) participants aggressively enter the market, leaving tails or gaps which denote unfair prices.

Value-Area Placement: Perception of value unchanged if value overlapping (i.e., inside day). Perception of value has changed if value not overlapping (i.e., outside day). Delay trade in the former case.
Graphic: 30-minute profile chart of the Micro E-mini S&P 500 Futures and market liquidity, via Bookmap, for the SPDR S&P 500 ETF Trust (NYSE: SPY) coming into Thursday’s regular trade. Notice the cumulative volume delta (CVD) or buying and selling power as calculated by the difference in volume traded at the bid and offer. So, coming into Friday’s trade, stronger sellers were likely not yet on board.
The tone changed Friday when selling intensified; the 20-day simple moving average was lost and the S&P 500 closed the session on a spike lower, away from value.
Spike Rules In Play: Spike’s mark the beginning of a break from value. Spikes higher (lower) are validated by trade at or above (below) the spike base (i.e., the origin of the spike).
Further, the aforementioned trade is happening in the context of peak growth and a moderation in the economic recovery, heightened valuations, the prospects of stimulus reduction, as well as non-seasonally aligned inflows, impactful options market dynamics, divergent sentiment, and fears of a mid-cycle transition.
The implications of these themes on price are contradictory.
To elaborate, Morgan Stanley (NYSE: MS), Citigroup Inc (NYSE: C), and Goldman Sachs Group Inc (NYSE: GS) cautioned investors about equity outlooks. Of concern, in particular, is a rise in cases of the delta variant, tensions between inflation expectations and yields, as well as seasonality.
Among other risks, as SpotGamma notes, “markets are fast approaching a window of volatility which could produce some pretty sharp volatility: 9/15 VIX expiration, 9/17 Quarterly OPEX and the 9/22 FOMC. This lineup is particularly interesting as we believe that expiration leads to a pickup in volatility.” Read more on SpotGamma’s perspectives, here.
Graphic: @pat_hennessy breaks down returns for the S&P 500, categorized by the week relative to OPEX. Based on his analysis, Pat sees that the “2 weeks prior to OPEX (e.g., 7/30/21 to 8/6/21 in this late-cycle) [have] been extremely bullish,” while “OPEX week returns peaked in 2016 and have trended lower since.”
SqueezeMetrics – which saw “the current combination of weak put flows and large customer vanna exposure” as fragile – echoes the risks of volatility adding “people are overexposed to changes in VIX, and will be hurt more than usual if VIX starts moving up. Historically, this means SPX down, VIX up.”
Moreover, for early trade next week, given an increased potential for heightened volatility and Friday’s end-of-day spike from value, participants may make use of the following framework.
If participants manage to find acceptance (i.e., spend multiple hours of trade) above the $4,467.00 spike base, then the odds of downside follow-through are lower. We’d look to maintain a cautiously bullish stance.
On the other hand, should participants have trouble maintaining prices above the $4,467.00 spike base, then the focus ought to be on big-picture risk management levels like the August 19, 2021 swing low and 50-day simple moving average.
Graphic: 65-minute profile chart of the Micro E-mini S&P 500 Futures updated 12:00 PM ET Saturday. Note that the roll to the December contract occurred on September 9, 2021. Therefore, levels in the above graphic should only be relied upon as rough areas of resistance and support. Updated levels to come Thursday, September 16, 2021.
Weekly Trade Idea
Please Note: In no way is the below a trade recommendation. Derivatives carry a substantial risk of loss. All content is for informational purposes only.
Options offer an efficient way to gain directional exposure.
If an option buyer was short (long) stock, he or she could buy a call (put) to hedge upside (downside) exposure. Additionally, one can spread, or buy (+) and sell (-) options together, strategically.
Commonly discussed spreads include credit, debit, ratio, back, and calendar.
Credit: Sell -1 option closer to the money. Buy +1 option farther out of the money.
Debit: Buy +1 option closer to the money. Sell -1 option farther out of the money.
Ratio: Buy +1 option closer to the money. Sell -2 options farther out of the money.
Back: Sell -1 option closer to the money. Buy +2 options farther out of the money.
Calendar: Sell -1 option. Buy +1 option farther out in time, at the same strike.
Typically, if bullish (bearish), sell at-the-money put (call) credit spread and/or buy a call (put) debit/ratio spread structured around target price. Alternatively, if the expected directional move is great (small), opt for a back spread (calendar spread). Also, if credit spread, capture 50-75% of the premium collected. If debit spread, capture 2-300% of the premium paid.
Be cognizant of risk exposure to direction (delta), time (theta), and volatility (vega).
Negative (positive) delta = synthetic short (long).
Negative (positive) theta = time decay hurts (helps).
Trade Idea 1: SELL -1 1/2 BACKRATIO SPX 100 (Weeklys) 17 SEP 21 4350/4250 PUT @3.80 LMT
I’m neutral-to-bearish on the S&P 500 and I think the index may travel sideways to lower over the next week, past its key moving averages. I will structure a spread below the current index price, expiring in 1 week. I will buy the 4350 put option once (+1) and sell the 4250 put option twice (-2) for a $3.80 credit. Should the index not move to my target, I keep the $380 credit. Should it move to $4,250.00, past the 50-day simple moving average, I could make $10,380.00 at expiry. Should the index move past $4,150.00 or so, I may incur unlimited losses. My goal, with this spread, is to capture the initial credit and close for additional credit if the index moves lower.
If necessary, I will hedge the position by either (A) selling futures, (B) widening strikes, (C) buying a far out-of-the-money put option to cap downside in case of an unpredictable move lower, or (D) roll strikes down in price and out in time.
Trade Idea 2: SELL -1 1/2 BACKRATIO GOOGL 100 17 SEP 21 2775/2700 PUT @.90 LMT
I’m neutral-to-bearish on Alphabet Inc and I think the stock may travel sideways to lower over the next week, past its key moving averages. I will structure a spread below the current stock price, expiring in 1 week. I will buy the 2775 put option once (+1) and sell the 2700 put option twice (-2) for a $0.90 credit. Should the stock not move to my target, I keep the $90 credit. Should it move to $2,700.00, toward the 50-day simple moving average, I could make $7,500.00 at expiry. Should the stock move past $2,625.00 or so, I may incur unlimited losses. My goal, with this spread, is to capture the initial credit and close for additional credit if the stock moves lower.
If necessary, I will hedge the position by either (A) selling stock, (B) widening strikes, (C) buying a far out-of-the-money put option to cap downside in case of an unpredictable move lower, or (D) roll strikes down in price and out in time.
News And Analysis
Lenders continue to expect falling profits, refinancing demand.
Manchin seeing delay in Congress for vote on Biden’s agenda.
Massive decline in forbearances, down nearly 67% from peak.
Oil prices continuing to fall as pandemic worries slow demand.
Moody’s: Democrats are at a fork in the road, may not take it.
COVID-19 and China risks won’t pass for years, some project.
Nasdaq talks market infrastructure, the real trends in volumes.
Bonds turning hot; European Central Bank redefines tapering.
What People Are Saying
Producer Price Inflation is above 10% for the first time since 1981 on a finished goods basis (the main measure used until 2011). On a final demand basis, it's 8.3%, highest since inception in 2011. Either way, it's worryingly high. pic.twitter.com/vIYCRAjd79
In this the SPX chart, OPEX is marked. It does give the appearance that volatility has shifted from end of month aka "mid OPEX cycle" to OPEX itself. pic.twitter.com/huedOFaMGL
With every up swing shorter than the previous one and loss of momentum, this market tells me it wants to correct. No top reversal chart pattern. No breakdown signal as of Friday's close. 4,100-4,200 area is support. #SPXpic.twitter.com/sPkQEPghQ8
After years of self-education, strategy development, and trial-and-error, Renato Leonard Capelj began trading full-time and founded Physik Invest to detail his methods, research, and performance in the markets.
Additionally, Capelj is a finance and technology reporter. Some of his biggest works include interviews with leaders such as John Chambers, founder and CEO, JC2 Ventures, Kevin O’Leary, businessman and Shark Tank host, Catherine Wood, CEO and CIO, ARK Invest, among others.
Disclaimer
At this time, Physik Invest does not manage outside capital and is not licensed. In no way should the materials herein be construed as advice. Derivatives carry a substantial risk of loss. All content is for informational purposes only.
Editor’s Note: Daily market commentaries to pause until Thursday, September 16, 2021, due to travel commitments. A weekend commentary will be in your inbox earlier this week.
Equity index futures trade lower with yields, dollar, and bitcoin. Most commodities were green.
Narratives around slower recovery rising.
Ahead is jobless claims data, Fed speak.
Positioning risks mounting case for lower.
What Happened: U.S. stock index futures auctioned lower overnight alongside narratives surrounding a slowed economic recovery and stimulus reductions.
Ahead is data on jobless claims (8:30 AM ET), as well as Fed-speak by Bowman (1:00 PM ET) and Williams (2:00 PM ET).
Graphic updated 6:30 AM ET. Sentiment Neutral if expected /ES open is inside of the prior day’s range. SqueezeMetrics Dark Pool Index (DIX) and Gamma (GEX) calculations are based on where the prior day’s reading falls with respect to the MAX and MIN of all occurrences available. A higher DIX is bullish. At the same time, the lower the GEX, the more (expected) volatility. SHIFT data used for S&P 500 (INDEX: SPX) options activity approximation. Note that options flow is sorted by the call premium spent; if more positive then more was spent on call options. Breadth reflects a reading of the prior day’s NYSE Advance/Decline indicator. VIX reflects a current reading of the CBOE Volatility Index (INDEX: VIX) from 0-100.
What To Expect: As of 6:30 AM ET, Thursday’s regular session (9:30 AM – 4:00 PM EST) in the S&P 500 will likely open inside of prior-range and -value, suggesting a limited potential for immediate directional opportunity.
Adding, during the prior day’s regular trade, on weak intraday breadth and divergent market liquidity metrics, the best case outcome occurred, evidenced by sideways trade at the $4,510.00 pivot, the low end of a recent consolidation (i.e., balance) area.
Balance (Two-Timeframe Or Bracket): Rotational trade that denotes current prices offer favorable entry and exit. Balance-areas make it easy to spot a change in the market (i.e., the transition from two-time frame trade, or balance, to one-time frame trade, or trend).

Modus operandi is responsive trade (i.e., fade the edges), rather than initiative trade (i.e., play the break).
To note, participants had a tough time separating value and expanding range lower.
This is evidenced by the minimal excess at yesterday’s regular trade low (RTH Low), coupled with an overnight response at the 20-day simple moving average (i.e., a visual level likely paid attention to by short-term, technically-driven market participants).
In other words, we’re carrying forward the difficulty participants had, in days prior, to moving prices out and away from balance. The path of least resistance – at least in prior trade – was not down; stronger sellers are not yet on board.
Excess: A proper end to price discovery; the market travels too far while advertising prices. Responsive, other-timeframe (OTF) participants aggressively enter the market, leaving tails or gaps which denote unfair prices.

Value-Area Placement: Perception of value unchanged if value overlapping. Perception of value has changed if value not overlapping (i.e., outside day). Delay action in the former case.
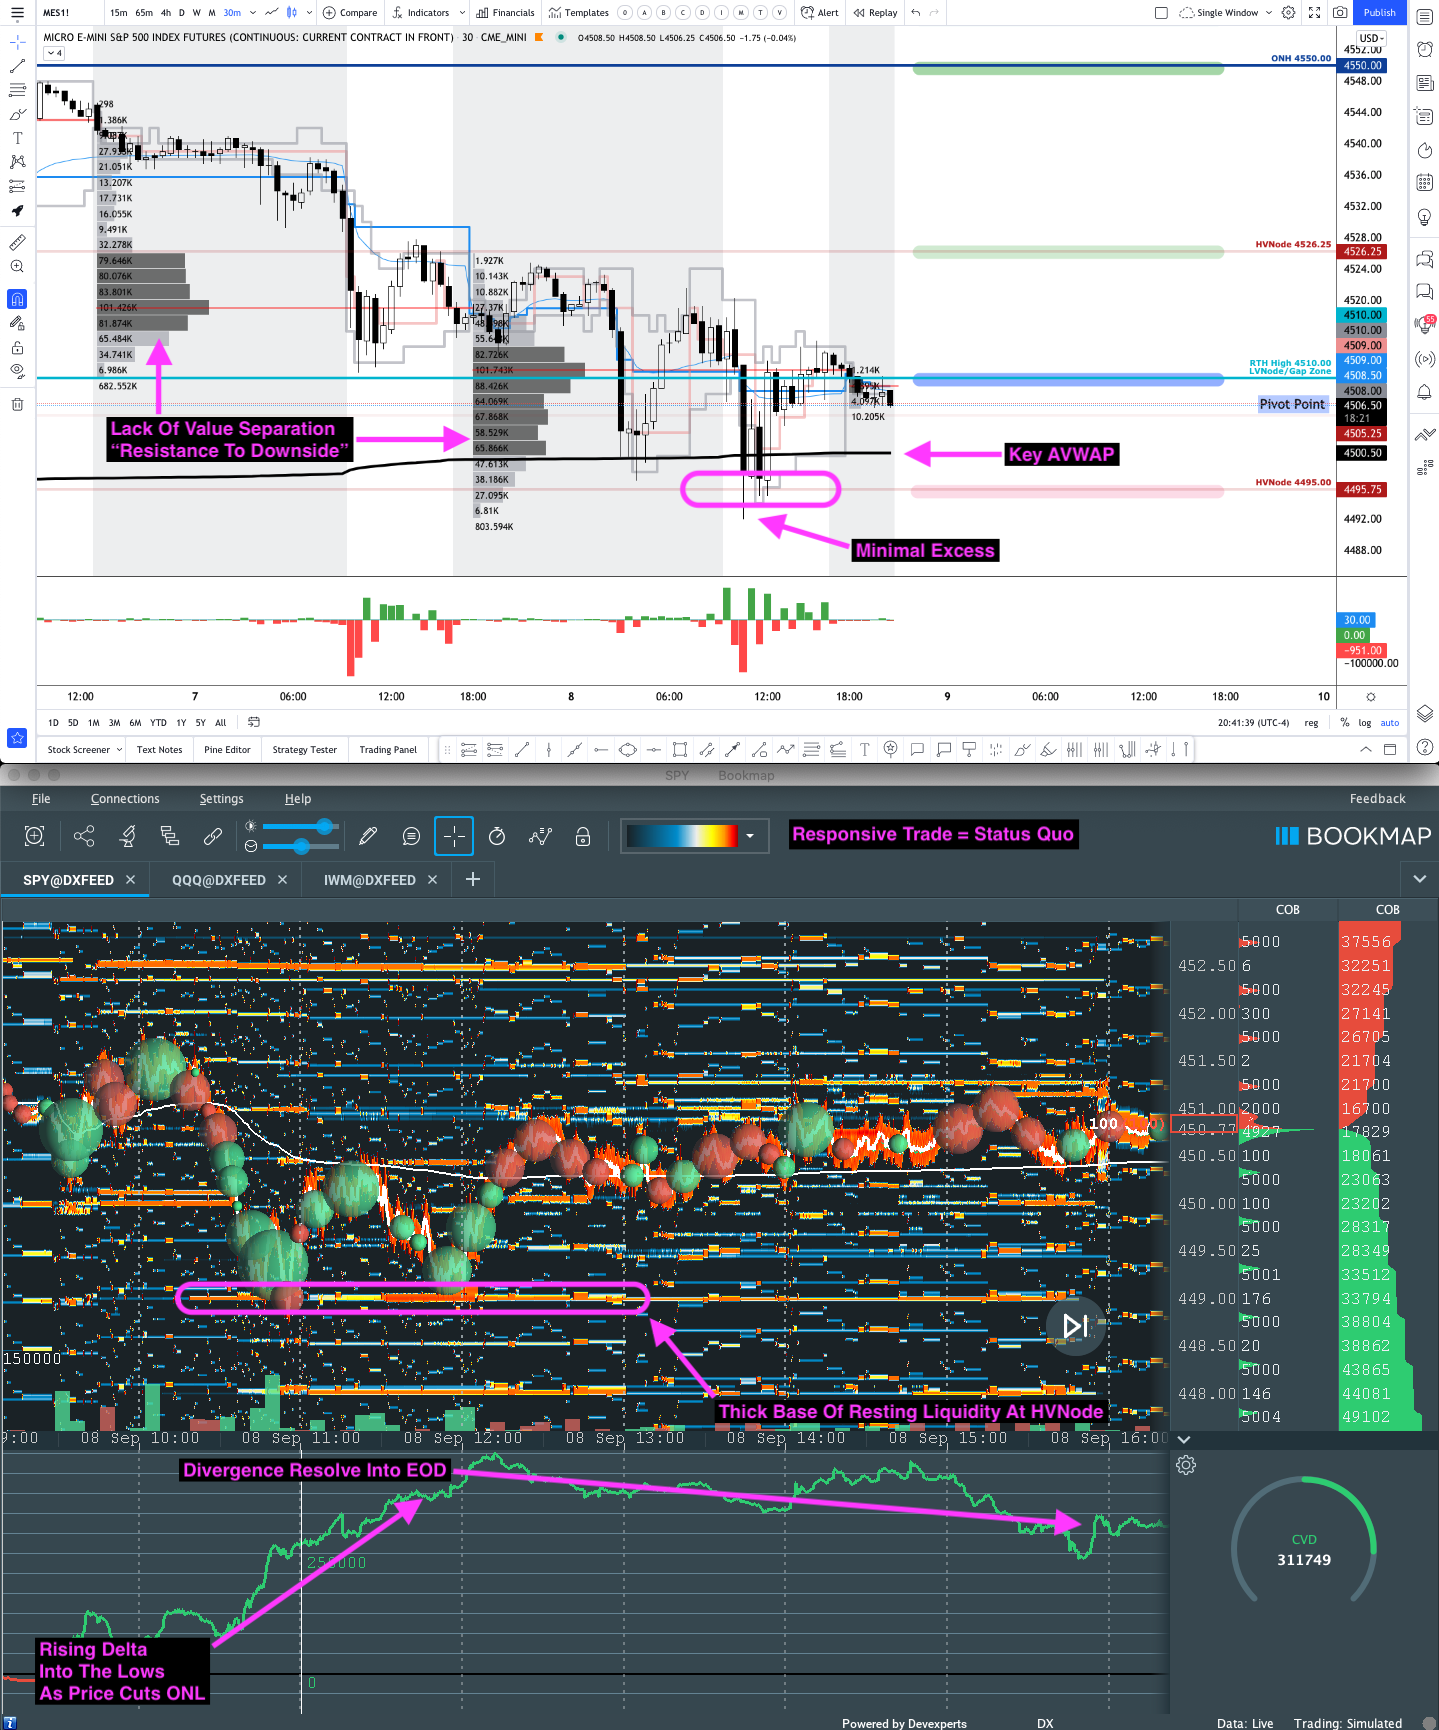
Graphic: 30-minute profile chart of the Micro E-mini S&P 500 Futures and market liquidity, via Bookmap, for the SPDR S&P 500 ETF Trust (NYSE: SPY). Notice the volume delta (CVD) or buying and selling power as calculated by the difference in volume traded at the bid and offer.
Balance-Break Scenarios In Play: A change in the market (i.e., the transition from two-time frame trade, or balance, to one-time frame trade, or trend) has occurred.

Though we expect sideways to lower trade – for the time being – we monitor for rejection (i.e., return inside of balance) which portends a move higher, to the opposite end of the balance.
Further, the aforementioned trade is happening in the context of peak growth and a moderation in the economic recovery, as well as non-seasonally aligned inflows, impactful options market dynamics, divergent sentiment, and fears of a mid-cycle transition.
The implications of these themes on price are contradictory.
To elaborate, Morgan Stanley (NYSE: MS), Citigroup Inc (NYSE: C), and Goldman Sachs Group Inc (NYSE: GS) cautioned investors about equity outlooks. Of concern, in particular, is a rise in cases of the delta variant, tensions between inflation expectations and yields, as well as seasonality.
Among other risks, as SqueezeMetrics summarizes, “[p]eople pretty much stopped buying S&P 500 puts [last] week. At the same time, people are overexposed to changes in VIX, and will be hurt more than usual if VIX starts moving up. Historically, this means SPX down, VIX up.”
Moreover, for today, given an increased potential for moderate volatility and responsive trade, participants may make use of the following frameworks.
In the best case, the S&P 500 trades sideways or higher; activity above the $4,495.00 high volume area (HVNode) pivot puts in play the $4,510.00 low volume area (LVNode). Initiative trade beyond the LVNode could reach as high as the $4,526.25 HVNode and $4,550.00 overnight high (ONH).
In the worst case, the S&P 500 trades lower; activity below the $4,495.00 HVNode puts in play the $4,481.75 HVNode. Initiative trade beyond the $4,481.75 HVNode could reach as low as the $4,454.25 LVNode and $4,427.00 untested point of control (VPOC).
Note the developing volume-weighted average price (VWAP) pinch. VWAP is a metric highly regarded by chief investment officers, among other participants, for quality of trade. Additionally, liquidity algorithms are benchmarked and programmed to buy and sell around VWAPs. We look to buy above a flat/rising VWAP pinch. Sell below a flat/declining VWAP pinch.
Overnight Rally Highs (Lows): Typically, there is a low historical probability associated with overnight rally-highs (lows) ending the upside (downside) discovery process.

Volume Areas: A structurally sound market will build on past areas of high volume. Should the market trend for long periods of time, it will lack sound structure (identified as a low volume area which denotes directional conviction and ought to offer support on any test).

If participants were to auction and find acceptance into areas of prior low volume, then future discovery ought to be volatile and quick as participants look to areas of high volume for favorable entry or exit.

POCs: POCs are valuable as they denote areas where two-sided trade was most prevalent. Participants will respond to future tests of value as they offer favorable entry and exit.
Graphic: 65-minute profile chart of the Micro E-mini S&P 500 Futures updated 6:30 AM ET.
News And Analysis
Traders rush to dump China tech stocks as gaming targeted again.
Decision Guide: The ECB counts risks in setting bond-buying pace.
Aluminum notches fresh 13-year high on supply woes and demand.
China’s zero-COVID approach will aggravate rising corporate risks.
Fauci: We don’t even have “modestly good control” over COVID-19.
Coinbase threat shows there’s a new cryptocurrency sheriff in town.
White House eyeing increased hacking around the coming holidays.
What People Are Saying
1/2 Yes this is still true but old news. Elevated skew has been a major drivers of the Vanna & Charm flows that have pushed us higher in a straight line now for 1.5 years…The world is increasingly worried & hedged. Whether through hedged equity products like JHEQX, structured
Share with at least 1 dose in Europe 🇵🇹 Portugal 86% 🇪🇸 Spain 79% 🇩🇰 Denmark 76% 🇮🇪 Ireland 75% 🇫🇮 Finland 73% 🇧🇪 Belgium 73% 🇫🇷 France 73% 🇮🇹 Italy 72% 🇳🇴 Norway 72% 🇬🇧 UK 71% 🇳🇱 Netherlands 70% 🇸🇪 Sweden 68% 🇩🇪 Germany 65%
Incredibly but actually unsurprisingly, 10 day realized vol on ES is at 6.15 after numerous days doing nothing at ATHs and struggling to make progress.
A >1% daily move already puts it outside the recent norm.
After years of self-education, strategy development, and trial-and-error, Renato Leonard Capelj began trading full-time and founded Physik Invest to detail his methods, research, and performance in the markets.
Additionally, Capelj is a finance and technology reporter. Some of his biggest works include interviews with leaders such as John Chambers, founder and CEO, JC2 Ventures, Kevin O’Leary, businessman and Shark Tank host, Catherine Wood, CEO and CIO, ARK Invest, among others.
Disclaimer
At this time, Physik Invest does not manage outside capital and is not licensed. In no way should the materials herein be construed as advice. Derivatives carry a substantial risk of loss. All content is for informational purposes only.
Abstract: Status quo briefly disrupted after equity index futures traded lower overnight.
Alongside today’s light events calendar, participants ought to be most concerned with positioning risks and calls by large investment banks for cautiousness. A key pivot for today’s trade in the S&P 500 stands at $4,510.00.
Given the expected open, there may be limited potential for immediate directional opportunity.
Equity index futures trade lower with yields, bitcoin, and copper. Gold, oil, bonds, VIX higher.
Big banks revised down growth forecasts.
Ahead: Job openings, Beige Book, credit.
Positioning risks mount case for volatility.
What Happened: U.S. stock index futures auctioned sideways to lower overnight alongside calls by large investment banks for cautiousness amidst outsized risks.
Ahead is data on job openings (10:00 AM ET), Beige Book (2:00 PM ET), and consumer credit (3:00 PM ET).
Graphic updated 6:30 AM ET. Sentiment Neutral if expected /ES open is inside of the prior day’s range. SqueezeMetrics Dark Pool Index (DIX) and Gamma (GEX) calculations are based on where the prior day’s reading falls with respect to the MAX and MIN of all occurrences available. A higher DIX is bullish. At the same time, the lower the GEX, the more (expected) volatility. SHIFT data used for S&P 500 (INDEX: SPX) options activity approximation. Note that options flow is sorted by the call premium spent; if more positive then more was spent on call options. Breadth reflects a reading of the prior day’s NYSE Advance/Decline indicator. VIX reflects a current reading of the CBOE Volatility Index (INDEX: VIX) from 0-100.
What To Expect: As of 6:30 AM ET, Wednesday’s regular session (9:30 AM – 4:00 PM EST) in the S&P 500 will likely open inside of prior-range and -value, suggesting a limited potential for immediate directional opportunity.
Adding, during the prior day’s regular trade, on weak intraday breadth and divergent market liquidity metrics, the worst-case outcome occurred, evidenced by trade to the low end of a recent consolidation area or balance.
Overnight, despite the low end of that balance being briefly pierced, responsive buying surfaced pushing the S&P 500 back into Tuesday’s range.
Balance-Break Scenarios In Play: A change in the market (i.e., the transition from two-time frame trade, or balance, to one-time frame trade, or trend) may occur.

Monitor for acceptance (i.e., more than 1-hour of trade) outside of the balance area. Rejection (i.e., return inside of balance) portends a move to the opposite end of the balance.
Further, the aforementioned trade is happening in the context of peak growth and a moderation in the economic recovery, as well as non-seasonally aligned inflows, impactful options market dynamics, divergent sentiment, and fears of a mid-cycle transition.
The implications of these themes on price are contradictory.
To elaborate, Morgan Stanley (NYSE: MS) and Citigroup Inc (NYSE: C) – in addition to Goldman Sachs Group Inc (NYSE: GS), yesterday – are cautioning investors about equity outlooks. Of concern, in particular, is a rise in cases of the delta variant, tensions between inflation expectations and yields, as well as seasonality.
Among other risks, as SqueezeMetrics summarizes, “[p]eople pretty much stopped buying S&P 500 puts [last] week. At the same time, people are overexposed to changes in VIX, and will be hurt more than usual if VIX starts moving up. Historically, this means SPX down, VIX up.”
Moreover, for today, participants may make use of the following frameworks.
In the best case, the S&P 500 trades sideways or higher; activity above the $4,510.00 regular trade high (RTH High) puts in play $4,526.25, a prominent high volume area (HVNode). Initiative trade beyond the HVNode could reach as high as the $4,550.00 overnight high (ONH) and $4,556.25 Fibonacci extension.
In the worst case, the S&P 500 trades lower; activity below the $4,510.00 RTH High puts in play the $4,495.00 HVNode. Initiative trade beyond the $4,495.00 HVNode could reach as low as the $4,481.75 HVNode and $4,454.25 LVNode.
We note that, as of 6:30 AM ET, prices are back in the most recent consolidation after finding responsive buyers at the overnight low (ONL) which corresponded with an anchored volume-weighted average price (AVWAP), a metric highly regarded by chief investment officers, among other participants, for quality of trade. Additionally, liquidity algorithms are benchmarked and programmed to buy and sell around VWAPs. Losing that ONL changes the tone, obviously.
Overnight Rally Highs (Lows): Typically, there is a low historical probability associated with overnight rally-highs (lows) ending the upside (downside) discovery process.

Volume Areas: A structurally sound market will build on past areas of high volume. Should the market trend for long periods of time, it will lack sound structure (identified as a low volume area which denotes directional conviction and ought to offer support on any test).

If participants were to auction and find acceptance into areas of prior low volume, then future discovery ought to be volatile and quick as participants look to areas of high volume for favorable entry or exit.
Graphic: 65-minute profile chart of the Micro E-mini S&P 500 Futures updated 6:15 AM ET.
News And Analysis
Ray Dalio says China opportunities can’t be neglected.
Delta variant is slowing reversal of some rating actions.
Rates stagnate; mortgage demand at lowest in months.
Investors should watch closely for peak in profit margin.
Weak jobs data could derail Fed’s bond tapering plans.
Coinbase fell after SEC plans to sue over new product.
Global mobility near post-pandemic high despite delta.
U.S. hits 75% of adults with at least one vaccine dose.
Evergrande dollar bonds fall after suspended payment.
What People Are Saying
could be an interesting time for put calendar spreads, shorting this week and long post FOMC ie selling Sep 10th to buy Sep 30th
Almost every successful quant I know experiences this.
You battle night and day, learn every possible form of applied mathematics there is, fail thousands of times…. only to come back full circle and realize, the simpler the better. https://t.co/PVrvCdJDZf
After years of self-education, strategy development, and trial-and-error, Renato Leonard Capelj began trading full-time and founded Physik Invest to detail his methods, research, and performance in the markets.
Additionally, Capelj is a finance and technology reporter. Some of his biggest works include interviews with leaders such as John Chambers, founder and CEO, JC2 Ventures, Kevin O’Leary, businessman and Shark Tank host, Catherine Wood, CEO and CIO, ARK Invest, among others.
Disclaimer
At this time, Physik Invest does not manage outside capital and is not licensed. In no way should the materials herein be construed as advice. Derivatives carry a substantial risk of loss. All content is for informational purposes only.
Equity index futures traded sideways to lower, in line with most commodities and bonds. Yields, the dollar, and VIX were higher.
Goldman revised down growth forecasts.
Ahead: Light calendar to base decisions.
Positioning risks mount case for volatility.
What Happened: U.S. stock index futures traded sideways to lower coming into this shortened week.
Ahead is no data of interest.
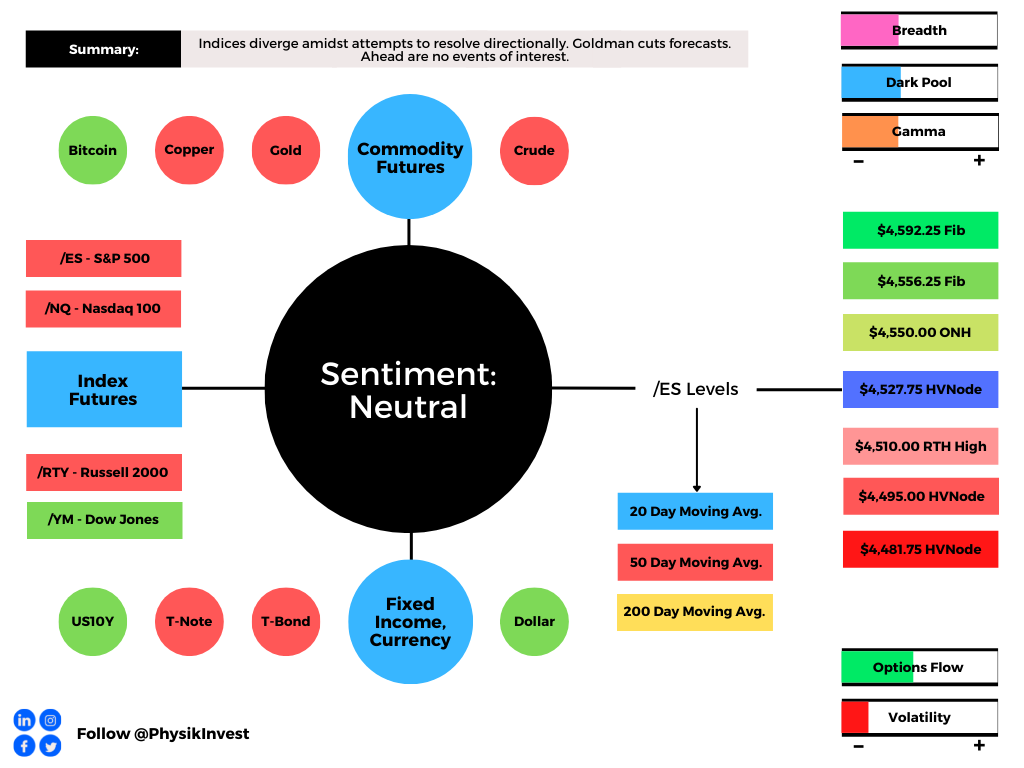
Graphic updated 6:15 AM ET. Sentiment Neutral if expected /ES open is inside of the prior day’s range. SqueezeMetrics Dark Pool Index (DIX) and Gamma (GEX) calculations are based on where the prior day’s reading falls with respect to the MAX and MIN of all occurrences available. A higher DIX is bullish. At the same time, the lower the GEX, the more (expected) volatility. SHIFT data used for S&P 500 (INDEX: SPX) options activity approximation. Note that options flow is sorted by the call premium spent; if more positive then more was spent on call options. Breadth reflects a reading of the prior day’s NYSE Advance/Decline indicator. VIX reflects a current reading of the CBOE Volatility Index (INDEX: VIX) from 0-100.
What To Expect: As of 6:15 AM ET, Tuesday’s regular session (9:30 AM – 4:00 PM EST) in the S&P 500 will likely open inside of prior-range and -value, suggesting a limited potential for immediate directional opportunity.
Adding, during Friday’s regular trade, on lackluster intraday breadth and market liquidity metrics, the best case outcome occurred, evidenced by sideways trade above $4,527.75, a prominent high volume area.
This is significant because sideways to higher trade (i.e., balance) marks acceptance, or a willingness to transact at higher prices after a v-pattern recovery, above the key 50-day simple moving average.
Balance (Two-Timeframe Or Bracket) Is The Status Quo: Rotational trade that denotes current prices offer favorable entry and exit. Balance-areas make it easy to spot a change in the market (i.e., the transition from two-time frame trade, or balance, to one-time frame trade, or trend).

Modus operandi is responsive trade (i.e., fade the edges), rather than initiative trade (i.e., play the break).

V-Pattern: A pattern that forms after a market establishes a high, retests some support, and then breaks above said high. In most cases, this pattern portends continuation.
Graphic: S&P 500 maintaining prices above the 50-day simple moving average. This moving average can be looked at as a key dynamic level on any move lower. Losing that particular level likely changes the tone.
Further, the aforementioned trade is happening in the context of peak growth and a moderation in the economic recovery, as well as non-seasonally aligned inflows, impactful options market dynamics, divergent sentiment, and fears of a mid-cycle transition.
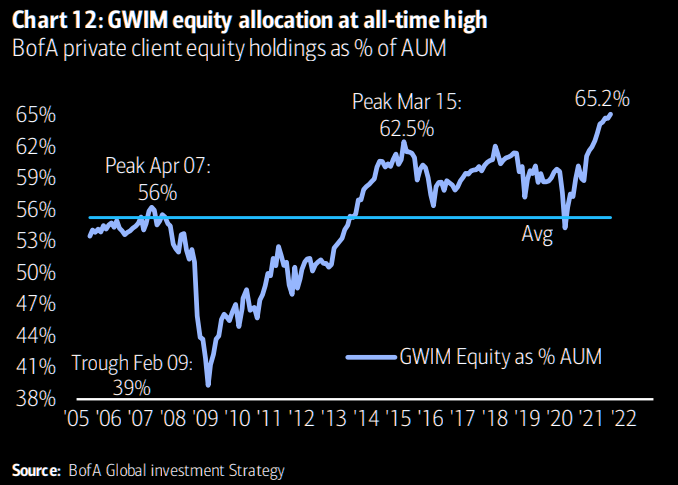
Graphic: Bank of America Corporation (NYSE: BAC) graphic via The Market Ear. All-time highs in the equity markets alongside all-time high equity allocations.
The implications of these themes on price are contradictory.
That’s according to Goldman Sachs Group Inc (NYSE: GS) economists who revised lower their forecast for growth in the U.S. economy citing the COVID-19 delta variant, fading fiscal support, supply chain disruptions, and a switch in demand to services.
“The hurdle for strong consumption growth going forward appears much higher: the Delta variant is already weighing on Q3 growth, and fading fiscal stimulus and a slower service-sector recovery will both be headwinds in the medium term,” said Goldman Sachs’ Ronnie Walker.
Among other risks include fragility with respect to “the current combination of weak put flows and large customer vanna exposure” which, according to SqueezeMetrics, puts us “a hair’s breadth away from some of the most consistently bearish and volatile behavior in the S&P 500.”
In simpler terms, as SqueezeMetrics summarizes, “[p]eople pretty much stopped buying S&P 500 puts [last] week. At the same time, people are overexposed to changes in VIX, and will be hurt more than usual if VIX starts moving up. Historically, this means SPX down, VIX up.”
I also encourage a read of the Weekly Brief for Saturday, September 4, which covered some market risks ahead.
Given the big picture context (i.e., status quo – higher prices – in the face of volatility risks) participants may make use of the following frameworks.
In the best case, the S&P 500 trades sideways or higher; activity above the $4,527.75 high volume area (HVNode) pivot puts in play the $4,550.00 overnight high (ONH). Initiative trade beyond the ONH could reach as high as the Fibonacci extensions at $4,556.25 and $4,592.25.
In the worst case, the S&P 500 trades lower; activity below the $4,527.75 HVNode puts in play the $4,510.00 regular trade high (RTH High). Initiative trade beyond the RTH High could reach as low as the $4,495.00 and $4,481.75 HVNodes.
Overnight Rally Highs (Lows): Typically, there is a low historical probability associated with overnight rally-highs (lows) ending the upside (downside) discovery process.

Volume Areas: A structurally sound market will build on past areas of high volume. Should the market trend for long periods of time, it will lack sound structure (identified as a low volume area which denotes directional conviction and ought to offer support on any test).

If participants were to auction and find acceptance into areas of prior low volume, then future discovery ought to be volatile and quick as participants look to areas of high volume for favorable entry or exit.
Graphic: 65-minute profile chart of the Micro E-mini S&P 500 Futures updated 6:15 AM ET.
News And Analysis
Soros calls BlackRock China investment a tragic mistake.
GM reshuffling production plans as chip shortage persists.
London taking aim at New York with 5-year financial plan.
TP ICAP slams work from home as it hampers risk-taking.
Global growth rebound solidifies while risks broaden away.
Deutsche Telekom grows bet on U.S. with SoftBank deal.
Bitcoin facing big test as El Salvador makes it legal tender.
Facebook admits “trust deficit” as it looks to launch wallet.
Without help for oil producers, net-zero is a distant dream.
What People Are Saying
Drake has been aggressively investing in tech, real estate & gaming over the last few years. Examples:
This is my long-term view on $BTCUSD. Monthly scale price chart. "IF" April-June period was a pullback and it is over. The rebound that is taking place since July should not stall here.
In other words, bulls need to be more aggressive pushing the September candle to all-time. pic.twitter.com/s0PrsOKLRX
🚘 What do windshields have to do with #trading?@FuturesTrader71 explains "your goal as a trader, is to recognize when the windshield is too dirty to see what's in front of you – to see what the market is saying"
After years of self-education, strategy development, and trial-and-error, Renato Leonard Capelj began trading full-time and founded Physik Invest to detail his methods, research, and performance in the markets.
Additionally, Capelj is a finance and technology reporter. Some of his biggest works include interviews with leaders such as John Chambers, founder and CEO, JC2 Ventures, Kevin O’Leary, businessman and Shark Tank host, Catherine Wood, CEO and CIO, ARK Invest, among others.
Disclaimer
At this time, Physik Invest does not manage outside capital and is not licensed. In no way should the materials herein be construed as advice. Derivatives carry a substantial risk of loss. All content is for informational purposes only.
Editor’s Note: Before getting into today’s commentary, we take a moment to reflect on the following quote taken from page 123 of The Disciplined Traderby Mark Douglas.
“For years, many people in the academic community believed that the markets were random; this is a perfect example of their general lack of understanding of human nature. People act as a force on prices in perfectly logical ways, when you understand the logic of their fears.”
Also, given Labor Day, markets are closed Monday, September 6. As a result, Daily Briefs will resume Tuesday, September 7. Thank you and have a great extended weekend!
Equity index futures traded sideways to higher last week.
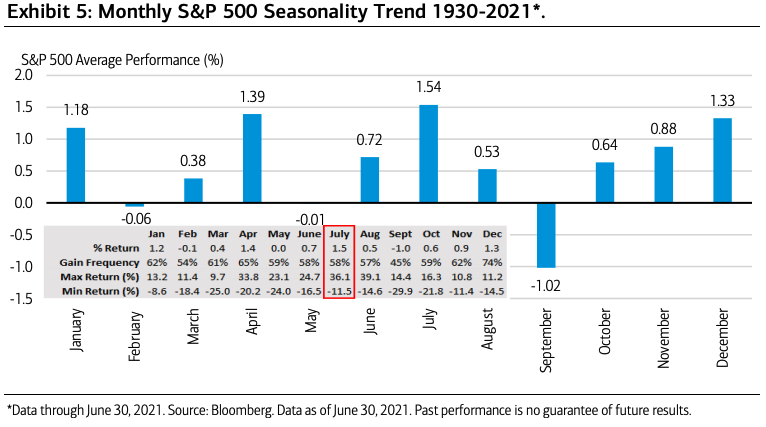
Reality throwing a wrench in seasonality.
Ahead: Light calendar to base decisions.
Equity indices rising; SPX above 50-day.
Positioning risks mount case for volatility.
A couple trade ideas for the week ahead.
What Happened: U.S. stock index futures auctioned mostly sideways to higher, into Friday’s nonfarm payrolls miss.
Next week participants have a light calendar to base decisions around.
Graphic updated 10:30 AM ET 9/4/2021. Sentiment Neutral if expected /ES open is inside of the prior day’s range. SqueezeMetrics Dark Pool Index (DIX) and Gamma (GEX) calculations are based on where the prior day’s reading falls with respect to the MAX and MIN of all occurrences available. A higher DIX is bullish. At the same time, the lower the GEX, the more (expected) volatility. SHIFT data used for S&P 500 (INDEX: SPX) options activity approximation. Note that options flow is sorted by the call premium spent; if more positive then more was spent on call options. Breadth reflects a reading of the prior day’s NYSE Advance/Decline indicator. VIX reflects a current reading of the CBOE Volatility Index (INDEX: VIX) from 0-100.
What To Expect: During the prior week’s trade, on mostly lackluster intraday breadth and market liquidity metrics, the best case outcome occurred, evidenced by new all-time highs in the S&P 500 and Nasdaq 100.
This is significant because the sideways to higher trade marks acceptance, or a willingness to transact at higher prices after a v-pattern recovery, above the key 50-day simple moving average.
V-Pattern: A pattern that forms after a market establishes a high, retests some support, and then breaks above said high. In most cases, this pattern portends continuation.
Graphic: S&P 500 maintaining prices above the 50-day simple moving average. This moving average can be looked at as a key dynamic level on any move lower. Losing that particular level likely changes the tone.
Further, the aforementioned trade is happening in the context of peak growth and a moderation in the economic recovery, as well as non-seasonally aligned inflows, impactful options market dynamics, divergent sentiment, and fears of a mid-cycle transition.
The implications of these themes on price are contradictory.
To elaborate, August, over the past 25 years, has historically been the largest month for equity outflows. According to Goldman Sachs Group Inc’s (NYSE: GS) Scott Rubner, “We have seen none of these outflows and it has been buying the dip (TINA).”
Given this divergence from the norm, advances are not “welcomed and may lead to a quick right tail hedging … [as] option volume notional is 120% of stock volume notional.”
To put it simply, an increased share of options being traded expires within two weeks. The hedging of these directionally sensitive options can represent an increased share of volume in underlying stocks.
As a result, option flows impact the underlying’s price, markedly.
We couple this so-called right-tail hedging with the structural positioning – the so-called wall of worry – that can drive the market through three factors – change in the underlying price (gamma), implied volatility (vanna), and time (charm) – that are well known to impact an options exposure to directional risk or delta.
“Charm is a major driver for support in the markets,” said Cem Karsan of Kai Volatility Advisors. “All of that support is leading up to and accelerating into that Monday-Wednesday window” ahead of options expiration (OPEX). “And then the window really opens for lack of support. It’s not like there’s a bunch of selling all of a sudden. It’s a window of non-strength; a lack of these supportive flows that have been there prior.”
Graphic: @pat_hennessy breaks down returns for the S&P 500, categorized by the week relative to OPEX. Based on his analysis, Pat sees that the “2 weeks prior to OPEX (e.g., 7/30/21 to 8/6/21 in this late-cycle) [have] been extremely bullish.”
With the August monthly OPEX behind us, the focus shifts now to September. At and around the same time, Morgan Stanley’s (NYSE: MS) Michael Wilson expects a formal signal (which would align with Karsan’s window of non-strength) on the taper of asset purchases, that could lead to a mid-cycle transition and possibly an S&P 500 correction.
“Assuming a stable equity risk premium at 345bp, P/Es would fall to 19x, or 10% lower.”
Graphic: @pat_hennessy breaks down S&P 500 OPEX returns. Pat sees that “OPEX week returns peaked in 2016 and have trended lower since.”
Adding, the eventual reduction in the Federal Reserve’s balance sheet – a removal of liquidity – may exacerbate any sort of risk-off scenario in which participants try to get ahead of whatever cascading reaction may come with a taper.
As Karsan explains: “It’s not a coincidence that the mid-February to mid-March 2020 downturn literally started the day after February expiration and ended the day of March quarterly expiration. These derivatives are incredibly embedded in how the tail reacts and there’s not enough liquidity, given the leverage, if the Fed were to taper.”
SpotGamma – in a September 2, 2021 note – echoed the possibility of volatility; “markets are fast approaching a window of volatility which could produce some pretty sharp volatility: 9/15 VIX expiration, 9/17 Quarterly OPEX and the 9/22 FOMC. This lineup is particularly interesting as we believe that expiration leads to a pickup in volatility – however, traders may hold the pause button on selling that volatility due to the FOMC. This could catch less sophisticated vol sellers off guard and lead to some exacerbated volatility.”
Others, like SqueezeMetrics – which sees “the current combination of weak put flows and large customer vanna exposure” as fragile – suggest that volatility risks have risen, too.
Given the big picture context (i.e., status quo – higher prices – in the face of volatility risks) participants may make use of the following frameworks.
In the best case, the S&P 500 trades sideways or higher; activity above the $4,527.75 high volume area (HVNode) pivot puts in play the $4,550.00 overnight high (ONH). Initiative trade beyond the ONH could reach as high as the Fibonacci extensions at $4,556.25 and $4,592.25.
In the worst case, the S&P 500 trades lower; activity below the $4,527.75 HVNode puts in play the $4,510.00 regular trade high (RTH High). Initiative trade beyond the RTH High could reach as low as the $4,495.00 and $4,481.75 HVNodes.
Overnight Rally Highs (Lows): Typically, there is a low historical probability associated with overnight rally-highs (lows) ending the upside (downside) discovery process.

Volume Areas: A structurally sound market will build on past areas of high volume. Should the market trend for long periods of time, it will lack sound structure (identified as a low volume area which denotes directional conviction and ought to offer support on any test).

If participants were to auction and find acceptance into areas of prior low volume, then future discovery ought to be volatile and quick as participants look to areas of high volume for favorable entry or exit.
Graphic: 65-minute profile chart of the Micro E-mini S&P 500 Futures updated 10:30 AM ET 9/4/2021.
Weekly Trade Ideas
Please Note: In no way is the below a trade recommendation. Derivatives carry a substantial risk of loss. All content is for informational purposes only.
Options offer an efficient way to gain directional exposure.
If an option buyer was short (long) stock, he or she could buy a call (put) to hedge upside (downside) exposure. Additionally, one can spread, or buy (+) and sell (-) options together, strategically.
Commonly discussed spreads include credit, debit, ratio, back, and calendar.
Credit: Sell -1 option closer to the money. Buy +1 option farther out of the money.
Debit: Buy +1 option closer to the money. Sell -1 option farther out of the money.
Ratio: Buy +1 option closer to the money. Sell -2 options farther out of the money.
Back: Sell -1 option closer to the money. Buy +2 options farther out of the money.
Calendar: Sell -1 option. Buy +1 option farther out in time, at the same strike.
Typically, if bullish (bearish), sell at-the-money put (call) credit spread and/or buy a call (put) debit/ratio spread structured around target price. Alternatively, if the expected directional move is great (small), opt for a back spread (calendar spread). Also, if credit spread, capture 50-75% of the premium collected. If debit spread, capture 2-300% of the premium paid.
Be cognizant of risk exposure to direction (delta), time (theta), and volatility (vega).
Negative (positive) delta = synthetic short (long).
Negative (positive) theta = time decay hurts (helps).
Trade Idea 1: SELL -1 1/2 BACKRATIO GOOGL 100 17 SEP 21 2770/2670 PUT @.15 LMT
I’m neutral on Alphabet Inc and I think the stock may travel sideways to lower over the next couple of weeks, toward $2,770.00, or the volume-weighted average price anchored from the July 28 gap. I will structure a spread below the current stock price, expiring in 2 weeks. I will buy the 2770 put option once (+1) and sell the 2670 put option twice (-2) for a $0.15 credit. Should the stock not move to my target, I keep the $15 credit. Should it move to $2,670.00 I could make $10,015.00 at expiry. Should the stock move past $2,570.00 or so, I may incur unlimited losses. My goal, with this spread, is to capture the initial credit and close for additional credit if the stock moves lower.
If necessary, I will hedge the position by either (A) selling stock, (B) widening strikes, (C) buying a far out-of-the-money put option to cap downside in case of an unpredictable move lower, or (D) roll strikes down in price and out in time.
Trade Idea 2: SELL -1 1/2 BACKRATIO SPX 100 (Weeklys) 10 SEP 21 4480/4430 PUT @.25 LMT
I’m neutral on the S&P 500 and I think the index may travel sideways to lower over the next week, toward its key moving averages. I will structure a spread below the current index price, expiring in 2 weeks. I will buy the 4480 put option once (+1) and sell the 4430 put option twice (-2) for a $0.25 credit. Should the index not move to my target, I keep the $25 credit. Should it move to $4,430.00, past the 20-day simple moving average, I could make $5,025.00 at expiry. Should the index move past $4,380.00 or so, beyond the 50-day simple moving average, I may incur unlimited losses. My goal, with this spread, is to capture the initial credit and close for additional credit if the index moves lower.
If necessary, I will hedge the position by either (A) selling futures, (B) widening strikes, (C) buying a far out-of-the-money put option to cap downside in case of an unpredictable move lower, or (D) roll strikes down in price and out in time.
News And Analysis
Moody’s Weekly Market Outlook on Ida, gas, and inflation.
Reinventing tail risk: a fresh look at market crash protection.
Kansas City Southern mulls $27B CP Rail bid after ruling.
ARK Invest on commodities, innovation, economic signals.
Taliban relies on financing from China following withdrawal.
Hedge Funds cut exposure to stocks that count on China.
Three hours a week: China has put limits on video gaming.
Global gas prices threatening to dent economic recovery.
Are Treasuries in a cautious stance as debt story unfolds?
Could the macro theme/picture be an edge for day traders?
George Soros: Investors in China face a rude awakening.
400,000 homeowners enter the final month in forbearance.
Let’s Hang Out
Los Angeles, CA September 10-12
Salt Lake City, UT September 28-30
About
After years of self-education, strategy development, and trial-and-error, Renato Leonard Capelj began trading full-time and founded Physik Invest to detail his methods, research, and performance in the markets.
Additionally, Capelj is a finance and technology reporter. Some of his biggest works include interviews with leaders such as John Chambers, founder and CEO, JC2 Ventures, Kevin O’Leary, businessman and Shark Tank host, Catherine Wood, CEO and CIO, ARK Invest, among others.
Disclaimer
At this time, Physik Invest does not manage outside capital and is not licensed. In no way should the materials herein be construed as advice. Derivatives carry a substantial risk of loss. All content is for informational purposes only.
Equity index futures, VIX sideways to higher. Commodities, bonds, dollar lower.
Ahead: Home prices, PMI, and more.
The path of least resistance is higher.
What Happened: U.S. stock index futures auctioned sideways to higher overnight alongside an absence in fundamental catalysts.
Ahead is data on the Case-Shiller national home price index (9:00 AM ET), Chicago PMI (9:45 AM ET), and consumer confidence index (10:00 AM ET).
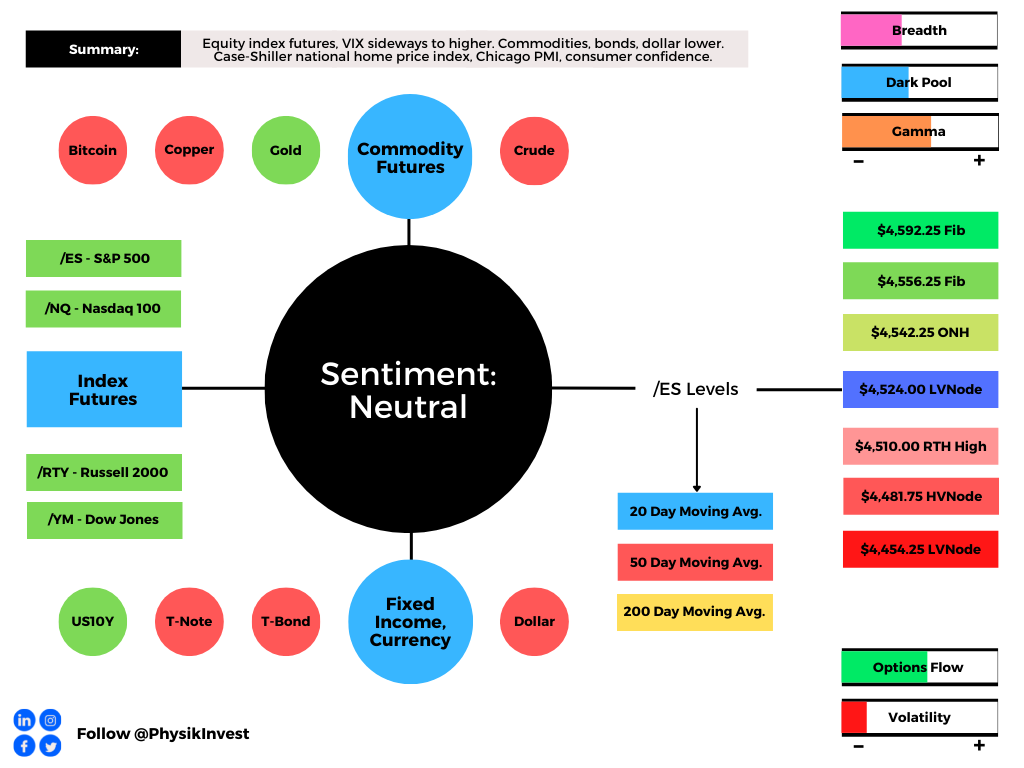
Graphic updated 6:30 AM ET. Sentiment Neutral if expected /ES open is inside of the prior day’s range. SqueezeMetrics Dark Pool Index (DIX) and Gamma (GEX) calculations are based on where the prior day’s reading falls with respect to the MAX and MIN of all occurrences available. A higher DIX is bullish. At the same time, the lower the GEX, the more (expected) volatility. SHIFT data used for S&P 500 (INDEX: SPX) options activity approximation. Note that options flow is sorted by the call premium spent; if more positive then more was spent on call options. Breadth reflects a reading of the prior day’s NYSE Advance/Decline indicator. VIX reflects a current reading of the CBOE Volatility Index (INDEX: VIX) from 0-100.
What To Expect: As of 6:30 AM ET, Tuesday’s regular session (9:30 AM – 4:00 PM EST) in the S&P 500 will likely open inside of prior-range and -value, suggesting a limited potential for immediate directional opportunity.
Adding, during the prior day’s regular trade, on weak intraday breadth and middling market liquidity metrics, the best case outcome occurred, evidenced by further price discovery.
Price Discovery (One-Timeframe Or Trend): Market seeking new prices to establish value, or acceptance (i.e., more than 30-minutes of trade at a particular price level).
Despite the low volume, p-shaped profile structures (which denote short covering), and a lack of intraday range expansion, the aforementioned trade is significant because it suggests continued bullishness after a v-pattern recovery.
V-Pattern: A pattern that forms after a market establishes a high, retests some support, and then breaks above said high. In most cases, this pattern portends continuation.
Further, the aforementioned trade is happening in the context of non-seasonally aligned inflows, impactful options market dynamics, divergent sentiment, and fears of a mid-cycle transition.
The implications of these themes on price are contradictory; to elaborate, on one hand, August, over the past 25 years, has historically been the largest month for equity outflows. According toGoldman Sachs Group Inc’s (NYSE: GS) Scott Rubner, “We have seen none of these outflows and it has been buying the dip (TINA).”
Given this divergence from the norm, an advance (such as the one we’re in presently) is not “welcomed and may lead to a quick right tail edging … [as] option volume notional is 120% of stock volume notional.”
To put it simply, 75% of the options being traded expire within two weeks. The related hedging flows of these directionally sensitive options can represent an increased share of volume in underlying stocks.
To put it simply, option flows impact the underlying’s price, markedly.
We couple this so-called right-tail hedging with the structural positioning that drives the market through the three factors – the change in the underlying price (gamma), implied volatility (vanna), and time (charm) – that are well known to impact an options exposure to directional risk or delta.
“Charm is a major driver for support in the markets,” said Cem Karsan of Kai Volatility Advisors. “All of that support is leading up to and accelerating into that Monday-Wednesday window” ahead of OpEx. “And then the window really opens for lack of support. It’s not like there’s a bunch of selling all of a sudden. It’s a window of non-strength; a lack of these supportive flows that have been there prior.”
The old heuristic is that opex tends to be bullish for equities, but that hasn't been the case for quite some time. Here's the rolling 3 year average returns of $SPX broken down by the week relative to opex. Notice how opex week returns peaked in 2016 and have trended lower since pic.twitter.com/eRZLZdiaPm
With the August monthly options expiration (OPEX) behind, the focus shifts to September, at and around the same time Morgan Stanley’s (NYSE: MS) Michael Wilson expects a formal signal – which would align with Karsan’s window of non-strength – on the taper of asset purchases, leading to a mid-cycle transition and 10% S&P 500 correction.
Options Expiration (OPEX): Option expiries mark an end to pinning (i.e, the theory that market makers and institutions short options move stocks to the point where the greatest dollar value of contracts will expire worthless) and the reduction dealer gamma exposure.
“Assuming a stable equity risk premium at 345bp, P/Es would fall to 19x, or 10% lower.”
Graphic: Morgan Stanley unpacks mid-cycle transition thesis. Image retrieved from ZeroHedge.
Moreover, for today, participants may make use of the following frameworks.
In the best case, the S&P 500 trades sideways or higher; activity above the $4,524.00 low volume area (LVNode) pivot puts in play the $4,542.25 overnight high (ONH). Initiative trade beyond the ONH could reach as high as the $4,556.25 and $4,592.25 Fibonacci extensions.
In the worst case, the S&P 500 trades lower; activity below the $4,524.00 LVNode puts in play $4,510.00, the convergence of a regular-trade high and LVNode. Initiative trade beyond the $4,510.00 figure could reach as low as the $4,481.75 high volume area (HVNode) and $4,454.25 LVNode.
To note, the $4,454.25 LVNode corresponds with an anchored volume-weighted average price (VWAP), a metric highly regarded by chief investment officers, among other participants, for quality of trade. Additionally, liquidity algorithms are benchmarked and programmed to buy and sell around VWAPs.
Overnight Rally Highs (Lows): Typically, there is a low historical probability associated with overnight rally-highs (lows) ending the upside (downside) discovery process.

Volume Areas: A structurally sound market will build on past areas of high volume. Should the market trend for long periods of time, it will lack sound structure (identified as a low volume area which denotes directional conviction and ought to offer support on any test).

If participants were to auction and find acceptance into areas of prior low volume, then future discovery ought to be volatile and quick as participants look to areas of high volume for favorable entry or exit.
Graphic: 65-minute profile chart of the Micro E-mini S&P 500 Futures updated 6:30 AM ET.
News And Analysis
Inventories continue to constrain home purchase activity.
The Fed now risking too-slow taper after too-fast in 2013.
A fast lane for the ECB to taper purchases ahead of Fed.
OPEC+ faces mixed market signals after U.S. pressures.
Capital raises from infotech sector simmering down July.
Fitch Ratings unpacks commodities and energy research.
Battery storage capacity likely to double inside California.
Moderna creates twice as many antibodies as Pfizer vax.
What People Are Saying
The kink in the 1W tenor due to all the degenerates that emerged due to the meme mania earlier this year haha https://t.co/Kkb2UvcQCk
1/x I’ve been traveling abroad for meetings, so just a few small 🥐crumbs this AM…& no 🥐this Wed. 👀4508*** after Resistance @ 4534.75, carefully this AM, as weak new highs w/out follow thru can often lead to unwinds. But🕰’s not a🐻friend, & it’s now or never if🐻are to try & pic.twitter.com/VbC2yRaL2M
The 'EVERYTHING RALLY' is now the longest on record! The average Sharpe ratio across the spectrum of assets has been above 1-to-1 for 270 straight trading days.
Such tightly packed risk-adjusted returns have only occurred ahead of the onset of tightening cycles (2004 and 2015). pic.twitter.com/6eaNRS8R83
After years of self-education, strategy development, and trial-and-error, Renato Leonard Capelj began trading full-time and founded Physik Invest to detail his methods, research, and performance in the markets.
Additionally, Capelj is a finance and technology reporter. Some of his biggest works include interviews with leaders such as John Chambers, founder and CEO, JC2 Ventures, Kevin O’Leary, businessman and Shark Tank host, Catherine Wood, CEO and CIO, ARK Invest, among others.
Disclaimer
At this time, Physik Invest does not manage outside capital and is not licensed. In no way should the materials herein be construed as advice. Derivatives carry a substantial risk of loss. All content is for informational purposes only.
Editor’s Note: On Thursday (8/5) and Friday (8/6) there will be no Daily Brief newsletter. Additionally, there will be no Weekly Brief Sunday (8/8), either. All commentaries to resume August 9, 2021.
If in the Miami, Florida area please contact renato@physikinvest.com if interested in connecting over markets, fintech, and the like.
PS: Added a new “Weekly Trade Ideas” section. Hope it provides added value!
Regards,
Renato Leonard Capelj
Market Commentary
Key Takeaways: Equity index futures to start the week off neutral, in prior-range and -value.
Debt limit, China, fiscal policy cloud outlook.
Expecting a heavy week for economic data.
Responsive trade until key levels are taken.
Amazon Inc (NASDAQ: AMZN) trade ideas.
What Happened: With respect to hot topic market risks, the week prior offered a ton of information to add to our narrative. We list for clarity.
Debt Limit: The August 1 reinstatement of the U.S. debt limit may have severe consequences, increasing the odds of a rating downgrade on government debt.
Monetary: Come September, participants will likely receive increased clarity over taper timelines with an official start early next year. Adding, Chairman Jerome Powell expressed inflation as temporary and the committee announced the creation of a pair of standing facilities to strengthen its ability to be the lender of last resort in the repo market.
China: Cross-asset volatility in China worsened, prompting talk of a yuan devaluation. A devaluation is something to fear; to note, The People’s Bank of China (PBOC) roiled global equity markets after its 2015 yuan devaluation.
Growth: U.S. economic data came in weaker suggesting growth likely peaked. Notwithstanding, consumer confidence improved markedly with sentiment recovering fully. Moody’s strategists look for real GDP to rise 6.7% this year, a downward revision on some fiscal policy assumptions.
Fiscal: Lawmakers debate another round of stimulus to ensure the strong long-term growth of lower- and middle-income households. The proposed legislation is receiving pushback with respect to its impact on inflation and taxes. Moody’s strategists note “higher taxes will weigh on economic growth, but the impact on the economy from the higher proposed taxes will be small.”
Pandemic: COVID-19 variants are a cause for concern – especially with respect to the Federal Reserve’s tapering of quantitative easing – but hospitalization ratios and mobility metrics suggest the crisis is likely over. In other areas, the CDC’s rental eviction moratorium and FHFA’s foreclosure moratorium expired with forbearance on government-backed mortgages and student loans ending September, also.
Yields: Technical factors – issuance, short coverings, a fading reflation trade, and peak growth – are to blame for lower Treasury yields. A longer-term deviation from the implied “economic fair value” of 1.6% and 1.65% for the 10-year yield would suggest other forces are driving long-term interest rates.
Earnings: Year-over-year profit growth of S&P 500 constituents stands at 85% with 88% of companies beating estimates for revenue and profit, according to Business Insider.
Positioning: According to one Bank of America Corporation (NYSE: BAC) comment, highlighted by The Market Ear, “The average recovery time following 2-sigma one-day S&P declines has shortened significantly post-GFC, reaching an all-time low this year.” This has a lot to do with the inventory positioning of participants; volatility is oversupplied and associated heading forces make it so there is more liquidity and less movement. Should the market unpin, there’s “not enough liquidity” to absorb leverage on the tails.
Putting it all together, Goldman Sachs Group Inc (NYSE: GS) believes “[e]xpectations of higher interest rates and higher corporate tax rates by year-end are the primary reasons [to] forecast that the S&P 500 will trade sideways,” into end-of-year.
What To Expect: The S&P 500, Nasdaq 100, and Dow Jones Industrial Average are above their key 20-, 50-, and 200-week moving averages while the Russell 2000 is stuck inside a multi-month trading range, between its 20- and 50-week moving averages.
Given the higher long-term trend, traders of the S&P 500, in particular, must contend with a week-long balance area, the result of participants finding higher prices valuable as they position themselves for a directional move, given increased clarity on earnings, taper, and more.
Balance (Two-Timeframe Or Bracket): Rotational trade that denotes current prices offer favorable entry and exit. Balance-areas make it easy to spot a change in the market (i.e., the transition from two-time frame trade, or balance, to one-time frame trade, or trend).
In the coming sessions, given that the modus operandi is responsive trade (i.e., fade the edges), rather than initiative trade (i.e., play the break), participants will want to focus their attention on where the S&P 500 trades in relation to the $4,392.25 high volume area (HVNode) pivot.
In the best case, the S&P 500 trades sideways or higher; activity above the $4,392.25 HVNode pivot puts in play the $4,406.25 low volume area (LVNode) and $4,419.00 untested point of control (VPOC). Initiative trade beyond the VPOC portends a potential breakout above the $4,422.75 minimal excess high, up to the $4,428.25 Fibonacci extension.
In the worst case, the S&P 500 trades lower; activity below the $4,392.25 HVNode pivot puts in play the $4,381.75 LVNode. Initiative trade beyond the LVNode portends a potential breakdown below the $4,370.50 minimal excess low, down to the $4,353.00 VPOC and $4,341.75 micro-composite point of control (MCPOC).
Volume Areas: A structurally sound market will build on past areas of high volume. Should the market trend for long periods of time, it will lack sound structure (identified as a low volume area which denotes directional conviction and ought to offer support on any test).

If participants were to auction and find acceptance into areas of prior low volume, then future discovery ought to be volatile and quick as participants look to areas of high volume for favorable entry or exit.

POCs: POCs are valuable as they denote areas where two-sided trade was most prevalent. Participants will respond to future tests of value as they offer favorable entry and exit.

Excess: A proper end to price discovery; the market travels too far while advertising prices. Responsive, other-timeframe (OTF) participants aggressively enter the market, leaving tails or gaps which denote unfair prices.
Graphic: 65-minute profile chart of the Micro E-mini S&P 500 Futures. Note the blue anchored Volume Weighted Average Price (VWAP) which suggests the average buyer, since FOMC, is underwater. To note, VWAP is a metric highly regarded by chief investment officers, among other participants, for quality of trade. Additionally, liquidity algorithms are benchmarked and programmed to buy and sell around VWAPs.
Weekly Trade Idea
Please Note: In no way is the below a trade recommendation. It is a peek into the thought process here at Physik Invest. To cover my butt, so to speak, I say DO NOT take this trade. Also, if you would like to see this section included in future commentaries, email me at renato@physikinvest.comwith the subject line “Please Include Weekly Trade Ideas”.
Options offer an efficient way to gain directional exposure.
If an option buyer was short (long) stock, he or she could buy a call (put) to hedge upside (downside) exposure. Additionally, one can spread, or buy (+) and sell (-) options together, strategically.
Commonly discussed spreads include credit, debit, ratio, back, and calendar.
Credit: Sell -1 option closer to the money. Buy +1 option farther out of the money.
Debit: Buy +1 option closer to the money. Sell -1 option farther out of the money.
Ratio: Buy +1 option closer to the money. Sell -2 options farther out of the money.
Back: Sell -1 option closer to the money. Buy +2 options farther out of the money.
Calendar: Sell -1 option. Buy +1 option farther out in time, at the same strike.
Typically, if bullish (bearish), sell at-the-money put (call) credit spread and/or buy a call (put) debit/ratio spread structured around target price. Alternatively, if the expected directional move is great (small), opt for a back spread (calendar spread). Also, if credit spread, capture 50-75% of the premium collected. If debit spread, capture 2-300% of the premium paid.
Be cognizant of risk exposure to direction (delta), time (theta), and volatility (vega).
Negative (positive) delta = synthetic short (long).
Negative (positive) theta = time decay hurts (helps).
I’m bullish on Amazon and I think the stock may climb over the next week, toward $3,600. I will structure a spread above the current stock price, expiring in 1 week. I will buy the 3600 call option once (+1) and sell the 3700 call option twice (-2) for a $0.50 credit. Should the stock not move to my target, I keep the $50 credit. Should it move to $3,700, I could make $10,050.00 at expiry. Should the stock move past $3,850.00, I may incur unlimited losses. My goal, with this spread, is to capture the initial credit and close for additional credit if the stock moves higher.
If necessary, I will hedge the position by either (A) buying long stock, (B) widening strikes, (C) buying a far out-of-the-money call option to cap upside in case of an unpredictable move higher, or (D) roll strikes up in price and out in time.
What People Are Saying
In my opinion, the biggest tell for the sentiment of belief in the "Fed put" comes directly from CDS spreads.
— Christian Fromhertz 🇺🇸 (@cfromhertz) July 30, 2021
New blog on the Employment Cost Index (ECI) w/ Willie Powell. A summary🧵. TL;DR: NOMINAL compensation has steadily increased even w/ high unemp (consistent with a tightish labor market). But those gains have been eroded by inflation so REAL comp is down. https://t.co/0BSlcsJnnc
After years of self-education, strategy development, and trial-and-error, Renato Leonard Capelj began trading full-time and founded Physik Invest to detail his methods, research, and performance in the markets.
Additionally, Capelj is a finance and technology reporter. Some of his biggest works include interviews with leaders such as John Chambers, founder, and CEO, JC2 Ventures, Kevin O’Leary, businessman and Shark Tank host, Catherine Wood, CEO and CIO, ARK Invest, among others.
Disclaimer
At this time, Physik Invest does not manage outside capital and is not licensed. In no way should the materials herein be construed as advice. Derivatives carry a substantial risk of loss. All content is for informational purposes only.