Categories
Commentary

Daily Brief For April 25, 2022

Editor’s Note: Wow, what a month! Looks like there was a ton of volatility we weren’t able to navigate together.

I’m back now and will be making changes to both the quantity and quality of notes sent. In total transparency, I took on way too much work, and quality suffered a tad. I look forward to making things a bit more sustainable and am grateful for your interest in remaining a subscriber.

Interested in getting this free glimpse into the prevailing fundamental and technical drivers of U.S. equity market products. Join the 200+ that read this report daily, below, today!

What Happened

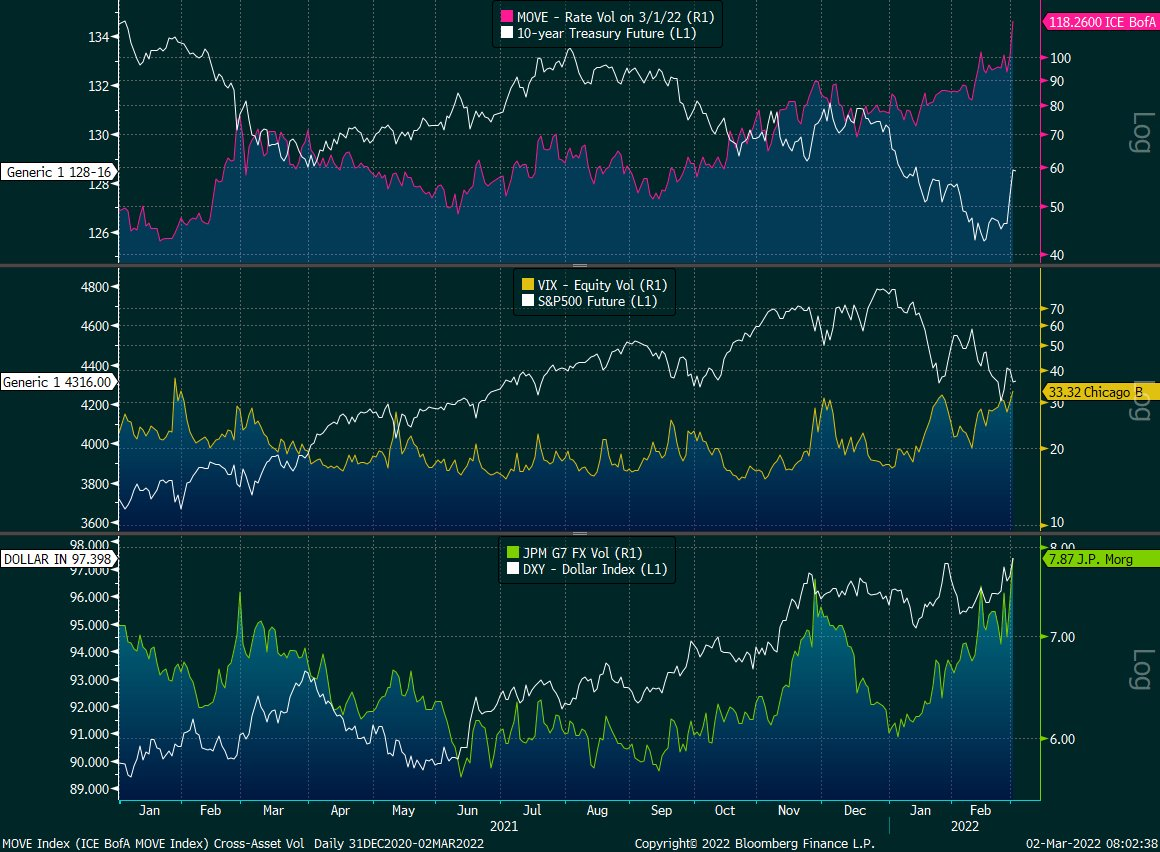
Overnight, the equity index and most commodity futures explored lower. Bonds and implied volatility metrics were bid.

This is alongside news that China’s reaction to a local COVID-19 outbreak may feed into global slowdowns just as supply pressures, among other things, are pushing the Federal Reserve (Fed) to adopt a more hawkish policy stance.

Notable is the pace at which China’s yuan is falling. 

Per TD Securities, it suggests “the PBOC is utilizing the yuan as another tool to provide stimulus to the economy at a time when they are showing restraint on the monetary policy front.” 

Ahead, there are no important economic events scheduled. See who is reporting earnings, here.
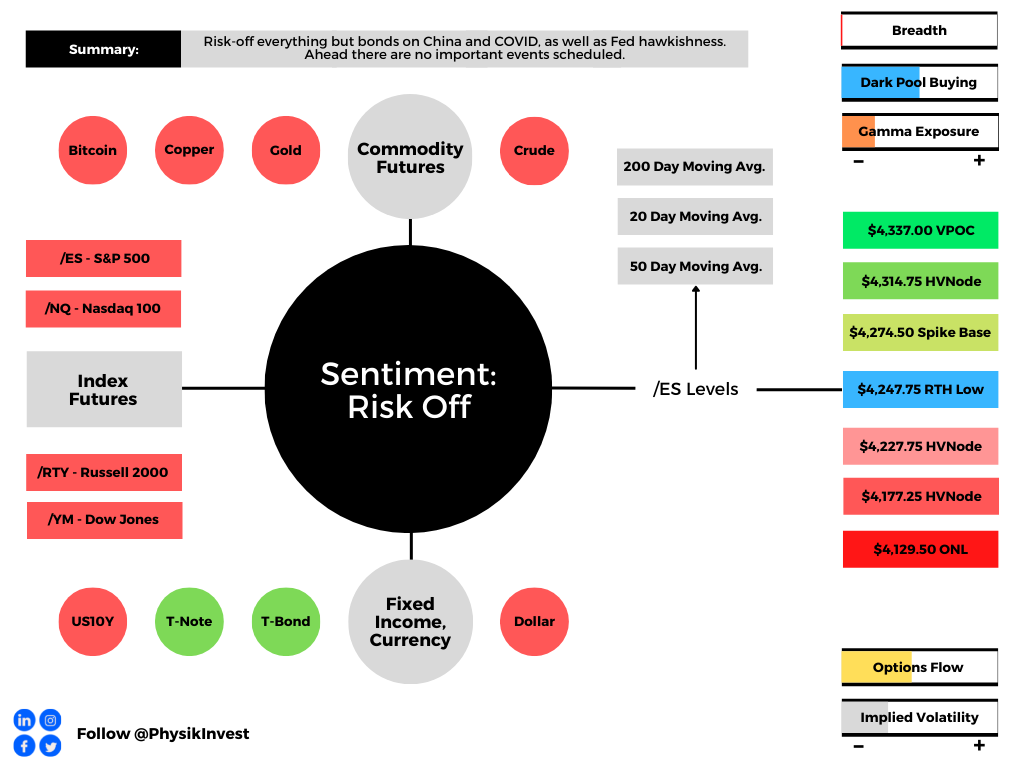
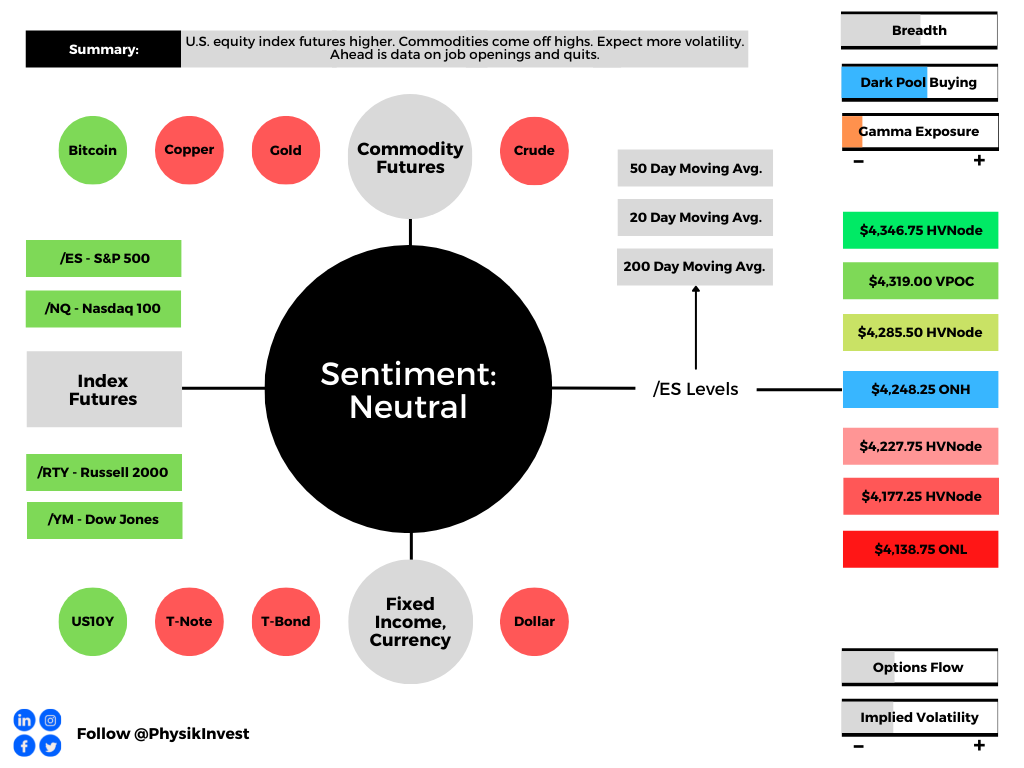
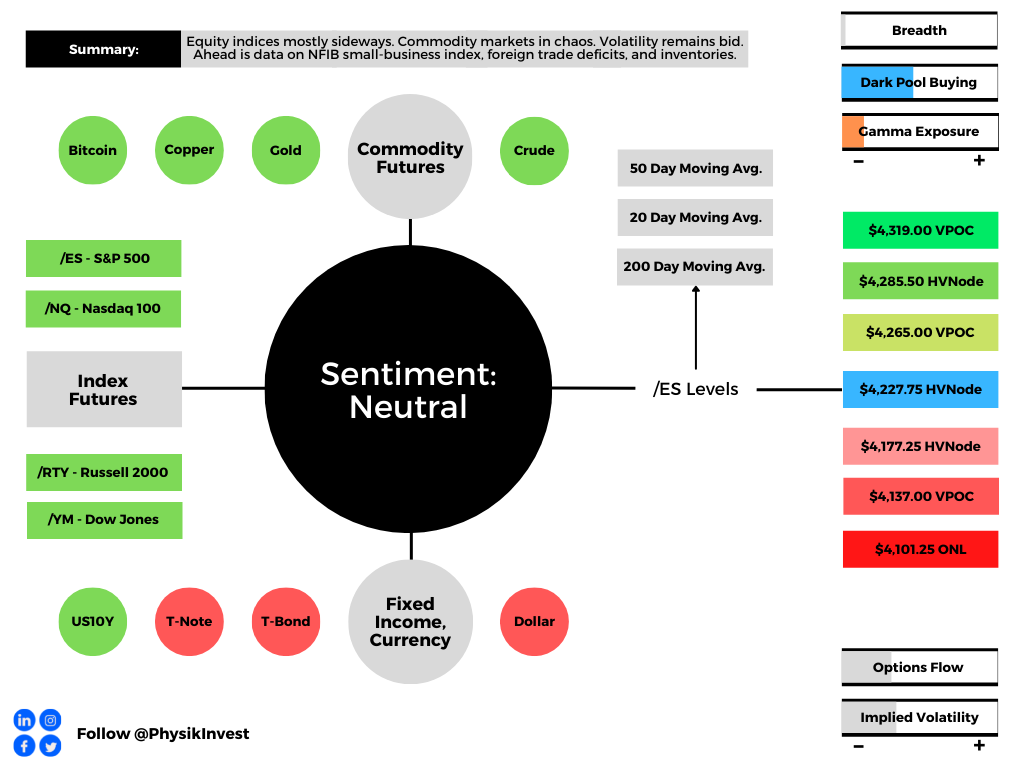
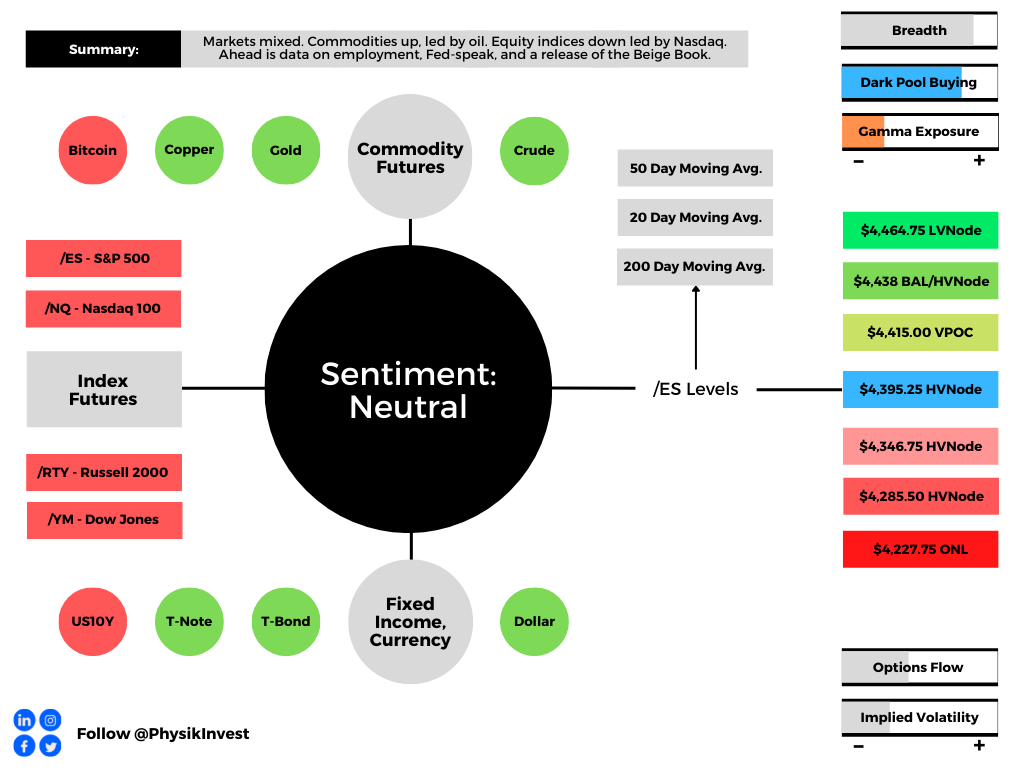
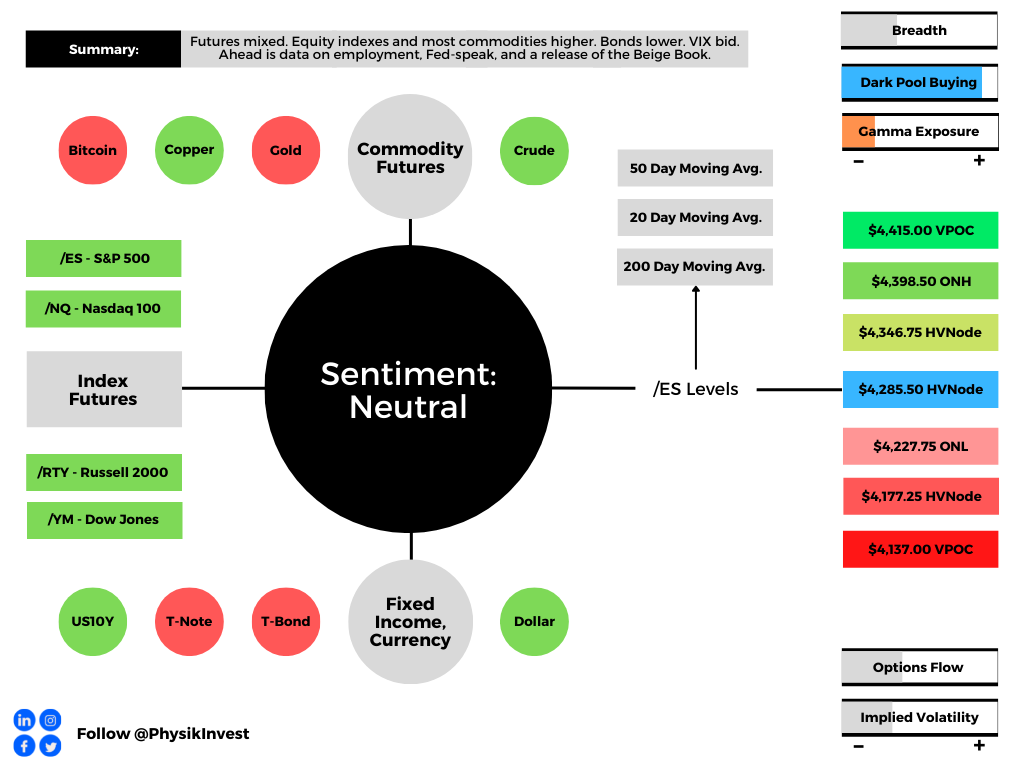
Graphic updated 7:30 AM ET. Sentiment Risk-Off if expected /ES open is below the prior day’s range. /ES levels are derived from the profile graphic at the bottom of the following section. Levels may have changed since initially quoted; click here for the latest levels. SqueezeMetrics Dark Pool Index (DIX) and Gamma (GEX) calculations are based on where the prior day’s reading falls with respect to the MAX and MIN of all occurrences available. A higher DIX is bullish. At the same time, the lower the GEX, the more (expected) volatility. Learn the implications of volatility, direction, and moneyness. SHIFT data used for S&P 500 (INDEX: SPX) options activity. Note that options flow is sorted by the call premium spent; if more positive, then more was spent on call options. Breadth reflects a reading of the prior day’s NYSE Advance/Decline indicator. VIX reflects a current reading of the CBOE Volatility Index (INDEX: VIX) from 0-100.

What To Expect

Fundamental: A push-and-pull, continues.

At a high level, it was surmised that many of the responses to geopolitical tension and inflation were priced in. The economy, since early pandemic disruptions, has strengthened and the need for ultra-accommodative policies is no more.
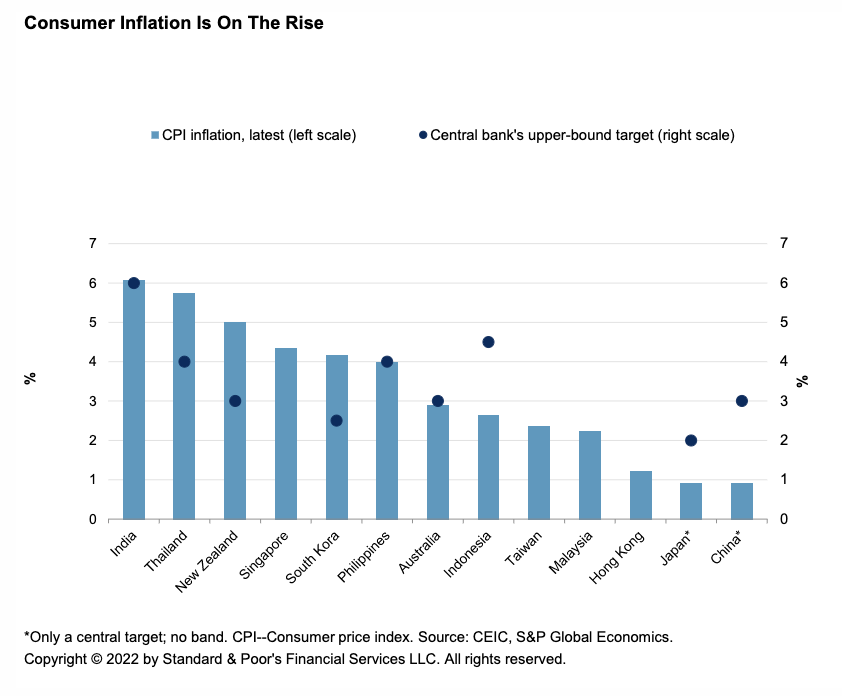
Graphic: Via S&P Global Inc (NYSE: SPGI).

That means low rates and quantitative easing (QE) – easy money so to speak – are on the way out, at least for the time being.

Recall that QE is a policy to expand the Federal Reserve’s balance sheet “to provide monetary accommodation, typically when interest rates are at a zero-lower bound (when nominal interest rates are at, or near, zero),” as JH Investment Management explains.

With QT, central banks remove assets (e.g., government bonds they bought from the private sector) from their balance sheet “either through the sale of assets they had purchased or deciding against reinvesting the principal sum of maturing securities.”

With that, we note that when bonds rise in value, their yields decline; “when the Fed embarks on bond-buying program[s] to support the U.S. economy, … [it nudges] the prices of these assets higher while pushing yields lower, which also has the effect of driving yield-hungry investors into relatively riskier asset categories that promise high returns.”
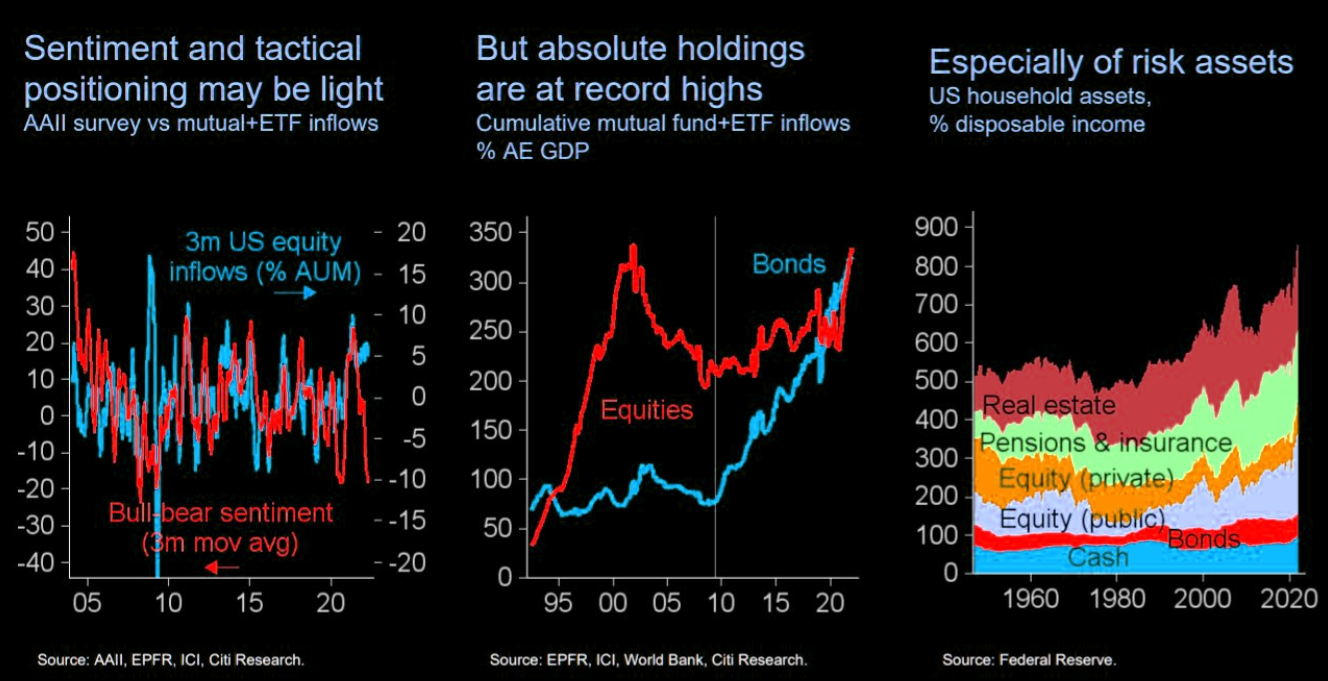
Graphic: Via ICI. Taken from The Market Ear.

As a result, participants’ demand for risk assets prompts their divergence from fundamentals. As liquidity is removed and funding costs increase, this may prompt risk assets to converge with fundamentals.

This is because, for investors to take on additional risk for return, they must receive in excess of the risk-free rate (as provided by the Treasury). This excess is the risk premium.

Previously, as the Damped Spring’s Andy Constan had previously commented, “[a]dditional risk premium expansion pressures from these levels is not likely.”

“However, if, in the unlikely event, details of QT do emerge suggesting a start of QT before June and at a greater size than expected, we would no longer be willing to hold [risk] assets as that would cause an end to any risk premium contraction possibilities.”

Well, that’s what happened in early April when Fed members said their debt holdings would be reduced “at a rapid pace” as soon as May, as well as hike rates, faster. 

“Given that the recovery has been considerably stronger and faster than in the previous cycle, I expect the balance sheet to shrink considerably more rapidly than in the previous recovery,” the Fed’s Lael Brainard said

The Fed may even raise “caps” on the pace of QT.
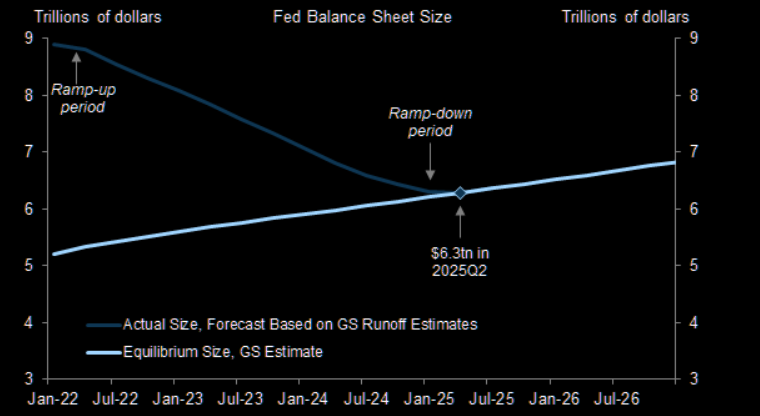
Graphic: Via The Market Ear. Goldman Sachs Group Inc (NYSE: GS) sees the balance sheet shrinking “to an equilibrium size of just over $6tn by early- or mid-2025, though there is substantial uncertainty about its terminal size.”

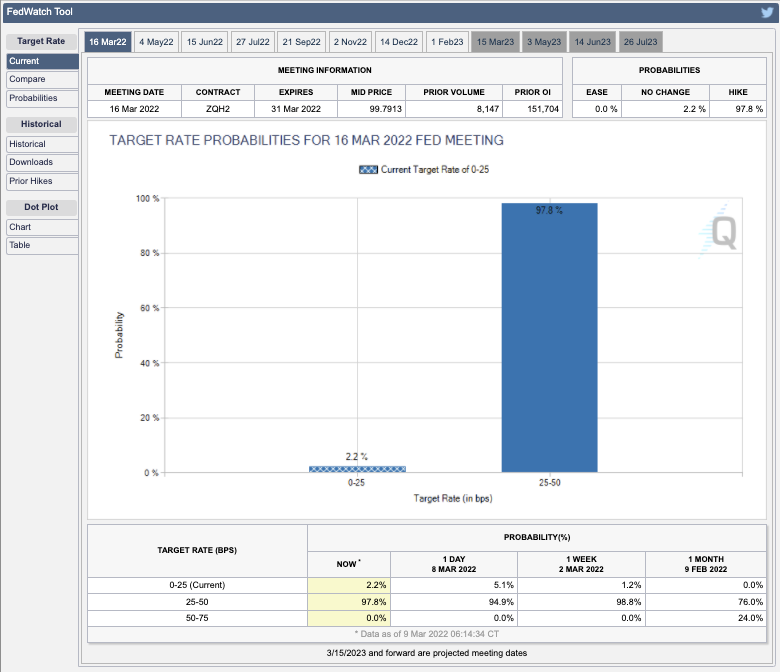
Per CME Group Inc’s (NASDAQ: CME) FedWatch Tool, market participants are pricing a near-100% probability that the Fed will move the target rate to 75-100 bps (+50 or +75 bps).

Graphic: Via CME Group Inc. FedWatch Tool suggests a near-100% chance of a Fed hike that moves the target rate between 75 and 100 bps.

At a high-level, rates hikes take time to flow through to the economy while “QT is a direct flow of capital to capital markets or flow out of,” according to statements by Kai Volatility’s Cem Karsan. 

“An increase in the pace of tightening of QT should mean lower stocks, wider credit spreads and a slight reduction in the need for front-end hikes,” explains Kevin Muir of the MacroTourist.

“Using the balance sheet as a tightening tool represents a large change in the Fed’s attitude, and IS NOT priced into the market.”
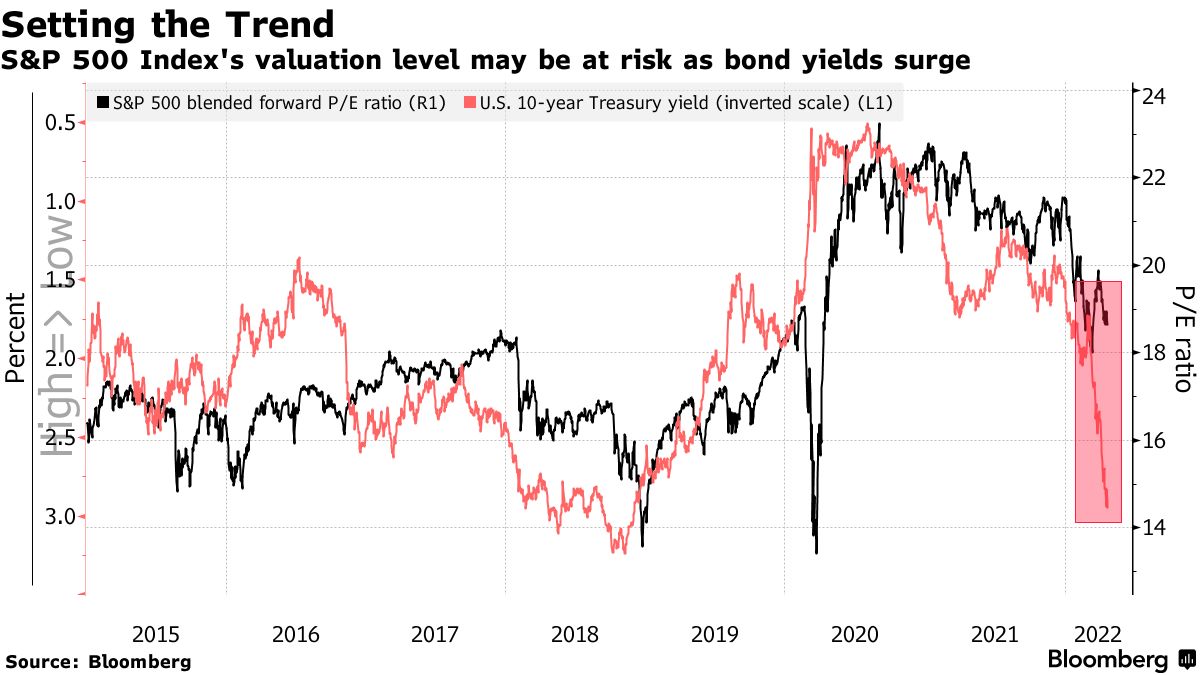
Graphic: Bloomberg. “Everyone bearish, but redemptions just starting,” said BofA strategists led by Michael Hartnett, adding that the environment of “extreme inflation” and rates shock is just setting in, as the Federal Reserve tightens monetary policy. “75 basis points is the new 25 basis points,” Hartnett said, referring to the scope of future interest-rate hikes.

As an aside, adding to earlier comments on the yuan’s fall, Bob Parker, a senior adviser at Credit Suisse Group AG (NYSE: CS) explains that “When Chinese investors lose confidence in their own economy/markets, capital outflows from China accelerate, … [and] this, then, leads to a central bank which has to prop up the currency by selling some of the country’s huge reserve piles.” 

“Part of their reserves will have been/are in U.S. equities so as the reserves fall, they are natural sellers of the S&P.”
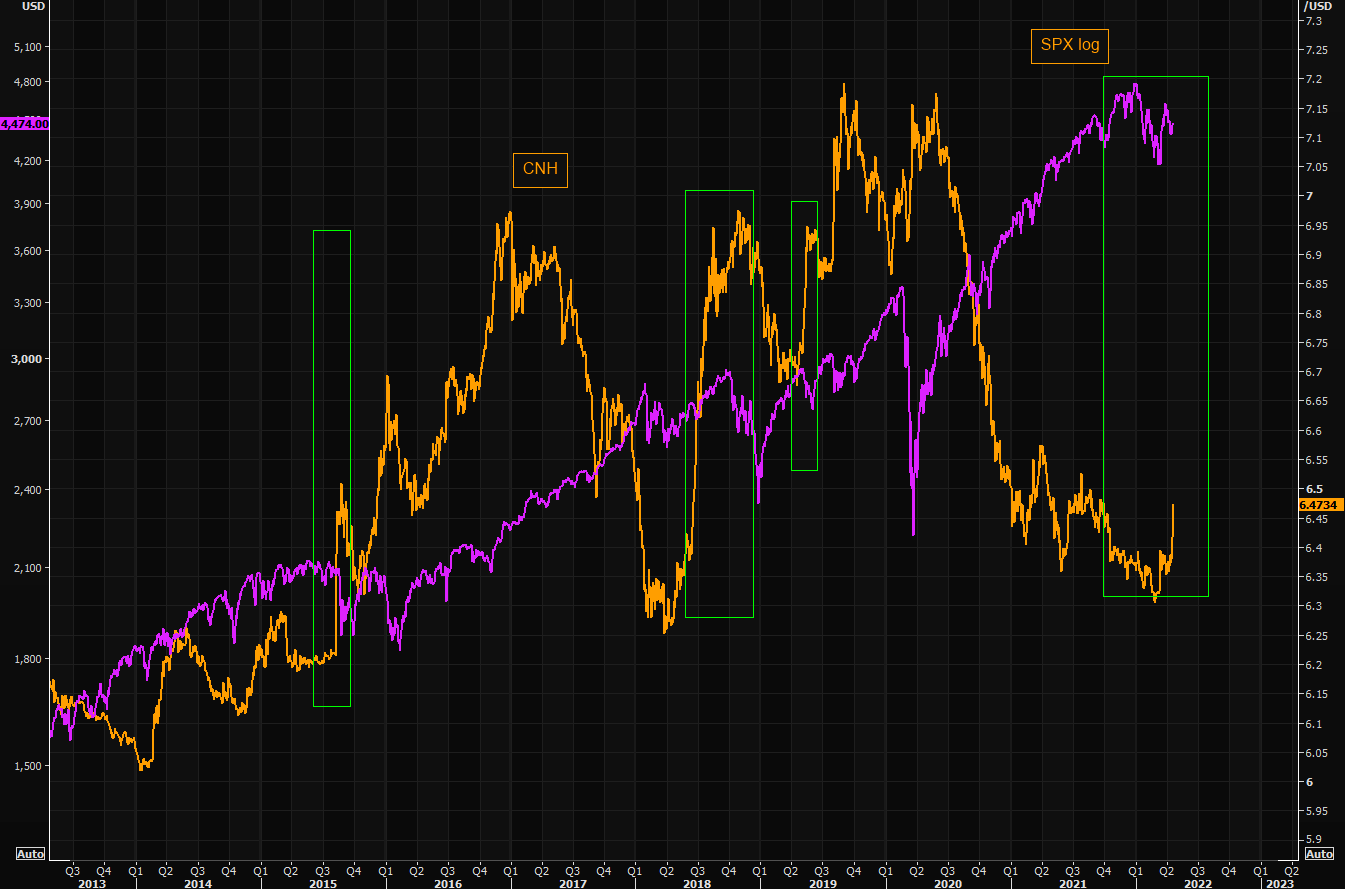
Graphic: Via Refinitiv. Taken from The Market Ear. CNH versus SPX.

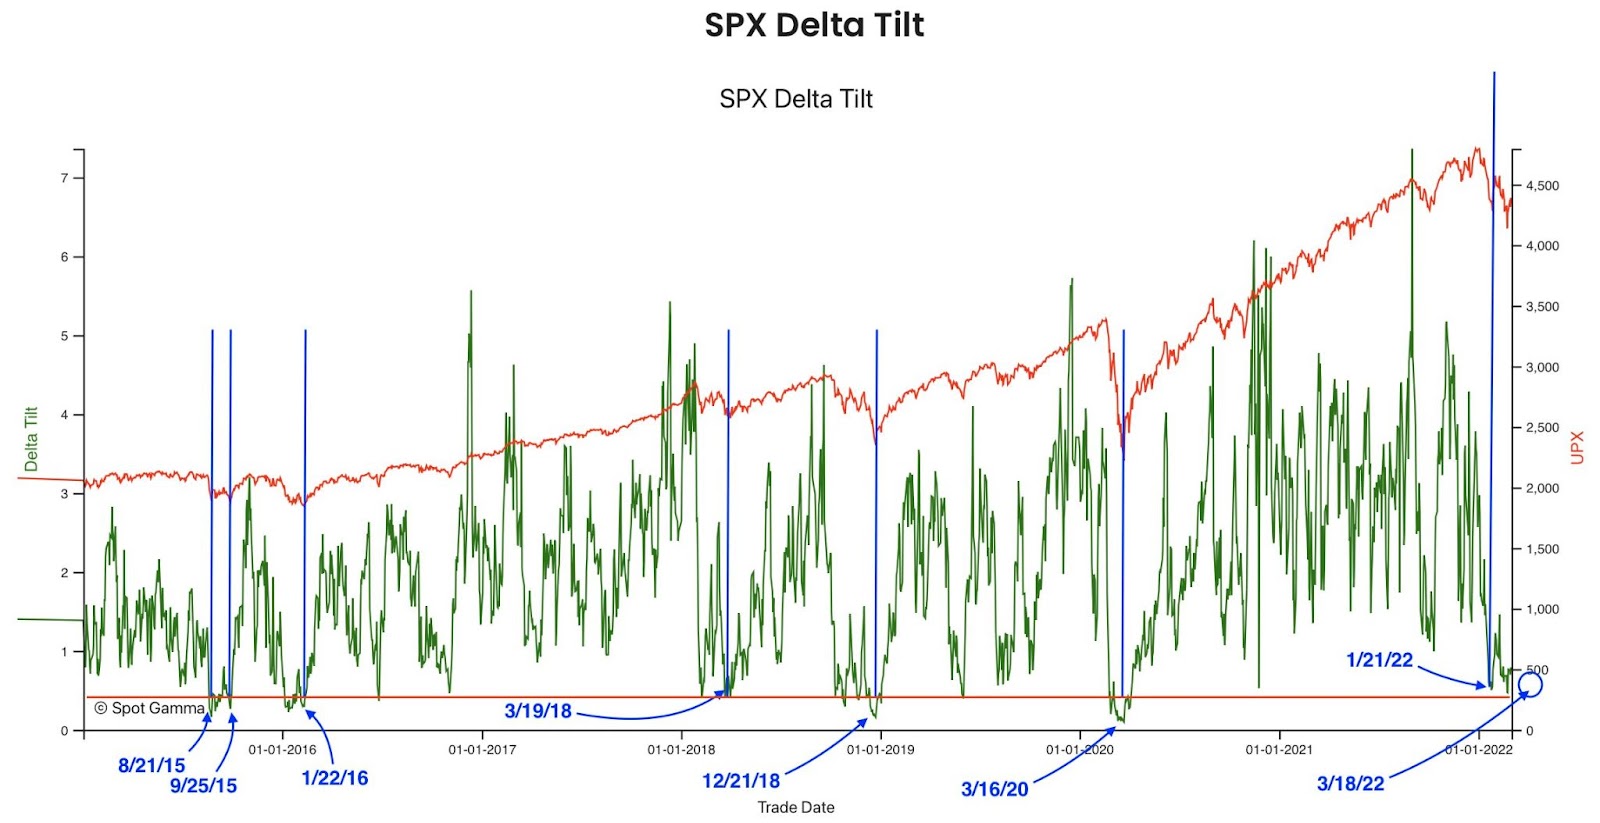
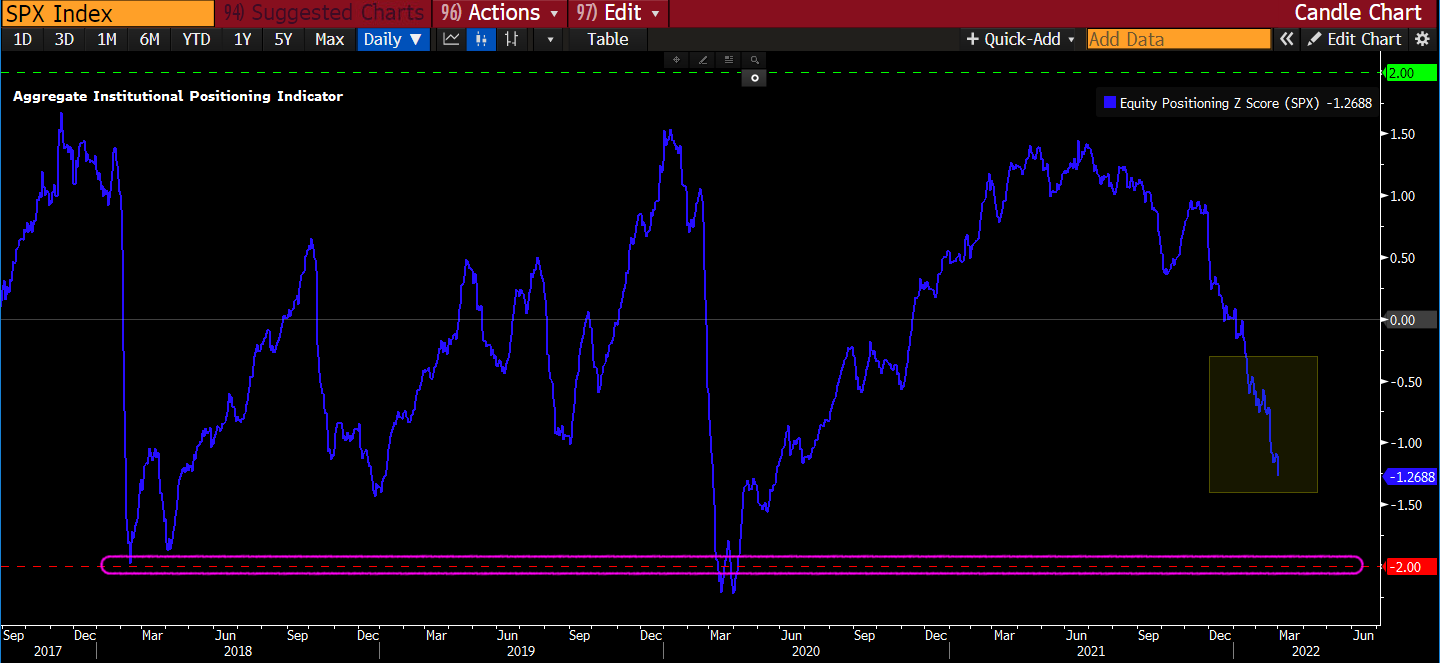
Positioning: In a comparison of options positioning and passive buying support, the returns distribution is skewed positive and points to building support for a potential short-term bounce.
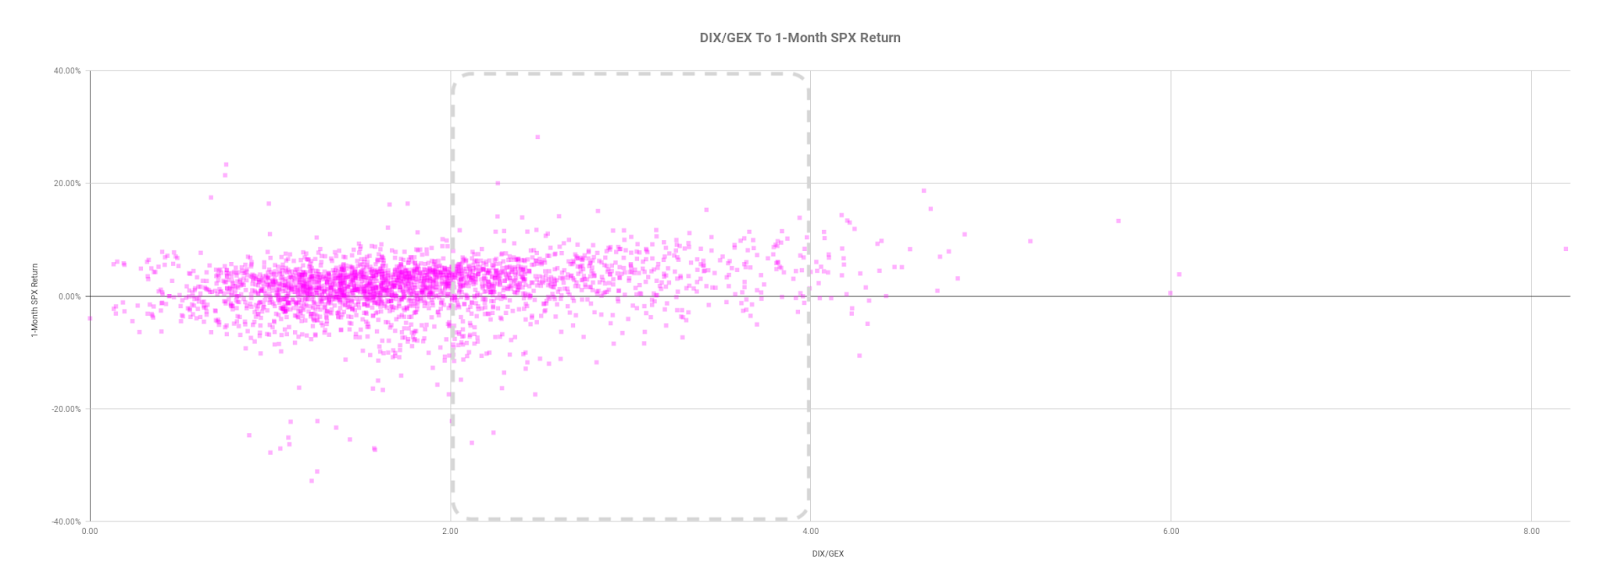
Graphic: Via Physik Invest. Data via SqueezeMetrics.

The most recent liquidation resulted in participants reaching for protection and this exacerbated movement to the downside amidst the reflexive hedging.

As this short-dated exposure decays, the counterparts’ hedges are to be tapered and this may assist in the market hammering out a bottom or rallying. 

On the contrary, however, as SpotGamma explained in a recent note, “[t]op of mind as we head into new trade on Monday is the likelihood traders will not aggressively sell volatility (i.e., if they sell volatility -> that drives volatility lower -> resulting in hedging flows that support the market) until the FOMC (5/4) and/or some resolution on the geopolitical front.”

“Therefore, [] expect larger trading ranges this upcoming week.”

Technical: As of 6:30 AM ET, Monday’s regular session (9:30 AM – 4:00 PM ET), in the S&P 500, will likely open in the lower part of a negatively skewed overnight inventory, outside of prior-range and -value, suggesting a potential for immediate directional opportunity.

In the best case, the S&P 500 trades higher; activity above the $4,247.75 regular trade low (RTH Low) puts in play the $4,274.50 spike base. Initiative trade beyond the spike base could reach as high as the $4,314.75 high volume area (HVNode) and $4,337.00 untested point of control (VPOC), or higher.

In the worst case, the S&P 500 trades lower; activity below the $4,247.75 RTH Low puts in play the $4,227.75 HVNode. Initiative trade beyond the $4,227.75 HVNode could reach as low as the $4,177.25 HVNode and $4,129.50 overnight low (ONL), or lower.

Considerations: Spikes mark the beginning of a break from value. Spikes higher (lower) are validated by trade at or above (below) the spike base (i.e., the origin of the spike).

In a spike up (down) situation, trade below (above) the spike base, negates the buying (selling).

Click here to load today’s key levels into the web-based TradingView charting platform. Note that all levels are derived using the 65-minute timeframe. New links are produced, daily.
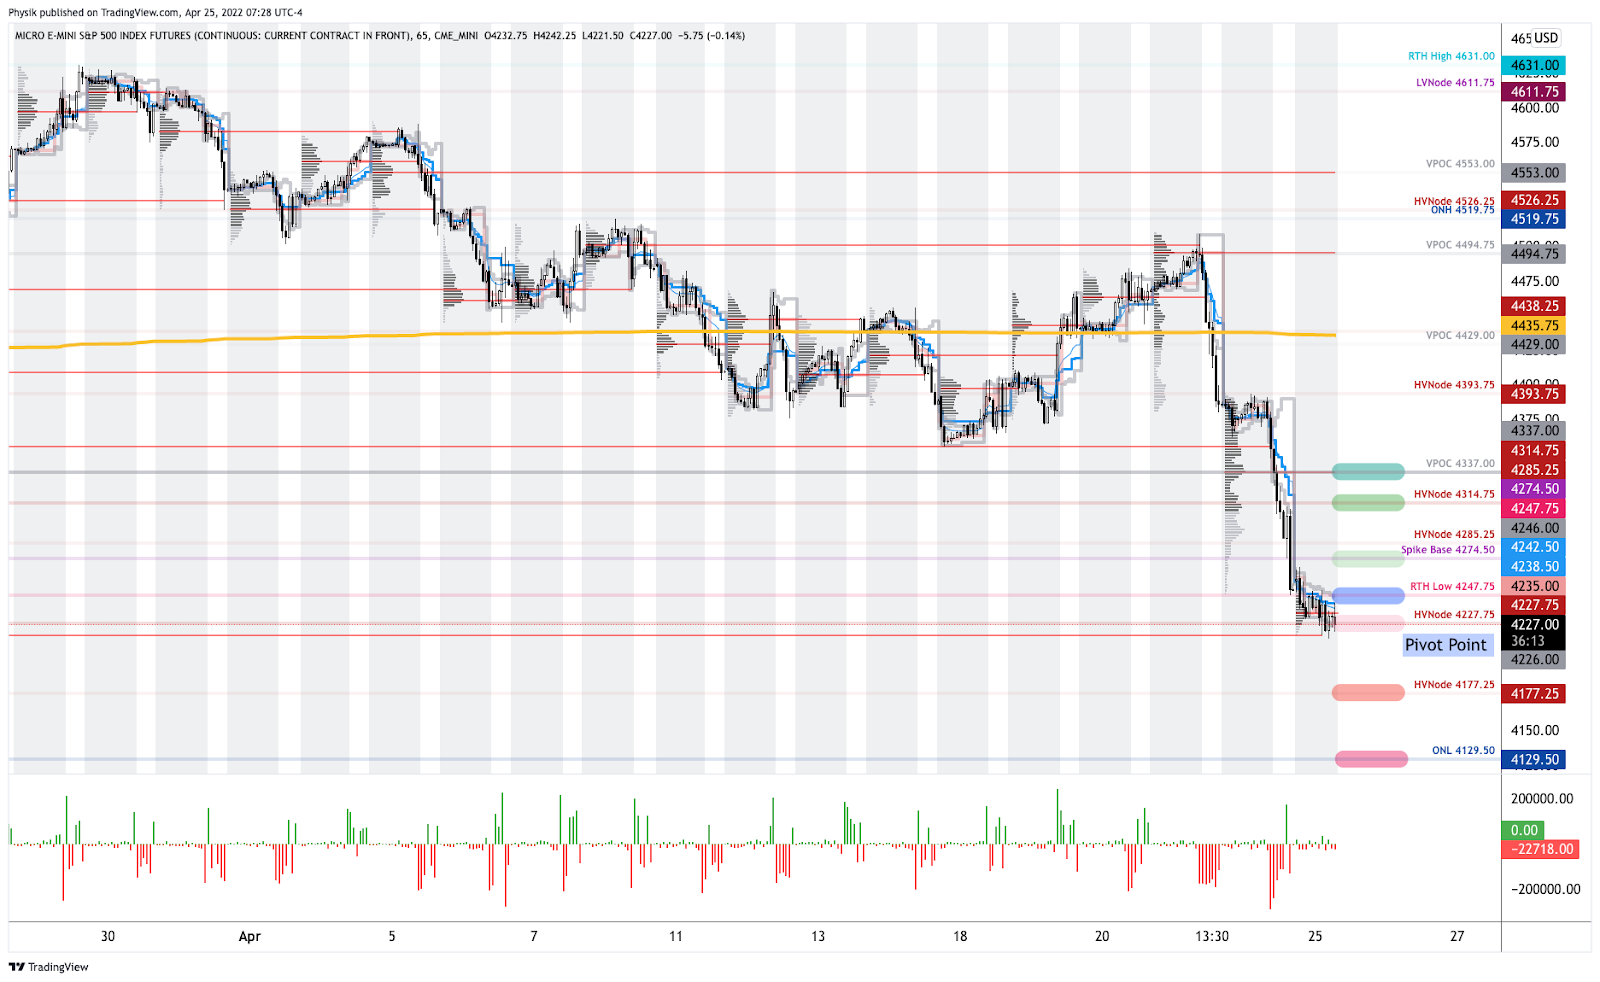
Graphic: 65-minute profile chart of the Micro E-mini S&P 500 Futures.

What People Are Saying

Definitions

Overnight Rally Highs (Lows): Typically, there is a low historical probability associated with overnight rally-highs (lows) ending the upside (downside) discovery process.

Volume Areas: A structurally sound market will build on areas of high volume (HVNodes). Should the market trend for long periods of time, it will lack sound structure, identified as low volume areas (LVNodes). LVNodes denote directional conviction and ought to offer support on any test. 

If participants were to auction and find acceptance into areas of prior low volume (LVNodes), then future discovery ought to be volatile and quick as participants look to HVNodes for favorable entry or exit.

POCs: POCs are valuable as they denote areas where two-sided trade was most prevalent in a prior day session. Participants will respond to future tests of value as they offer favorable entry and exit.

About

After years of self-education, strategy development, mentorship, and trial-and-error, Renato Leonard Capelj began trading full-time and founded Physik Invest to detail his methods, research, and performance in the markets.

Capelj also develops insights around impactful options market dynamics at SpotGamma and is a Benzinga reporter.

Some of his works include conversations with ARK Invest’s Catherine Wood, investors Kevin O’Leary and John Chambers, FTX’s Sam Bankman-Fried, Kai Volatility’s Cem Karsan, The Ambrus Group’s Kris Sidial, among many others.

Disclaimer

In no way should the materials herein be construed as advice. Derivatives carry a substantial risk of loss. All content is for informational purposes only.

Categories
Commentary

Daily Brief For March 15, 2022

Editor’s Note: The Daily Brief is a free glimpse into the prevailing fundamental and technical drivers of U.S. equity market products. Join the 200+ that read this report daily, below!

What Happened

Overnight, equity index futures explored lower prices alongside most commodities. Bonds and implied volatility metrics were bid, also.

The narrative is that this is follow-on selling as participants look to price in the implications of COVID-19 lockdowns in China, as well as the Russia-Ukraine conflict. Arguably, there is some pre-Federal Open Market Committee (FOMC) positioning going on, too.

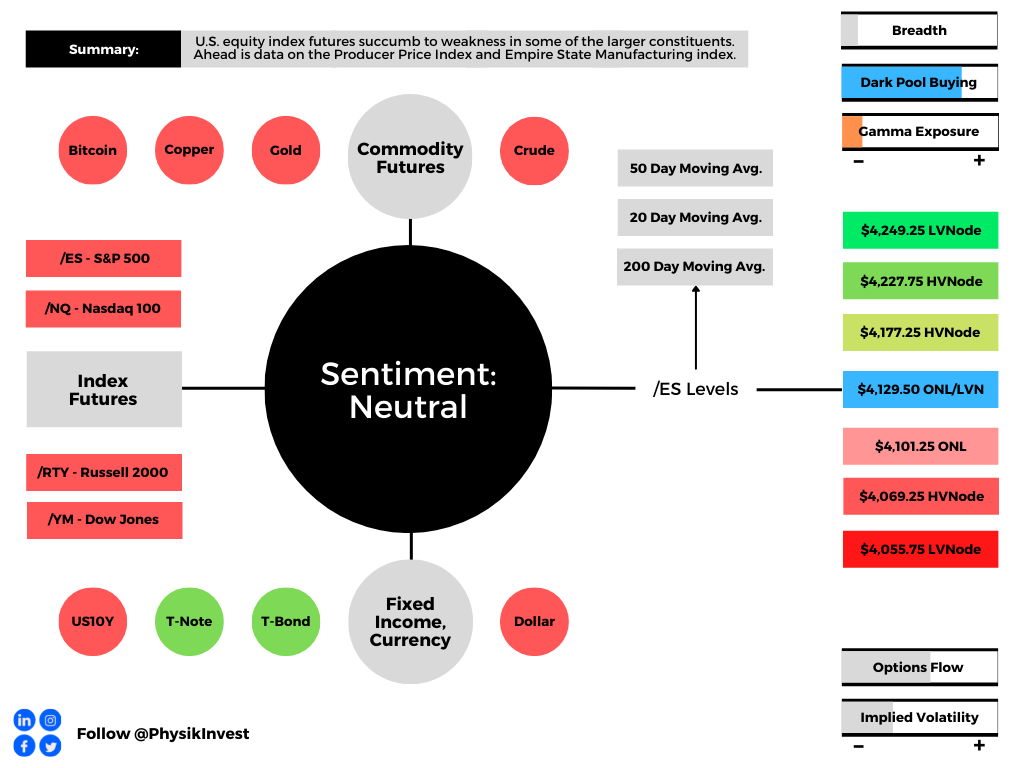
Ahead is data on the Producer Price Index and Empire State Manufacturing (8:30 AM ET).

Graphic updated 6:15 AM ET. Sentiment Neutral if expected /ES open is inside of the prior day’s range. /ES levels are derived from the profile graphic at the bottom of the following section. Levels may have changed since initially quoted; click here for the latest levels. SqueezeMetrics Dark Pool Index (DIX) and Gamma (GEX) calculations are based on where the prior day’s reading falls with respect to the MAX and MIN of all occurrences available. A higher DIX is bullish. At the same time, the lower the GEX, the more (expected) volatility. Learn the implications of volatility, direction, and moneyness. SHIFT data used for S&P 500 (INDEX: SPX) options activity. Note that options flow is sorted by the call premium spent; if more positive, then more was spent on call options. Breadth reflects a reading of the prior day’s NYSE Advance/Decline indicator. VIX reflects a current reading of the CBOE Volatility Index (INDEX: VIX) from 0-100.

What To Expect

Fundamental: Keeping it short, today. Please check out Monday’s commentary, if you haven’t!

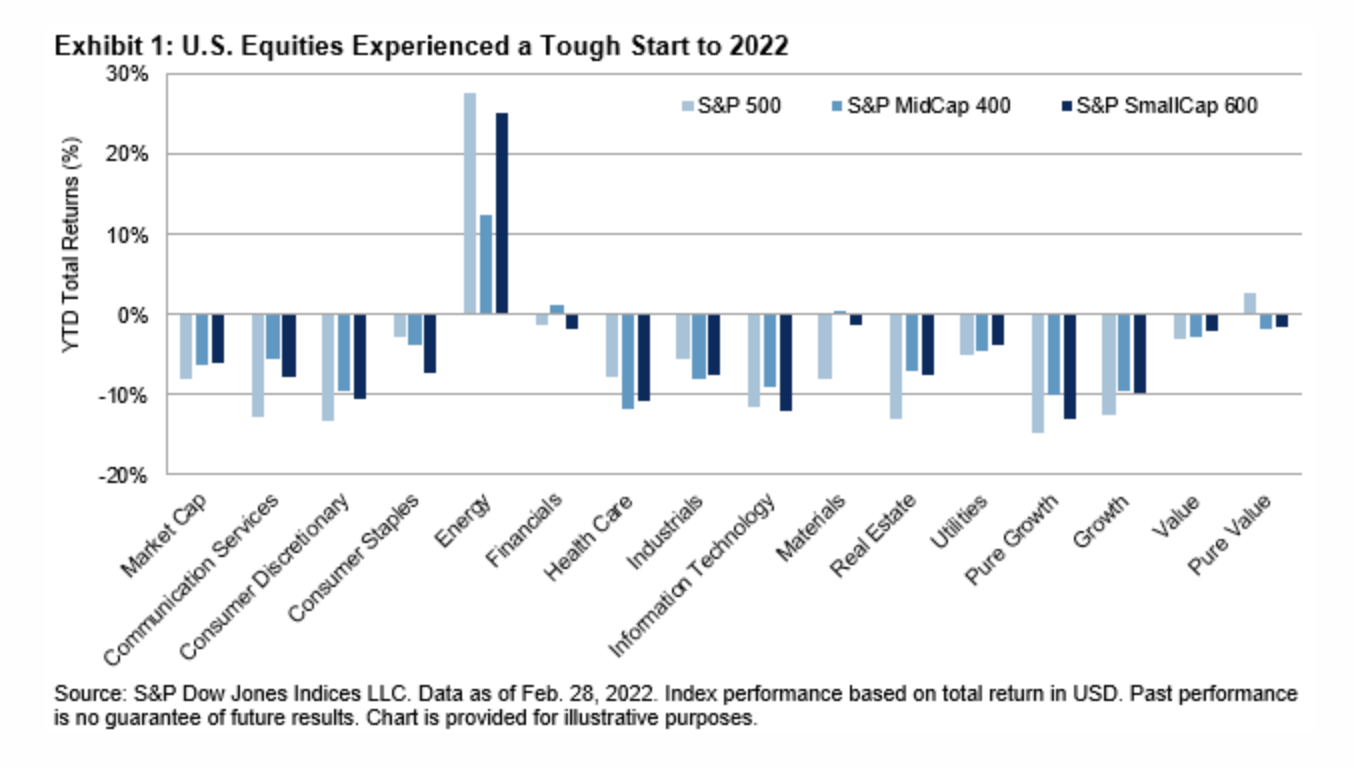
Weak start to 2022 as participants look to price slower growth and inflation, tighter monetary policy, geopolitical tensions, a resurgence in COVID-19, potential Russian defaults, and beyond.

Graphic: Via S&P Global Inc (NYSE: SPGI). 

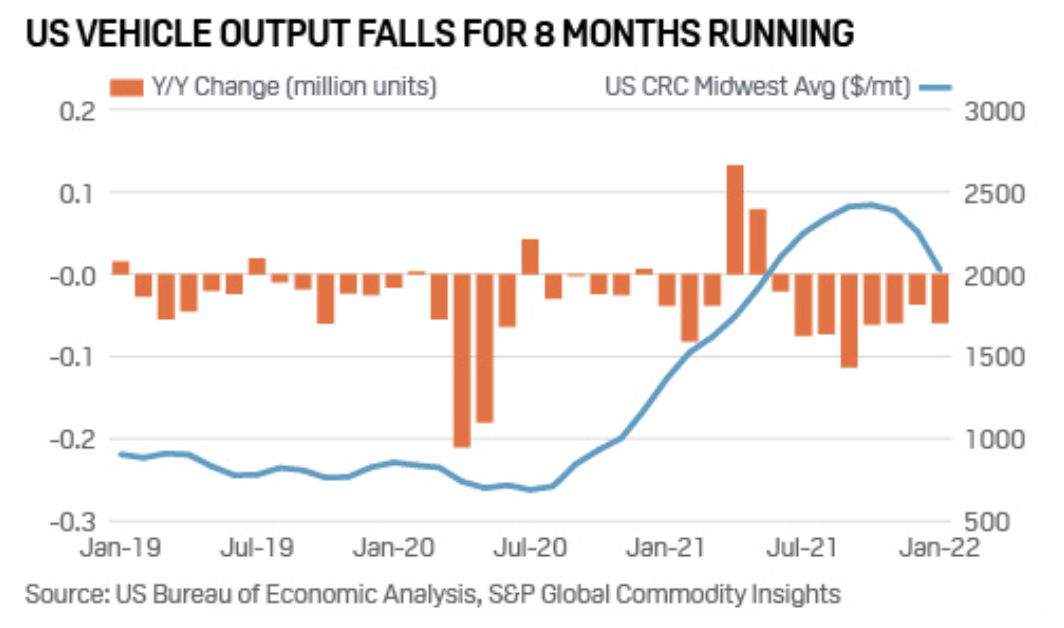
Bolstering inflation pressures are supply-demand challenges. For instance, geopolitical tensions are stifling vehicle production here in the U.S.

Graphic: Via S&P Global Inc (NYSE: SPGI). 

Since Russia’s invasion of Ukraine, gas in the U.S. climbed about $0.80/gallon, also, prompting talk of gas tax holidays.

Graphic: Via Reuters.

Pursuant to these remarks, Goldman Sachs Group Inc (NYSE: GS) economists suggest the probability of recession in the next year is between 20-35% while Morgan Stanley (NYSE: MS) strategists see equity valuations overshooting to the downside with out of control inflation.

Graphic: Via Goldman Sachs Group Inc.

In opposition, JPMorgan Chase & Co’s (NYSE: JPM) Marko Kolanovic suggests there is too much negativity priced in and that investors should add equity risk

“We believe that the past month’s correction has induced too much negativity in markets, e.g., reflected by our market-implied recession probabilities, on the fear that growth will be severely affected by the war. We stay with a pro-risk stance as we do not believe that we will see a recession or that we have entered a sustained bear market.”

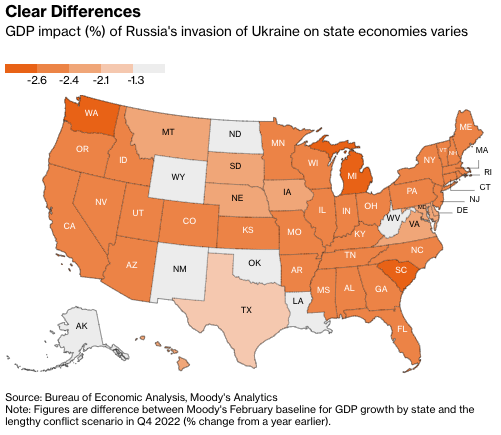
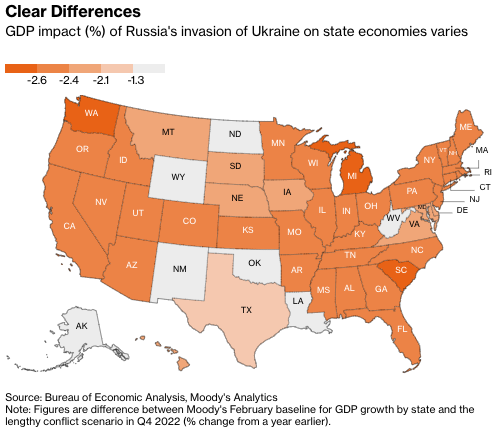
Graphic: Via Bloomberg. “A Moody’s Analytics computer model suggests that the U.S. as a whole would be able to avoid a recession, even if military hostilities are prolonged.”

Positioning: Per Goldman Sachs Group Inc’s derivatives team, “puts are more overvalued than any time over the past five years.”

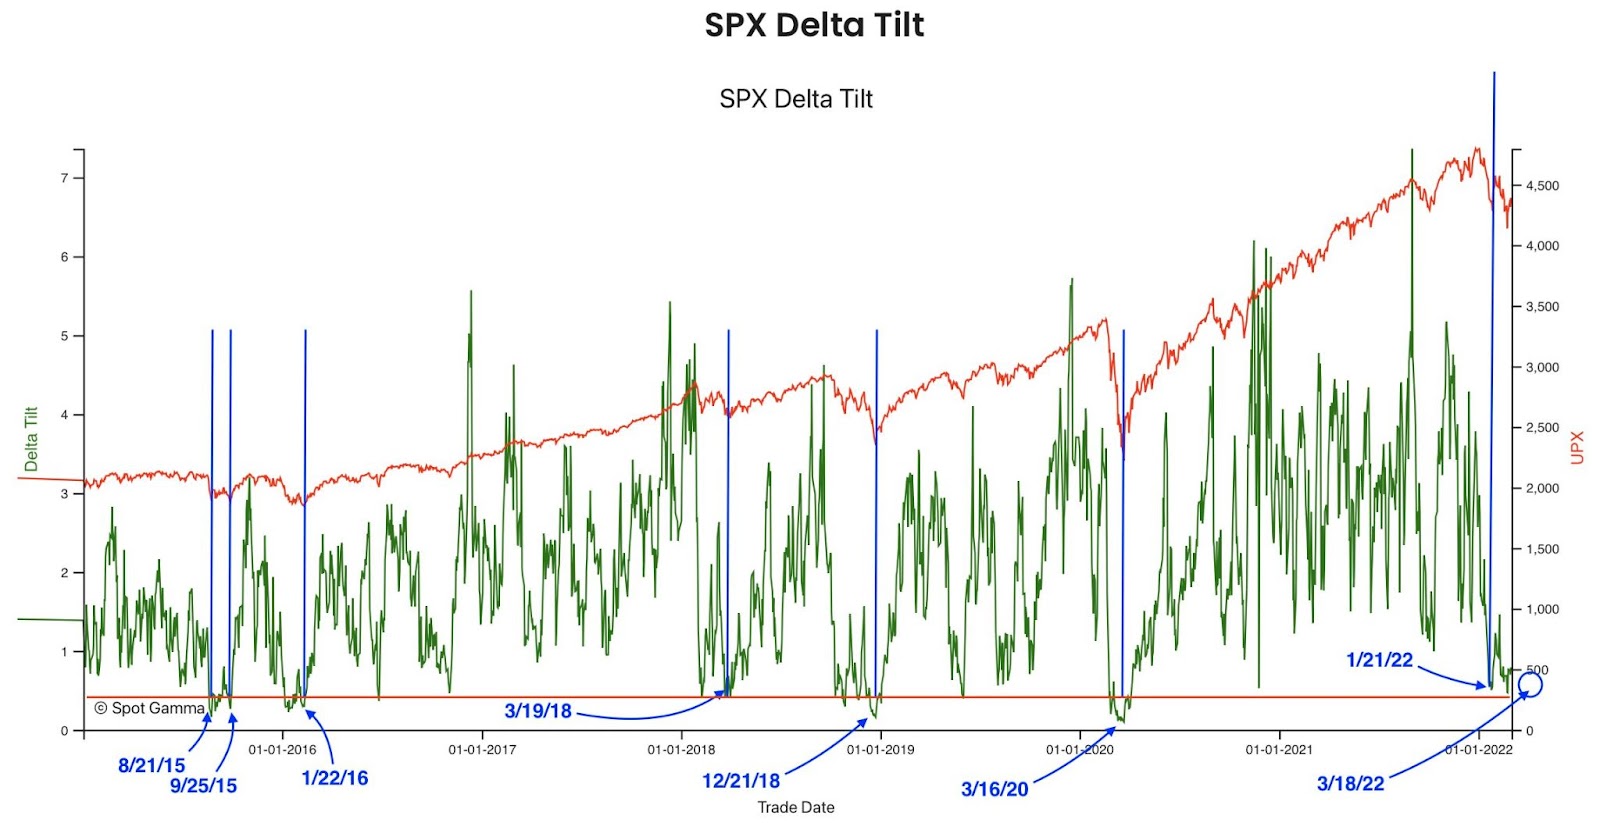
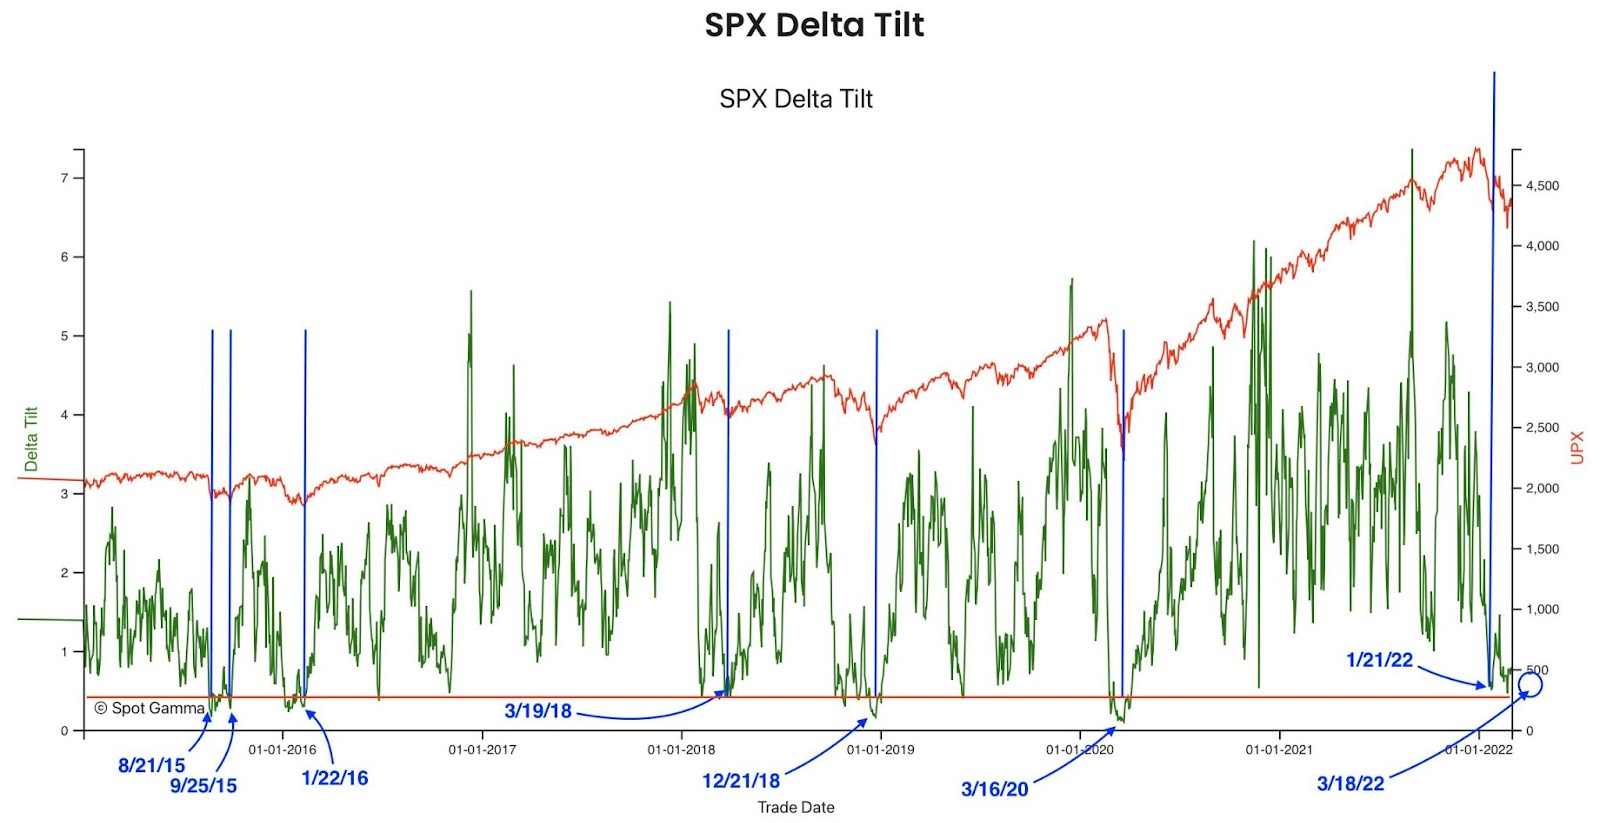
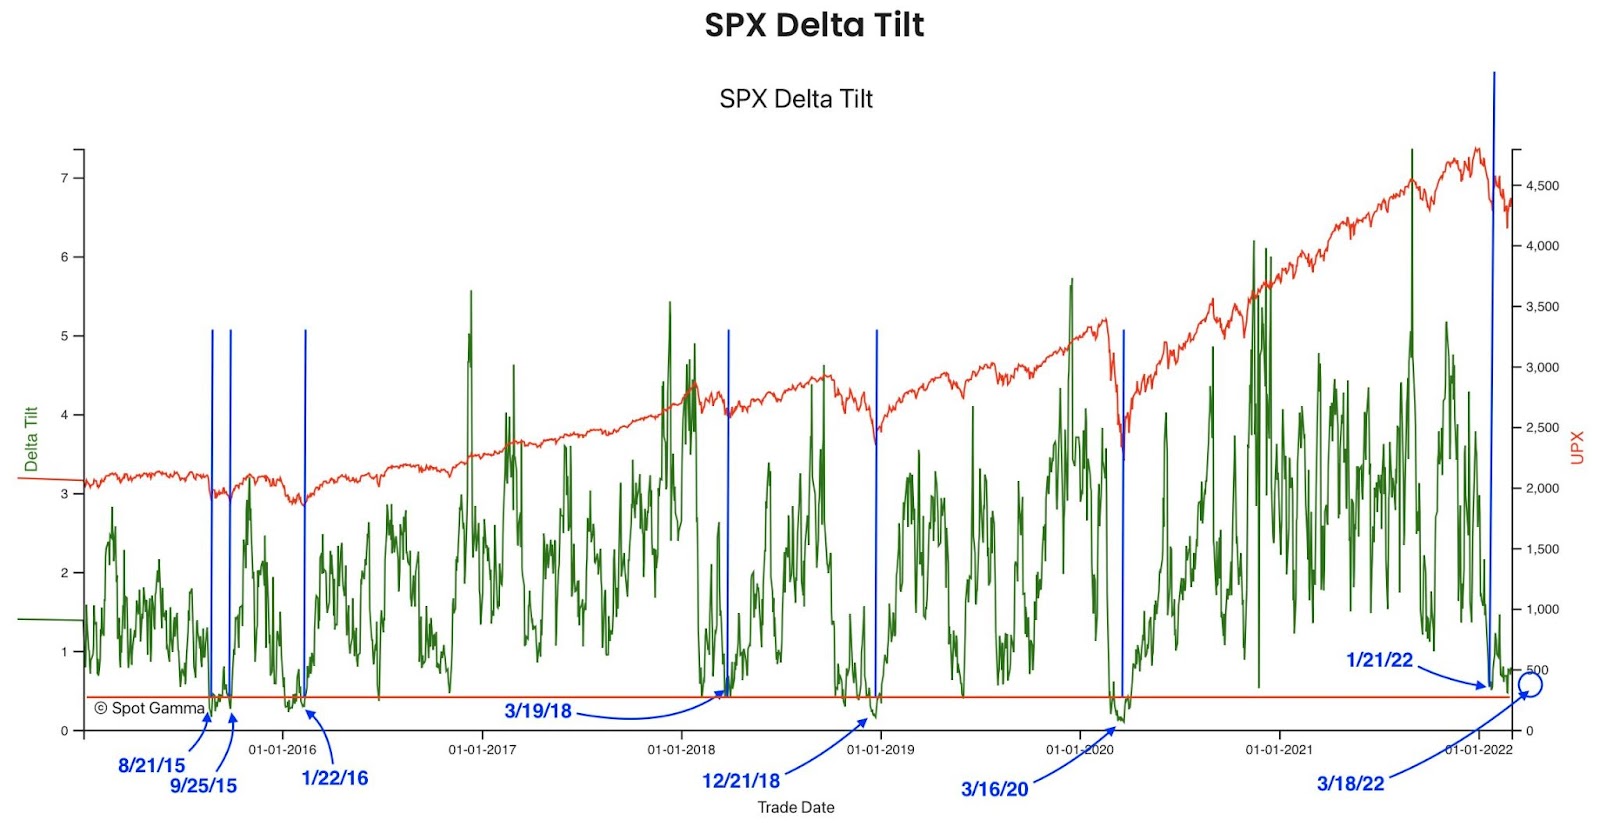
Graphic: Via SpotGamma. “Netting call & put delta, you can see we’re near extremes in terms of put:call positions. Often large put positions are removed by expirations, which seems to coincide with market lows. Many of these are quarterly expirations which coincide w/FOMC meetings – such as next week.”

Further, it is expected that the compression of volatility (via passage of FOMC), as well as the removal of customer puts and (accordingly) counterparty negative gamma exposure (OPEX) may serve to alleviate some of this pressure.

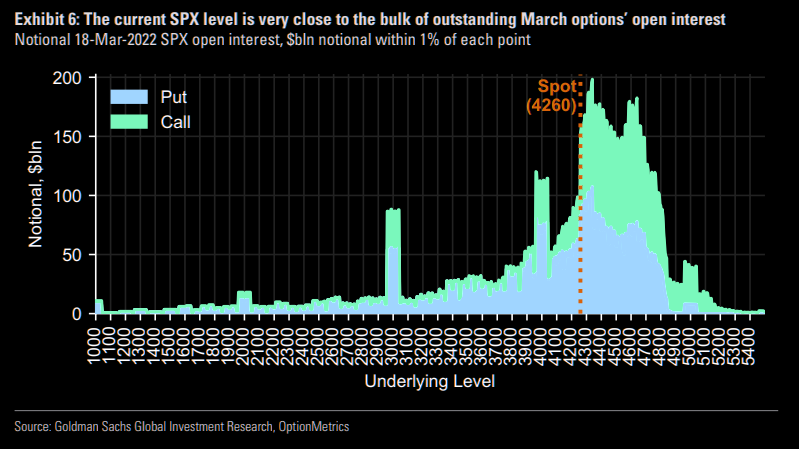
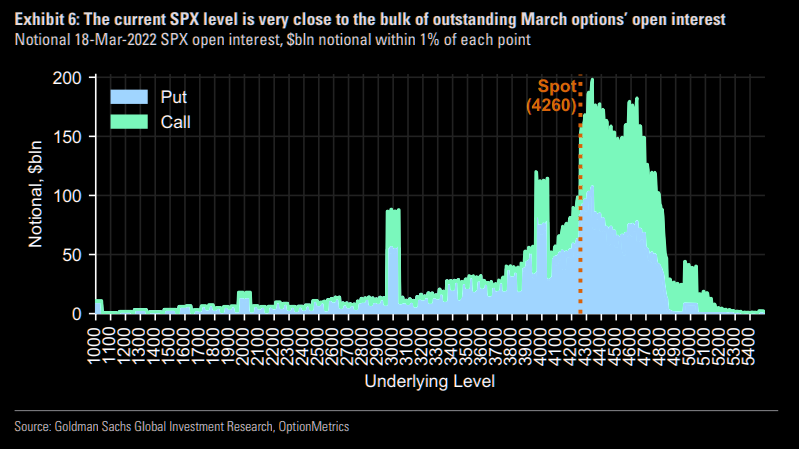
Graphic: Via Goldman Sachs Group Inc (NYSE: GS). Taken from The Market Ear. “18-Mar has more expiring near-the-money SPX open interest than any expiration since 2019.”

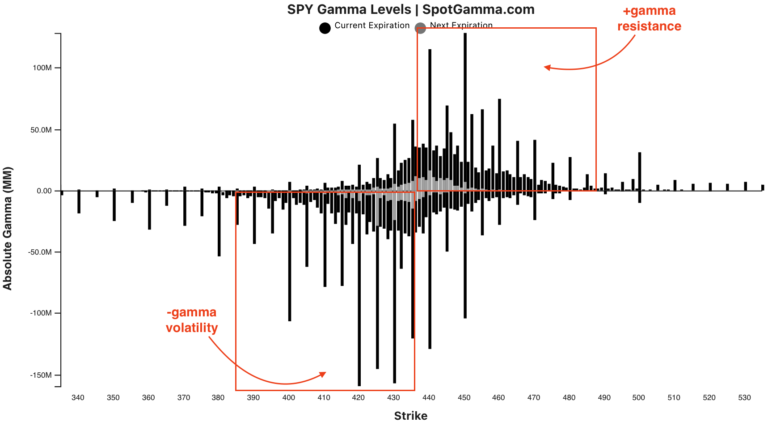
In taking the other side of this demand for protection, counterparties carry exposure to positive delta and negative gamma (losses amplified to the downside). In hedging their own exposure, counterparties will sell underlying(s), and this is where the aforementioned pressure arises.

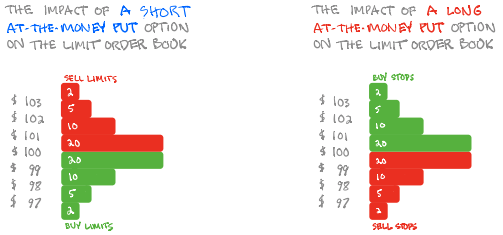
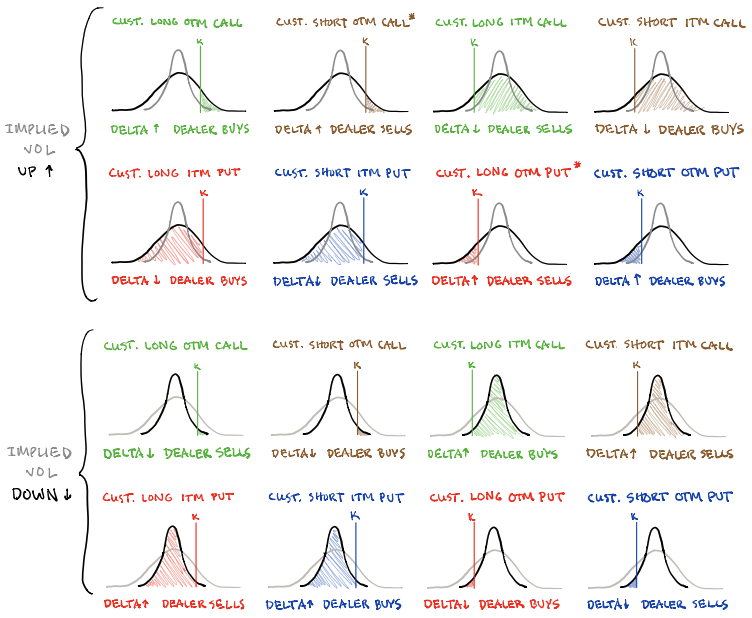
Graphic: SqueezeMetrics details the implications of customer activity in the options market, on the underlying’s order book. For instance, in selling a put, customers add liquidity and stabilize the market. How? The market maker long the put will buy (sell) the underlying to neutralize directional risk as price falls (rises).

Given present supply and demand conditions (customer hedging in months prior), the incremental pressure counterparties add with each leg lower is less, if you will. 

Here’s a good explanation:

“When implied volatility is high, that same 1% move lower is much more ‘expected’ so there generally won’t be the same upward pressure on volatility and in fact it might decline,” said Christopher Jacobson, a strategist at Susquehanna Financial Group LLP.

“Along the same lines, investors at that point have had more opportunity and time to hedge, so those same market moves may not lead to as much hedging activity.”

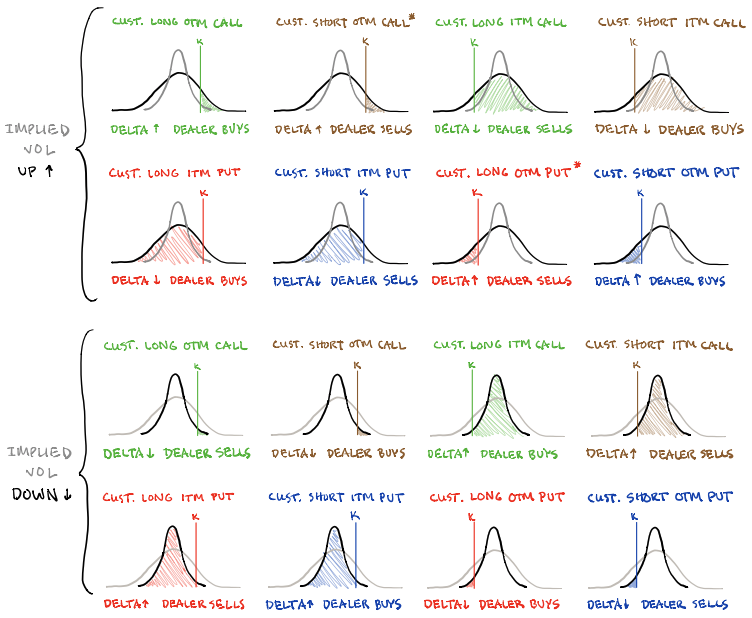
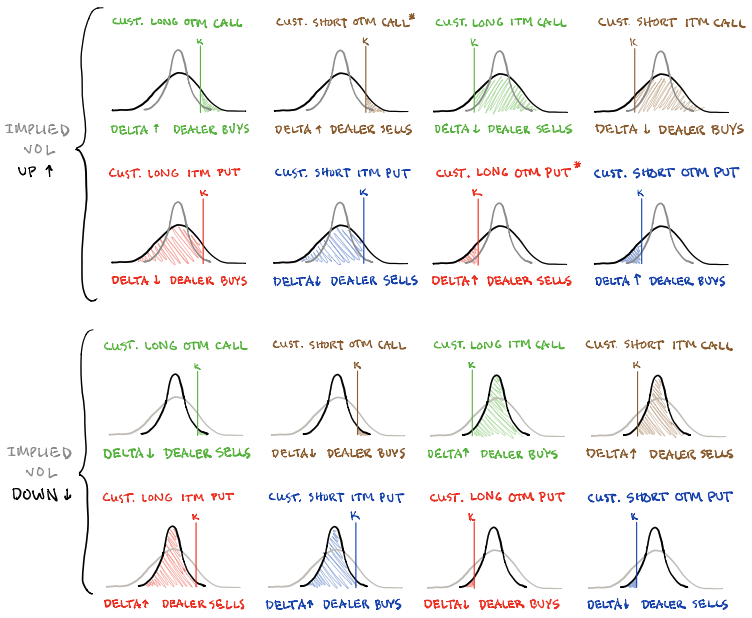
Pictured: SqueezeMetrics highlights implications of volatility, direction, and moneyness.

Adding to that last remark, as Amy Wu Silverman of Royal Bank of Canada’s (NYSE: RY) capital markets group puts it well: “You’re also seeing people selling that volatility and doing some overwriting. That can probably dampen volatility.”

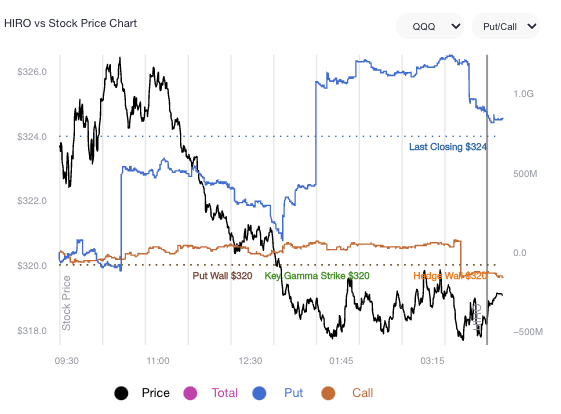
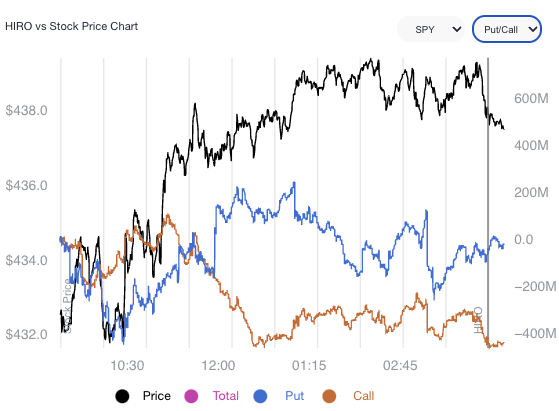
Graphic: SpotGamma’s Hedging Impact of Real-Time Options (HIRO) indicator for QQQ shows strong put selling 3/14/2022. Divergences often precede reversals in the underlying.

There is the potential, according to SpotGamma, for some “path dependency,” however, as “the expiration and/or covering of a large swath of these put hedges may place the market back into an ‘underhedged’ position.” In such a case, new demand would add fuel to weakness.

Technical: As of 6:15 AM ET, Tuesday’s regular session (9:30 AM – 4:00 PM ET), in the S&P 500, will likely open in the middle part of a negatively skewed overnight inventory, inside of prior-range and -value, suggesting a limited potential for immediate directional opportunity.

Gap Scenarios: Gaps ought to fill quickly. Should they not, that’s a signal of strength; do not fade. Leaving value behind on a gap-fill or failing to fill a gap (i.e., remaining outside of the prior session’s range) is a go-with indicator.

Auctioning and spending at least 1-hour of trade back in the prior range suggests a lack of conviction; in such a case, do not follow the direction of the most recent initiative activity.

In the best case, the S&P 500 trades higher; activity above the $4,129.50 overnight low (ONL) puts in play the $4,177.25 high volume area (HVNode). Initiative trade beyond the $4,177.25 HVNode could reach as high as the $4,227.75 HVNode and $4,249.25 LVNode, or higher.

In the worst case, the S&P 500 trades lower; activity below the $4,129.50 ONL puts in play the $4,101.25 ONL. Initiative trade beyond the ONL could reach as low as the $4,069.25 HVNode and $4,055.75 LVNode, or lower.

Considerations: Push-and-pull, as well as responsiveness near key-technical areas (that are discernable visually on a chart), suggests technically-driven traders with short time horizons are very active. 

Such traders often lack the wherewithal to defend retests and, additionally, the type of trade may be indicative of the other time frame participants waiting for more information to initiate trades.

Click here to load today’s key levels into the web-based TradingView charting platform. Note that all levels are derived using the 65-minute timeframe. New links are produced, daily.
Graphic: 65-minute profile chart of the Micro E-mini S&P 500 Futures.

Definitions

Overnight Rally Highs (Lows): Typically, there is a low historical probability associated with overnight rally-highs (lows) ending the upside (downside) discovery process.

Volume Areas: A structurally sound market will build on areas of high volume (HVNodes). Should the market trend for long periods of time, it will lack sound structure, identified as low volume areas (LVNodes). LVNodes denote directional conviction and ought to offer support on any test. 

If participants were to auction and find acceptance into areas of prior low volume (LVNodes), then future discovery ought to be volatile and quick as participants look to HVNodes for favorable entry or exit.

About

After years of self-education, strategy development, mentorship, and trial-and-error, Renato Leonard Capelj began trading full-time and founded Physik Invest to detail his methods, research, and performance in the markets.

Capelj is also a Benzinga finance and technology reporter interviewing the likes of Shark Tank’s Kevin O’Leary, JC2 Ventures’ John Chambers, FTX’s Sam Bankman-Fried, and ARK Invest’s Catherine Wood, as well as a SpotGamma contributor developing insights around impactful options market dynamics.

Disclaimer

Physik Invest does not carry the right to provide advice.

In no way should the materials herein be construed as advice. Derivatives carry a substantial risk of loss. All content is for informational purposes only.

Categories
Commentary

Daily Brief For March 14, 2022

Editor’s Note: The Daily Brief is a free glimpse into the prevailing fundamental and technical drivers of U.S. equity market products. Join the 200+ that read this report daily, below!

What Happened

A lot to unpack, today. Part of the newsletter may be cut off, as a result, in your inbox. Just click to view in another window.

Overnight, equity index futures auctioned sideways-to-higher, masking turmoil in products listed abroad, as well as commodities and fixed income.

In regards to bonds, they slumped (globally) in light of participants’ pricing in monetary action given heightened inflation. The Federal Reserve, Bank of England, and Bank of Japan are to issue policy updates this week.

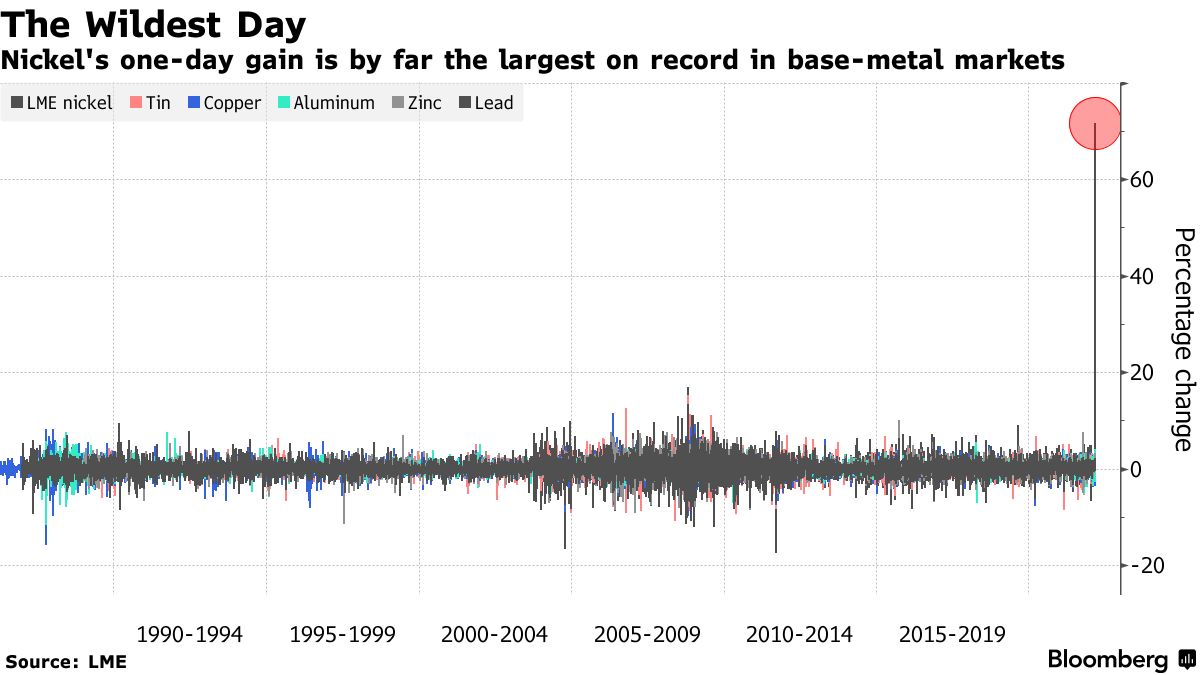
Commodity markets are still roiling after a price spike in some products “created a systemic risk” that prompted exchanges to cancel trades, while equity markets in Asia saw their worst-selling in years.

The Hang Seng China Enterprises Index (INDEX: HSCEI) closed down 7.2%, the biggest drop since 2008. This was after Russia asked for China’s assistance in Ukraine (which could result, later, in sanctions from the U.S.), thus compounding uncertainties with respect to an ongoing regulatory crackdown.

Ahead is data on 1- and 3-year inflation expectations (11:00 AM ET).

Graphic updated 6:11 AM ET. Sentiment Neutral if expected /ES open is inside of the prior day’s range. /ES levels are derived from the profile graphic at the bottom of the following section. Levels may have changed since initially quoted; click here for the latest levels. SqueezeMetrics Dark Pool Index (DIX) and Gamma (GEX) calculations are based on where the prior day’s reading falls with respect to the MAX and MIN of all occurrences available. A higher DIX is bullish. At the same time, the lower the GEX, the more (expected) volatility. Learn the implications of volatility, direction, and moneyness. SHIFT data used for S&P 500 (INDEX: SPX) options activity. Note that options flow is sorted by the call premium spent; if more positive, then more was spent on call options. Breadth reflects a reading of the prior day’s NYSE Advance/Decline indicator. VIX reflects a current reading of the CBOE Volatility Index (INDEX: VIX) from 0-100.

What To Expect

Fundamental: We may attribute participants’ uncertainty to how far monetary policymakers want to tighten, slower economic growth, the implications of geopolitical tensions, imminent Russian defaults, a resurgence in COVID-19 abroad, and more.

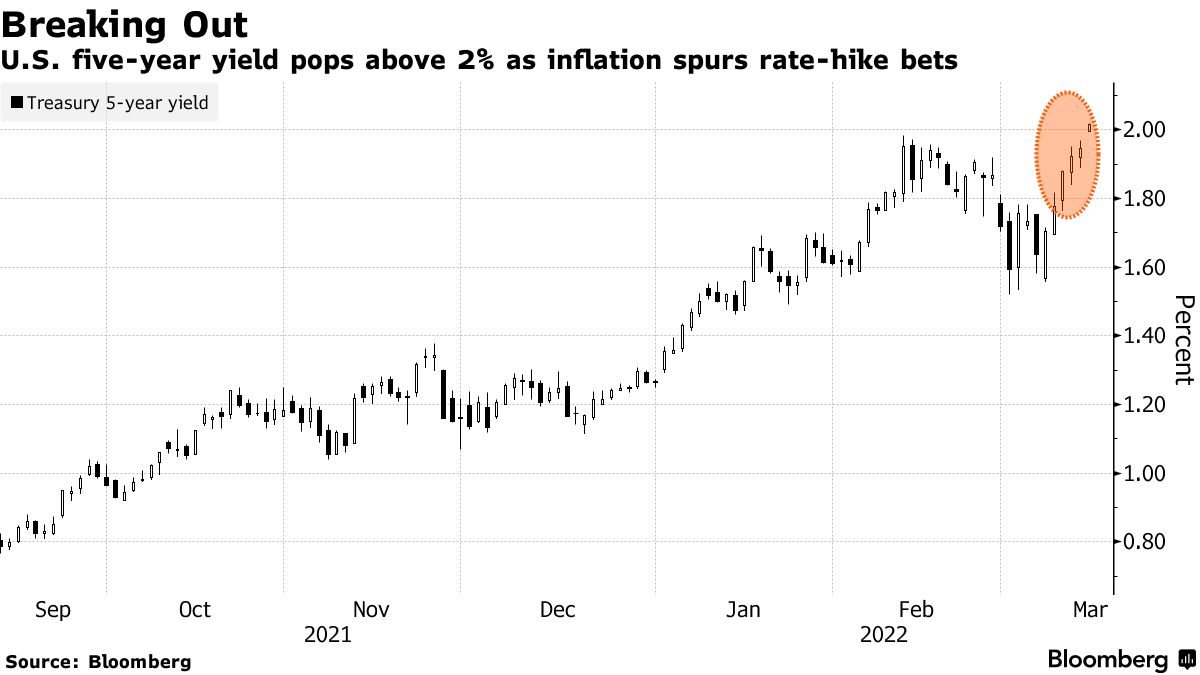
Graphic: Via Bloomberg. As Treasury yields rise, participants price in Fed tightening.

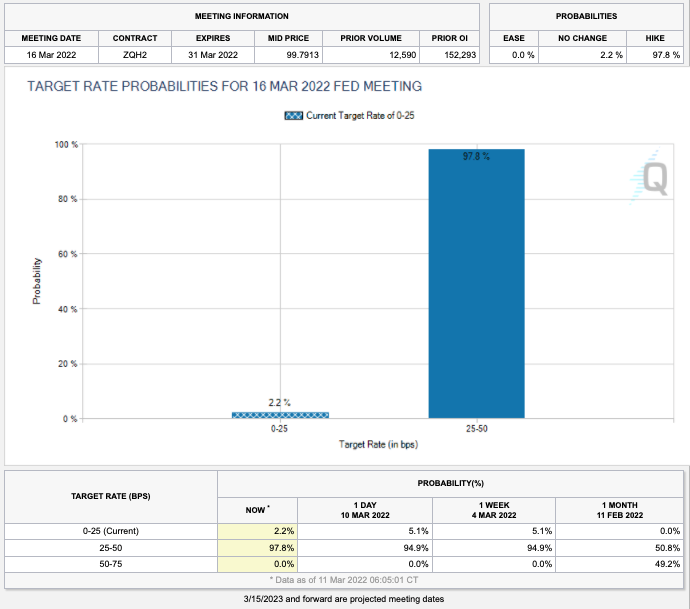
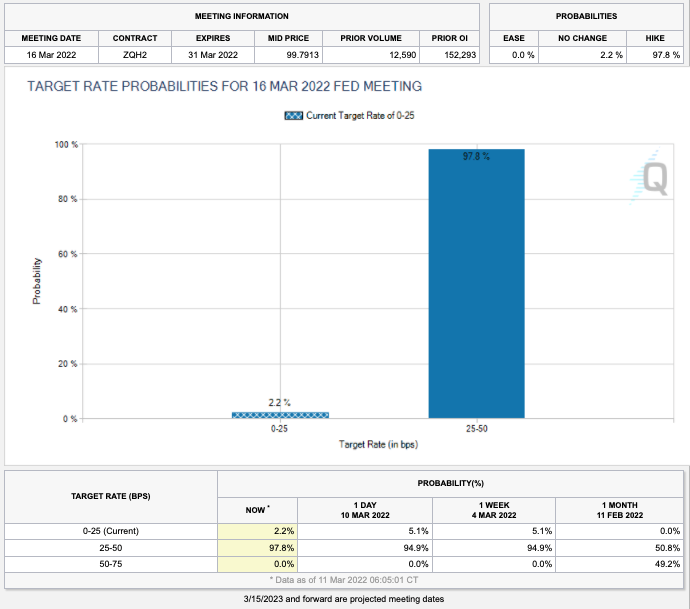
As revealed by metrics like CME Group Inc’s (NASDAQ: CME) FedWatch Tool, for instance, participants are pricing a high certainty of an increase in rates.

Graphic: Via CME Group Inc (NASDAQ: CME). Participants price in an increased probability of a shift in the target rate. Click here to access the FedWatch Tool.

“Yields are reflecting a surprise higher shift upward in inflation expectations,” said Morgan Stanley’s (NYSE: MS) Jim Caron. “Many thought inflation would peak in the first quarter and fall. Now, with oil prices, inflation may stay high.”

At the same time, there are some indications of market stresses.

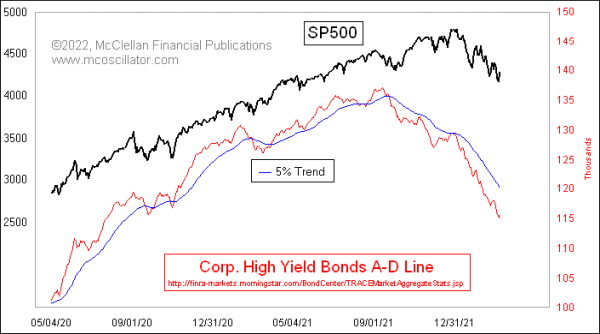
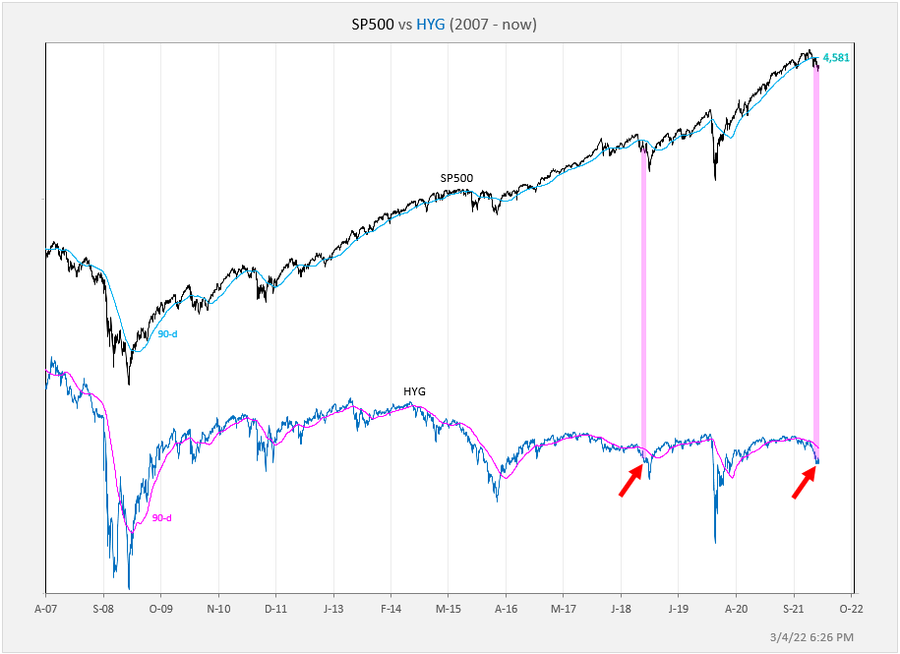
Graphic: Via McClellan Financial Publications. “The Daily A-D Line for corporate high yield bonds continues to look quite ugly. That is a concern for the overall stock market because high yield bonds drink from the same liquidity pool as stocks do, and these bonds are arguably more sensitive than stocks are to liquidity problems.”

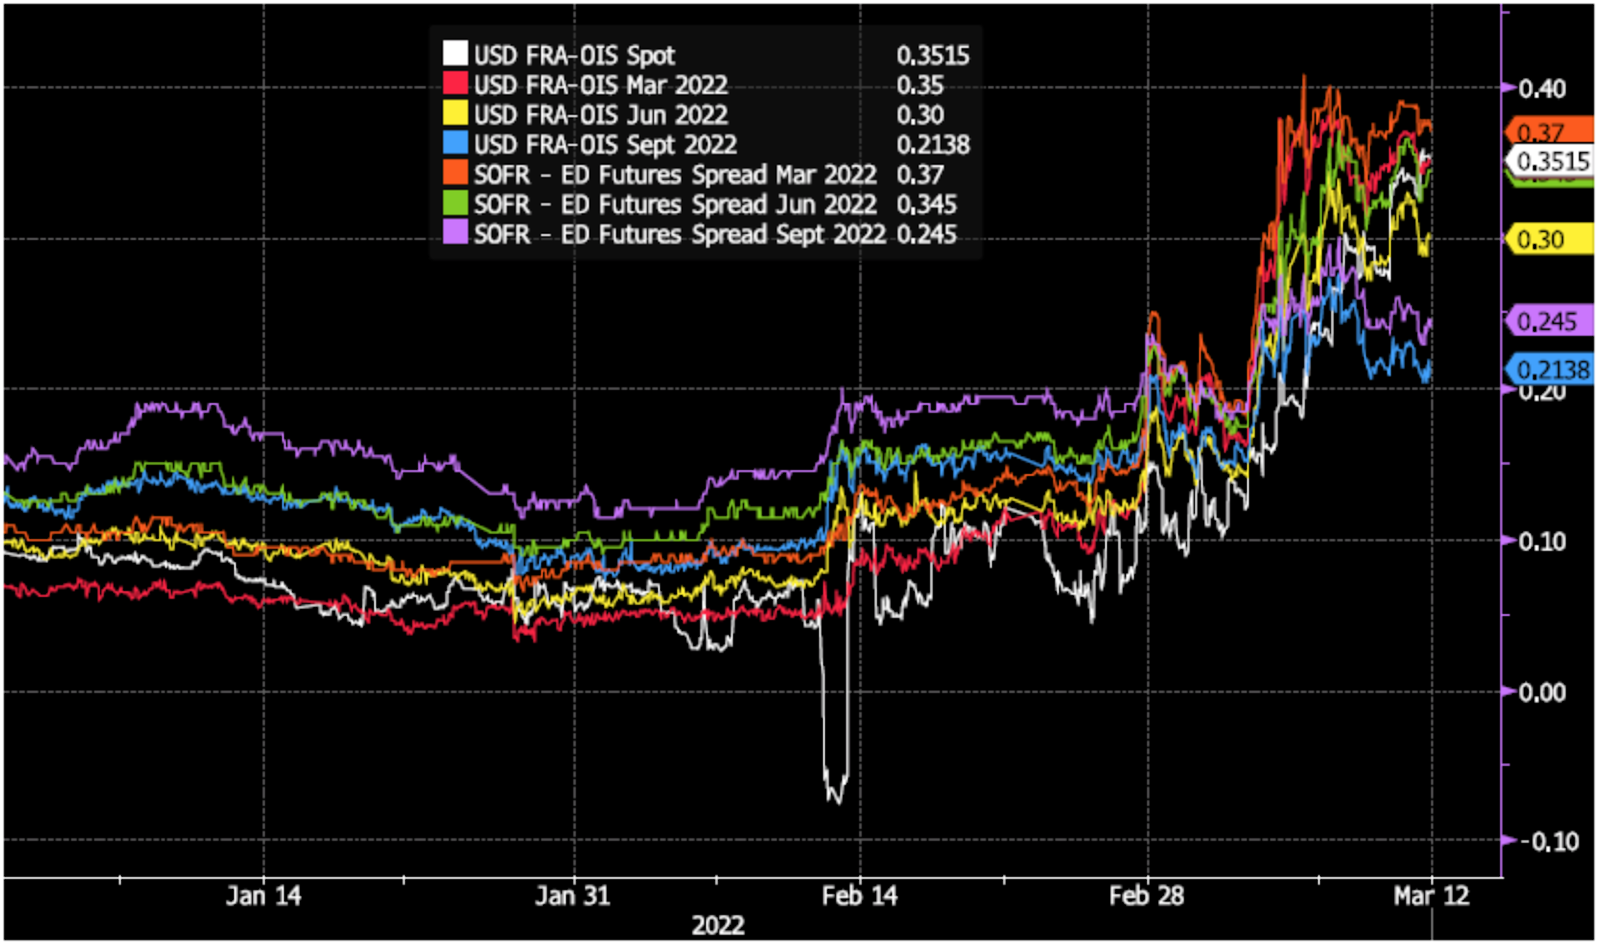
As explained in DC’s Chartbook discussion, however, “stress in money markets is for now mostly contained and not an imminent risk to financial sustainability.”

Graphic: Via DC’s Chartbook. Funding spreads “have stabilized over the past week, not making new highs after the gap-up open on March 7. These are encouraging signs that the stress in money markets is for now mostly contained and not an imminent risk to financial stability.”

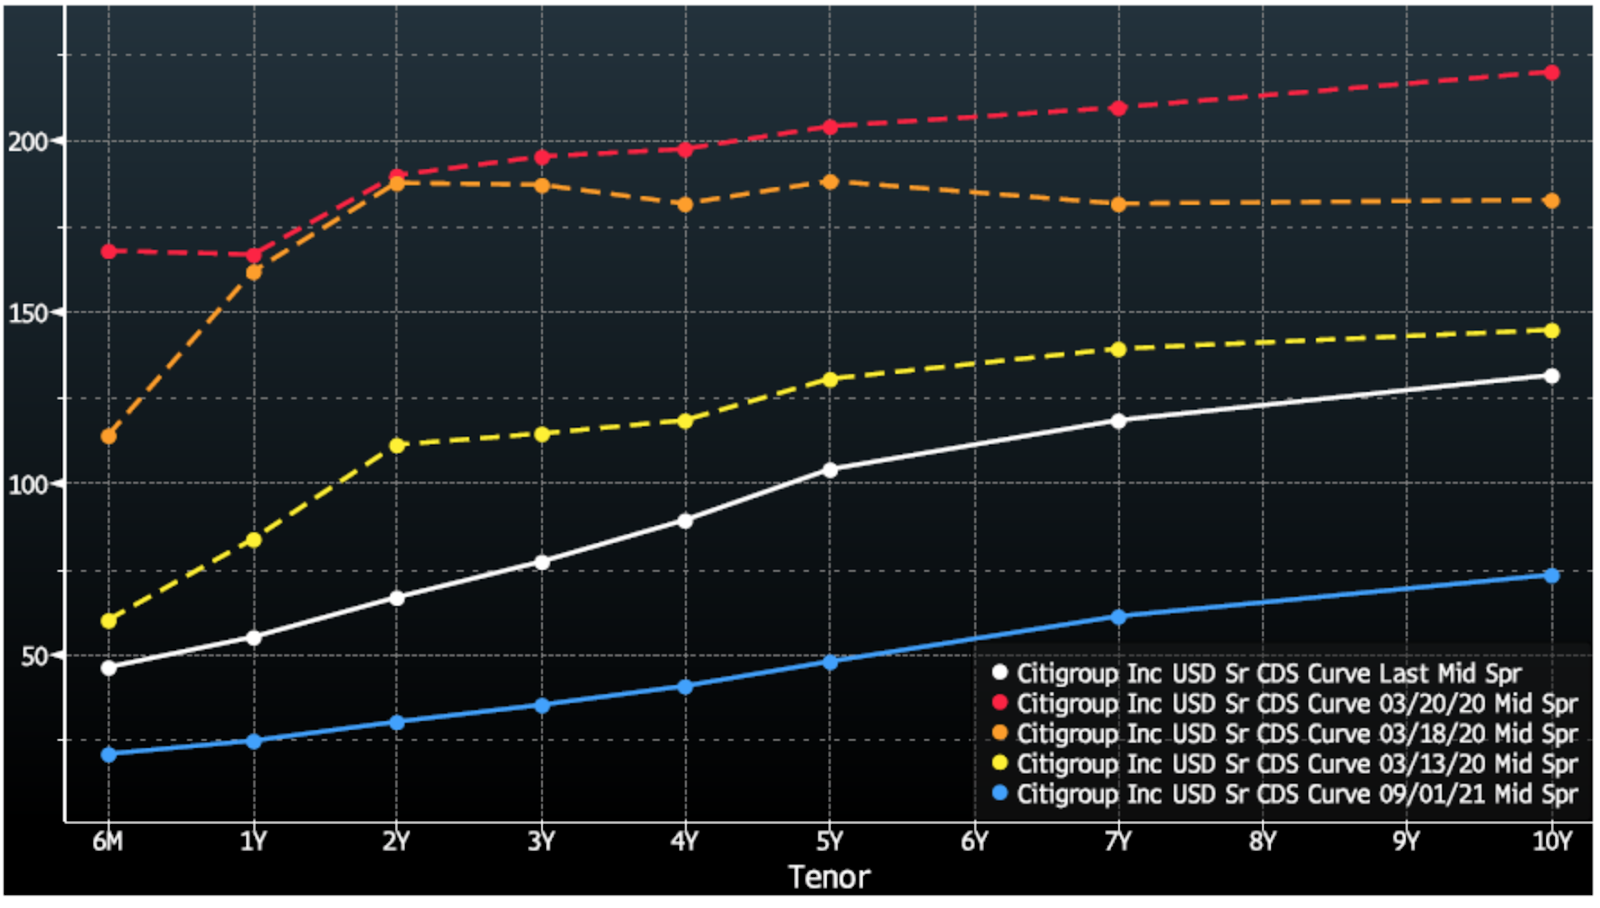
In regards to credit default swap spreads, though they are wider than in recent history, “they are still far below where they were during times of material solvency risk such as March of 2020, and the term structure of CDS spreads suggests this is more due to mechanical de-risking.”

Graphic: Via DC’s Chartbook. Cost of credit insurance for Citigroup Inc (NYSE: C). Hedging with CDS results in mechanical steepening which raises the curve. “This is in sharp contrast to the curve in March 2020 (yellow, orange, and red), when the short end of the CDS curve rose quickly and flattened the curve.”

Okay. So, the “financial system is functioning smoothly.” How do you trade slowing growth in the face of heightened inflation?

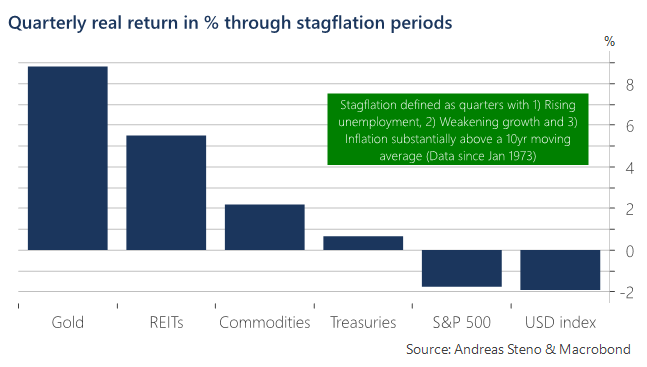
As Andreas Steno Larsen of Heimstaden explains, the “best way to assess this question is via a historical study of empirical returns during times of actual stagflation dating back to the early 1970s.”

Graphic: Via Andreas Steno Larsen. “Heatmap on quarterly inflation-adjusted returns across asset classes during stagflation periods (1973 – today).”

“Assets that tend to keep the value intact or even increase in real terms through stagflation are typically negatively correlated to low or negative real rates, which is why gold and real estate (REITs) are some of the best places to hide during stagflation,” Steno Larsen says. 

“Equities overall struggle to perform in real terms and so do bonds, which might be even worse this time around due to the outset of bond yields into this potential stagflationary environment.”

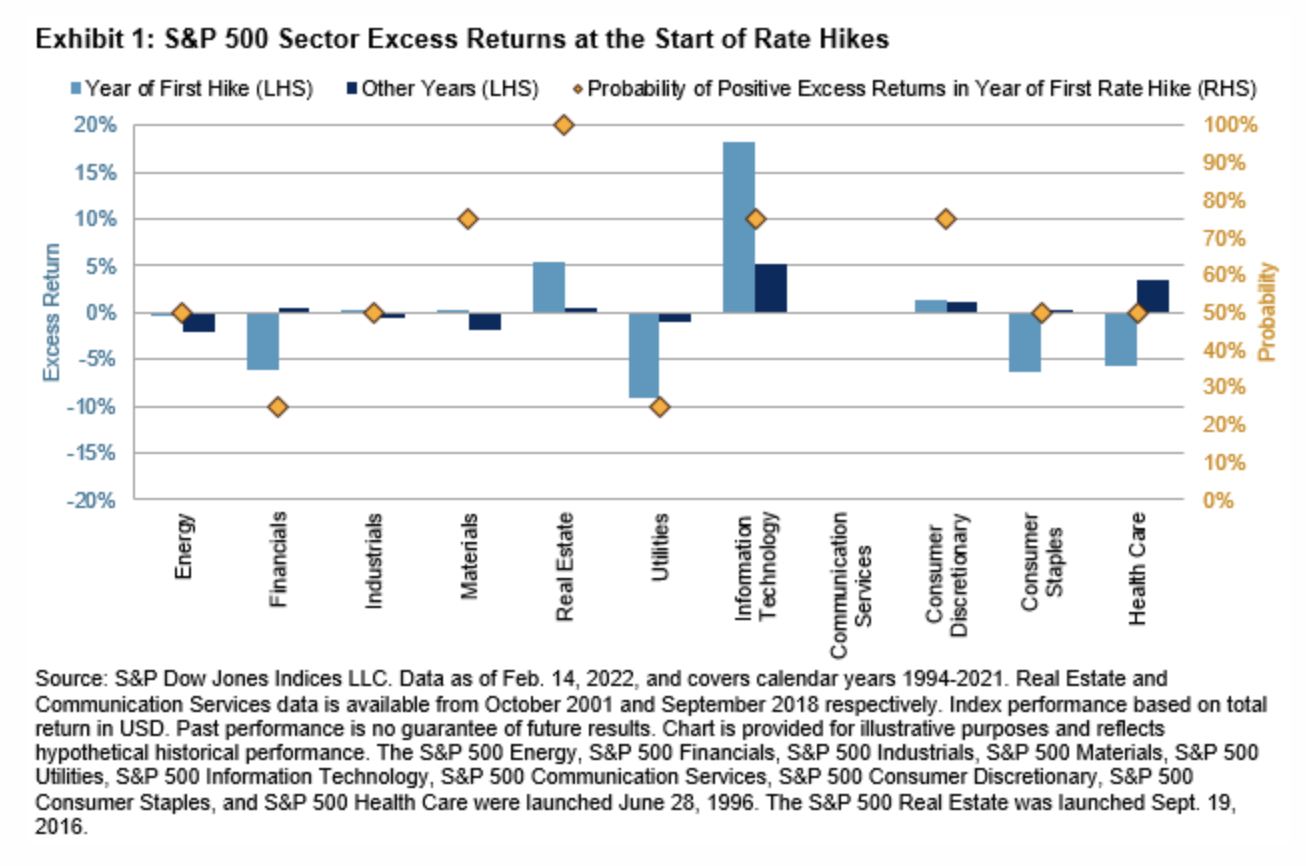
To note, pursuant to the idea that participants have “priced in” the aforementioned, S&P Global Inc (NYSE: SPGI) data suggests “the initial stages of a monetary tightening cycle have not been disastrous for the U.S. stock market historically.”

Graphic: Via S&P Global.

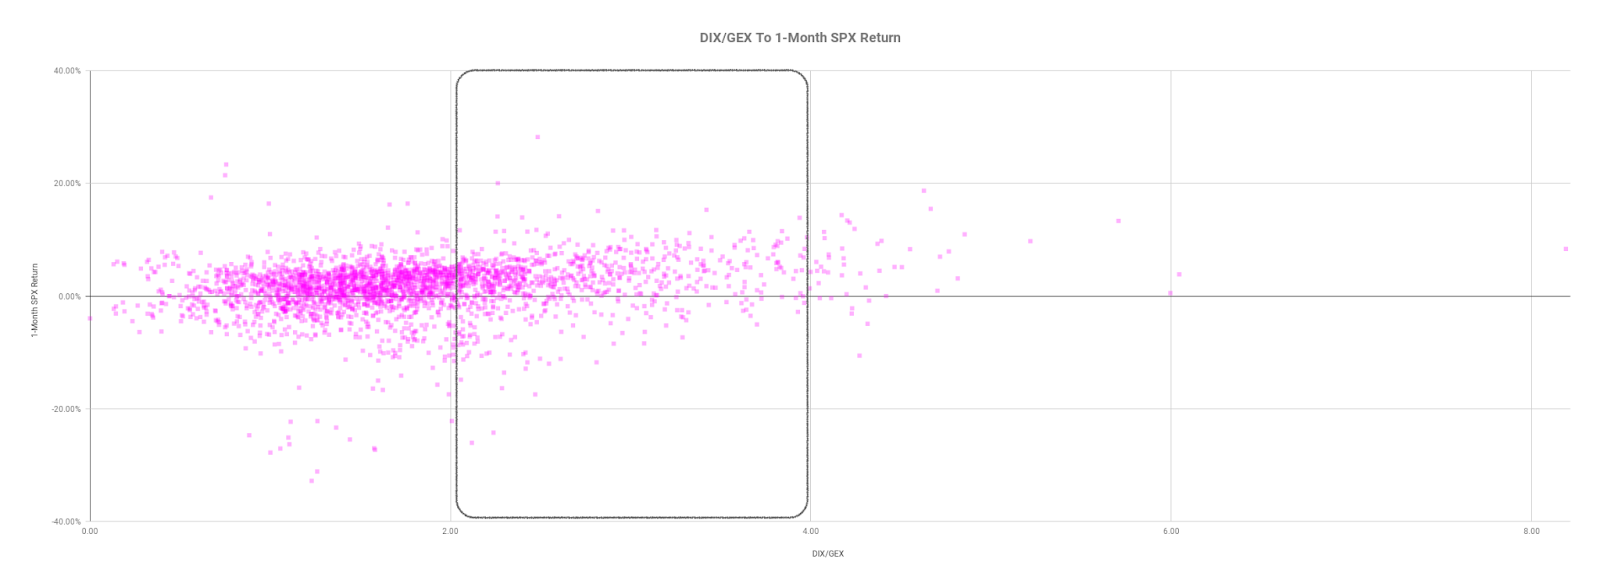
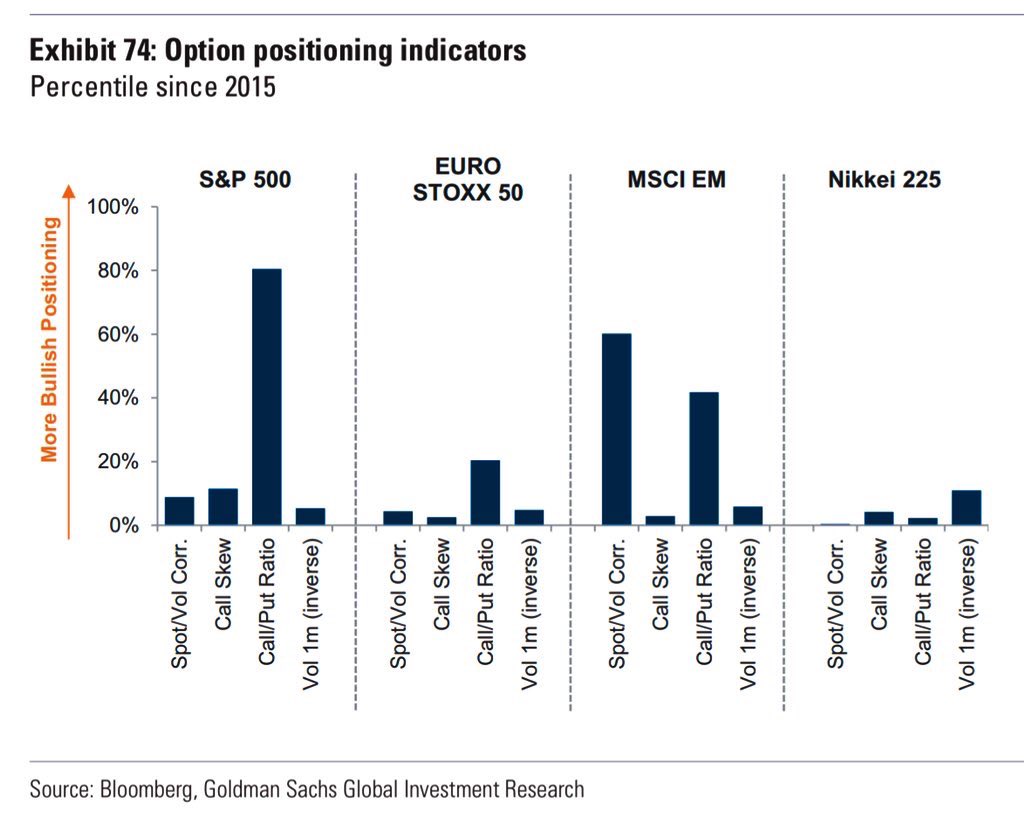
Positioning: Based on a comparison of present options positioning and buying metrics, the returns distribution is skewed positive.

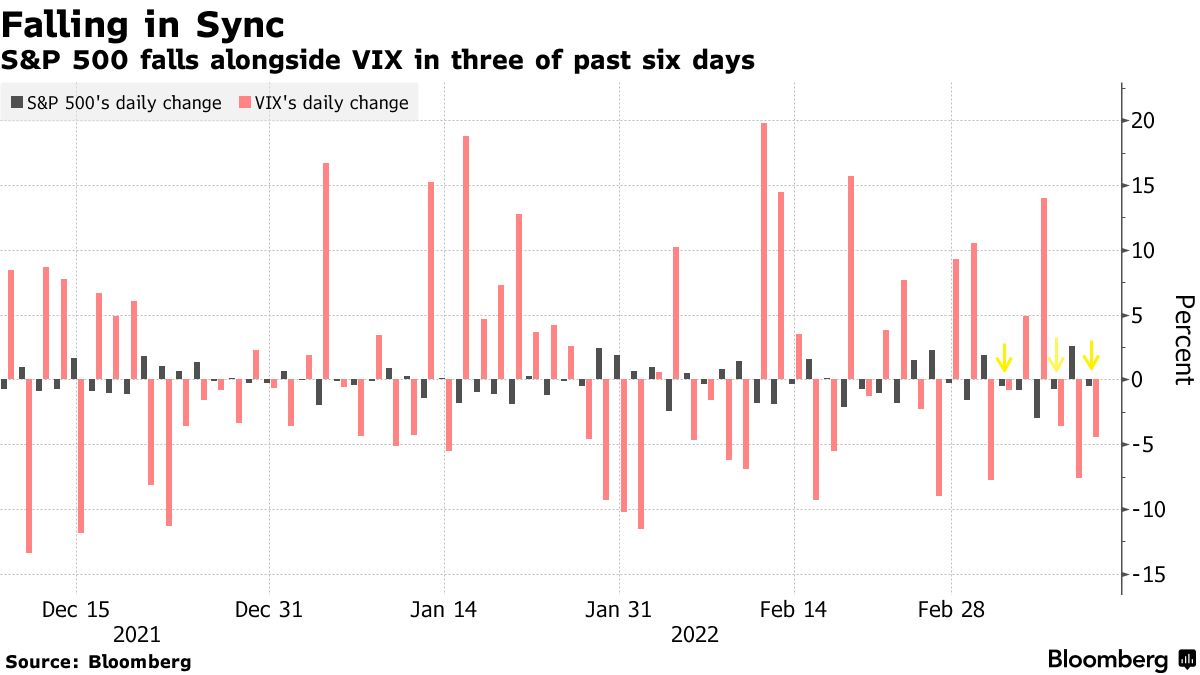
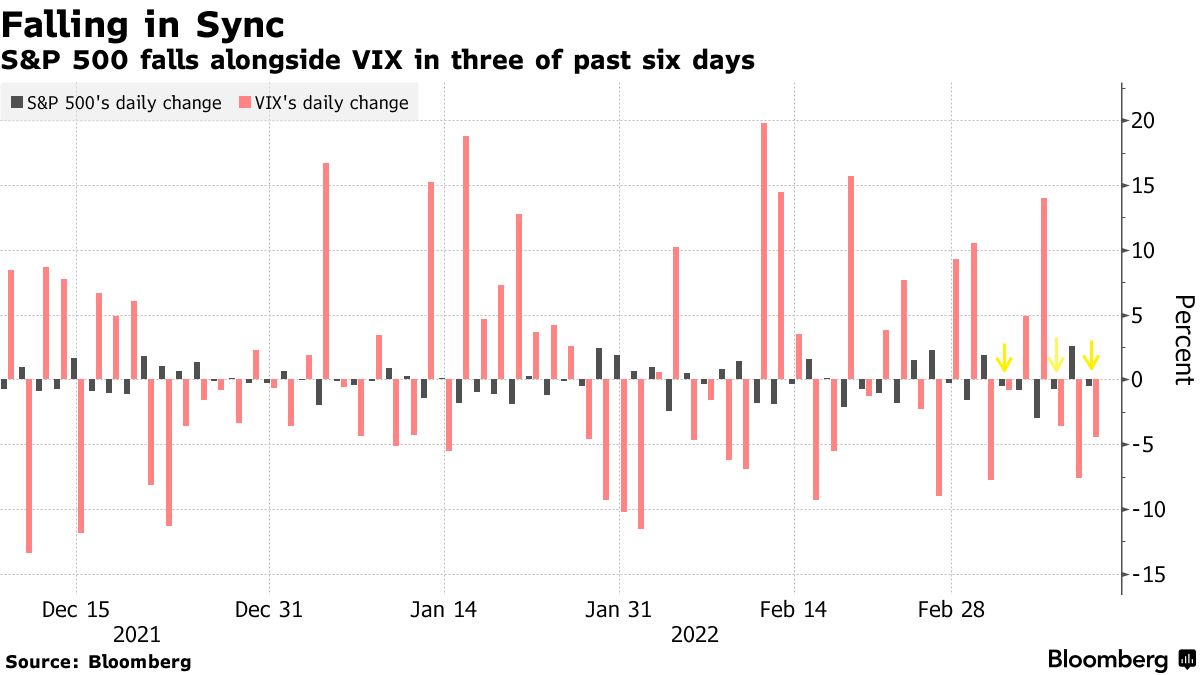
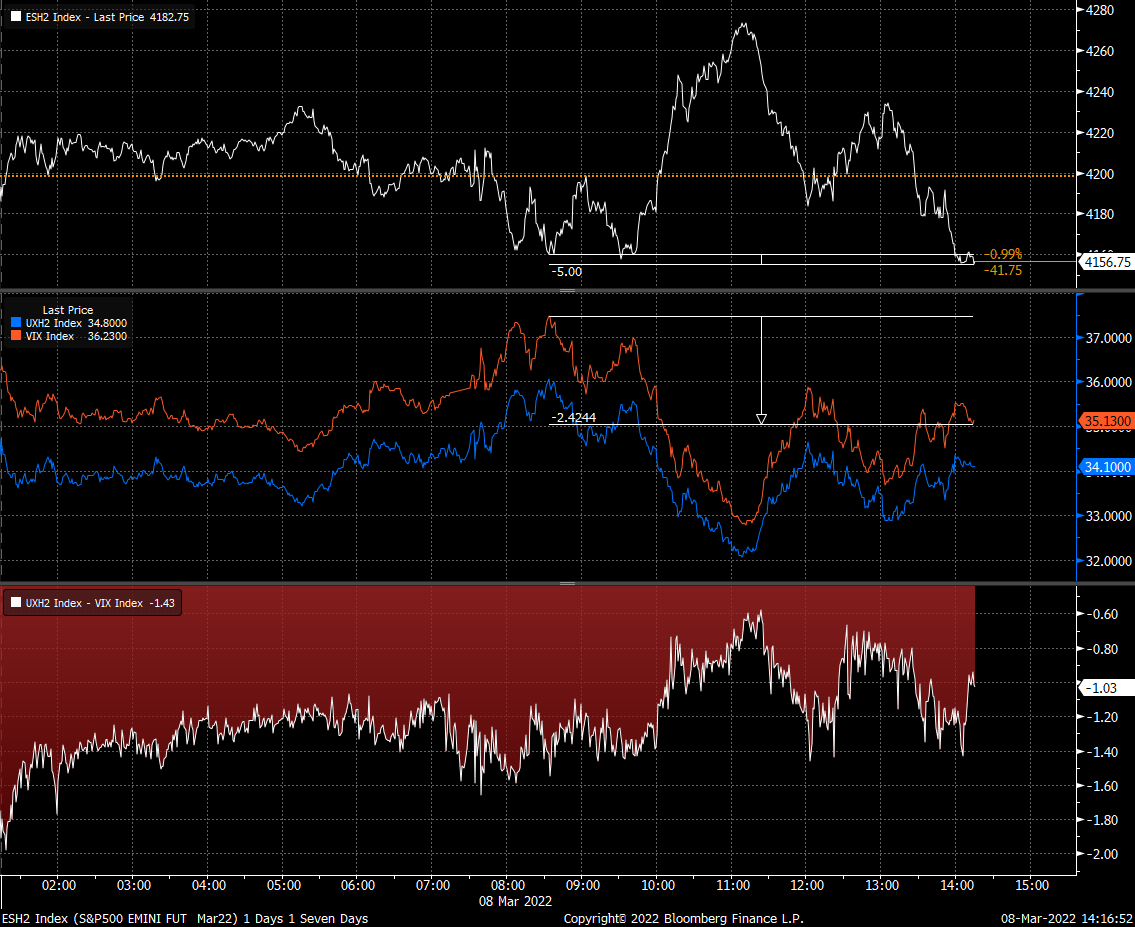
This is in the face of an S&P 500 (INDEX: SPX) and Cboe Volatility Index (INDEX: VIX) down environment.

Graphic: Via Bloomberg. S&P 500 (INDEX: SPX) down, CBOE Volatility Index (INDEX: VIX) down.

In part, this has to do with the supply and demand of protection; mainly, the market is “well hedged and well-positioned,” Amy Wu Silverman of Royal Bank of Canada’s (NYSE: RY) says

Graphic: Via SpotGamma. “Netting call & put delta, you can see we’re near extremes in terms of put:call positions. Often large put positions are removed by expirations, which seems to coincide with market lows. Many of these are quarterly expirations which coincide w/FOMC meetings – such as next week.”

Given this, as JPMorgan Chase & Co (NYSE: JPM) analysts explain, “we could be closer to the end” of discretionary de-risking, and the compression of volatility (via passage of FOMC), as well as the removal of counterparty negative exposure (via OPEX) may serve to alleviate pressure. 

Graphic: Via Goldman Sachs Group Inc (NYSE: GS). Taken from The Market Ear. “18-Mar has more expiring near-the-money SPX open interest than any expiration since 2019.”

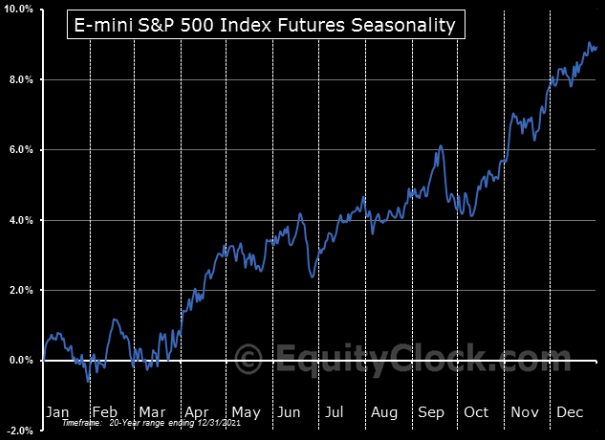
As SpotGamma, explains, “As it stands, without further geopolitical events causing, even more, fear, the markets are due for a relief rally,” on improving seasonality, among other things. 

“Following the FOMC meeting, as well as the reduction in put-heavy exposures post-OPEX (options expiration), the need for put ownership (protection) and relative short positions is reduced (less positive delta = less selling to hedge = less pressure).”

Graphic: Via EquityClock. Taken from The Market Ear.

Technical: As of 6:30 AM ET, Monday’s regular session (9:30 AM – 4:00 PM ET), in the S&P 500, will likely open in the middle part of a positively skewed overnight inventory, inside of prior-range and -value, suggesting a limited potential for immediate directional opportunity.

In the best case, the S&P 500 trades higher; activity above the $4,227.75 high volume area (HVNode) puts in play the $4,249.25 low volume area (LVNode). Initiative trade beyond the LVNode could reach as high as the $4,285.25 and $4,314.75 HVNode, or higher.

In the worst case, the S&P 500 trades lower; activity below the $4,227.75 HVNode puts in play the $4,189.00 regular trade low (RTH Low). Initiative trade beyond the RTH Low could reach as low as the $4,138.75 and $4,101.25 overnight low (ONL), or lower.

Considerations: Participants resolve a pinch of two anchored volume-weighted average price indicators (VWAPs). A VWAP is a metric highly regarded by chief investment officers, among other participants, for quality of trade. Additionally, liquidity algorithms are benchmarked and programmed to buy and sell around VWAPs.

We look to buy above a flat/rising VWAP pinch. We look to sell below a flat/declining VWAP pinch.

Click here to load today’s key levels into the web-based TradingView charting platform. Note that all levels are derived using the 65-minute timeframe. New links are produced, daily.
Graphic: 65-minute profile chart of the Micro E-mini S&P 500 Futures.

Definitions

Overnight Rally Highs (Lows): Typically, there is a low historical probability associated with overnight rally-highs (lows) ending the upside (downside) discovery process.

Volume Areas: A structurally sound market will build on areas of high volume (HVNodes). Should the market trend for long periods of time, it will lack sound structure, identified as low volume areas (LVNodes). LVNodes denote directional conviction and ought to offer support on any test. 

If participants were to auction and find acceptance into areas of prior low volume (LVNodes), then future discovery ought to be volatile and quick as participants look to HVNodes for favorable entry or exit.

POCs: POCs are valuable as they denote areas where two-sided trade was most prevalent in a prior day session. Participants will respond to future tests of value as they offer favorable entry and exit.

About

After years of self-education, strategy development, mentorship, and trial-and-error, Renato Leonard Capelj began trading full-time and founded Physik Invest to detail his methods, research, and performance in the markets.

Capelj is also a Benzinga finance and technology reporter interviewing the likes of Shark Tank’s Kevin O’Leary, JC2 Ventures’ John Chambers, FTX’s Sam Bankman-Fried, and ARK Invest’s Catherine Wood, as well as a SpotGamma contributor developing insights around impactful options market dynamics.

Disclaimer

Physik Invest does not carry the right to provide advice.

In no way should the materials herein be construed as advice. Derivatives carry a substantial risk of loss. All content is for informational purposes only.

Categories
Commentary

Daily Brief For March 11, 2022

Editor’s Note: The Daily Brief is a free glimpse into the prevailing fundamental and technical drivers of U.S. equity market products. Join the 200+ that read this report daily, below!

What Happened

On reports that there was progress in talks between Russia and Ukraine, stock index futures advanced putting the S&P 500 back inside a large consolidation area.

Thus far, trade has been volatile and responsive to key visual levels suggesting that the larger other time frame (non-technical) participants are waiting for more information to initiate trades.

Ahead is data on the University of Michigan Sentiment (10:00 AM ET) and inflation expectations (10:00 AM ET).

Graphic updated 6:45 AM ET. Sentiment Risk-On if expected /ES open is above the prior day’s range. /ES levels are derived from the profile graphic at the bottom of the following section. Levels may have changed since initially quoted; click here for the latest levels. SqueezeMetrics Dark Pool Index (DIX) and Gamma (GEX) calculations are based on where the prior day’s reading falls with respect to the MAX and MIN of all occurrences available. A higher DIX is bullish. At the same time, the lower the GEX, the more (expected) volatility. Learn the implications of volatility, direction, and moneyness. SHIFT data used for S&P 500 (INDEX: SPX) options activity. Note that options flow is sorted by the call premium spent; if more positive, then more was spent on call options. Breadth reflects a reading of the prior day’s NYSE Advance/Decline indicator. VIX reflects a current reading of the CBOE Volatility Index (INDEX: VIX) from 0-100.

What To Expect

Fundamental: Yesterday’s letter covered a lot of ground. Check it out if you haven’t already.

Volatility is heightened and the narratives we may attribute that to are concerned with the intent to tighten monetary policy, slower economic growth, and geopolitics.

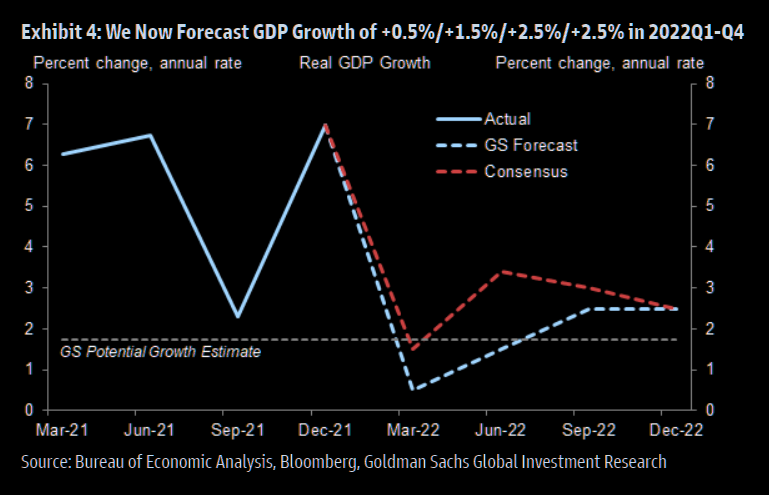
Graphic: Via Goldman Sachs Group Inc (NYSE: GS). Taken from The Market Ear. “We are downgrading our US GDP forecast to reflect higher oil prices and other drags on growth related to the war in Ukraine.”

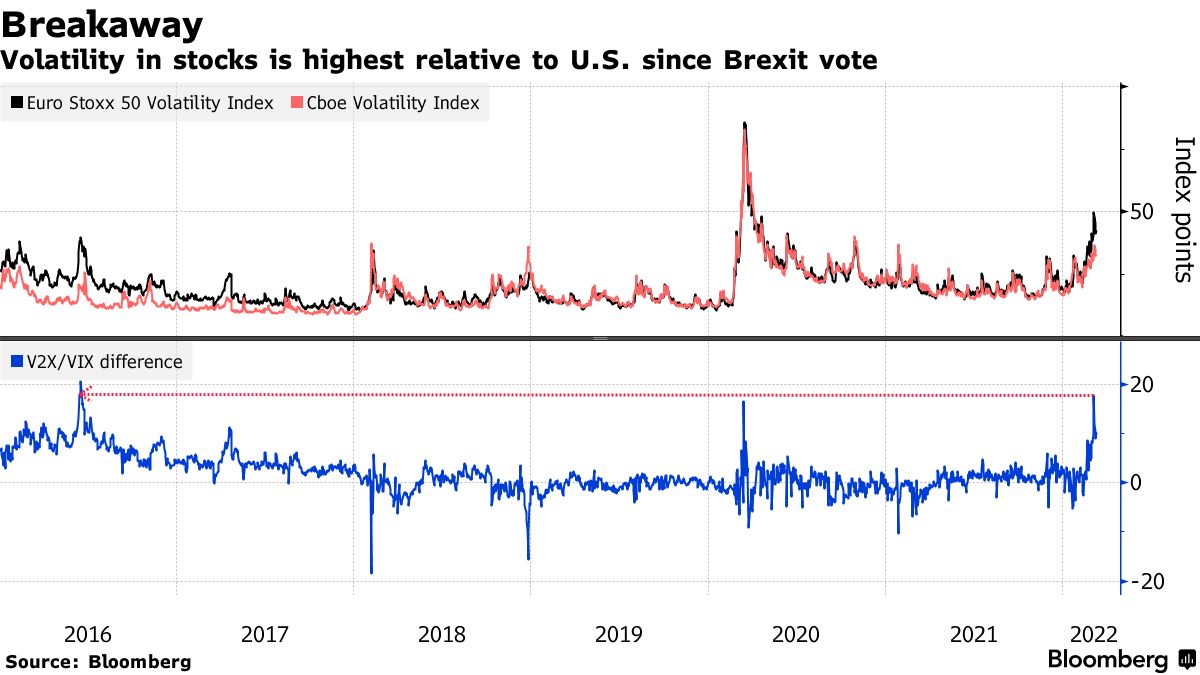
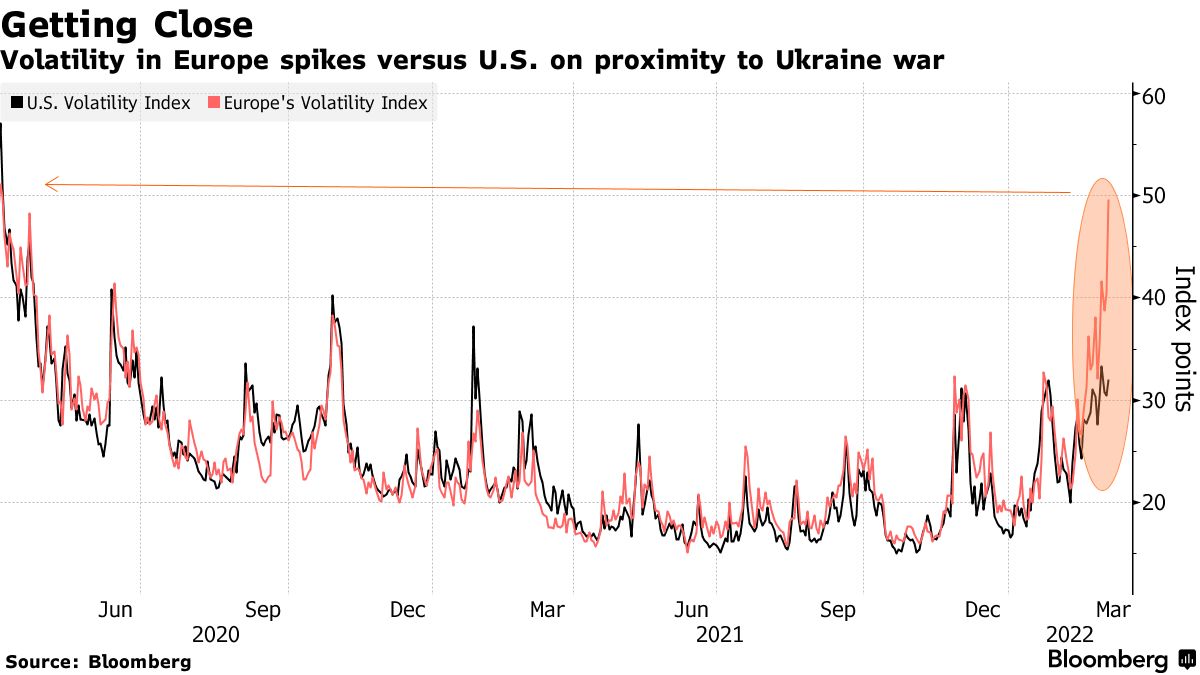
In comparison, though, U.S. equity product volatility is less than that in Europe and this points to the “risk premium for investing in Europe’s markets that are teeming with cyclical stocks acutely vulnerable to growth and inflation risks,” among other things.

Adding to the turbulence was the European Central Bank’s pivot toward hawkishness; the institution will accelerate the wind-down of its monetary stimulus. Pursuant to this decision, Euro-area equity funds had their largest weekly outflows on record.

Graphic: Via Bloomberg. 

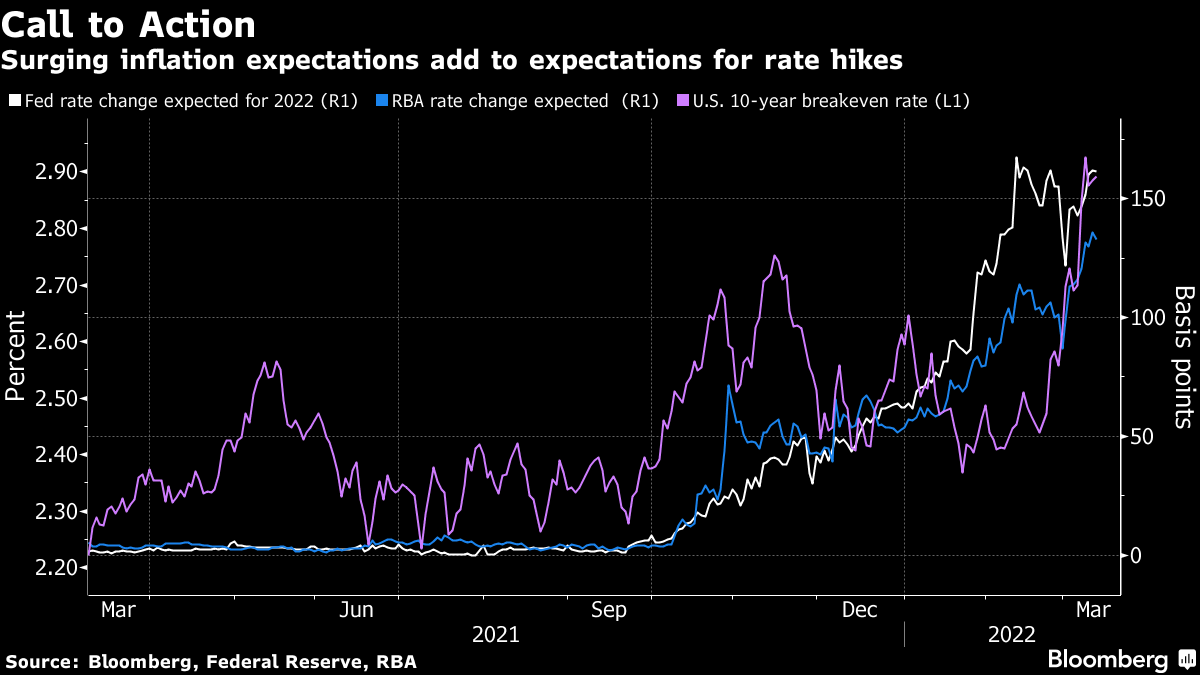
U.S. policymakers are expected to ramp their tightening efforts, next week, also, as inflation expectations are surging.

Graphic: Via Bloomberg. “[T]he central bank is widely expected to announce a 25-basis point increase Wednesday, along with fresh projections for the economy and path of interest rates.”

Per CME Group Inc’s (NASDAQ: CME) FedWatch Tool, participants are pricing a near 100% chance of a hike in the target rate.

Graphic: Via CME Group Inc (NASDAQ: CME). Participants price in an increased probability of a shift in the target rate. Click here to access the FedWatch Tool.

In the face of all the bearish narratives, however, many products – at the single-stock level – have been de-rating now for nearly a year. 

Ahead of bullish seasonality and rebalancing flow (from fixed income into equities), JPMorgan Chase & Co (NYSE: JPM) strategists suggest that “we could be through [the] worst of it.” 

“When either All Strats or Equity L/S net leverage fell by at least 1.5z or more, the SPX generally rallied over the next 1wk and 4wks,” a bulletin published by The Market Ear read. 

Positioning: Based on a comparison of present options positioning and buying metrics, the returns distribution is skewed positive, albeit less so than before. 

Graphic: Via Physik Invest. Data via SqueezeMetrics.

Adding, over the past weeks, we talked about the SPX and VIX down dynamic. This in part has to do with the supply and demand of protection, at the index level. Hyperlinked are our past conversations.

Graphic: Via Bloomberg. S&P 500 (INDEX: SPX) down, CBOE Volatility Index (INDEX: VIX) down.

“We’re back to another point of people being well hedged and well-positioned,” Amy Wu Silverman of Royal Bank of Canada’s (NYSE: RY) capital markets group, said. 

“You’re also seeing people selling that volatility and doing some overwriting. That can probably dampen volatility.”

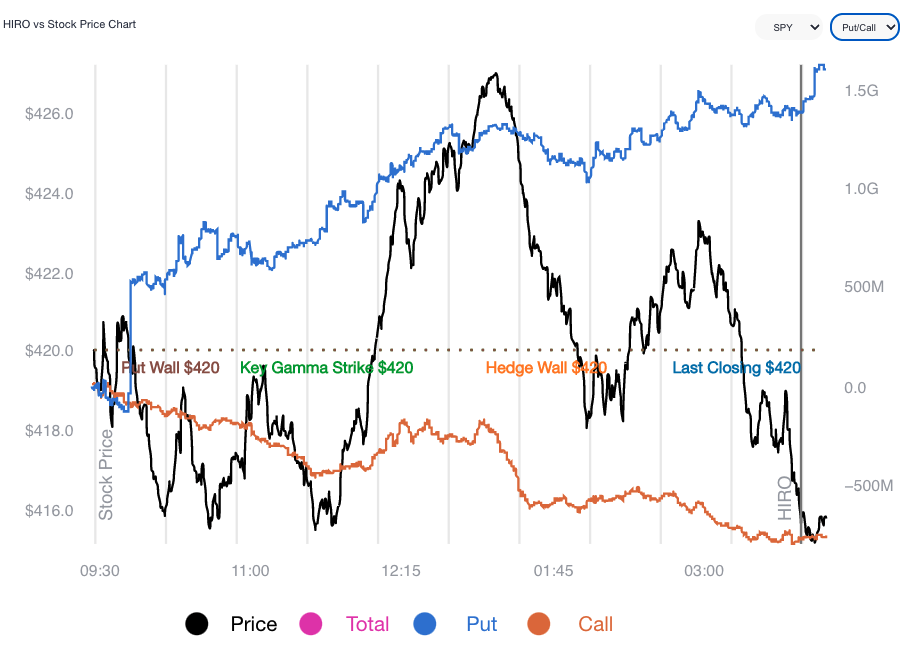
Graphic: SpotGamma’s Hedging Impact of Real-Time Options (HIRO) indicator for the SPDR S&P 500 ETF Trust (NYSE: SPY). Into the S&P 500’s March 8, 2022 decline, participants sold volatility on both sides of the options chain.

“When implied volatility is high, that same 1% move lower is much more ‘expected’ so there generally won’t be the same upward pressure on volatility and in fact it might decline,” said Christopher Jacobson, a strategist at Susquehanna Financial Group LLP.

“Along the same lines, investors at that point have had more opportunity and time to hedge, so those same market moves may not lead to as much hedging activity.”

Graphic: Via SpotGamma. “Netting call & put delta, you can see we’re near extremes in terms of put:call positions. Often large put positions are removed by expirations, which seems to coincide with market lows. Many of these are quarterly expirations which coincide w/FOMC meetings – such as next week.”

Taking this together, in accordance with metrics referred to earlier, “we could be closer to the end than the beginning of the discretionary de-risking,” as JPMorgan analysts best explain.

Further, the compression of volatility (via passage of FOMC) or removal of counterparty negative exposure (via OPEX) may serve to alleviate some of this pressure

Until then, participants can expect the options landscape to add to market volatility.

Technical: As of 6:30 AM ET, Friday’s regular session (9:30 AM – 4:00 PM ET), in the S&P 500, will likely open in the upper part of a positively skewed overnight inventory, outside of prior-range and -value, suggesting a potential for immediate directional opportunity.

Balance-Break + Gap Scenarios: A change in the market (i.e., the transition from two-time frame trade, or balance, to one-time frame trade, or trend) is occurring.

Monitor for acceptance (i.e., more than 1-hour of trade) outside of the balance area. 

Leaving value behind on a gap-fill or failing to fill a gap (i.e., remaining outside of the prior session’s range) is a go-with indicator. 

Rejection (i.e., return inside of balance) portends a move to the opposite end of the balance.

In the best case, the S&P 500 trades higher; activity above the $4,314.75 high volume area (HVNode) puts in play the $4,346.75 HVNode. Initiative trade beyond the $4,346.75 HVNode could reach as high as the $4,375.00 untested point of control (VPOC) and $4,395.25 HVNode, or higher.

In the worst case, the S&P 500 trades lower; activity below the $4,314.75 HVNode puts in play the $4,285.75 HVNode. Initiative trade beyond the $4,285.75 HVNode could reach as low as the $4,249.25 low volume area (LVNode) and $4,227.75 HVNode, or lower.

Considerations: Push-and-pull, as well as responsiveness near key-technical areas (that are discernable visually on a chart), suggests technically-driven traders with short time horizons are very active. 

Such traders often lack the wherewithal to defend retests and, additionally, the type of trade may be indicative of the other time frame participants waiting for more information to initiate trades.

Click here to load today’s key levels into the web-based TradingView charting platform. Note that all levels are derived using the 65-minute timeframe. New links are produced, daily.
Graphic: 65-minute profile chart of the Micro E-mini S&P 500 Futures.

What People Are Saying

Definitions

Overnight Rally Highs (Lows): Typically, there is a low historical probability associated with overnight rally-highs (lows) ending the upside (downside) discovery process.

Volume Areas: A structurally sound market will build on areas of high volume (HVNodes). Should the market trend for long periods of time, it will lack sound structure, identified as low volume areas (LVNodes). LVNodes denote directional conviction and ought to offer support on any test. 

If participants were to auction and find acceptance into areas of prior low volume (LVNodes), then future discovery ought to be volatile and quick as participants look to HVNodes for favorable entry or exit.

POCs: POCs are valuable as they denote areas where two-sided trade was most prevalent in a prior day session. Participants will respond to future tests of value as they offer favorable entry and exit.

About

After years of self-education, strategy development, mentorship, and trial-and-error, Renato Leonard Capelj began trading full-time and founded Physik Invest to detail his methods, research, and performance in the markets.

Capelj is also a Benzinga finance and technology reporter interviewing the likes of Shark Tank’s Kevin O’Leary, JC2 Ventures’ John Chambers, FTX’s Sam Bankman-Fried, and ARK Invest’s Catherine Wood, as well as a SpotGamma contributor developing insights around impactful options market dynamics.

Disclaimer

Physik Invest does not carry the right to provide advice.

In no way should the materials herein be construed as advice. Derivatives carry a substantial risk of loss. All content is for informational purposes only.
Categories
Commentary

Daily Brief For March 10, 2022

Editor’s Note: The Daily Brief is a free glimpse into the prevailing fundamental and technical drivers of U.S. equity market products. Join the 200+ that read this report daily, below!

What Happened

Overnight, equity index futures auctioned lower practically negating the prior day’s advance. Per the news, Ukraine and Russia failed in their efforts to end the war.

Adding, similar to days prior, areas where there are key technical nuances served as supports and resistances. One may construe this as short-term traders’ dominance in the smaller time horizons while the other time frames are positioning for expansive moves (yet to happen).

To note, key metrics under the hood (SpotGamma’s HIRO, among other things) yesterday, further validated the status quo and short-covering.

Moreover, ahead is data on jobless claims and the consumer price index (8:30 AM ET). Later, participants get data on real domestic nonfinancial debt and wealth (1:00 PM ET), as well as the budget deficit (2:00 PM ET).

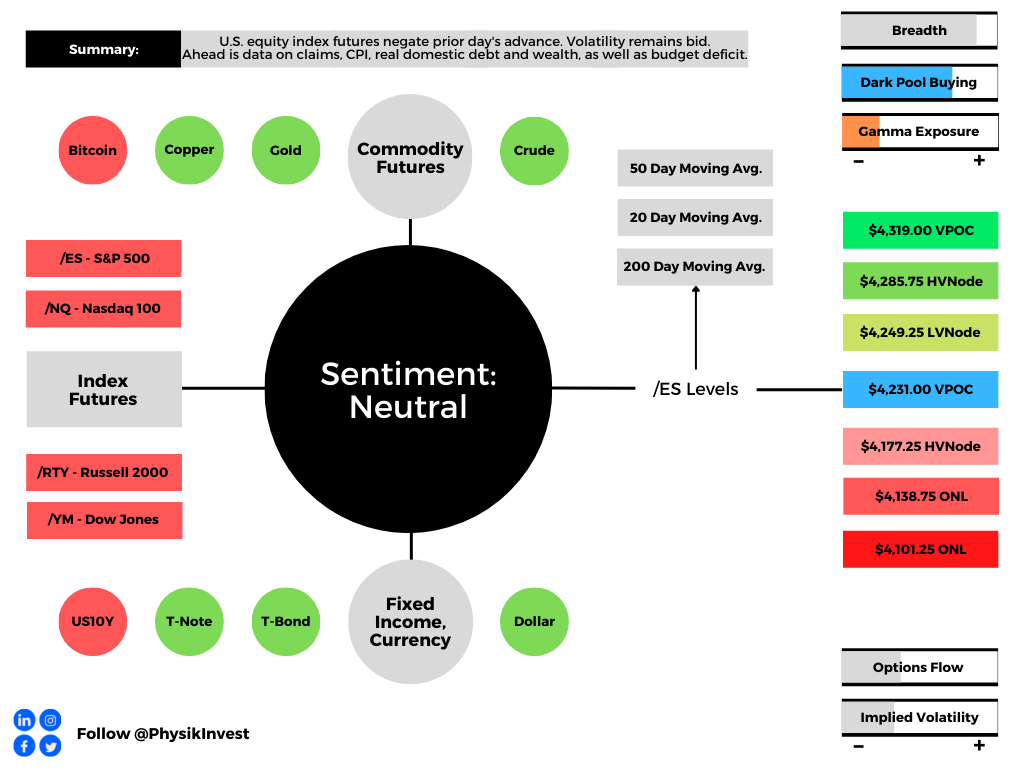
Graphic updated 6:40 AM ET. Sentiment Neutral if expected /ES open is inside of the prior day’s range. /ES levels are derived from the profile graphic at the bottom of the following section. Levels may have changed since initially quoted; click here for the latest levels. SqueezeMetrics Dark Pool Index (DIX) and Gamma (GEX) calculations are based on where the prior day’s reading falls with respect to the MAX and MIN of all occurrences available. A higher DIX is bullish. At the same time, the lower the GEX, the more (expected) volatility. Learn the implications of volatility, direction, and moneyness. SHIFT data used for S&P 500 (INDEX: SPX) options activity. Note that options flow is sorted by the call premium spent; if more positive, then more was spent on call options. Breadth reflects a reading of the prior day’s NYSE Advance/Decline indicator. VIX reflects a current reading of the CBOE Volatility Index (INDEX: VIX) from 0-100.

What To Expect

Fundamental: The consumer price index (CPI) is to likely accelerate to 7.8% from a year ago.

This forecast varies widely, however, based on economic analysis with respect to the implications of Russia’s invasion of Ukraine and the sanction that resulted after.  

“There’s going to be a lot of noise in the next six months that’s going to be extremely difficult to disentangle,” said Omair Sharif of Inflation Insights LLC. 

“If you thought it was difficult to figure out what used car prices were doing and whether that was transitory, multiply that by a thousand.”

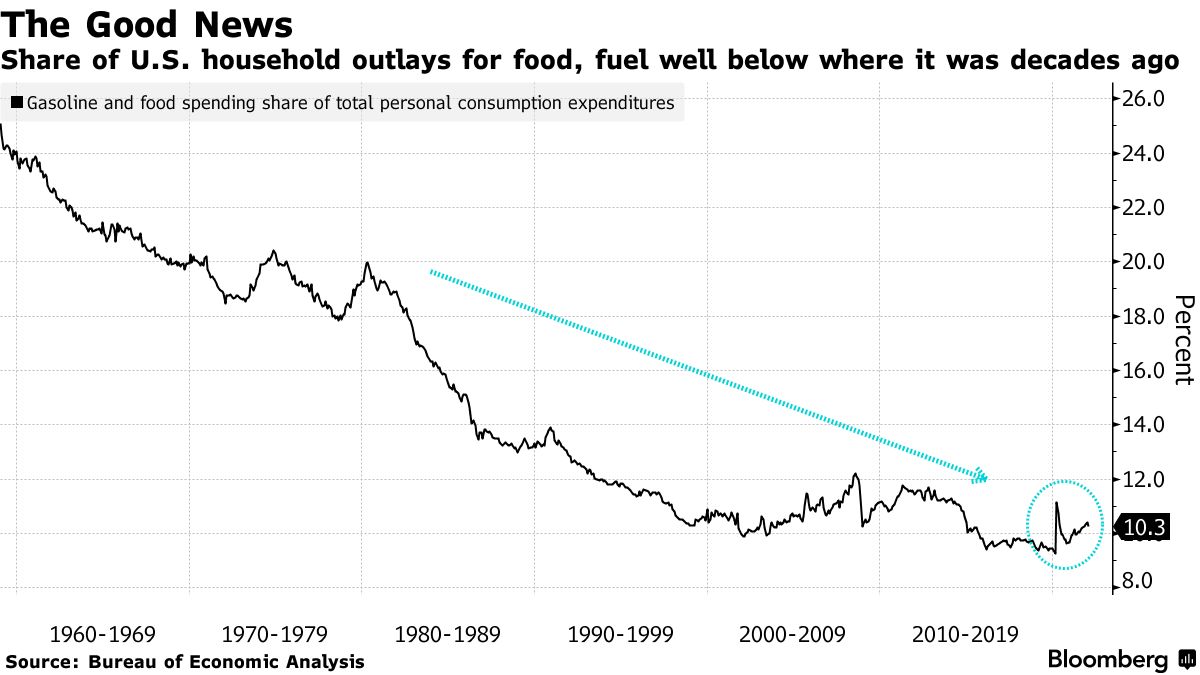
In a mention on energy market volatility, while today’s economy is less dependent on oil (i.e., less likely to kill the expansion), the action in that market (and the responses it may solicit from policymakers, later) is noteworthy.

Graphic: Via Bloomberg. “When families have to spend more money on necessities, they have less to spend on discretionary items and services. Economists at Barclays Plc expect the spike in energy prices to subtract an annualized 0.3 percentage point from consumption growth on average per quarter through the end of 2023.”

Despite a deterioration in the relationship between prices of crude and inflation, oil is “a major input in the economy – it is used in critical activities such as fueling transportation and heating homes – and if input costs rise, so should the cost of end products,” Investopedia says well.

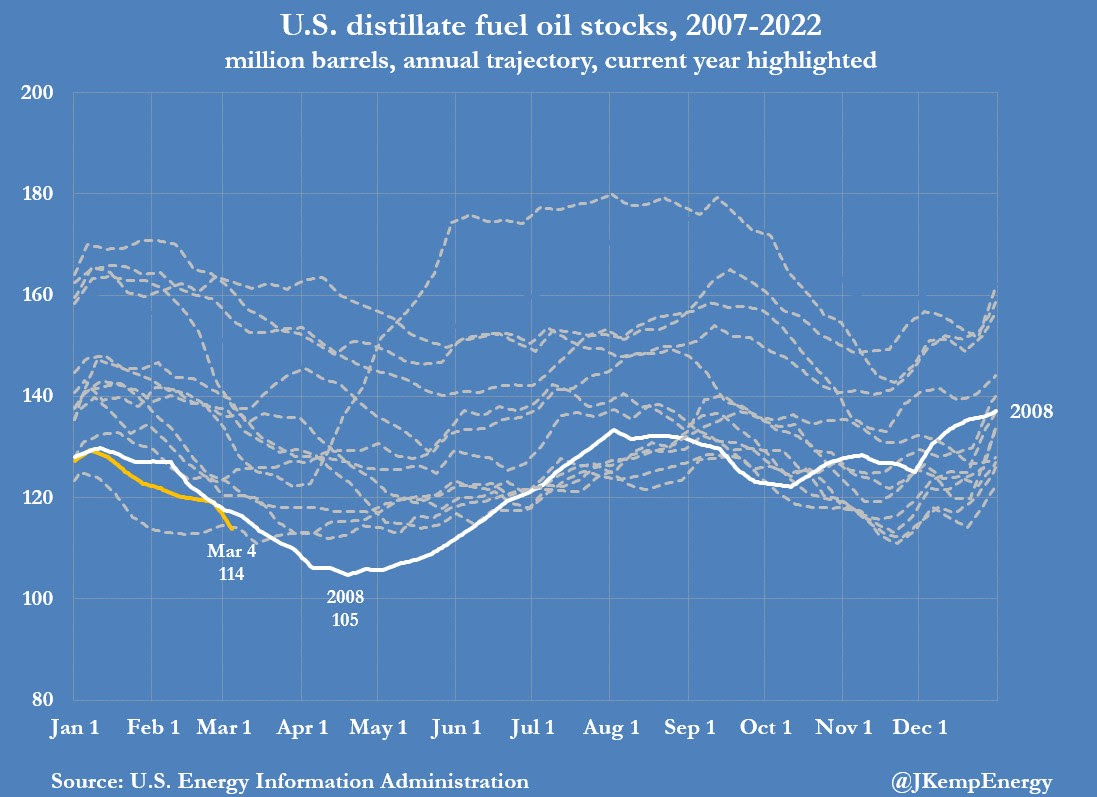
Further, according to Reuters’ John Kemp, fuel oil inventories fell last week to the lowest seasonal level in more than 15 years.

Graphic: Via John Kemp’s “Best in Energy” note. “Distillate stocks were already looking tight and are now on track to become exceptionally tight before mid-year. Distillate inventories are on course for an expected first-half low of 103 million barrels (with a range of 92-114 million).”

“Stocks are on track to hit an even lower seasonal level than 2008 when the distillate shortages helped propel crude oil prices to a record high at the middle of the year,” Kemp says.

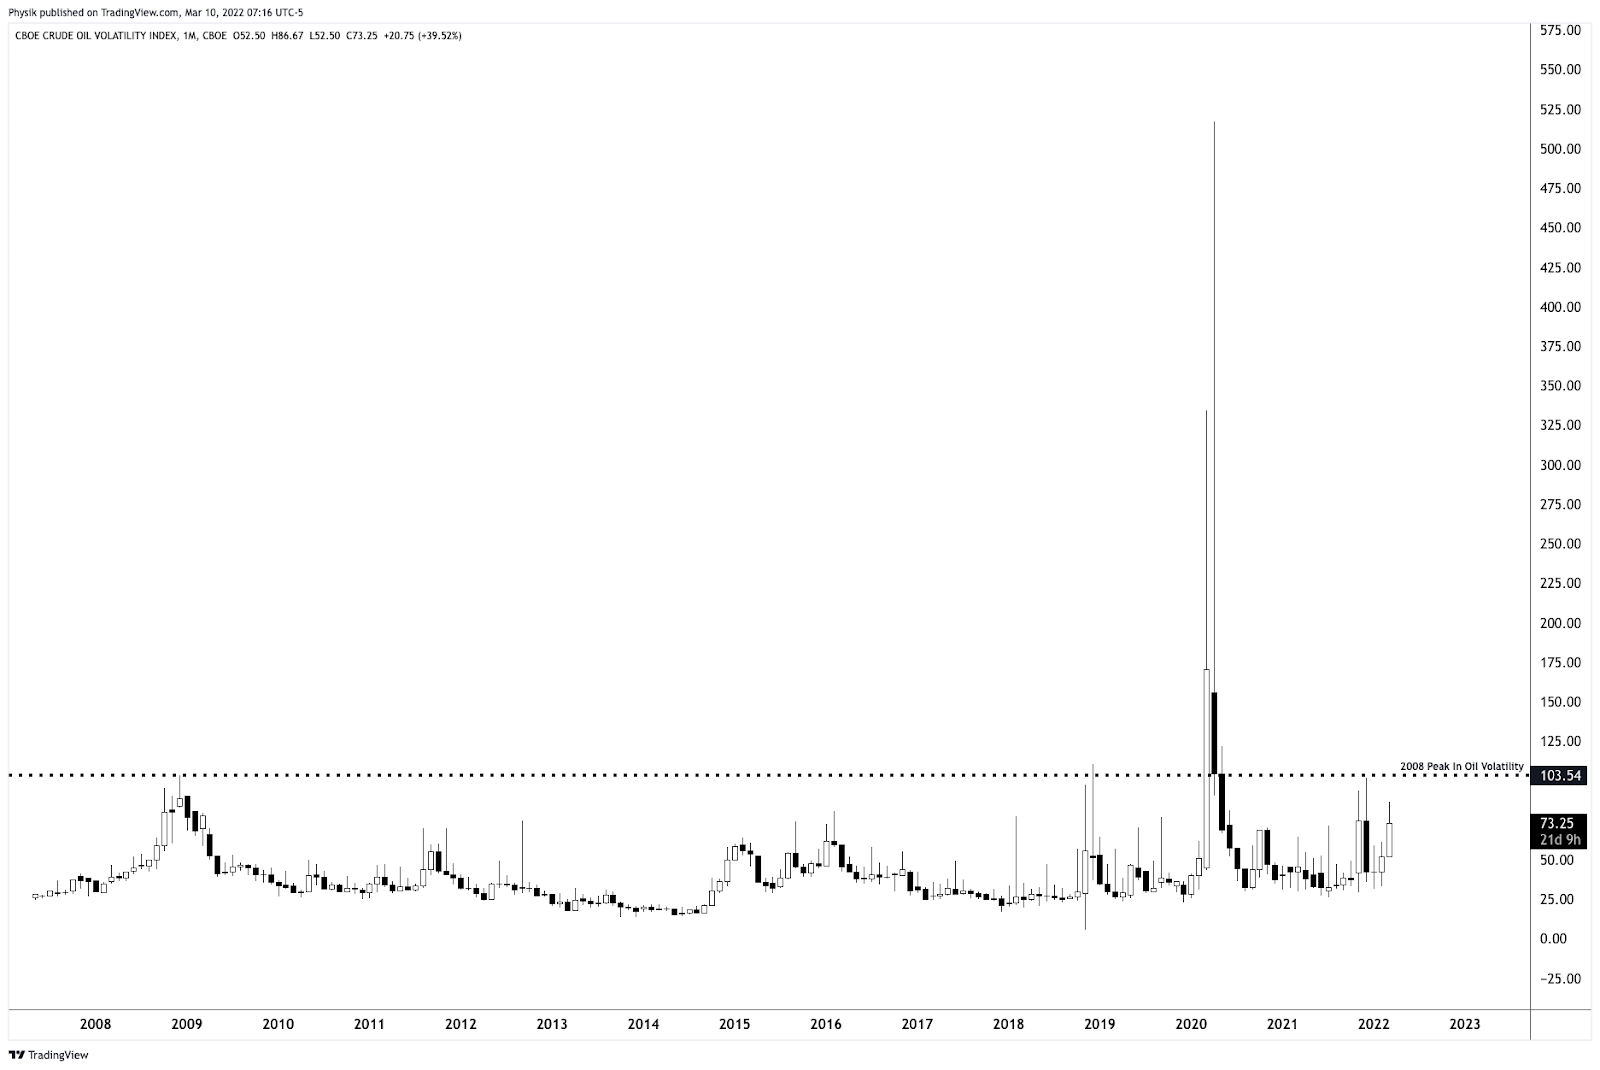
Graphic: Via Physik Invest. The CBOE Crude Oil Volatility Index (INDEX: OVX) reveals signs of peaking.

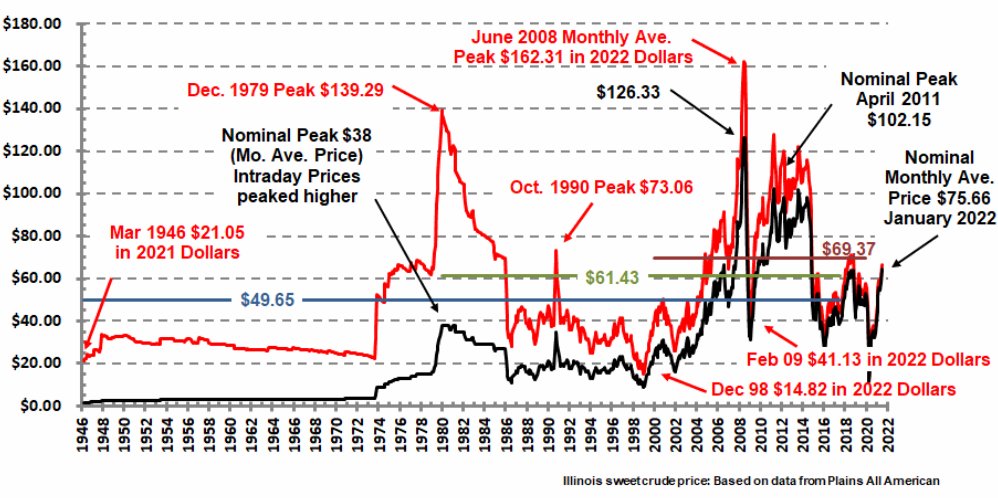
The highest oil prices ~$150/bbl had printed in 2008. As Alfonso Peccatiello of The Macro Compass hypothesizes, “Oil is denominated in fiat currency, and there has been A LOT of spendable money printing over the last 15 years. If you think the market gets as extreme as 2008, the equivalent oil price in today’s USD would be above $250/bbl.”

Given wage growth and the like, consumers likely start “to feel the heat way below $250.”

Graphic: Via Alfonso Peccatiello. “The red line shows the inflation-adjusted crude price: if you expect a proper tight oil environment, >$150-160 is your number. Also, anything above $120 in today’s prices and sustained for a few quarters would likely hit the demand side. 2013-2014 a good example, with the private sector turning defensive in 2015-2016 and China forced to ease big times to shore up the global economy.”

Why mention any of this? Fast moves higher in some of these commodity markets may impact end-consumer prices and behavior, quickly. In a bid to rein inflation – ”very high CPI in 2022, [and] still high in 2023 – central bankers will tighten. 

“The path of least resistance is for the Fed to hike rates from 0% to at least 2% relatively quickly,” Peccatiello explains in a recent post. 

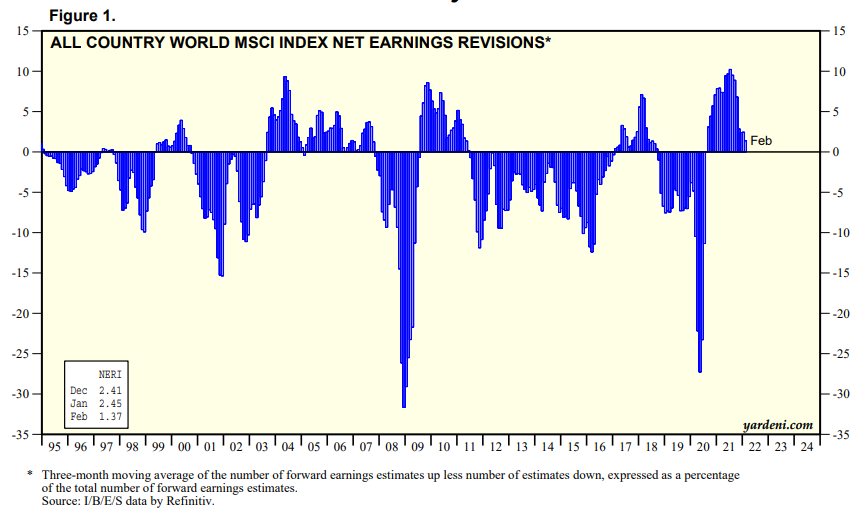
However, the “Last time companies were revising their forward earnings estimates down on a net basis while Central Banks were attempting to tighten monetary policy was mid-2018,” when the markets sold nearly 20%.

Graphic: Via Yardeni Research. Taken from The Macro Compass. “The chart above shows the 3-months average of the MSCI World net earnings revisions: essentially, this metric measures the difference between the number of companies revisiting their forward earnings estimate up versus down.”

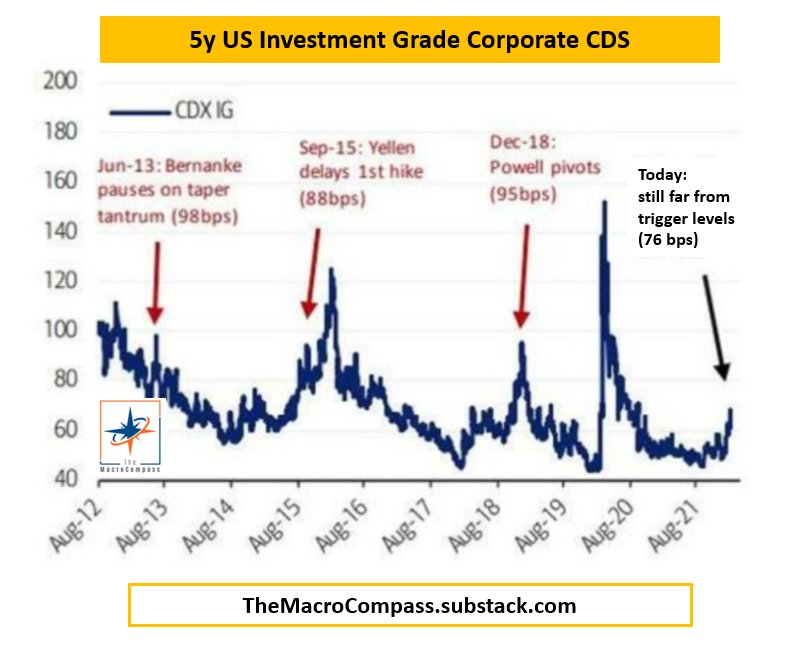
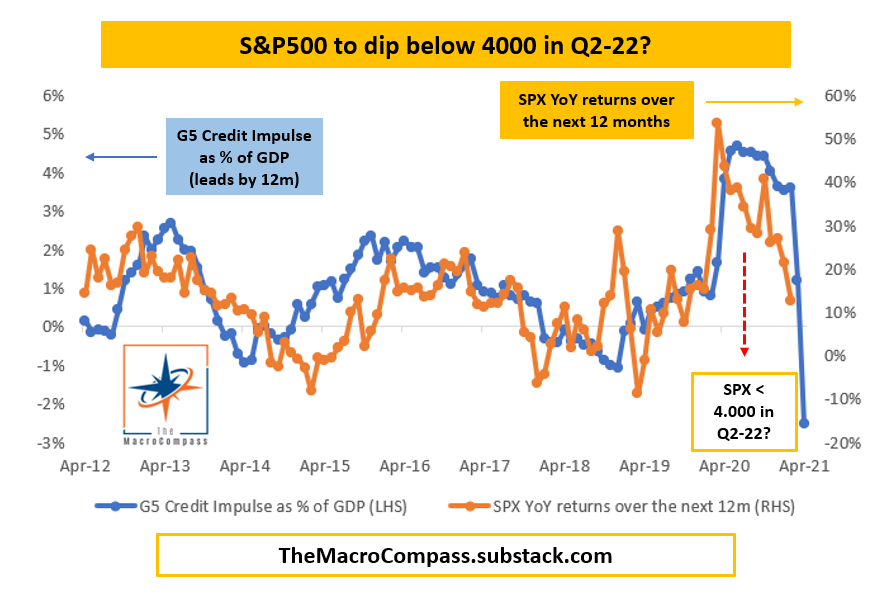
With financial conditions tightening, Peccatiello posits the Fed will be receptive to that.

Graphic: Via The Macro Compass. “Credit-default swaps on 5-year US Investment Grade Corporate Bonds are trading at 76 bps at the time of writing: Fed puts (or pivots) became more visible in the past when this measure of credit spreads approached 100 bps.”

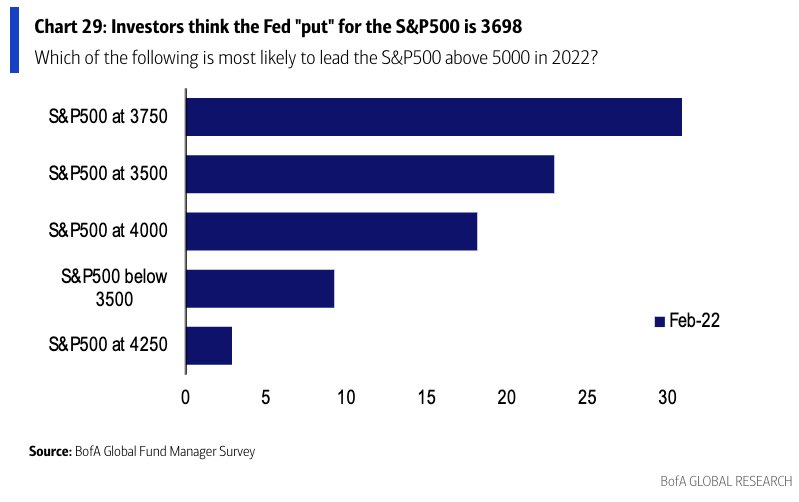
Basically, if selling were to continue, the Fed would reassess tightening. At such level of reassessment is the Fed Put, a dynamic we’ve discussed in the past.

Graphic: Via Bank of America Corporation (NYSE: BAC). Retrieved from Callum Thomas.

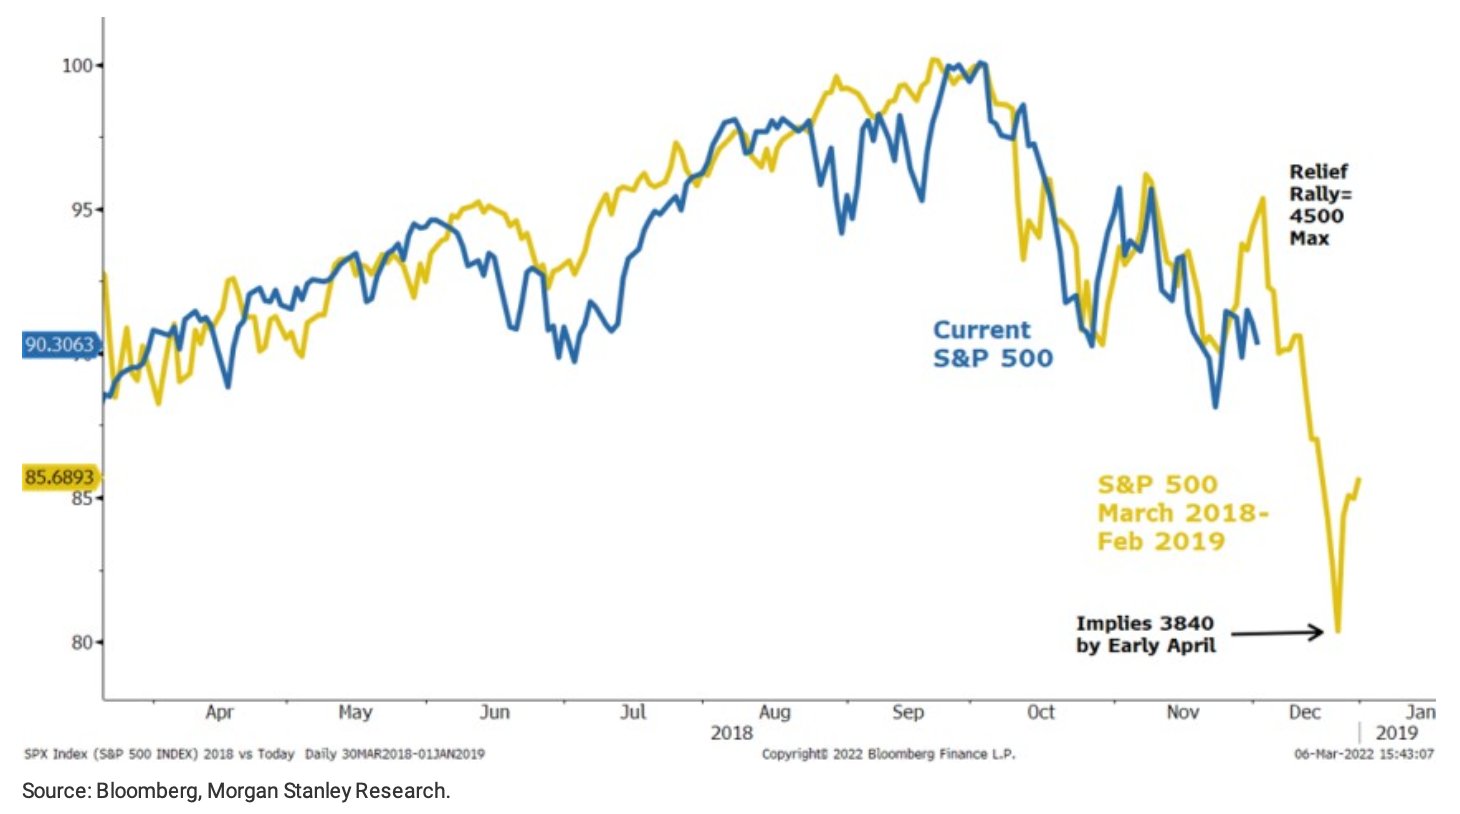
Chamath Palihapitiya recently posted about this, too. He said: “In 2018, the Fed was concerned about inflation. They were wrong and within a quarter or so, the risk shifted to recession. This chart shows how the equity markets reacted… seems eerily similar.”

“Value then faded and Growth ripped.”

Graphic: Via Morgan Stanley (NYSE: MS).

Positioning: Based on a comparison of present options positioning and buying metrics, the returns distribution is skewed positive, albeit less so than before. 

Graphic: Via JPMorgan, from Bloomberg.

Obviously, the fundamental picture and the market’s responsiveness to news events – given the negative gamma environment – has us discounting these metrics. It’s noteworthy, nonetheless.

For instance, in the face of some positive developments abroad, fundamentally, markets diverged from what participants in the options complex were doing.

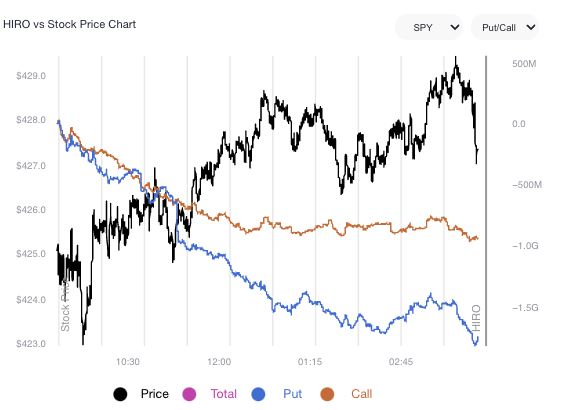
Graphic: SpotGamma’s Hedging Impact of Real-Time Options (HIRO) indicator reveals strong put buying and call selling (a bearish negative delta trade) in the context of Wednesday’s rise.

This divergence resolved itself, some, overnight in the broader market (even in the face of a ~7% price rise of Amazon Inc (NASDAQ: AMZN) large index constituent).

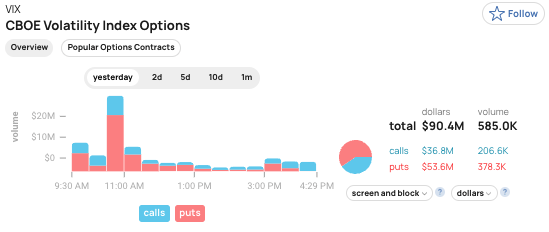
I’d be remiss if I did not point out growing bets on drops in the equity market’s pricing of risk (via the CBOE Volatility Index [INDEX: VIXI]). That would occur if indexes likely rebounded.

Graphic: Via SHIFT. There was heavy buying of the 26 VIX put.

Taken together, it’s difficult to get a grasp of where the market wants to head, in the near term. 

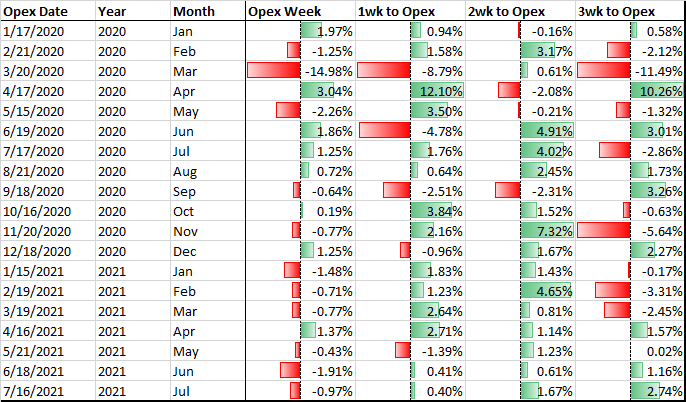
What is for certain: the compression of volatility (via passage of FOMC) or removal of counterparty negative exposure (via OPEX) may serve to alleviate some of this pressure. 

Until then, participants can expect the options landscape to add to market volatility.

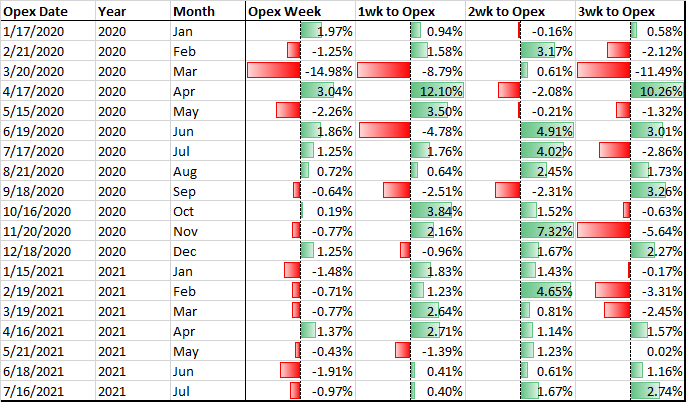
Graphic: @pat_hennessy breaks down returns for the S&P 500, categorized by the week relative to OPEX. 

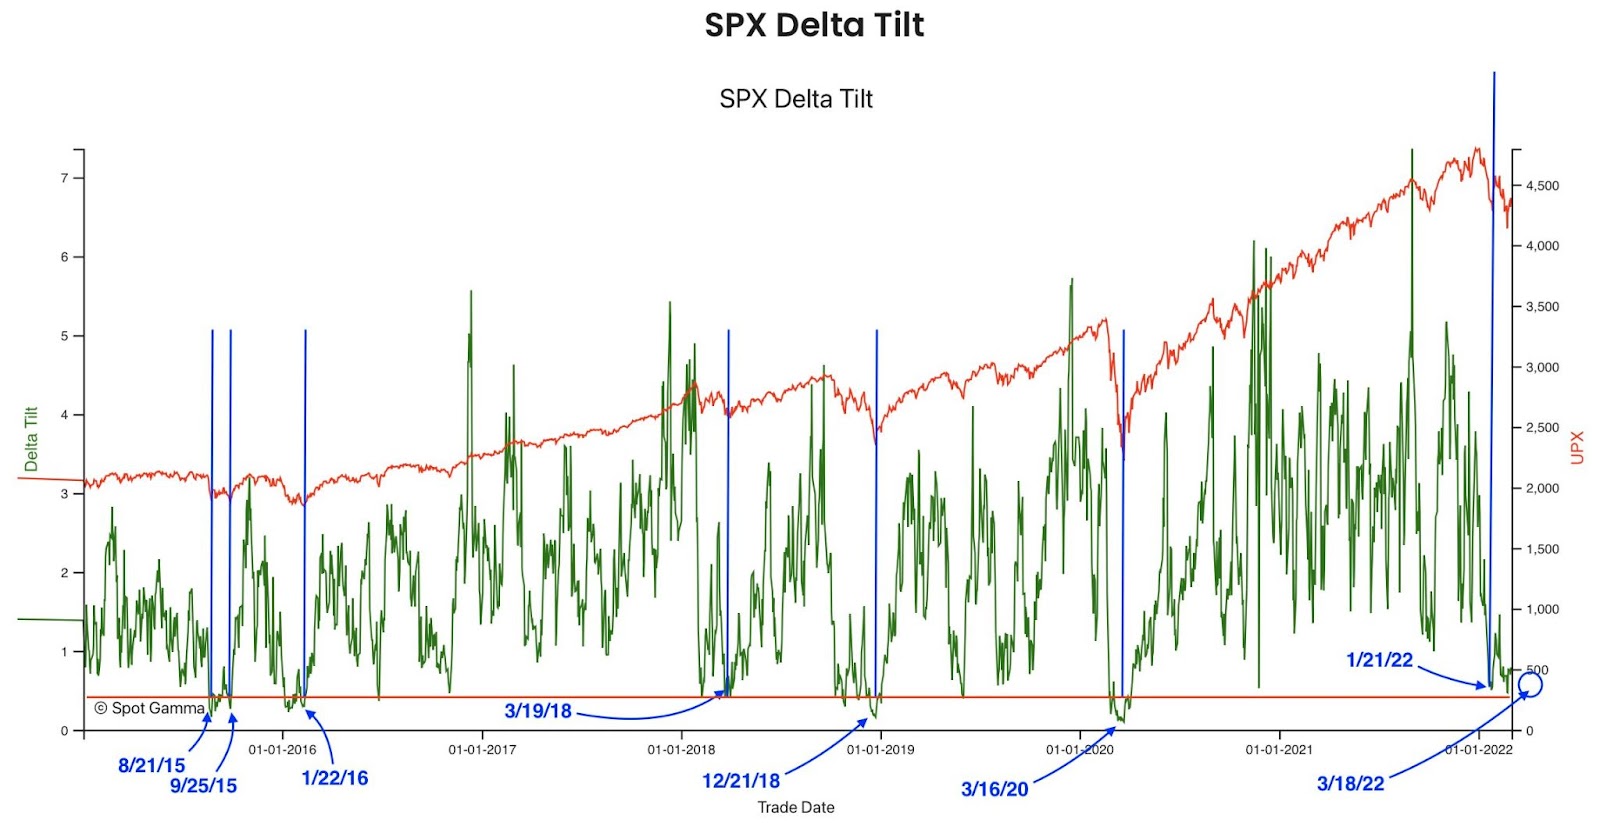
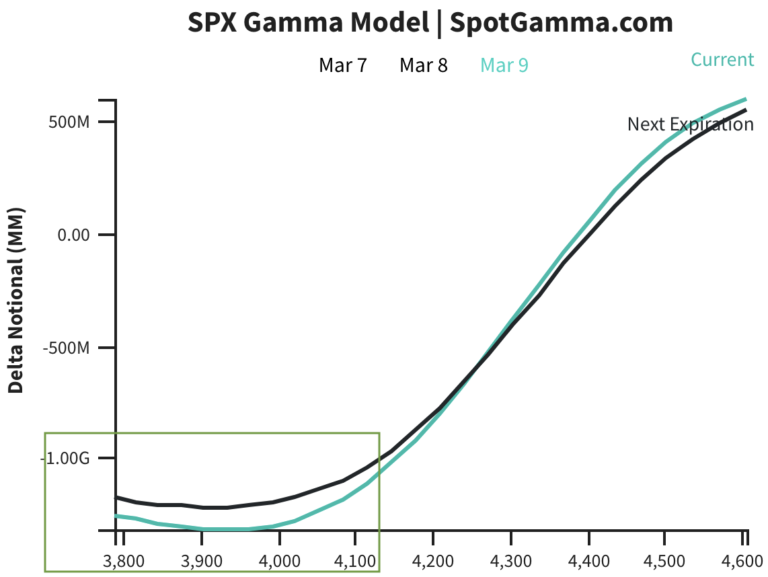
In case of lower prices, according to SpotGamma, the rate at which options counterparties increasingly add pressure on underlying SPX, so to speak, tapers off in the $4,100.00 to $4,000.00 area. Caution.

Graphic: Gamma profile flattens out near the $4,100-4,000 range suggesting less pressure and more counterparty support.

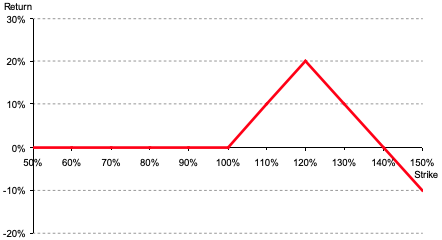
A way to take advantage of this volatility, while lowering the cost of bets, is options spreads. For instance, the Call Ratio (buy 1 call, sell 2 or more further out) can lower the cost of bets on the upside while providing exposure to asymmetric payouts.

Time and volatility are two factors, however, to be mindful of when initiating such spreads. Risk is undefined and if the time to expiry is too long (e.g., in excess of 1-2 weeks), fast moves and increases in volatility may result in large losses. 

For that reason, also, one must be extremely careful with Put Ratio spreads. Consider adding protection far away from your short strikes to cap risk and turn the spreads into Butterflies.

Graphic: Via Banco Santander SA (NYSE: SAN) research, the return profile, at expiry, of a classic 1×2 (long 1, short 2 further away) ratio spread.

Technical: As of 6:30 AM ET, Thursday’s regular session (9:30 AM – 4:00 PM ET), in the S&P 500, will likely open in the lower part of a negatively skewed overnight inventory, inside of prior-range and -value, suggesting a limited potential for immediate directional opportunity.

Gap Scenarios Potentially In Play: Gaps ought to fill quickly. Should they not, that’s a signal of strength; do not fade. Leaving value behind on a gap-fill or failing to fill a gap (i.e., remaining outside of the prior session’s range) is a go-with indicator.

Auctioning and spending at least 1-hour of trade back in the prior range suggests a lack of conviction; in such a case, do not follow the direction of the most recent initiative activity.

In the best case, the S&P 500 trades higher; activity above the $4,231.00 regular trade low (RTH Low) puts in play the $4,249.25 low volume area (LVNode). Initiative trade beyond the LVNode could reach as high as the $4,285.75 high volume area (HVNode) and $4,319.00 untested point of control (VPOC), or higher.

In the worst case, the S&P 500 trades lower; activity below the $4,231.00 RTH Low puts in play the $4,177.25 HVNode. Initiative trade beyond the HVNode could reach as low as the $4,138.75 and $4,101.25 overnight low (ONL), or lower.

Considerations: Push-and-pull, as well as responsiveness near key-technical areas (that are discernable visually on a chart), suggests technically-driven traders with short time horizons are very active. 

Such traders often lack the wherewithal to defend retests and, additionally, the type of trade may be indicative of the other time frame participants waiting for more information to initiate trades.

Click here to load today’s key levels into the web-based TradingView charting platform. Note that all levels are derived using the 65-minute timeframe. New links are produced, daily.
Graphic: 65-minute profile chart of the Micro E-mini S&P 500 Futures.

Definitions

Overnight Rally Highs (Lows): Typically, there is a low historical probability associated with overnight rally-highs (lows) ending the upside (downside) discovery process.

Volume Areas: A structurally sound market will build on areas of high volume (HVNodes). Should the market trend for long periods of time, it will lack sound structure, identified as low volume areas (LVNodes). LVNodes denote directional conviction and ought to offer support on any test. 

If participants were to auction and find acceptance into areas of prior low volume (LVNodes), then future discovery ought to be volatile and quick as participants look to HVNodes for favorable entry or exit.

POCs: POCs are valuable as they denote areas where two-sided trade was most prevalent in a prior day session. Participants will respond to future tests of value as they offer favorable entry and exit.

About

After years of self-education, strategy development, mentorship, and trial-and-error, Renato Leonard Capelj began trading full-time and founded Physik Invest to detail his methods, research, and performance in the markets.

Capelj is also a Benzinga finance and technology reporter interviewing the likes of Shark Tank’s Kevin O’Leary, JC2 Ventures’ John Chambers, FTX’s Sam Bankman-Fried, and ARK Invest’s Catherine Wood, as well as a SpotGamma contributor developing insights around impactful options market dynamics.

Disclaimer

Physik Invest does not carry the right to provide advice.

In no way should the materials herein be construed as advice. Derivatives carry a substantial risk of loss. All content is for informational purposes only.
Categories
Commentary

Daily Brief For March 9, 2022

Editor’s Note: The Daily Brief is a free glimpse into the prevailing fundamental and technical drivers of U.S. equity market products. Join the 200+ that read this report daily, below!

What Happened

Overnight, equity index futures, led by the tech- and growth-heavy Nasdaq 100 auctioned higher. This is immediately after a session characterized by rampant, two-way volatility. 

Much of the action in the equity indices and commodity markets is headline-driven. 

For instance, at one point, alongside news that Ukraine would no longer insist on NATO membership, the S&P 500 auctioned higher nearly 3%. Thereafter, responsive selling at a very key technical level preceded the index’s over 3% drop shortly after.

This push-and-pull, as well as responsiveness near key-technical areas (that are discernable visually on a chart), suggests technically-driven traders with short time horizons are very active. 

Such traders often lack the wherewithal to defend retests and, additionally, the type of trade may be indicative of the other time frame participants waiting for more information to initiate trades.

Ahead is data on job openings and quits (10:00 AM ET).

Graphic updated 6:45 AM ET. Sentiment Neutral if expected /ES open is inside of the prior day’s range. /ES levels are derived from the profile graphic at the bottom of the following section. Levels may have changed since initially quoted; click here for the latest levels. SqueezeMetrics Dark Pool Index (DIX) and Gamma (GEX) calculations are based on where the prior day’s reading falls with respect to the MAX and MIN of all occurrences available. A higher DIX is bullish. At the same time, the lower the GEX, the more (expected) volatility. Learn the implications of volatility, direction, and moneyness. SHIFT data used for S&P 500 (INDEX: SPX) options activity. Note that options flow is sorted by the call premium spent; if more positive, then more was spent on call options. Breadth reflects a reading of the prior day’s NYSE Advance/Decline indicator. VIX reflects a current reading of the CBOE Volatility Index (INDEX: VIX) from 0-100.

What To Expect

Fundamental: The prevailing narrative is concerned with the slowdown in economic growth, the intent to withdraw monetary stimulus, and the response to Russia’s invasion of Ukraine.

Graphic: Bloomberg. U.S. equity indexes spared of recent bloodshed, abroad.

Pursuant to the response to Russia’s invasion of Ukraine has been a disruption in supply chains; commodities, like oil and nickel, have risen and that has inflation and growth impacts.

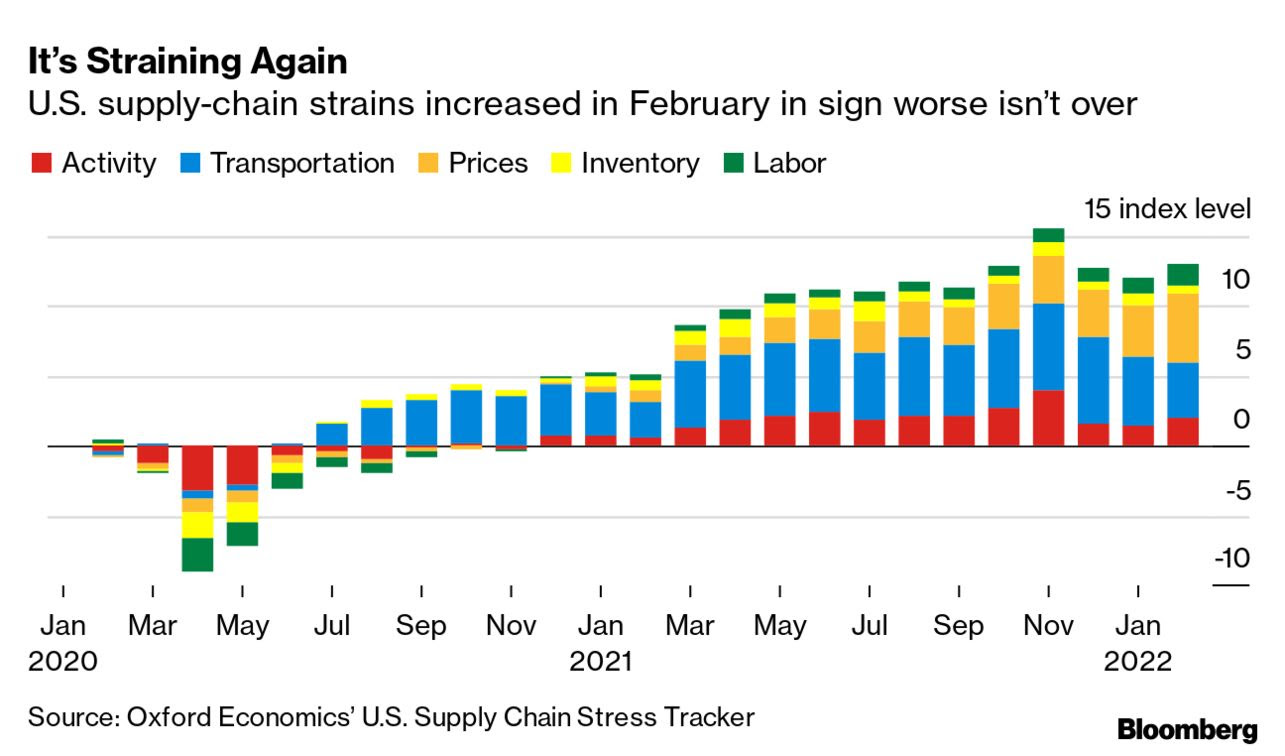
Graphic: Via Bloomberg, Oxford Economics. “The war in Ukraine is making it harder and more costly for goods to move freely across the globe. Key shipping routes are blocked, and others are feeling ripple effects from the conflict.”

In the coming days and weeks, central banks will announce their monetary policy decisions. Per Bloomberg, commodity costs underline the inflation challenge to the Federal Reserve.

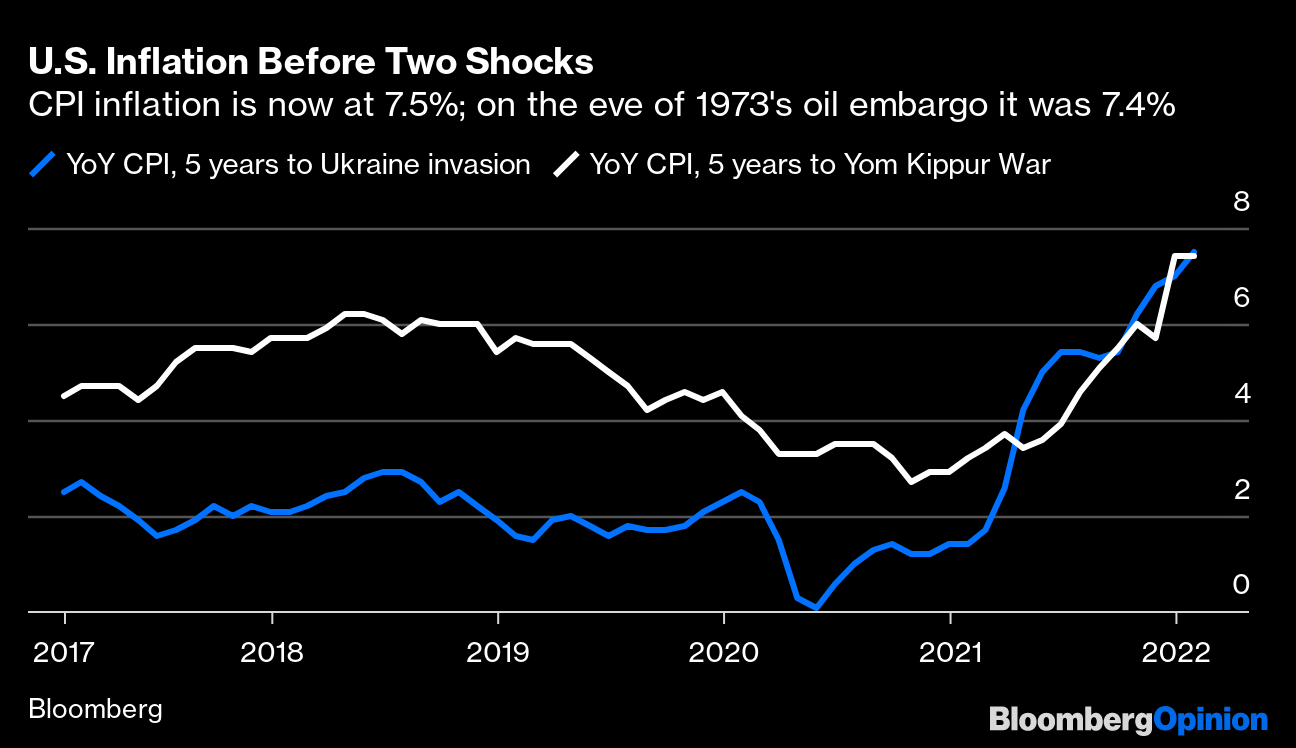
Graphic: Via Bloomberg. The historical analogy is different but close (as today’s economy is less dependent on oil); the “Fed responded to the [1973] shock, and to the growing wave of inflation that preceded it, with a massive tightening.”

With breakevens on 30-year inflation-linked Treasuries – an indicator of the pace of price gains over three decades – climbing to their highest level, the Fed is expected to hike rates 25 bps.

Graphic: Via CME Group Inc (NASDAQ: CME). Participants price in an increased probability of a shift in the target rate. Click here to access the FedWatch Tool.

In the past days, there have been a variety of takes on what’s going on. A pessimistic, yet, interesting take is offered by Credit Suisse Group AG’s (NYSE: CS) Zoltan Pozsar.

Mainly, there is a commodity crisis. Commodities are collateral and collateral is money.

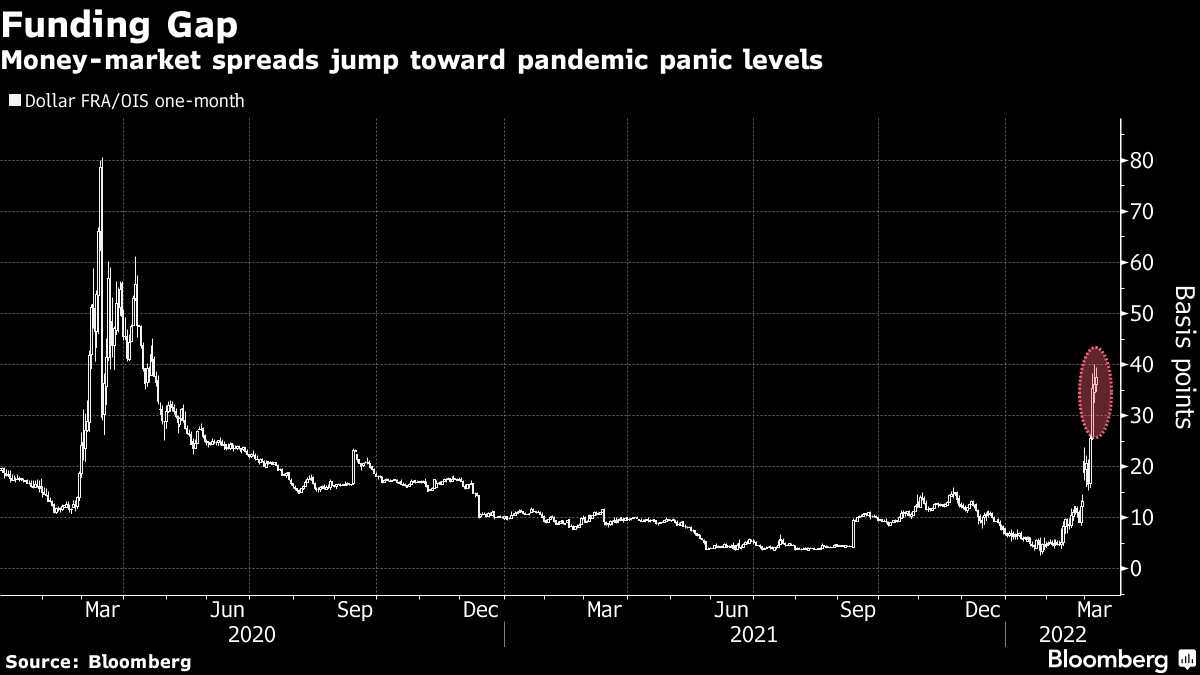
Graphic: Via Bloomberg. The “FRA/OIS, a key gauge of interbank funding risk, as of the close on Monday.” Click here to listen to Zoltan Pozsar’s Bloomberg conversation on Russia, Gold, and the U.S. dollar.

“[E]very crisis occurs at the intersection of funding and collateral markets and that, in the presently unfolding crisis, commodities are collateral, and more precisely, Russian commodities are like subprime collateral and all other stuff is prime.”

Pozsar explains that instability in commodity prices feeds into financial instability as margin calls trigger the failure of commodity traders and (potentially) commodity exchanges.

Graphic: Via Bloomberg. Commodity price rises solicit margin calls.

“Again, commodity correlations are at 1, which is never a good thing,” he says. “The Fed and other central banks will be able to provide liquidity backstops, … but those will be Band-Aid solutions.”

Liquidity is the manifestation of a larger problem – the Russian-non-Russian commodities basis – and its resolve portends a “regime shift” which Pozsar posits China will be at the front of.

“When this crisis (and war) is over, the U.S. dollar should be much weaker and, on the flip side, the renminbi much stronger, backed by a basket of commodities.”

MUFG Securities’ (NYSE: MUFG) George Goncalves makes a similar point, drawing parallels to the early days of 2008. 

“The situation in Europe is precarious enough on its own, but if conditions worsen in a highly connected financial system, balance sheets may get curtailed via haircuts,” Concalves wrote

“Meanwhile there is an eerily similar pattern to the current action in [short-term interest rates] and oil prices to the early summer of 2008. Recall, in response to inflation and central bank hawkishness, markets priced in nearly 150bps in hikes in 2008 before GFC cracked.”

Positioning: Based on metrics often quoted in this morning letter, buying support appears to be cooling. Overlaying options positioning metrics, the returns distribution is skewed positive, still.

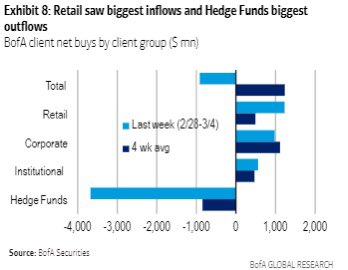
This is in opposition to some of the reporting by large outlets. The narrative is along the lines of institutional investors offloading equities to retail.

Graphic: Via Bank of America Corporation (NYSE: BAC).

According to statements by The Ambrus Group’s Kris Sidial, “This is partially a byproduct of the long equity firms that have programs that are designed to exit when Cboe Volatility Index (INDEX: VIX) gets over a certain level and equities drop under a certain percentage.”

Graphic: Via Pat Hennessy. “ES goes +2%, -2%, +3%, -3% in 14 hours! Yes – the close/close move was weak, but the intraday moves were massive – IMO enough to support a 37 VIX. Strange to see vols so soft given intraday realized + close on lows.”

“There is no doubt about it that we have noticed heavier institutional flow throughout the day over the last two weeks. However, there are still large institutions that are putting cash to work in equities. Ironically a rotation out of some European equities into U.S., [and] there is also a good amount of buyback flow that is projected to hit some areas in U.S equities.

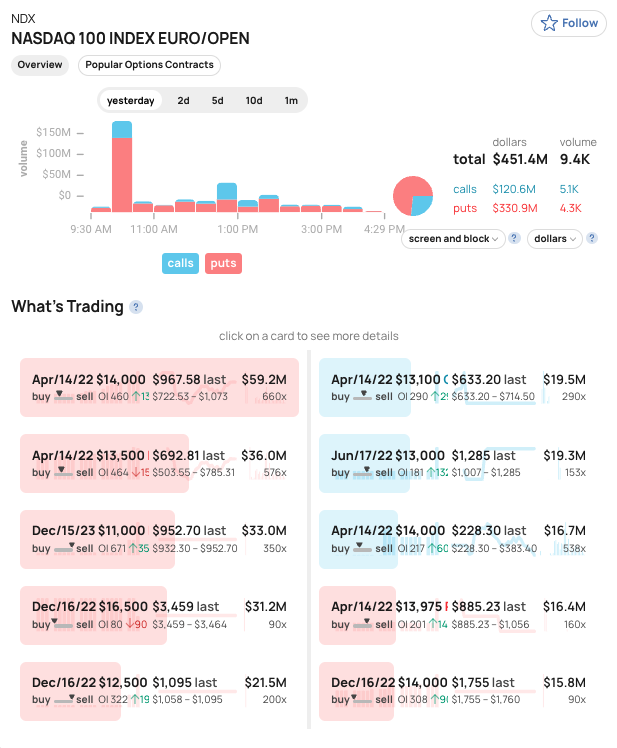
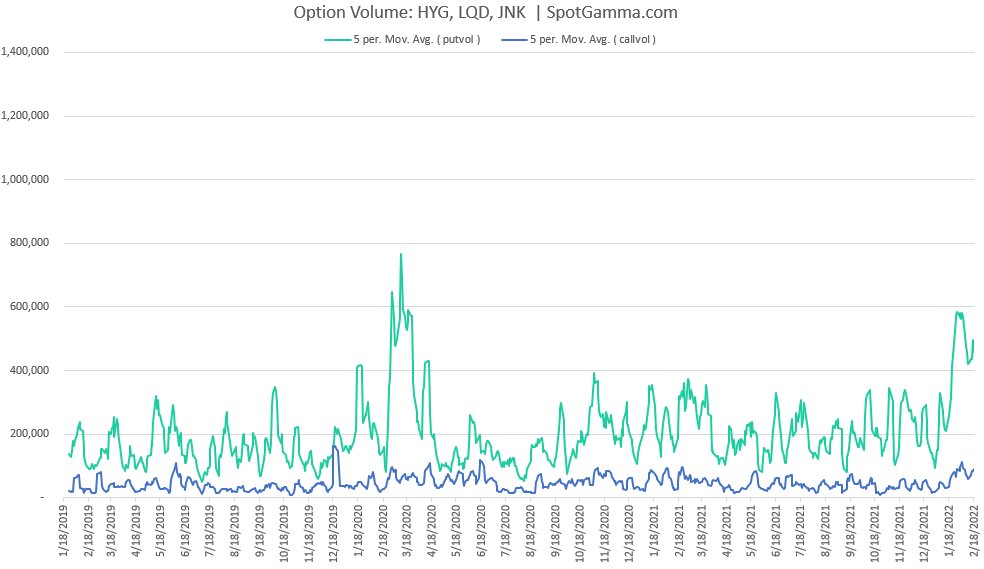
Pursuant to remarks in the fundamental section (and Sidial’s note on the heavier institutional flow), we saw some noteworthy put buying in products like the cash-settled Nasdaq 100 (INDEX: NDX) and iShares iBoxx $ Inv Grade Corporate Bond ETF (NYSE: LQD).

Graphic: Via SHIFT. Buying closer strikes. Selling farther strikes.

Whether these are hedges, the replacement of existing linear short positions, or speculation on the downside, it all plays into this negative gamma environment markets are in.

When customers demand downside (put) protection (a negative delta, positive gamma trade that has its gains multiplied to the downside), counterparties sell underlying futures and stock to hedge their positive delta, negative gamma trade which has the effect of pressuring markets.

The compression of volatility (via passage of FOMC) or removal of counterparty negative exposure (via OPEX) may serve to alleviate some of this pressure. Until then, participants can expect the options landscape to add to market volatility.

Technical: As of 6:45 AM ET, Wednesday’s regular session (9:30 AM – 4:00 PM ET), in the S&P 500, will likely open in the upper part of a positively skewed overnight inventory, inside of prior-range and -value, suggesting a limited potential for immediate directional opportunity.

In the best case, the S&P 500 trades higher; activity above the $4,248.25 overnight high (ONH) puts in play the $4,285.50 high volume area (HVNode). Initiative trade beyond the HVNode could reach as high as the $4,319.00 untested point of control (VPOC) and $4,346.75 high volume area (HVNode), or higher.

In the worst case, the S&P 500 trades lower; activity below the $4,248.25 ONH puts in play the $4,227.75 HVNode. Initiative trade beyond the $4,227.75 HVNode could reach as low as the $4,177.25 HVNode and $4,138.75 ONL, or lower.

Click here to load today’s key levels into the web-based TradingView charting platform. Note that all levels are derived using the 65-minute timeframe. New links are produced, daily.
Graphic: 65-minute profile chart of the Micro E-mini S&P 500 Futures.

Definitions

Overnight Rally Highs (Lows): Typically, there is a low historical probability associated with overnight rally-highs (lows) ending the upside (downside) discovery process.

Volume Areas: A structurally sound market will build on areas of high volume (HVNodes). Should the market trend for long periods of time, it will lack sound structure, identified as low volume areas (LVNodes). LVNodes denote directional conviction and ought to offer support on any test. 

If participants were to auction and find acceptance into areas of prior low volume (LVNodes), then future discovery ought to be volatile and quick as participants look to HVNodes for favorable entry or exit.

POCs: POCs are valuable as they denote areas where two-sided trade was most prevalent in a prior day session. Participants will respond to future tests of value as they offer favorable entry and exit.

About

After years of self-education, strategy development, mentorship, and trial-and-error, Renato Leonard Capelj began trading full-time and founded Physik Invest to detail his methods, research, and performance in the markets.

Capelj is also a Benzinga finance and technology reporter interviewing the likes of Shark Tank’s Kevin O’Leary, JC2 Ventures’ John Chambers, FTX’s Sam Bankman-Fried, and ARK Invest’s Catherine Wood, as well as a SpotGamma contributor developing insights around impactful options market dynamics.

Disclaimer

Physik Invest does not carry the right to provide advice.

In no way should the materials herein be construed as advice. Derivatives carry a substantial risk of loss. All content is for informational purposes only.
Categories
Commentary

Daily Brief For March 8, 2022

Editor’s Note: The Daily Brief is a free glimpse into the prevailing fundamental and technical drivers of U.S. equity market products. Join the 200+ that read this report daily, below!

What Happened

Equity index futures rebound after exploring prices below Monday’s close. Most commodity products, alongside measures of implied volatility, remain bid. 

The overnight response higher came as the European Union announced it was considering joint bond sales to assist in the fiscal fallout from Russia’s invasion of Ukraine. 

Still, at home in the U.S., policymakers are looking to rein in inflation and apply contractionary monetary policy whilst inflation remains heightened and economic growth is slowing. 

As noted in prior commentaries, in spite of continued (albeit lightly cooled) passive buying support, the equity markets are prone to continued weakness. We add to this narrative, below.

Ahead is data on the foreign trade deficit (8:30 AM ET) and wholesale inventories (10:00 AM ET).

Graphic updated 6:40 AM ET. Sentiment Neutral if expected /ES open is inside of the prior day’s range. /ES levels are derived from the profile graphic at the bottom of the following section. Levels may have changed since initially quoted; click here for the latest levels. SqueezeMetrics Dark Pool Index (DIX) and Gamma (GEX) calculations are based on where the prior day’s reading falls with respect to the MAX and MIN of all occurrences available. A higher DIX is bullish. At the same time, the lower the GEX, the more (expected) volatility. Learn the implications of volatility, direction, and moneyness. SHIFT data used for S&P 500 (INDEX: SPX) options activity. Note that options flow is sorted by the call premium spent; if more positive, then more was spent on call options. Breadth reflects a reading of the prior day’s NYSE Advance/Decline indicator. VIX reflects a current reading of the CBOE Volatility Index (INDEX: VIX) from 0-100.

What To Expect

Fundamental: Shortened note, today.

The prevailing narrative is concerned with the slowdown in economic growth, the intent to withdraw monetary stimulus, and the response to Russia’s invasion of Ukraine.

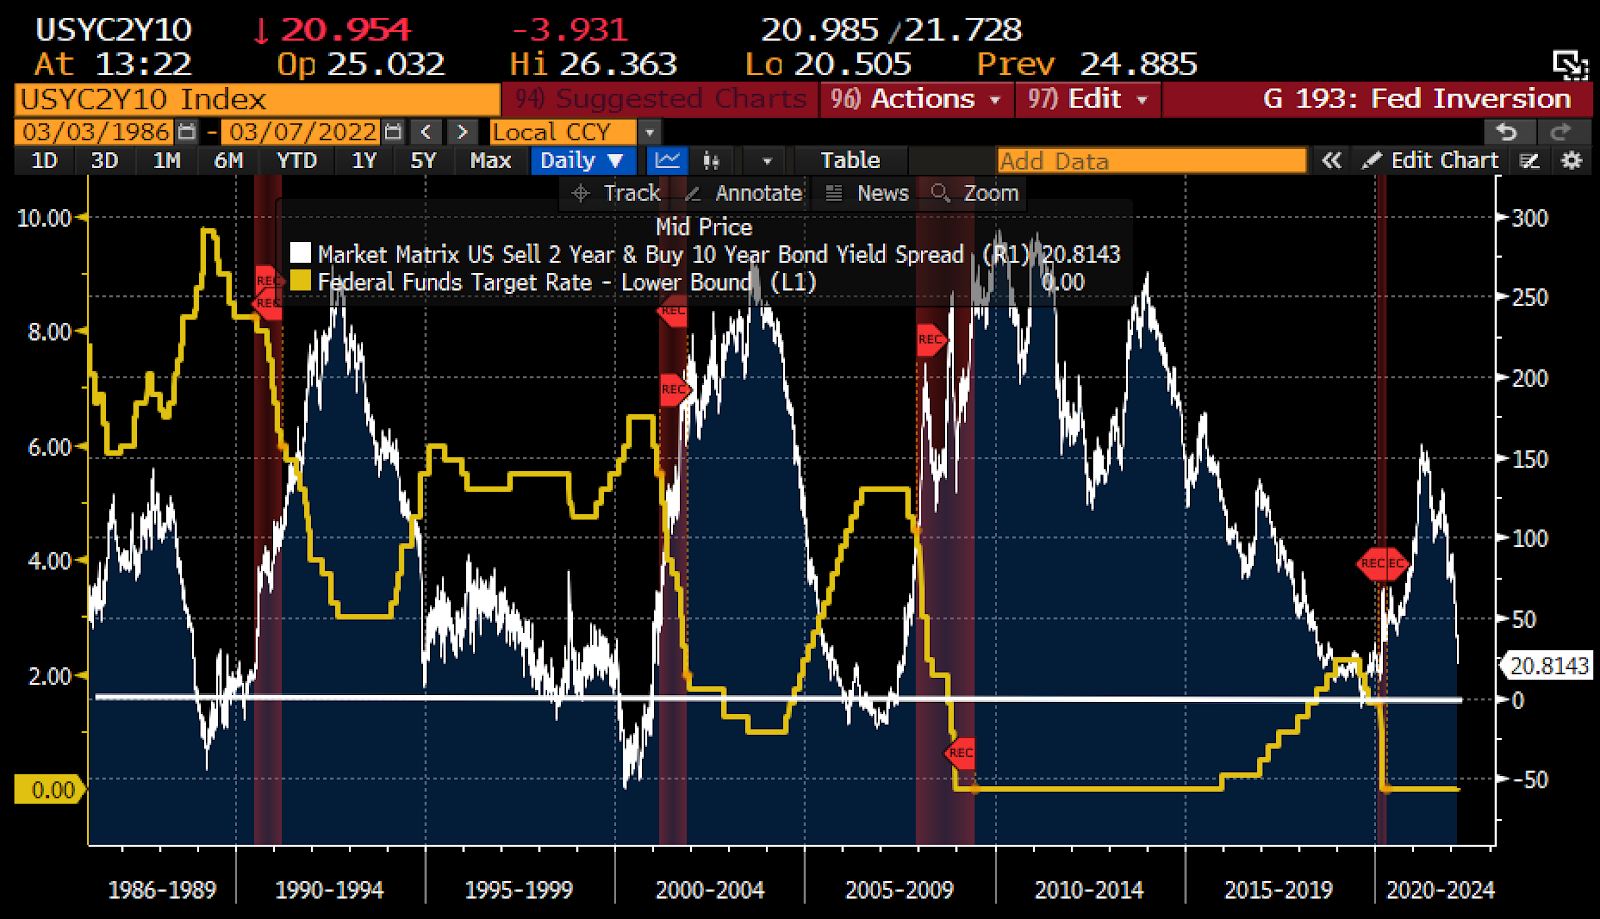
Graphic: Via @TheBondFreak. Per Bloomberg, “The gap between two-year and 10-year Treasury yields is around the narrowest since March 2020, a sign of expectations of slowing economic expansion.”

Heading into this week, broad-based indexes in the U.S. were weak but steady; fixed income, commodity, and equity markets abroad traded more volatile in comparison.

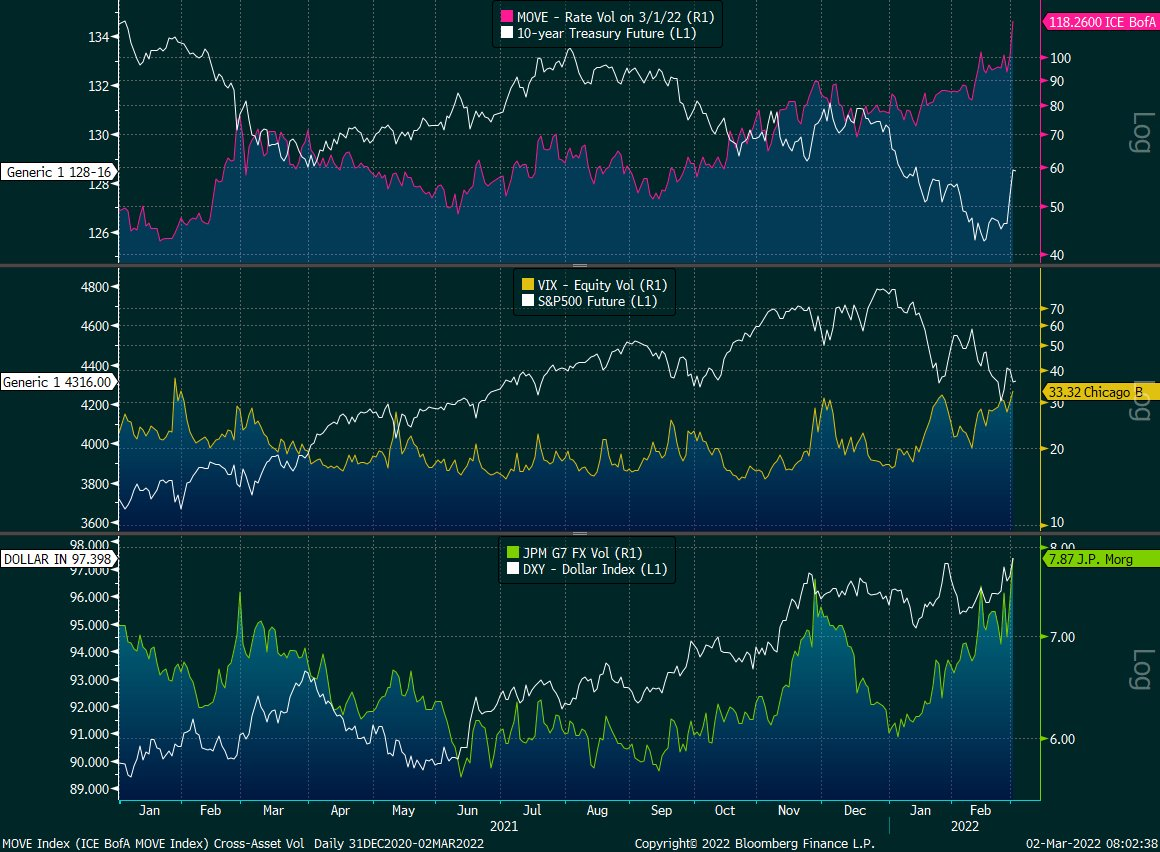
Graphic: Via @EffMktHype. “Rate vol through the roof, FX picking up steam while equity vol arguably still cheap in comparison despite being at the high end of its 1-year end.”

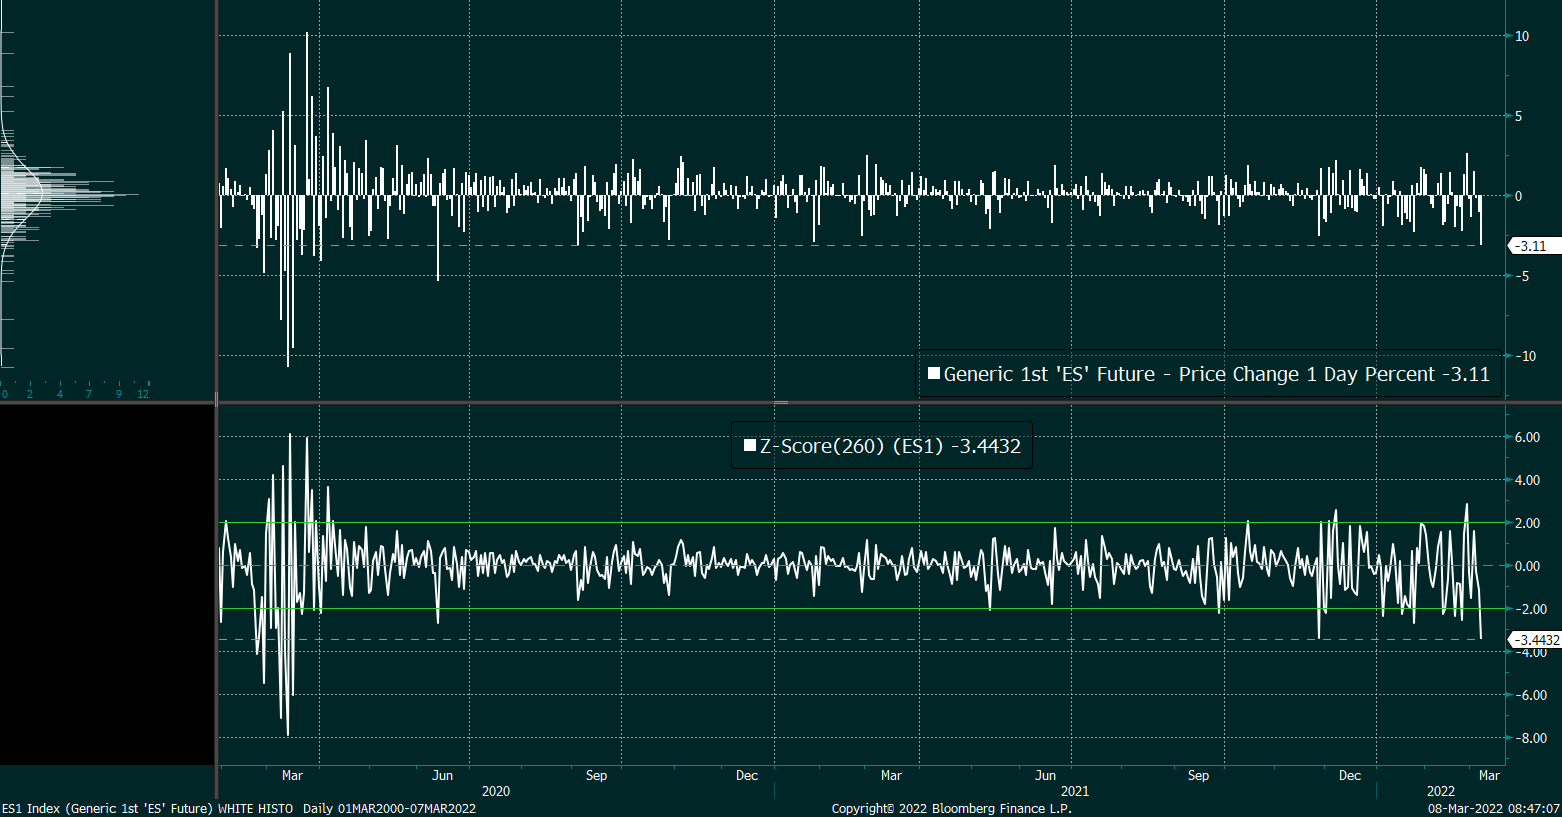
The tone changed, slightly, yesterday, after the S&P 500 pushed the lower bound of price changes it has logged since 2020.

Graphic: Via @EffMktHype

Still, it is likely that participants have yet to witness a climactic de-leveraging; in part, what is supporting the market (as described in detail before, here) is passive buying support and the supply of liquidity, at the index level.

Graphic: Via JPMorgan, from Bloomberg.

At the single-stock level, the de-rate in anticipation of slowing growth Fed tightening has mostly played its course. At the index level, there are signs of more room to go.

Graphic: Alfonso Peccatiello of The Macro Compass. He says “YTD: 2022 hikes priced in up from 3 to 6-7. Curves big-time flatter. Inflation expectations 10 bps lower. Real yields higher 40-50 bps. Credit spreads wider. Cyclical growth impulse fading away. Not a risk-on environment.”

This is “[v]ery resemblant of prior market events,” The Ambrus Group’s Kris Sidial explained in a reference to extreme events in markets having a higher likelihood of becoming more extreme. 

“Just when you think ‘this is the top/ bottom’ it puts in another massive leg that makes everyone go ‘oh sh*t’.”

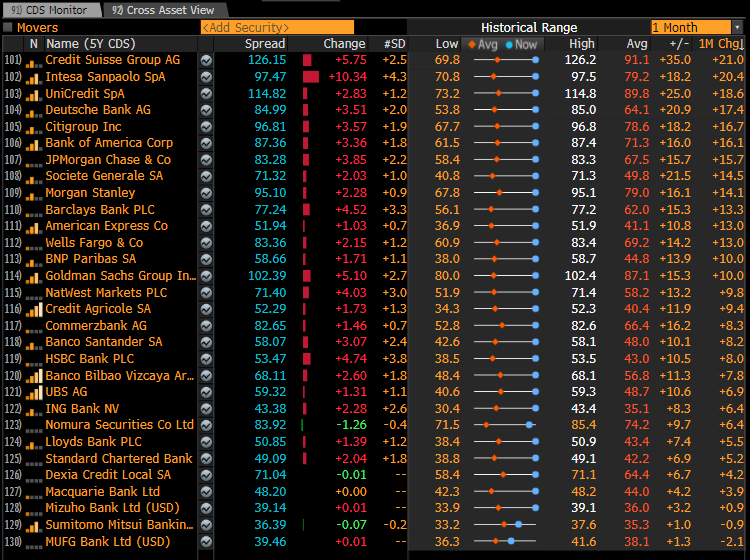
Graphic: Via @AnalystDC. A credit default swap will compensate buyers in the event of debt default. CDS spreads rise for record stretch in light of geopolitical tensions.

Positioning: At present, in the face of continued passive buying support, the overwhelming demand for downside (put) protection (a negative delta, positive gamma trade) results in counterparty hedging that may exacerbate weakness.

Graphic: Via SpotGamma. “Netting call & put delta, you can see we’re near extremes in terms of put:call positions. Often large put positions are removed by expirations, which seems to coincide with market lows. Many of these are quarterly expirations which coincide w/FOMC meetings – such as next week.”

The reason why? The counterparty has exposure to positive delta and negative gamma. If underlying prices print lower and/or measures of implied volatility rise (given increased fear and demand for protection), short puts rise in value (and counterparty losses are multiplied).

To overcome these potential losses, counterparties sell the underlying to hedge. If nothing happens, the protection decays, and counterparties buy back their hedges potentially bolstering the underlying market’s calmness or attempts higher.

In the coming week, participants will gain clarity with respect to the Federal Reserve’s intent to tighten. Closely after, there is a monthly options expiration (OPEX). 

The compression in volatility post-FOMC, coupled with a reduction in put-heavy positioning post-OPEX, could help support markets.

Interested in more about options and unique structures that may assist with navigating current volatility, check out this volatility trading primer by Santander.
Graphic: Via Goldman Sachs Group Inc (NYSE: GS).

Technical: As of 6:40 AM ET, Tuesday’s regular session (9:30 AM – 4:00 PM ET), in the S&P 500, will likely open in the top part of a balanced overnight inventory, inside of prior-range and -value, suggesting a limited potential for immediate directional opportunity.

In the best case, the S&P 500 trades higher; activity above the $4,227.25 high volume area (HVNode) puts in play the $4,265.00 untested point of control (VPOC). Initiative trade beyond the VPOC could reach as high as the $4,285.50 HVNode and $4,319.00 VPOC, or higher.

In the worst case, the S&P 500 trades lower; activity below the $4,227.75 HVNode puts in play the $4,177.25 HVNode. Initiative trade beyond the latter HVNode could reach as low as the $4,137.00 VPOC and $4,101.25 ONL, or lower.

Click here to load today’s key levels into the web-based TradingView charting platform. Note that all levels are derived using the 65-minute timeframe. New links are produced, daily.
Graphic: 65-minute profile chart of the Micro E-mini S&P 500 Futures.

Definitions

Overnight Rally Highs (Lows): Typically, there is a low historical probability associated with overnight rally-highs (lows) ending the upside (downside) discovery process.

Volume Areas: A structurally sound market will build on areas of high volume (HVNodes). Should the market trend for long periods of time, it will lack sound structure, identified as low volume areas (LVNodes). LVNodes denote directional conviction and ought to offer support on any test. 

If participants were to auction and find acceptance into areas of prior low volume (LVNodes), then future discovery ought to be volatile and quick as participants look to HVNodes for favorable entry or exit.

POCs: POCs are valuable as they denote areas where two-sided trade was most prevalent in a prior day session. Participants will respond to future tests of value as they offer favorable entry and exit.

About

After years of self-education, strategy development, mentorship, and trial-and-error, Renato Leonard Capelj began trading full-time and founded Physik Invest to detail his methods, research, and performance in the markets.

Capelj is also a Benzinga finance and technology reporter interviewing the likes of Shark Tank’s Kevin O’Leary, JC2 Ventures’ John Chambers, FTX’s Sam Bankman-Fried, and ARK Invest’s Catherine Wood, as well as a SpotGamma contributor developing insights around impactful options market dynamics.

Disclaimer

Physik Invest does not carry the right to provide advice.

In no way should the materials herein be construed as advice. Derivatives carry a substantial risk of loss. All content is for informational purposes only.
Categories
Commentary

Daily Brief For March 7, 2022

Editor’s Note: The Daily Brief is a free glimpse into the prevailing fundamental and technical drivers of U.S. equity market products. Join the 200+ that read this report daily, below!

What Happened

Overnight, equity index futures auctioned lower as participants looked to price in the implications of heightened inflation and risk of recession amidst geopolitical tensions.

Ahead is data on consumer credit (3:00 PM ET).

Graphic updated 5:45 AM ET. Sentiment Risk-Off if expected /ES open is below the prior day’s range. /ES levels are derived from the profile graphic at the bottom of the following section. Levels may have changed since initially quoted; click here for the latest levels. SqueezeMetrics Dark Pool Index (DIX) and Gamma (GEX) calculations are based on where the prior day’s reading falls with respect to the MAX and MIN of all occurrences available. A higher DIX is bullish. At the same time, the lower the GEX, the more (expected) volatility. Learn the implications of volatility, direction, and moneyness. SHIFT data used for S&P 500 (INDEX: SPX) options activity. Note that options flow is sorted by the call premium spent; if more positive, then more was spent on call options. Breadth reflects a reading of the prior day’s NYSE Advance/Decline indicator. VIX reflects a current reading of the CBOE Volatility Index (INDEX: VIX) from 0-100.

What To Expect

Fundamental: Hawkishness with respect to monetary policy, in the face of heightened inflation and slowing economic growth, is affecting global markets.

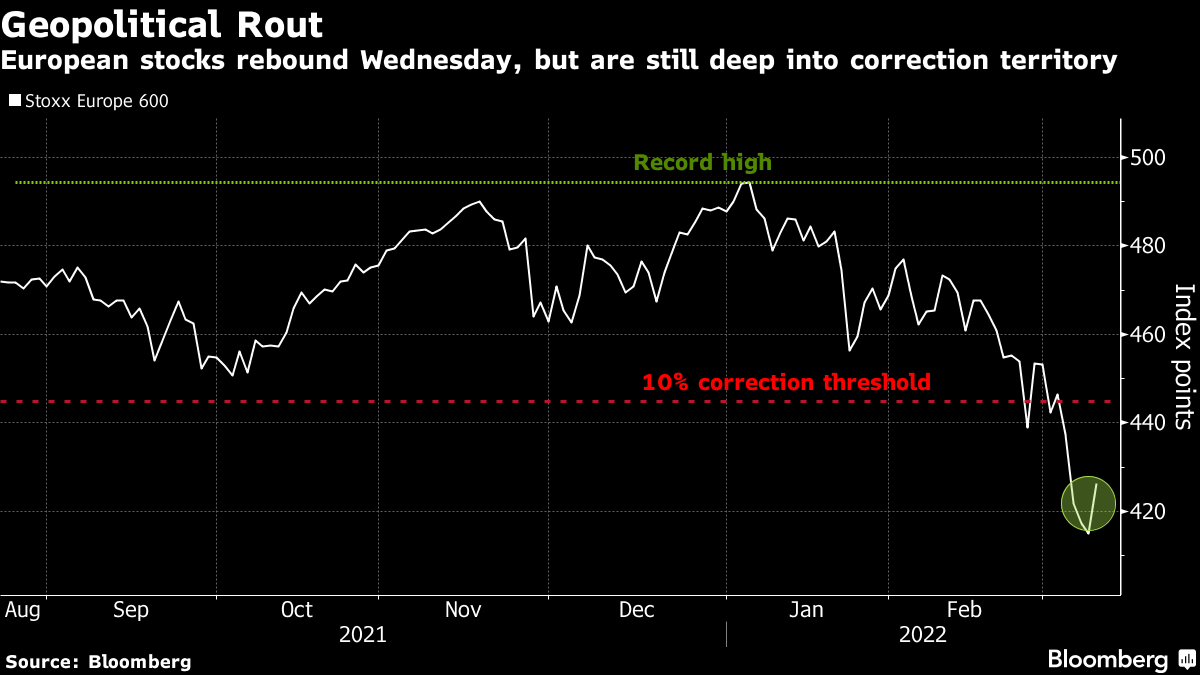
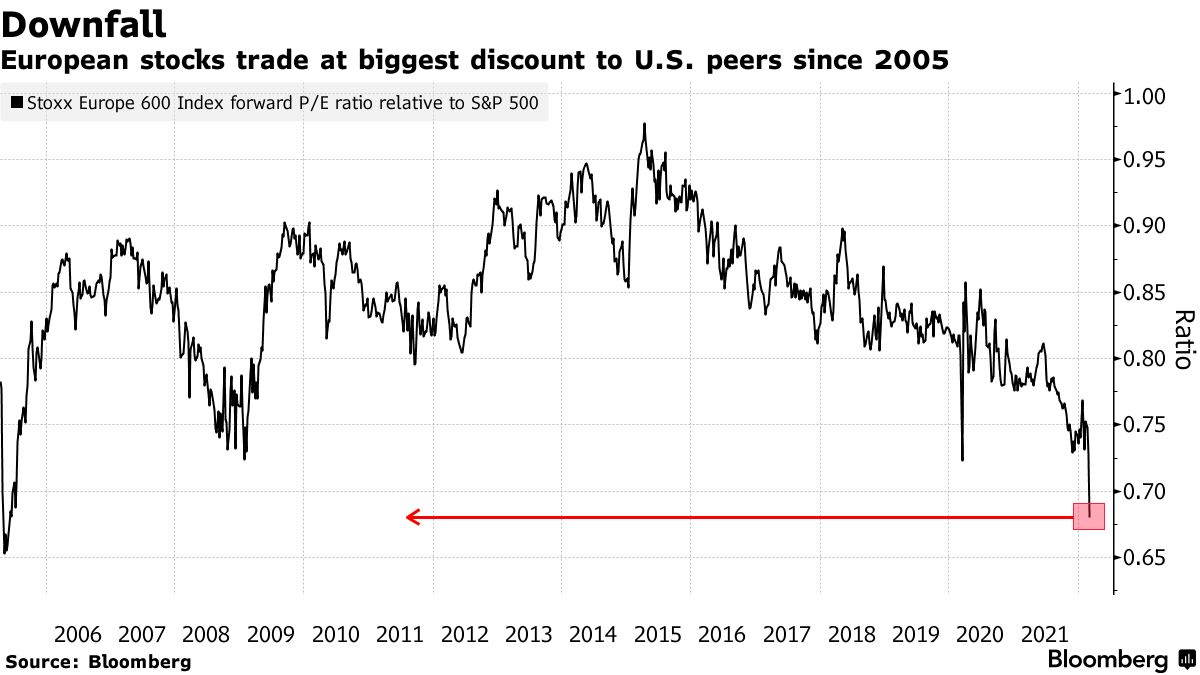
Graphic: Via Bloomberg. European markets trade weak relative to their U.S. peers.

Overseas markets have sold more, relatively, and the pricing of equity market risk in Europe is far outpacing that in the U.S.

Graphic: Via Bloomberg. Divergences in the pricing of risk across markets.

Last week, we unpacked the potential factors behind (and the implications of) divergences in cross-asset volatility. Mainly, the fear in one market tends to feed into the fear of another.

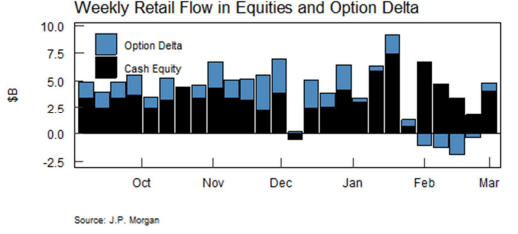
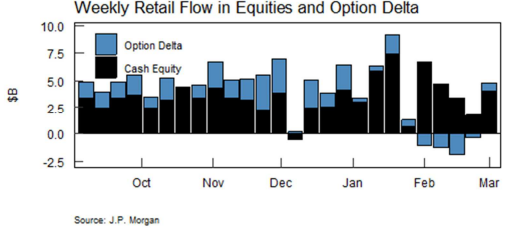
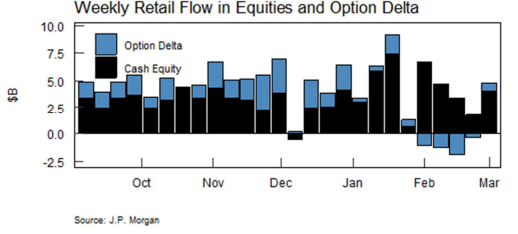
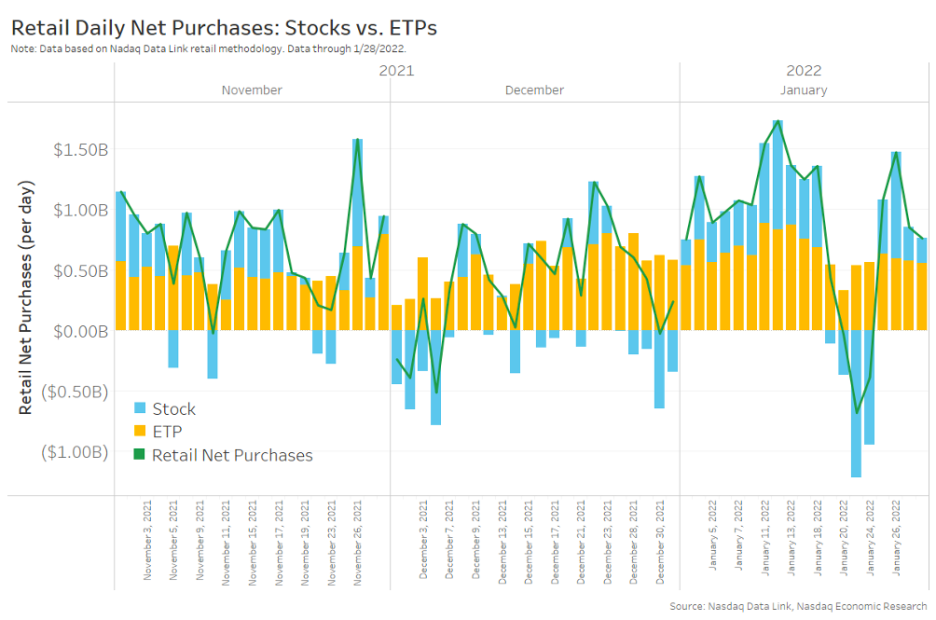
Pursuant to those remarks on this push-and-pull comes as Goldman Sachs Group Inc’s (NYSE: GS) prime brokerage saw hedge-fund clients unloading risk at the fastest rate in three months, while JPMorgan Chase & Co (NYSE: JPM) saw retail buying nearly $4.1 billion, “with money sent to S&P 500-linked ETFs more than 2 standard deviations above the 12-month average.”

Graphic: Via JPMorgan, from Bloomberg.

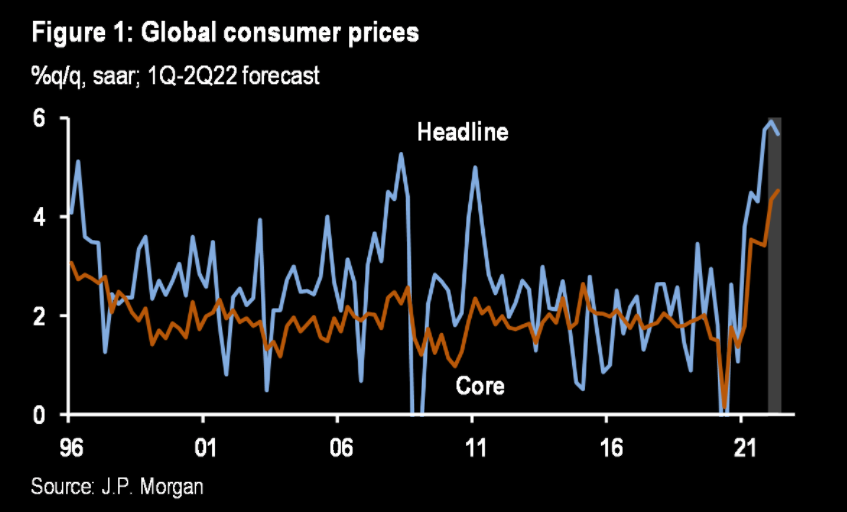
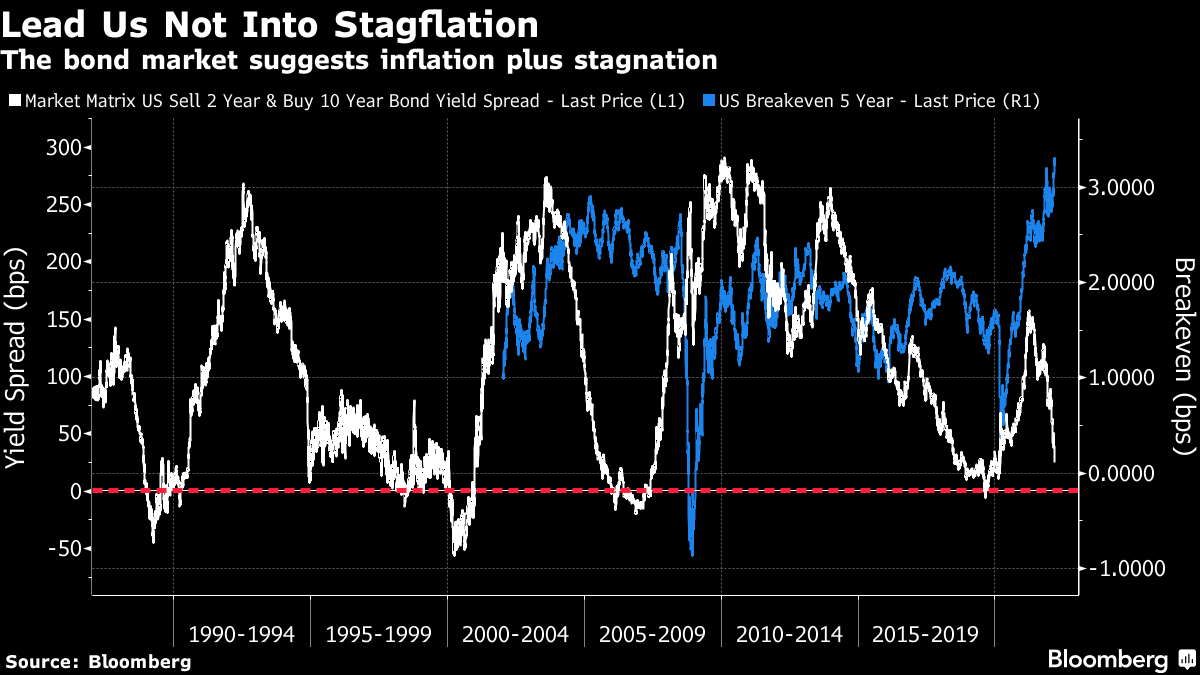
Per Bloomberg’s John Authers, market professionals likely view reactions to geopolitical tension “as increasing the risk of stagflation, a rare combination of high inflation and a recession.”

Graphic: Via JPMorgan, from The Market Ear.

“This looks like 2007, on the eve of the Global Financial Crisis, with even higher inflation expectations and a yield curve that has not quite yet inverted.”

Graphic: Via Bloomberg. “[A]n outright inversion, which generally signals a recession a matter of months later, now seems an imminent possibility.”

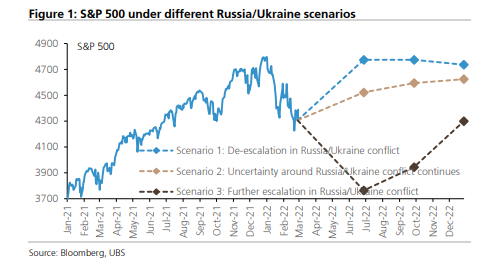
UBS Group AG (NYSE: UBS) ran a machine-learning analysis that “reckons the Russia/Ukraine conflict could send the S&P 500 anywhere from 3,800 to 4,800 – a 26% range – depending on how it resolves.”

Graphic: Via UBS, from Bloomberg.

Perspectives: “Every other market is consistent with the idea that the economy is in trouble and there’s stress in the markets,” said Jim Bianco, president of Bianco Research LLC in Chicago. 

“The stock market historically does this — it’s the last market to turn, it’s the slowest market to understand the problems. It’s the market driven by narratives and hope.”

Graphic: Via @exposurerisk from @Callum_Thomas. “Slowly at first, then all of a sudden.”

Alternatively, BCA Research Ltd suggests that “Even if World War III is ultimately averted, markets could experience a freak-out moment over the next few weeks, similar to what happened at the outset of the pandemic. Google searches for nuclear war are already spiking.”

“Despite the risk of nuclear war, it makes sense to stay constructive on stocks over the next 12 months. If an ICBM is heading your way, the size and composition of your portfolio becomes irrelevant. Thus, from a purely financial perspective, you should largely ignore existential risk, even if you do care about it greatly from a personal perspective.”

Positioning: The fundamental picture is clouded by the options market positioning.

At present, in the face of continued passive buying support, the overwhelming demand for downside (put) protection (a negative delta, positive gamma trade) results in counterparty hedging that may exacerbate weakness.

The reason why? The counterparty has exposure to positive delta and negative gamma. If underlying prices print lower and/or measures of implied volatility rise (given increased fear and demand for protection), short puts rise in value (and counterparty losses are multiplied).

To overcome these potential losses, counterparties sell the underlying to hedge. If nothing happens, the protection decays, and counterparties buy back their hedges potentially bolstering the underlying market’s calmness or attempts higher.

As noted earlier and explained in detail last week, the pricing of risk across markets has diverged and the S&P 500, among other U.S. indices, is relatively strong (unlike peers in Europe and Asia). 

Among other things, one dynamic balancing this pressure from puts is negative-delta trade, by customers, on the call side. In selling calls, dealers are long (a positive delta, positive gamma trade that makes money if the underlying rises). To hedge, dealers tend towards selling strength and buying weakness, adding liquidity to the market. 

Still, again, the news is bad, and returns into monthly options expirations (like the one coming up next week) are often weak.

Graphic: @pat_hennessy breaks down returns for the S&P 500, categorized by the week relative to OPEX. 

So, there is potential that weakness climaxes into the options expiration. Thereafter, the reduction in put-heavy positioning may coincide with less counterparty exposure to the positive delta.

Graphic: Via SpotGamma. “Netting call & put delta, you can see we’re near extremes in terms of put:call positions. Often large put positions are removed by expirations, which seems to coincide with market lows. Many of these are quarterly expirations which coincide w/FOMC meetings – such as next week.”

Still, the return distributions, based on where the implied volatility term structure is at, point to continued chop and expanded ranges.

And, according to some, the “real deleveraging hasn’t hit yet.”

Graphic: Via @FadingRallies.

Technical: As of 5:45 AM ET, Monday’s regular session (9:30 AM – 4:00 PM ET), in the S&P 500, will likely open in the middle part of a negatively skewed overnight inventory, outside of prior-range and -value, suggesting a potential for immediate directional opportunity.

Balance-Break + Gap Scenarios: A change in the market (i.e., the transition from two-time frame trade, or balance, to one-time frame trade, or trend) is occurring.

Monitor for acceptance (i.e., more than 1-hour of trade) outside of the balance area. 

Leaving value behind on a gap-fill or failing to fill a gap (i.e., remaining outside of the prior session’s range) is a go-with indicator. 

Rejection (i.e., return inside of balance) portends a move to the opposite end of the balance.

In the best case, the S&P 500 trades higher; activity above the visual $4,282.75 balance boundary puts in play the $4,319.00 untested point of control (VPOC). Initiative trade beyond the VPOC could reach as high as the $4,346.75 high volume area (HVNode) and $4,375.00 VPOC, or higher.

In the worst case, the S&P 500 trades lower; activity below the $4,282.75 balance boundary puts in play the $4,249.25 low volume area (LVNode). Initiative trade beyond the LVNode could reach as low as the $4,227.75 overnight low (ONL) and $4,177.25 HVNode, or lower.

Considerations: The $4,282.75 level has solicited mechanical responses over the past weeks.

Therefore it is considered to be a level at which short-term participants will lack the wherewithal (both emotional and financial) to respond to a successful break.

Click here to load today’s key levels into the web-based TradingView charting platform. Note that all levels are derived using the 65-minute timeframe. New links are produced, daily.
Graphic: 65-minute profile chart of the Micro E-mini S&P 500 Futures.

Definitions

Overnight Rally Highs (Lows): Typically, there is a low historical probability associated with overnight rally-highs (lows) ending the upside (downside) discovery process.

Volume Areas: A structurally sound market will build on areas of high volume (HVNodes). Should the market trend for long periods of time, it will lack sound structure, identified as low volume areas (LVNodes). LVNodes denote directional conviction and ought to offer support on any test. 

If participants were to auction and find acceptance into areas of prior low volume (LVNodes), then future discovery ought to be volatile and quick as participants look to HVNodes for favorable entry or exit.

POCs: POCs are valuable as they denote areas where two-sided trade was most prevalent in a prior day session. Participants will respond to future tests of value as they offer favorable entry and exit.

About

After years of self-education, strategy development, mentorship, and trial-and-error, Renato Leonard Capelj began trading full-time and founded Physik Invest to detail his methods, research, and performance in the markets.

Capelj is also a Benzinga finance and technology reporter interviewing the likes of Shark Tank’s Kevin O’Leary, JC2 Ventures’ John Chambers, FTX’s Sam Bankman-Fried, and ARK Invest’s Catherine Wood, as well as a SpotGamma contributor developing insights around impactful options market dynamics.

Disclaimer

Physik Invest does not carry the right to provide advice.

In no way should the materials herein be construed as advice. Derivatives carry a substantial risk of loss. All content is for informational purposes only.
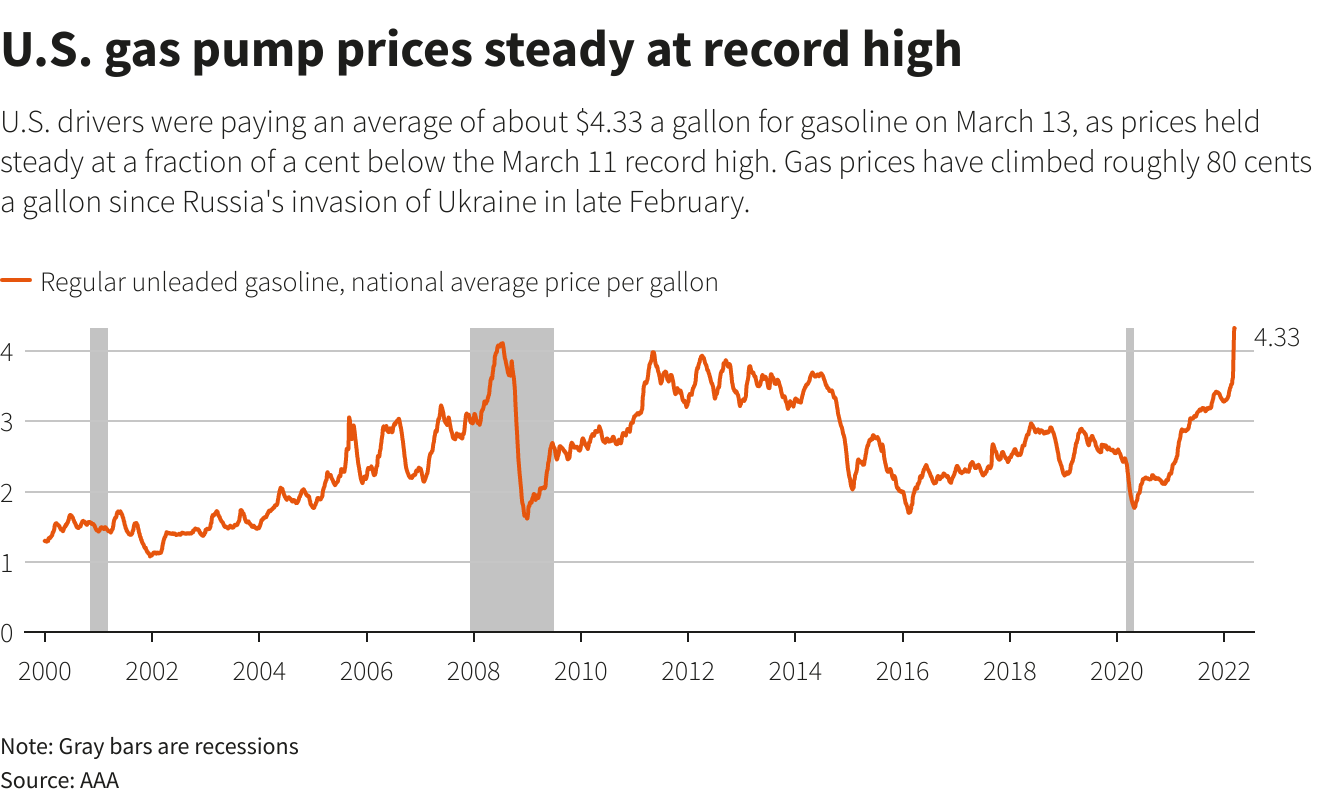
Categories
Commentary

Daily Brief For March 3, 2022

Editor Note: In light of travel commitments, there will be no Daily Brief published tomorrow, March 4, 2022. Thank you for the support and see you next week!

What Happened

Overnight, equity index futures were sideways to lower while commodity and bond products remained bid. Cross-asset volatility measures remain heightened in the face of uncertainties with respect to geopolitical tensions and monetary policy action.

To note, in light of the economic war waged on Russia, participants received positive news from Federal Reserve Chair Jerome Powell who ruled out a 50 basis-point hike.

Moreover, ahead is data on jobless claims, productivity, labor costs (8:30 AM ET), ISM services, factory orders, core capital equipment orders, and Fed-speak by Jerome Powell (10:00 AM ET), as well as John Williams (6:00 PM ET).

Graphic updated 6:30 AM ET. Sentiment Neutral if expected /ES open is inside of the prior day’s range. /ES levels are derived from the profile graphic at the bottom of the following section. Levels may have changed since initially quoted; click here for the latest levels. SqueezeMetrics Dark Pool Index (DIX) and Gamma (GEX) calculations are based on where the prior day’s reading falls with respect to the MAX and MIN of all occurrences available. A higher DIX is bullish. At the same time, the lower the GEX, the more (expected) volatility. Learn the implications of volatility, direction, and moneyness. SHIFT data used for S&P 500 (INDEX: SPX) options activity. Note that options flow is sorted by the call premium spent; if more positive, then more was spent on call options. Breadth reflects a reading of the prior day’s NYSE Advance/Decline indicator. VIX reflects a current reading of the CBOE Volatility Index (INDEX: VIX) from 0-100.

What To Expect

Positioning: Skipping the fundamentals section and will follow up on (and add to) some notes established in Wednesday’s commentary.

Mainly, cross-asset volatility is spiking as investors are seeking protection against the uncertainties posed by geopolitical tensions and monetary policy action.

Graphic: Via @EffMktHype. “Rate vol through the roof, FX picking up steam while equity vol arguably still cheap in comparison despite being at the high end of its 1-year end.”

As explained, however, the equity market’s pricing of risk (which we can take as being reflected by the CBOE Volatility Index [INDEX: VIX]) is not moving lock-step with that of measures in FX and rate markets.

“The fear in one market tends to feed into the fear of another; regardless of the cause, it seems that equity and bond market participants are not (quite) on the same page,” is the direct quote.

In the subsequent text, I did little to mention the implications of liquidity supply at the index level. This realization came to me while writing some commentary for SpotGamma (who just launched its Hedging-Impact of Real-Time Options indicator or HIRO).

Moreover, the evolving monetary frameworks and intention to take from the max liquidity – which pushed participants out of the risk curve and promoted a divergence from fundamentals – has the effect of removing market excesses that have found their way into volatility markets.

Graphic: Taken from The Ambrus Group’s Kris Sidial. Annual listed option volumes.

Taking a look at the U.S. high yield OAS (option-adjusted spread), participants see a “risk-off” bottom; deteriorating credit conditions are a bearish leading indicator and that’s likely been reflected by the bond market’s pricing of risk (but not equity markets, as noted above).

Graphic: Via St. Louis Fed. ICE BoA High YIeld OAS.

Tempering equity market volatility is likely supply, particularly at the index level, whereas elsewhere, at the single-stock level, underlying components are volatile.

As explained in the SpotGamma note: “We’re using the VIX as a proxy for equity market volatility while underlying components are actually very volatile.” 

“There is a decline in correlation, and this is due to suppressive counterparty hedging of the most dominant customer positioning.”

The dominant positioning at the index level is best explained as follows:

  • Customers have positive directional (delta) exposure to the equity markets.
  • The indexes (in which there are tax advantages, cash-settlement, among other things) provide participants exposure to a diversified and liquid hedge, easy to get in and out of.
  • To hedge positive delta exposure against drops, customers will purchase downside put protection. Puts carry a negative delta and their gains are multiplied to the downside (positive gamma). 
  • To reduce the cost of this hedge, they sell upside call protection (also a negative delta trade). This “offset” so to speak can be initiated as a ratio to the protection carried on the downside (e.g., 2 calls for 1 put, and so on), and this feeds into skewness, also.

Options counterparties, who are on the other side of this customer activity, have positive exposure to direction. 

In selling a put, the dealer has positive exposure to the direction (meaning the position makes money, all else equal, with trade higher), but their losses are multiplied with movement to the downside (negative gamma). 

To hedge this put exposure, all else equal, they must sell into weakness and buy strength.

On the call side, however, the counterparty has positive exposure to delta and gamma (meaning gains are multiplied to the upside).

To hedge this call exposure, all else equal, they must buy into weakness and sell strength.

When, in the normal course of action, protection decays (given that time and volatility trend to zero), counterparty positive delta exposure decreases.

Graphic: Via SpotGamma. “SPX prices X-axis. Option delta Y-axis. When the factors of implied volatility and time change, hedging ratios change. For instance, if SPX is at $4,700.00 and IV jumps 15% (all else equal), the dealer may sell an additional 0.2 deltas to hedge their exposure to the addition of a positive 0.2 delta. The graphic is for illustrational purposes, only.”

This solicits the buy-back of short futures hedges (static negative delta against dynamic positive delta options exposure) that can support the market.

As we’ve seen, a feature of falling markets is the demand for protection. When this protection is monetized (or decay ensues), options counterparties add to the market liquidity (i.e., buying back short futures hedges).

A feature of rising markets is the supply of protection (and more active hedging of call options). 

Further, as markets rise, volatility falls. Participants’ demand for yield drives participants further out the risk curve (i.e., they sell more volatility) and this can solicit even more supply.

Pictured: SqueezeMetrics highlights implications of volatility, direction, and moneyness.

As explained in the SpotGamma note: “The counterparty is left carrying more positive exposure to delta and gamma (meaning gains are multiplied to the upside). As time and volatility trend to zero, the sensitivity of these options to underlying price (gamma) increases.”

“When gamma increases, counterparties add more liquidity (i.e., sell [buy] more into strength [weakness] against increasing [decreasing] positive delta exposure).”

Amidst this most recent leg higher, volatility has fallen (some) and the heavily-demanded put protection amidst earlier trade lower has solicited decreased hedging. The buyback of hedges has bolstered sideways to higher trade.

Pursuant to that remark, however, participants are still adding to their negative delta options exposure. They’re doing this via call sales (downward sloping HIRO line, below).

Graphic: SpotGamma’s Hedging Impact of Real-Time Options (HIRO) indicator.

Moreover, given the build in open interest in options at higher strike prices – through naive assumptions and data collected from HIRO, among other measures – we surmise options counterparties are tending to add to the market liquidity and this is stabilizing.

Graphic: Updated 3/2/2022. There is rising interest in options at higher strike prices.

“As the highly-demanded put protection decays, dealers have less exposure to positive delta. To re-hedge this, dealers buy back (cover) existing short (negative-delta) futures hedges,” SpotGamma further explains. “At the same time, as markets trend higher, … the additional interest in options participants supplied on the call side solicits increased hedging.”

From above, we surmise counterparties are long and therefore tend to sell (buy) into strength amid increasing (decreasing) positive delta exposure. 

As short-dated activity clusters in the area just north of the most recent week-long consolidation area, and this protection decays, dealer exposure to positive delta (gamma) falls (rises). 

“Taken together, dealers add to the market liquidity. When there is rising liquidity, volatility (a measure of how ample liquidity is) falls.”

It is options market activity and associated hedging – the supply of liquidity – that’s tempering equity market volatility relative to that of rates and FX.

Graphic: Via SpotGamma. “There’s been a big pop in put volumes for the higher yield bond ETFs: JNK, HYG, and LQD. This syncs with the idea this sell-off is based mainly on rates with a side of geopolitics.”

Hope that better explains index-level volatility and the decline in correlation by constituents.

As an aside, these forces are, too, amplified by the general trend toward “passive” investing. This is a topic for another time, though.

Graphic: Per Nasdaq, “we’ve seen patches of retail selling of stocks that have mostly lasted for less than a week (blue bars in Chart 2). Interestingly, ETFs (yellow bars) remained net buy every single day, albeit at lower levels than usual in the last week of January.”

Technical: As of 6:30 AM ET, Thursday’s regular session (9:30 AM – 4:00 PM ET), in the S&P 500, will likely open in the middle part of a balanced overnight inventory, inside of prior-range and -value, suggesting a limited potential for immediate directional opportunity.

Balance (Two-Timeframe Or Bracket): Rotational trade that denotes current prices offer favorable entry and exit. Balance-areas make it easy to spot a change in the market (i.e., the transition from two-time frame trade, or balance, to one-time frame trade, or trend). 

Modus operandi is responsive trade (i.e., fade the edges), rather than initiative trade (i.e., play the break).

In the best case, the S&P 500 trades higher; activity above the $4,395.25 high volume area (HVNode) puts in play the $4,415.00 untested point of control (VPOC). Initiative trade beyond the VPOC could reach as high as the $4,438.00 key response area and $4,464.75 low volume area (LVNode), or higher.

In the worst case, the S&P 500 trades lower; activity below the $4,395.25 HVNode puts in play the $4,346.75 HVNode. Initiative trade beyond the $4,346.75 could reach as low as the $4,285.50 HVNode and $4,227.75 overnight low (ONL), or lower.

Click here to load today’s key levels into the web-based TradingView charting platform. Note that all levels are derived using the 65-minute timeframe. New links are produced, daily.
Graphic: 65-minute profile chart of the Micro E-mini S&P 500 Futures.

Definitions

Volume Areas: A structurally sound market will build on areas of high volume (HVNodes). Should the market trend for long periods of time, it will lack sound structure, identified as low volume areas (LVNodes). LVNodes denote directional conviction and ought to offer support on any test. 

If participants were to auction and find acceptance into areas of prior low volume (LVNodes), then future discovery ought to be volatile and quick as participants look to HVNodes for favorable entry or exit.

POCs: POCs are valuable as they denote areas where two-sided trade was most prevalent in a prior day session. Participants will respond to future tests of value as they offer favorable entry and exit.

Overnight Rally Highs (Lows): Typically, there is a low historical probability associated with overnight rally-highs (lows) ending the upside (downside) discovery process.

About

After years of self-education, strategy development, mentorship, and trial-and-error, Renato Leonard Capelj began trading full-time and founded Physik Invest to detail his methods, research, and performance in the markets.

Capelj is also a Benzinga finance and technology reporter interviewing the likes of Shark Tank’s Kevin O’Leary, JC2 Ventures’ John Chambers, FTX’s Sam Bankman-Fried, and ARK Invest’s Catherine Wood, as well as a SpotGamma contributor developing insights around impactful options market dynamics.

Disclaimer

Physik Invest does not carry the right to provide advice.

In no way should the materials herein be construed as advice. Derivatives carry a substantial risk of loss. All content is for informational purposes only.
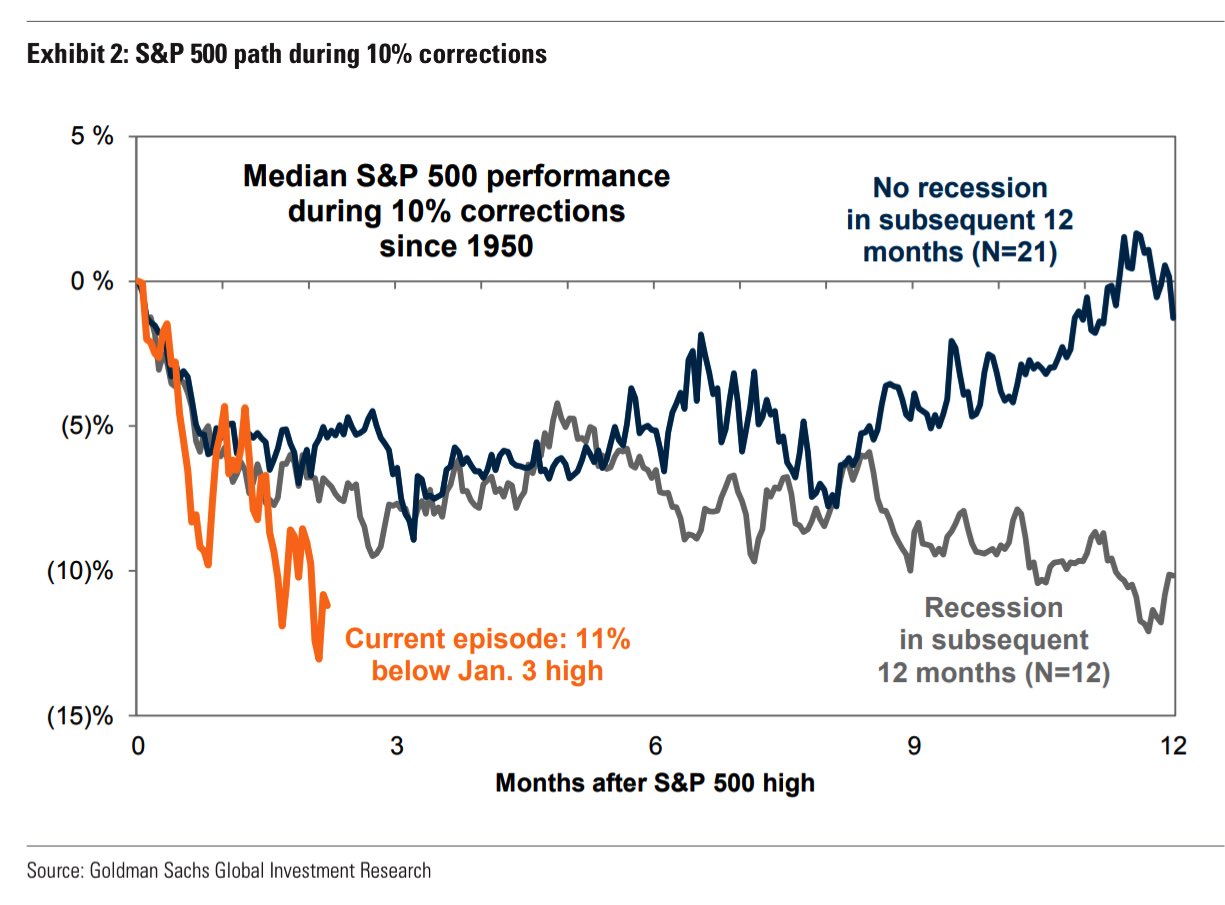
Categories
Commentary

Daily Brief For March 2, 2022

Editor’s Note: The Daily Brief is a free glimpse into the prevailing fundamental and technical drivers of U.S. equity market products. Join the 200+ that read this report daily, below!

What Happened

Overnight, futures were mixed. The equity indices auctioned sideways to higher, in line with most commodity products. Bonds were lower, as was the VIX, an implied volatility measure.

Pursuant to the VIX remark, volatility measures in the rates, foreign exchange, and commodity markets are surging amidst geopolitical uncertainties and monetary policy action.

Ahead is data on ADP employment (8:15 AM ET), Fed-speak by Charles Evans (9:00 AM ET), James Bullard (9:30 AM ET), and Jerome Powell (10:00 AM ET). Later, is a release of the Beige Book (2:00 PM ET).

Graphic updated 6:30 AM ET. Sentiment Neutral if expected /ES open is inside of the prior day’s range. /ES levels are derived from the profile graphic at the bottom of the following section. Levels may have changed since initially quoted; click here for the latest levels. SqueezeMetrics Dark Pool Index (DIX) and Gamma (GEX) calculations are based on where the prior day’s reading falls with respect to the MAX and MIN of all occurrences available. A higher DIX is bullish. At the same time, the lower the GEX, the more (expected) volatility. Learn the implications of volatility, direction, and moneyness. SHIFT data used for S&P 500 (INDEX: SPX) options activity. Note that options flow is sorted by the call premium spent; if more positive, then more was spent on call options. Breadth reflects a reading of the prior day’s NYSE Advance/Decline indicator. VIX reflects a current reading of the CBOE Volatility Index (INDEX: VIX) from 0-100.

What To Expect

Fundamental: Cross-asset volatility is spiking as investors look to protect against Russia-Ukraine and monetary policy action, among other things.

Graphic: Via @EffMktHype. “Rate vol through the roof, FX picking up steam while equity vol arguably still cheap in comparison despite being at the high end of its 1-year end.” Please note the spike in rate and FX vol versus equity vol (which is sideways to higher, mostly).

Very interesting is action in the rates market where there was a “5-sigma upward shift in MOVE on 3/1/22. [This] has happened 13 times prior in the last 22 years,” said one commentator.

Graphic: Via @EffMktHype. Merrill Lynch Option Volatility Estimate (INDEX: MOVE).

Taken together, the bond market’s pricing of risk – reflected by the Merrill Lynch Option Volatility Estimate (INDEX: MOVE) – is not in line (or moving in-step) with equity market risk, via the CBOE Volatility Index (INDEX: VIX).

The fear in one market tends to feed into the fear of another; regardless of the cause, it seems that equity and bond market participants are not (quite) on the same page.

Moreover, this is in part beyond a decline in liquidity (the variable that’s been connected with the creation of wealth through higher asset prices over time), and has much to do with participants “de-risking” amidst a wide distribution of potential outcomes, another commentator explained

These fears are in the face of emerging risks to growth (given Russia-Ukraine and beyond); the question is whether there is a dovish surprise and this lends to assuaging participants of fear.

Graphic: Via @EffMktHype. “Forward OIS have coalesced since end-Jan and started to aggressively price out rate hikes.”

Taking a look at the U.S. high yield OAS (option-adjusted spread), participants see a “risk-off” bottom; deteriorating credit conditions are a bearish leading indicator. 

Will there be further deterioration that feeds into an eventual repricing of equity market risk? Or, will there be a pullback on hawkishness like the market has started pricing?

Graphic: Via St. Louis Fed. ICE BoA High YIeld OAS.

Positioning: Pursuant to the remarks made on equity implied volatility, March 1, 2022, was “the first day since late January that the options market [was] pricing up volatility a noteworthy but not extreme amount (on a closing basis).”

This is, per SpotGamma, amidst participants’ heightened demand for downside (put) protection; in purchasing protection, traders indirectly take liquidity as counterparties hedge exposure in the underlying.

The effects of this hedging are more notable given reticence on the part of counterparties.

“Essentially, with markets swinging there is a hesitance amongst liquidity providers to step in. This creates an environment in which the absorption of orders deteriorates,” SpotGamma explains. “Given this, the hedging of options exposure further amplifies market moves.”

A heightened VIX, in the face of an equity market that is not trading much weaker, is a clear reflection of this so-called reticence.

Pictured: SqueezeMetrics highlights implications of volatility, direction, and moneyness.

Going forward, bearing in mind the continued passive buying support alluded to in past commentaries, if participants were to be assuaged of their fears, that would likely coincide with less(er) demand for downside protection and compression in volatility.

The implications of this? Reduced demand for protection coincides with less counterparty negative gamma exposure (as counterparty put buying [a negative delta, positive gamma trade] coincides with the addition of liquidity [purchase of underlying, a positive delta trade]). 

In counterparties being less exposed to losses on the downside (via reduced negative gamma exposure), their (re)hedging may bolster attempts higher (i.e., open the door to the upside).

The likelihood of this dynamic coming to fruition is low(er), up until the passage of the Federal Open Market Committee event March 15-16, 2022, and options expiration (that same week).

Graphic: Fear and demand for protection concentrated in shorter-dated contracts most sensitive to changes in implied volatility and direction results in pressure from hedging. The compression of volatility likely coincides with support of attempts higher (as this removes pressure).

Technical: As of 6:30 AM ET, Wednesday’s regular session (9:30 AM – 4:00 PM ET), in the S&P 500, will likely open in the upper part of a balanced overnight inventory, inside of prior-range and -value, suggesting a limited potential for immediate directional opportunity.

In the best case, the S&P 500 trades higher; activity above the $4,285.50 high volume area (HVNode) puts in play the $4,346.75 HVNode. Initiative trade beyond the $4,346.75 HVNode could reach as high as the $4,398.50 overnight high (ONH) and $4,415.00 VPOC, or higher.

In the worst case, the S&P 500 trades lower; activity below the $4,285.50 HVNode puts in play the $4,227.75 overnight low. Initiative trade beyond the ONL could reach as low as the $4,177.25 HVNode and $4,137.00 untested point of control (VPOC), or lower.

Considerations: The market is in balance or rotational trade that suggests current prices offer favorable entry and exit. Balance-areas make it easy to spot a change in the market (i.e., the transition from two-time frame trade, or balance, to one-time frame trade, or trend). 

Modus operandi is responsive trade (i.e., fade the edges), rather than initiative trade (i.e., play the break).

Click here to load today’s key levels into the web-based TradingView charting platform. Note that all levels are derived using the 65-minute timeframe. New links are produced, daily.

Graphic: 65-minute profile chart of the Micro E-mini S&P 500 Futures.

What People Are Saying

Definitions

Volume Areas: A structurally sound market will build on areas of high volume (HVNodes). Should the market trend for long periods of time, it will lack sound structure, identified as low volume areas (LVNodes). LVNodes denote directional conviction and ought to offer support on any test. 

If participants were to auction and find acceptance into areas of prior low volume (LVNodes), then future discovery ought to be volatile and quick as participants look to HVNodes for favorable entry or exit.

Gamma: Gamma is the sensitivity of an option to changes in the underlying price. Dealers that take the other side of options trades hedge their exposure to risk by buying and selling the underlying. When dealers are short-gamma, they hedge by buying into strength and selling into weakness. When dealers are long-gamma, they hedge by selling into strength and buying into weakness. The former exacerbates volatility. The latter calms volatility.
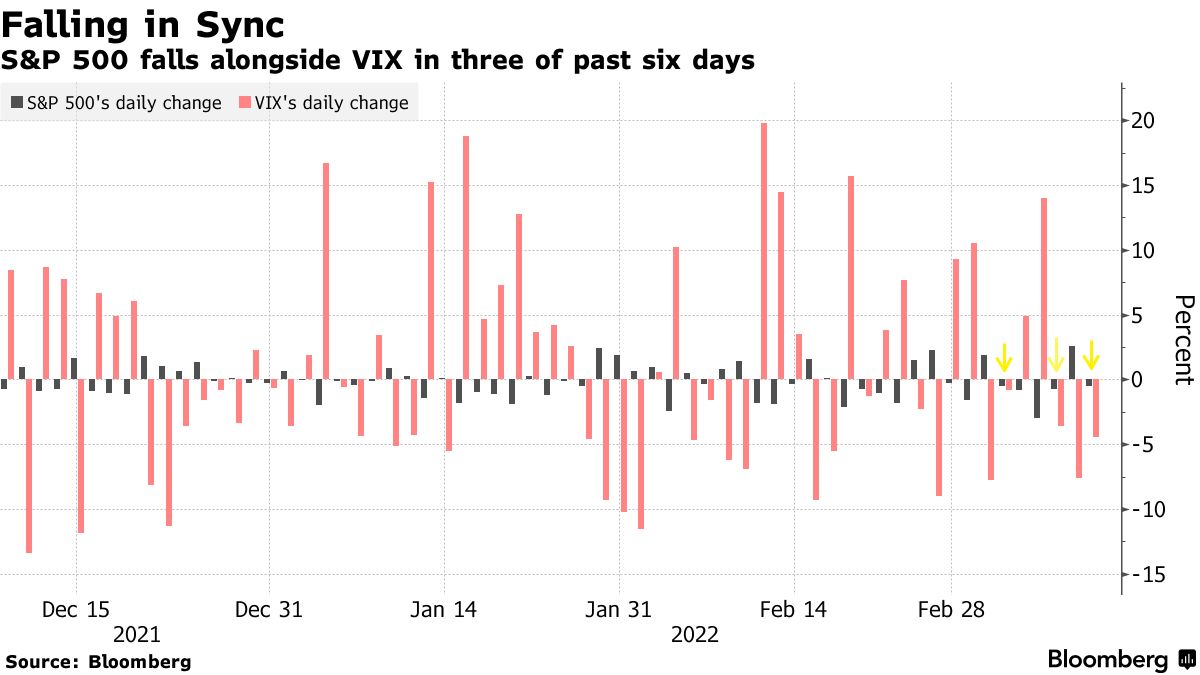
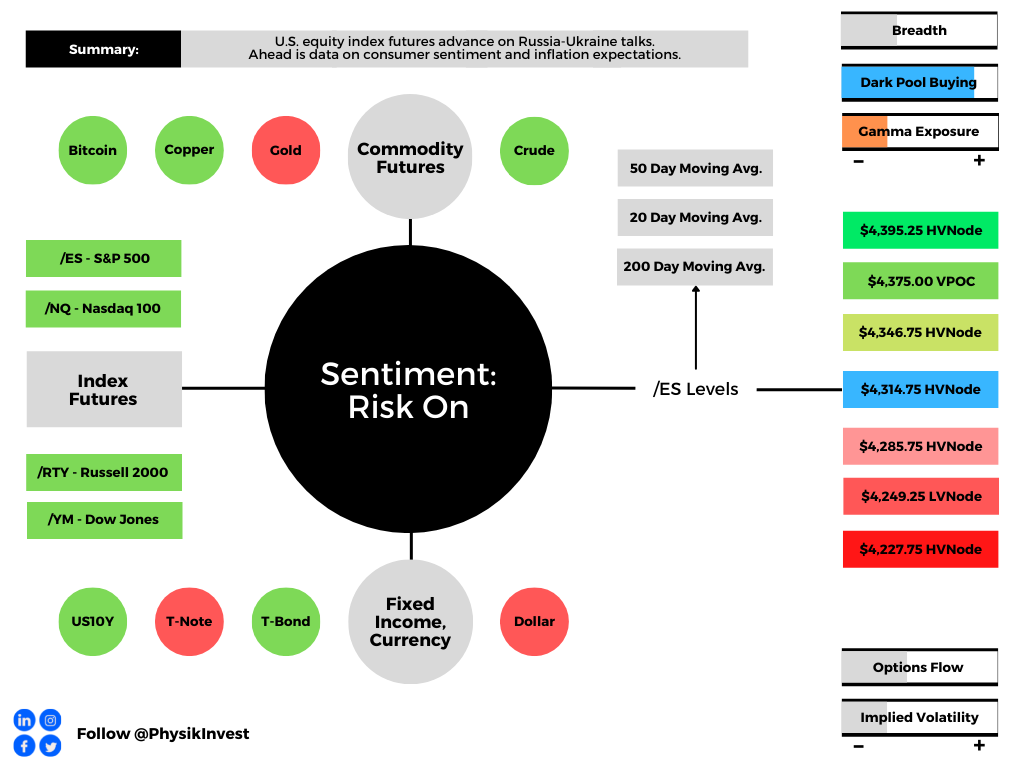
Vanna: The rate at which the delta of an option changes with respect to volatility.

Charm: The rate at which the delta of an option changes with respect to time.
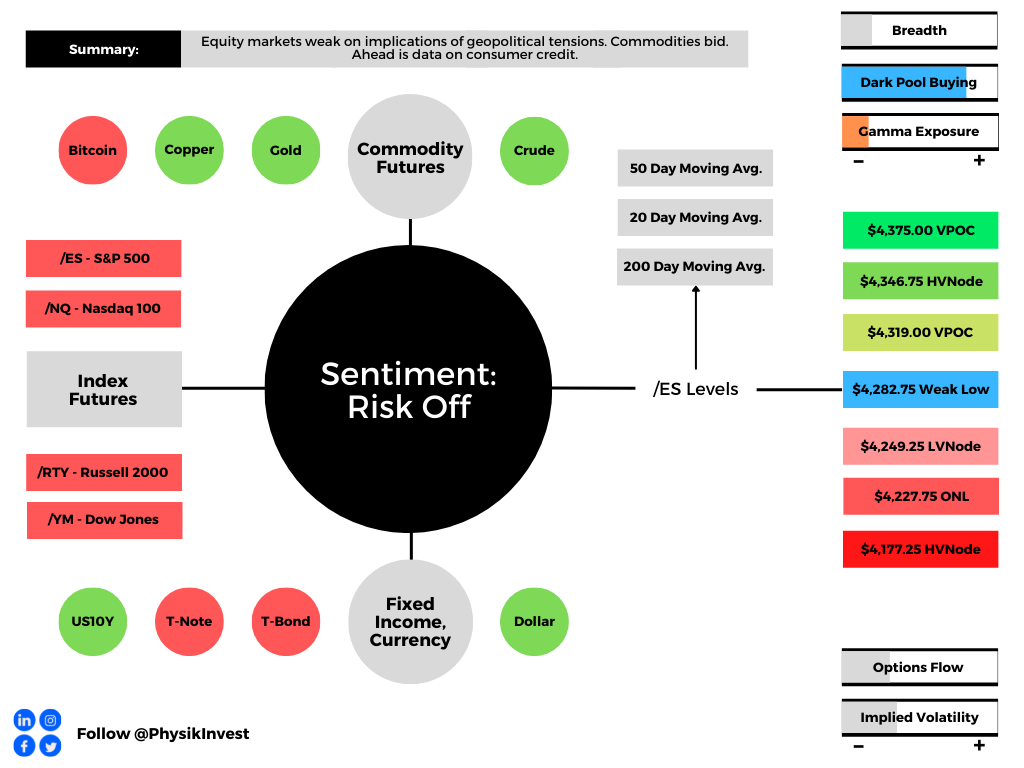
POCs: POCs are valuable as they denote areas where two-sided trade was most prevalent in a prior day session. Participants will respond to future tests of value as they offer favorable entry and exit.

Volume-Weighted Average Prices (VWAPs): A metric highly regarded by chief investment officers, among other participants, for quality of trade. Additionally, liquidity algorithms are benchmarked and programmed to buy and sell around VWAPs.

Rates: Low rates have to potential to increase the present value of future earnings making stocks, especially those that are high growth, more attractive. To note, inflation and rates move inversely to each other. Low rates stimulate demand for loans (i.e., borrowing money is more attractive).

About

After years of self-education, strategy development, mentorship, and trial-and-error, Renato Leonard Capelj began trading full-time and founded Physik Invest to detail his methods, research, and performance in the markets.

Capelj is also a Benzinga finance and technology reporter interviewing the likes of Shark Tank’s Kevin O’Leary, JC2 Ventures’ John Chambers, FTX’s Sam Bankman-Fried, and ARK Invest’s Catherine Wood, as well as a SpotGamma contributor developing insights around impactful options market dynamics. 

Disclaimer

Physik Invest does not carry the right to provide advice.

In no way should the materials herein be construed as advice. Derivatives carry a substantial risk of loss. All content is for informational purposes only.