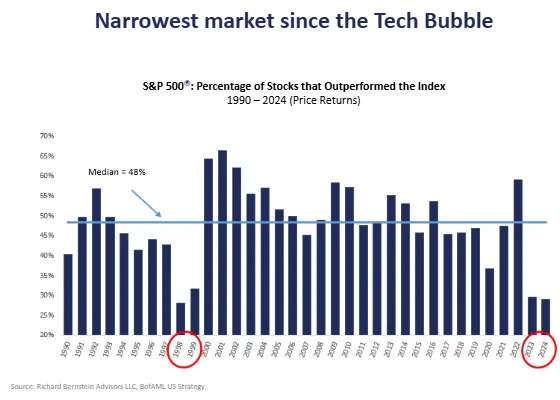
Leading up to the recent decline, market breadth (measuring how many stocks participate in a market move) had weakened. While a handful of dominant stocks masked the weakness, the underlying market was thinning out. Such dispersion [1] [2] [3], where some stocks surge while others lag, can create an illusion of stability in some market environments.
At the same time, liquidity—cash and credit availability—steadily drained from the system. Mechanisms like the reverse repo facility (where banks park excess cash with the Federal Reserve), the Treasury General Account (the government’s cash balance), and money market flows help offset [1] shortfalls. However, this time, they offered little cushion.
New policies—such as tariffs and trade restrictions—reinforce market trends and drive investors toward safer assets like bonds. There is a growing preference for lower bond yields over short-term stock market gains.
While the Federal Reserve controls short-term interest rates, long-term rates are more influenced by broader factors such as inflation expectations, economic growth, and investor sentiment.
Although lower long-term rates can support risk assets, their more immediate and significant impact is on the broader economy. Lowering them reduces borrowing costs for homeowners and businesses, encouraging investment and consumption. Additionally, lowering these yields helps with servicing government debt burdens and improving fiscal stability.
The shifts are intentional. Policymakers are transitioning the economy from dependence on government stimulus, but this adjustment comes with growing pains. Policy narratives and actions may weaken markets and slow economic activity in the short term. One reason receiving attention is the wealth effect—wealthier households, who drive a significant share of consumer spending, tend to spend more when stocks rise. Conversely, market drops can curb this effect and feed an economic slowdown.
Graphic: Retrieved from Bloomberg via @amitisinvesting.
Positioning Context: Setting Up For A Rip
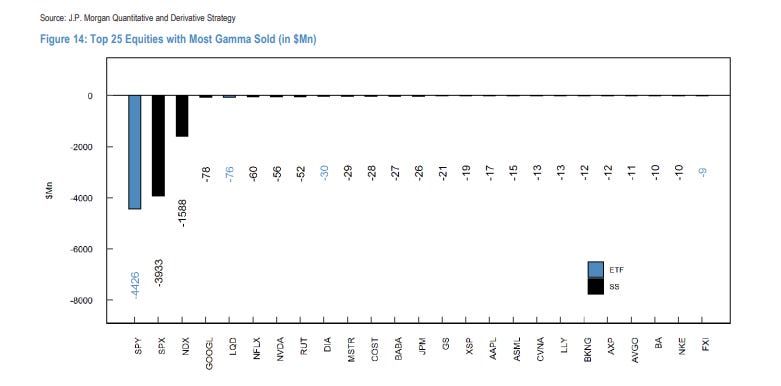
History doesn’t repeat, but it often rhymes. Today’s setup echoes late summer 2024, albeit without the sharp volatility repricing. The difference? This time, investors were prepared, with hedges to act as insurance against market turmoil. The selling has been orderly, creating an illusion of stability and sustaining optimism.
Graphic: Retrieved from JPMorgan Chase via @Marlin_Capital.
This ongoing decline began in mid-February, coinciding with the unwinding of significant amounts of call options—contracts to buy stocks at a set price. This added indirect pressure on the market through hedging-related flows.
SpotGamma expresses this view, highlighting that the February expiration was “call-weighted” due to strong stock performance leading up to it. This increased the likelihood of a pullback, as call sellers unwound their long stock hedges—a simplified explanation, as other offsetting positions may also be in play.
Graphic: Retrieved from SpotGamma.
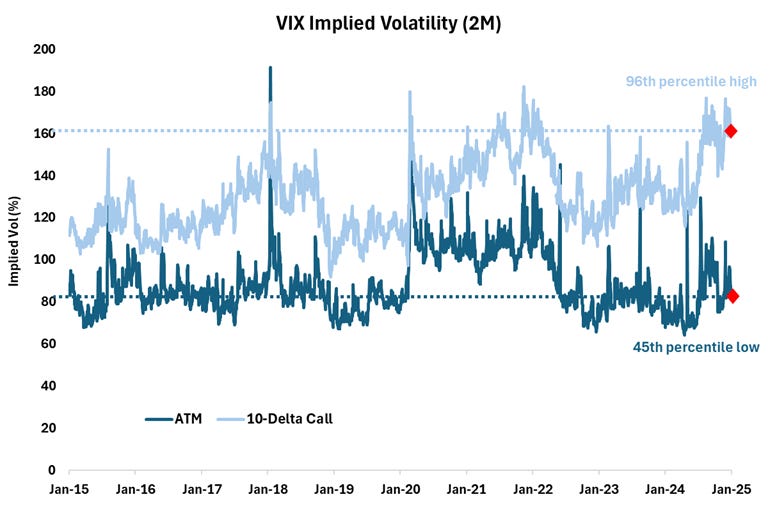
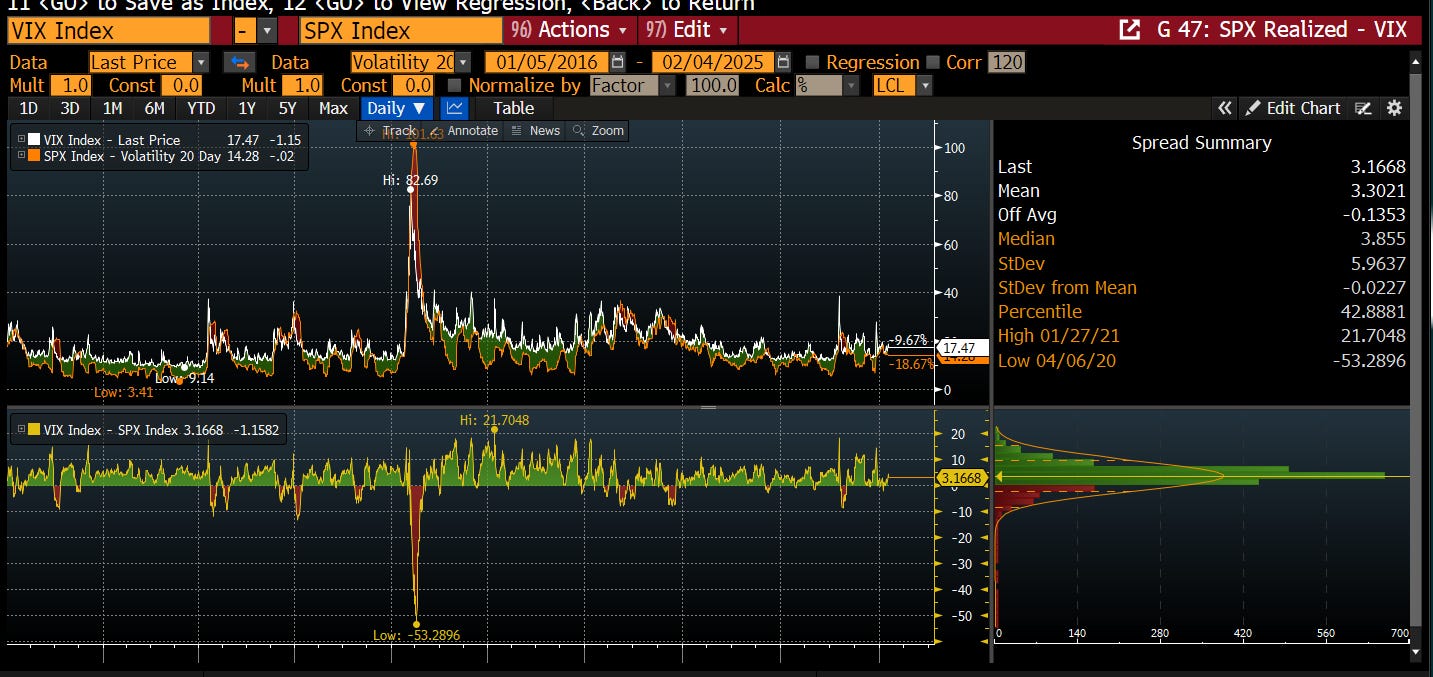
At the same time, after market shocks in August and December 2024, investors focused more on guarding against sudden volatility spikes rather than hedging against a broader market downturn. This pattern is familiar—the S&P 500 and the Cboe Volatility Index (VIX), which measures expected market volatility, sometimes rise together ahead of market peaks.
Meanwhile, within market supply dynamics, this activity has effectively set a floor under VIX pricing, as reflected in the VVIX trending higher since the volatility of late last summer.
Graphic: Retrieved from TradingView.
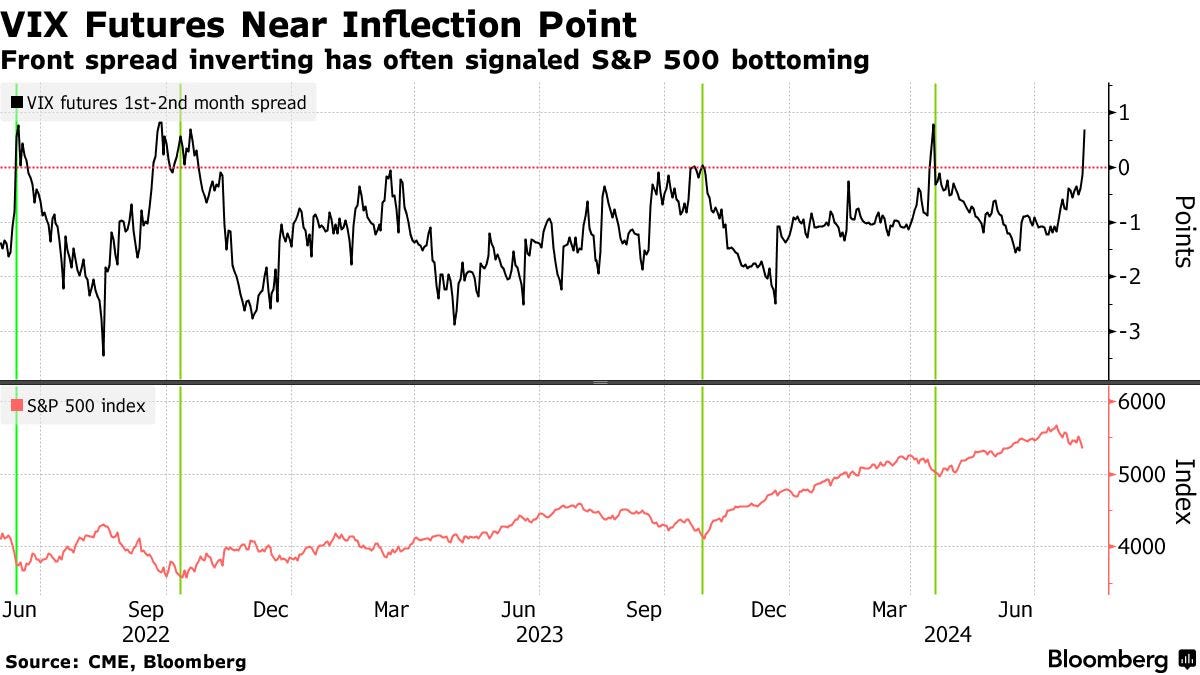
The result? Despite preparations for increased volatility, it hasn’t materialized, frustrating hedge holders and making it harder to identify a market bottom typically marked by extreme volatility spikes. Even with a backwardated implied volatility term structure (where short-term volatility is priced higher than longer-term volatility), anxiety and market movements remain out of sync.
Graphic: Retrieved from TradingView. 1-month VIX less 3-month VIX.
Over time, some traders might shift to longer-dated options, while others might drop their hedges altogether, which could amplify volatility-selling behavior. Ironically, this could create the conditions for shocks they were trying to hedge against.
Given this environment, 2022’s playbook becomes relevant. Back then, investors—rattled by the COVID crash—were prepared, monetizing hedges into declines and keeping a lid on volatility. We may see parallels now. After last week’s economic data, hedgers have been supplying volatility back to the market, offering brief relief as we potentially enter a seasonally stronger period.
Graphic: Retrieved from SpotGamma.
The main takeaway? Current positioning dynamics indicate that investors have effectively managed and responded to the downside. While markets will be volatile, significant shocks may be delayed or avoided.
Graphic: Retrieved from SpotGamma and for illustrative purposes only. SPX prices X-axis. Option delta Y-axis. When the factors of implied volatility (Vanna) and time change (Charm), hedging ratios change. If investors hedge by selling stock to offset long put options, falling implied volatility (as seen in the skew chart above) leads them to buy back the stock, which can support markets.
Context Applied: Trade Structuring
We adapted previously shared structuring guides. Given volatility’s failure to perform, we opted for downside ratios and flies. This worked, and we plan on developing some case studies.
A potential cyclical rebound within a broader period of weakness could be expressed via low-cost positive-delta (bullish) structures, including buying calls while proportionately hedging with stocks or futures, where potential gains from the calls can outweigh hedge-related losses. Additionally, as we prefer, one can deploy verticals and flies, buying options closer to the current market prices while selling more options further out (with an extra far-out option bought to reduce margin requirements if needed).
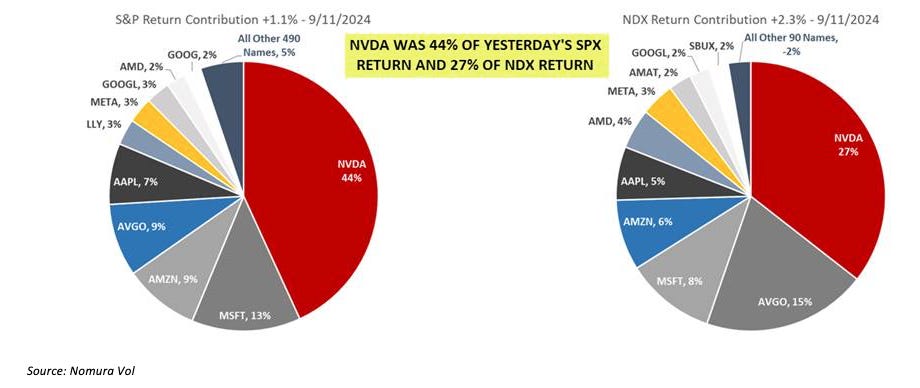
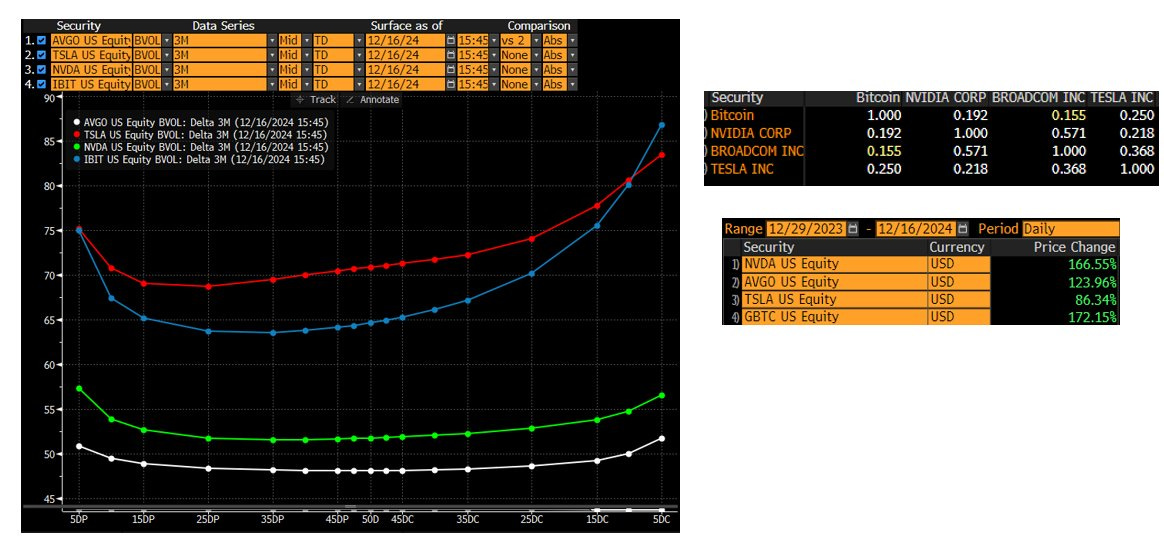
We and others agree that the Nasdaq 100 (NDX) and higher beta stocks are appealing. For one, relative strength pockets emerge in the NDX versus the SPX, potentially attributable to tariffs disproportionately impacting non-tech sectors. Checking options skews, and NDX options farther away in price may be underpriced for the eventually realized volatility.
Graphic: Retrieved from Bloomberg via Nicholas Smith.
For more on structuring across different products, be they gold or Bitcoin, see our Mar-a-LagoAccords letter published last month.
Disclaimer
By viewing our content, you agree to be bound by the terms and conditions outlined in this disclaimer. Consume our content only if you agree to the terms and conditions below.
Physik Invest is not registered with the US Securities and Exchange Commission or any other securities regulatory authority. Our content is for informational purposes only and should not be considered investment advice or a recommendation to buy or sell any security or other investment. The information provided is not tailored to your financial situation or investment objectives.
We do not guarantee the accuracy, completeness, or timeliness of any information. Please do not rely solely on our content to make investment decisions or undertake any investment strategy. Trading is risky, and investors can lose all or more than their initial investment. Hypothetical performance results have limitations and may not reflect actual trading results. Other factors related to the markets and specific trading programs can adversely affect actual trading results. We recommend seeking independent financial advice from a licensed professional before making investment decisions.
We don’t make any claims, representations, or warranties about the accuracy, completeness, timeliness, or reliability of any information we provide. We are not liable for any loss or damage caused by reliance on any information we provide. We are not liable for direct, indirect, incidental, consequential, or damages from the information provided. We do not have a professional relationship with you and are not your financial advisor. We do not provide personalized investment advice.
Our content is provided without warranties, is the property of our company, and is protected by copyright and other intellectual property laws. You may not be able to reproduce, distribute, or use any content provided through our services without our prior written consent. Please email renato@physikinvest for consent.
We reserve the right to modify these terms and conditions at any time. Following any such modification, your continued consumption of our content means you accept the modified terms. This disclaimer is governed by the laws of the jurisdiction in which our company is located.
“Good investing doesn’t come from buying good things, but from buying things well.” – Howard Marks
There is a lot of noise—it’s exhausting. Today, we will sift through the noise and focus on how we can protect and potentially grow our portfolios this year. This is a follow-up to our Market Tremors letter. But first, let’s clarify the context for our approach. This is a long newsletter, so you may have to view it in another window.
Inflation is back in focus, gold is soaring, and investors are optimistic about stocks. Correlations remain low, dispersion is high, and the market’s volatility pricing/positioning obscures potential risks lurking beneath the surface. The macro landscape is shifting rapidly, yet when we zoom out, we’re confronted with something we’ve discussed before: inflation is here to stay!
For a long time, the expectation was that inflation would take a particular shape—a transitory spike and a manageable trend. Instead, structurally, we’re dealing with a world that is moving away from the low-inflation paradigms of the past. The pillars supporting cheap capital and abundant liquidity—globalization and dovish monetary policy—are shifting.
These shifts are neither sudden nor unexpected. In 2023, we wrote much about the narrative of the ideological struggle between the West and East, particularly with the Russia-Ukraine conflict sparking. Historically, whenever Eastern economies prosper, the West adjusts the rules. Now, it’s more about who controls what. Control over assets, inflation, and interest rates define economic power. Folks like Zoltan Pozsar have warned that the fundamental drivers of the low-inflation era—globalization and financialization—are unraveling, leaving policymakers with little choice.
The well-respected Kai Volatility’s Cem Karsan, a mentor to many, has pointed out in excruciating, albeit digestible detail that the trends favoring high-beta portfolios over the past four decades are reversing. Monetary authorities, particularly the Federal Reserve, have been constrained in their ability to address the widening wealth divide. Their response to inflation in the early 2020s—from creating demand to absorb surplus supplies of low-priced items to structurally restricting demand in response to shortages—was intended to guide the economy along a path of managed declines in activity while maneuvering interest rates to prevent another inflationary flare. Rising populism is a byproduct manifesting as shifts in public demand and political sentiment.
Thus, today’s Mar-a-LagoAccords and the broader economic overhaul signify a significant trade, monetary policy, and financial stability restructuring. Tariffs, a U.S. sovereign wealth fund, and global security restructuring are the key issues at this forefront. The implications of this shift are profound, and markets have yet to adjust. A portfolio for this new environment could creatively layer exposure to stocks, bonds, commodities, and volatility. Understanding the pieces herein will be critical for structuring trades and managing risk. Let’s dive in.
Macro Context: A New Economic Framework
#1 – Tariffs
One significant component of this broader economic overhaul is tariffs. Economist Stephen Miran, nominated by the U.S. President to be Chairman of the Council of Economic Advisers, has outlined how tariffs, historically used to influence trade flows, are being retooled as protectionist instruments and an alternative revenue source.
According to Miran’s AUser’sGuidetoRestructuringtheGlobalTradingSystem and fantastic explanations by Bianco Research founder Jim Bianco, a core issue is a persistently strong dollar distorting global trade balances. If paired with currency adjustments, tariffs could redistribute the costs away from U.S. consumers, “present[ing] minimal inflationary or otherwise adverse side effects, consistent with the [U.S.-China trade war] experience in 2018-2019.” However, this approach risks retaliation or distancing from key trading partners, further fracturing global supply chains.
To mitigate these risks, policymakers consider implementing tariffs in phases, gradually increasing rates to address inflationary pressures and market volatility. Even during the 2018-2019 trade war, tariff rate increases were implemented over time. Additionally, tariffs will be driven by national security concerns, targeting industries essential to defense and technological innovation. From this perspective, policymakers view access to the U.S. market as a privilege.
#2 – Sovereign Wealth Fund
A significant consideration is a U.S. sovereign wealth fund leaning on undervalued national assets to restore fiscal stability. Unlike traditional sovereign wealth funds built on surpluses, this fund would operate by revaluing and monetizing domestic reserves.
Key assets under consideration include undervalued gold reserves and billions in government-possessed bitcoin, which could be integrated into this fund. Bianco says these could total nearly $1 trillion.
This strategy introduces volatility concerns. Those concerned say government exposure and potential speculation on financial assets could lead to instability. Should we invest now for later?
#3 – Global Security Agreements
Beyond trade and monetary policy, a core element of the broader economic overhaul is linking military alliances to economic policy. The longstanding framework in which the U.S. provided security to allies without direct compensation is being rethought. The warnings are explicit; note the President’s Davos remarks and the Vice President’s Munich Security Conference speech.
Under a new paradigm, Bianco summarizes that NATO members may be required to contribute more to defense (say ~5% of GDP), foreign-held U.S. Treasury bonds may be converted into 100-year zero-coupon bonds, reducing short-term debt burdens, and tariff structures may be adjusted based on a country’s alignment with U.S. security interests.
“What Miran said in his paper is: you owe us so much for the last 80 years that what we want to do is a debt swap,” Bianco explains how the U.S. can be paid for being the world’s protector. “Those NATO countries have trillions of dollars of debt. [You’ll] swap it for 100-year or perpetual zero coupon non-marketable Treasury securit[ies]. So, you’re going to swap $10 billion worth of Treasuries for a $10 billion coupon century bond [that] won’t mature for 100 years, [and] won’t get any interest.”
In short, this is a fundamental shift that requires allies to bear a more significant share of security and costs. It’s the Mar-a-LagoAccords, a new financial order and policy framework akin to past agreements that reshaped the global economy, such as the Bretton Woods Agreement of 1944, which established the U.S. dollar as the international reserve currency, and the Plaza Accord of 1985, which coordinated currency adjustments to correct trade imbalances.
The proposed Mar-a-LagoAccords aim to reprice U.S. debt through asset monetization, weaken the dollar to improve U.S. export competitiveness and enforce tariff structures to rebalance global trade.
Positioning Context: Market Positioning Obscures
Tariff-driven price pressures, a weaker dollar, and a floor under interest rates raise bond yields, corporate borrowing costs, and strain leveraged players. This backdrop favors debasement plays and perceived safe havens like bitcoin and gold, which have been climbing for reasons discussed in the past and present.
Graphic: Retrieved from Bloomberg via @convertbond.
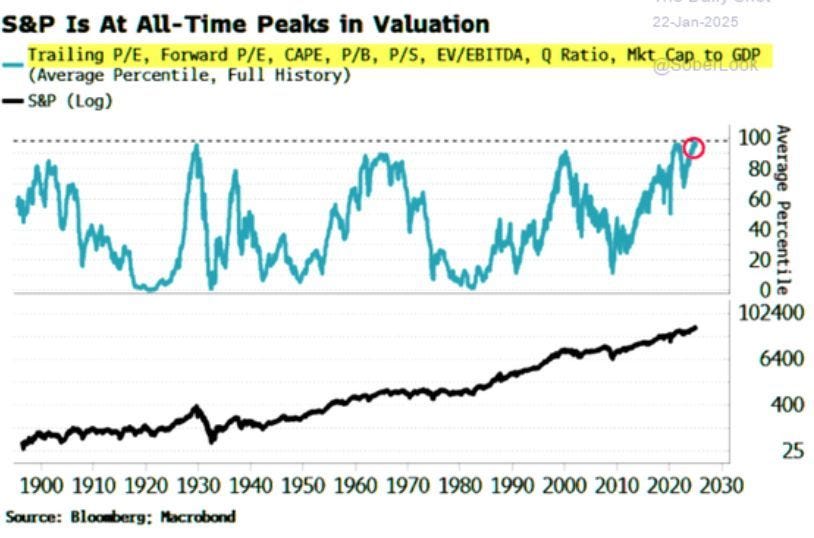
Equities face a less promising outlook. Oaktree Capital highlights that decade-long returns have historically been lackluster when investors bought the S&P 500 at today’s multiples. As Howard Marks puts it, earning +/-2% annually isn’t disastrous—but the real risk lies in a sharp valuation reset, compressed into just a few years, much like the brutal selloffs of the 1970s and 2000s.
Graphic: Retrieved from Bloomberg via Bob Elliott.
While the current market environment may feel frothy, with stretched valuations and narrow leadership, we’re not in an imbalanced 1970s scenario. Also, the possibility of a dollar devaluation serves as a tailwind for S&P 500 earnings, potentially boosting stock prices, Fallacy Alarm explains. Markets are not irrational; instead, they could face modest returns of around 5-6% annually for stocks and bonds over the next decade. Such sanguine sentiment is evident in the options/volatility market, reflecting the distribution of future possible outcomes; the trading and hedging of options make them a robust gauge of future outcomes—offering a view of where markets stand and where they might be headed.
Graphic: Retrieved from Bank of America via Bloomberg.
We observe several key happenings:
#1 – Hedging Volatility Spikes, Not Market Crashes
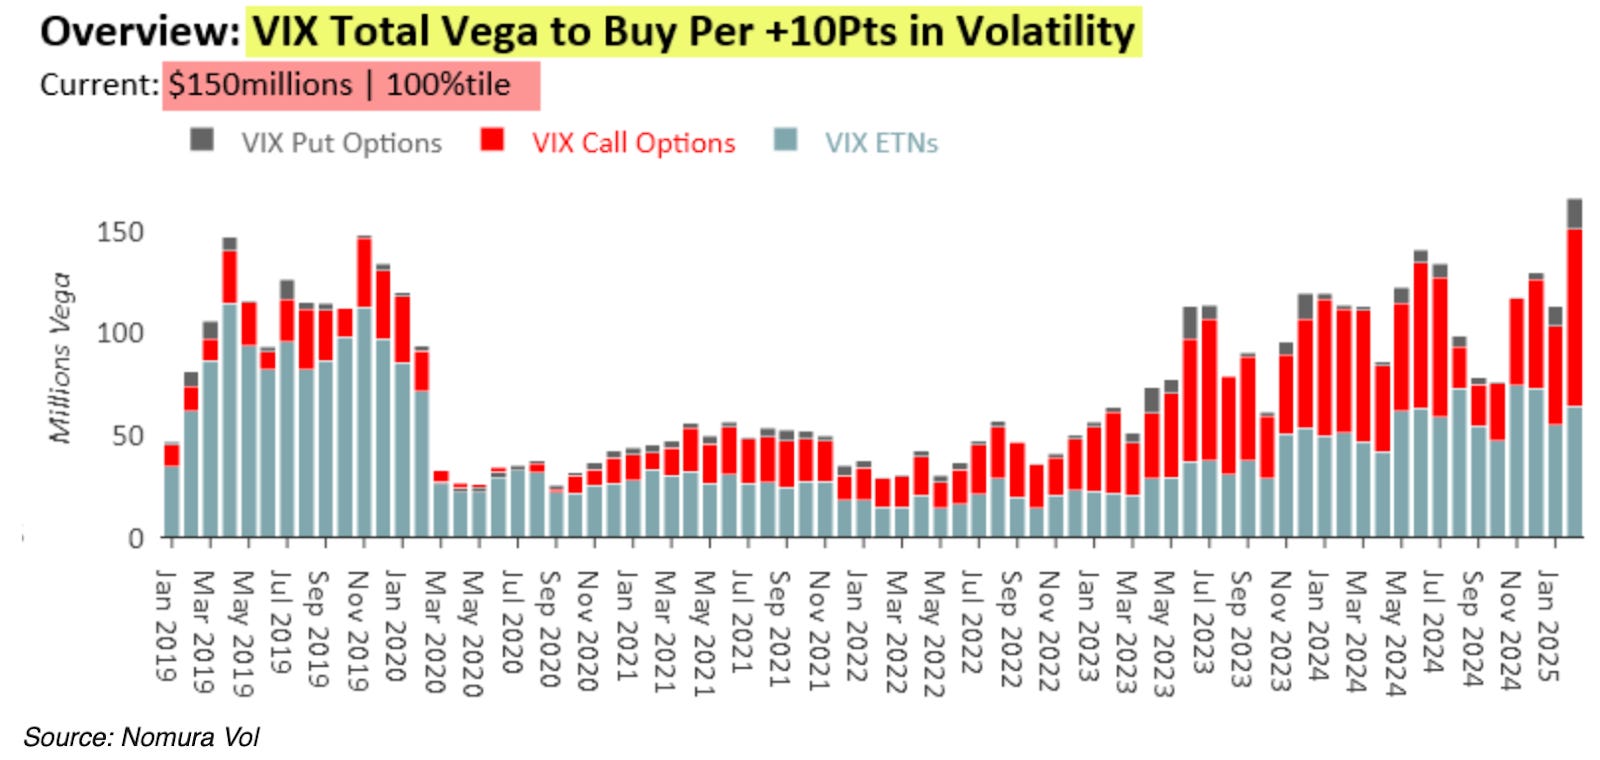
Investors are hedging against potential volatility spikes like those seen on August 5, 2024, when the VIX exploded higher. While the S&P 500 grinds upward and the VIX drifts lower and appears cheap (<16), the VVIX—“VIX of the VIX”—remains elevated. This unusual divergence manifests from demand for VIX calls, suggesting the market worries sharp repricings of risk are more likely than broad equity selloffs. The dynamic boils down to supply and demand; SPX options remain underappreciated—why protect when the market seems stable—meanwhile, VIX options are in demand, bolstering VVIX.
SpotGamma highlights this massive VIX call buying, noting dealer short convexity positioning suggests that, should volatility “wake up,” there could be significant downside pressure on equities and upside pressure on volatility, reinforcing the view that the VVIX’s elevated levels could signal a potential volatility spike, rather than a broad market crash.
“The aforementioned vega supply is indeed large, but it is innocuous unless provoked,” SpotGamma’s founder Brent Kochuba explains. Still, “with correlation stretched and IVs at lows, there is the potential for an SPX index short vol cover/single stock spasm to push into this upside vega convexity – something that we think a sharp NVDA [earnings] miss could spark.”
#2 – Options Selling and the ‘Buy My Course’ Gurus
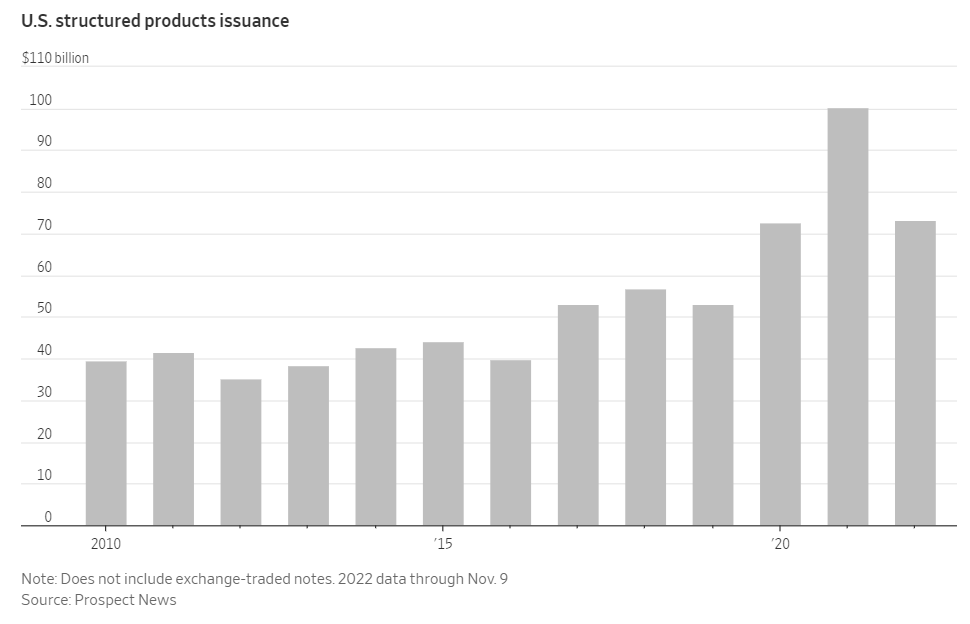
Investors are leaning toward short-dated options selling (sometimes packaged within an ETF structure, without regard for price and thoroughly assessing broader market positioning) and structured products.
Graphic: Retrieved from JPMorgan via @jaredhstocks.
As QVR Advisors’ Benn Eifert explains, dynamic creates opportunity: deep out-of-the-money, long-dated volatility in single stocks looks attractive for tail-risk hedging. But there’s a catch—the persistence of this activity reinforces spot-vol covariance (i.e., the relationship between the underlying movements or spot and its volatility or vol). If the market shifts and volatility rises as the underlying asset moves up/down (the usual pattern flips), long volatility positions could become highly profitable, as it is then they would benefit from this reversal in spot-vol dynamics (e.g., 2020).
Graphic: Retrieved from Bloomberg via Kris Sidial. Volatility is fair in indexes; “much better opportunities in singles right now.”
As SpotGamma elaborated, if strength through earnings persists, “it will supply a final equity vol and correlation drop (a ‘final vol squeeze’), ushering in a blow-off equity top. At the same time, these metrics are low enough to justify owning 3-6 month downside protection, as bad things usually happen from these vol levels.”
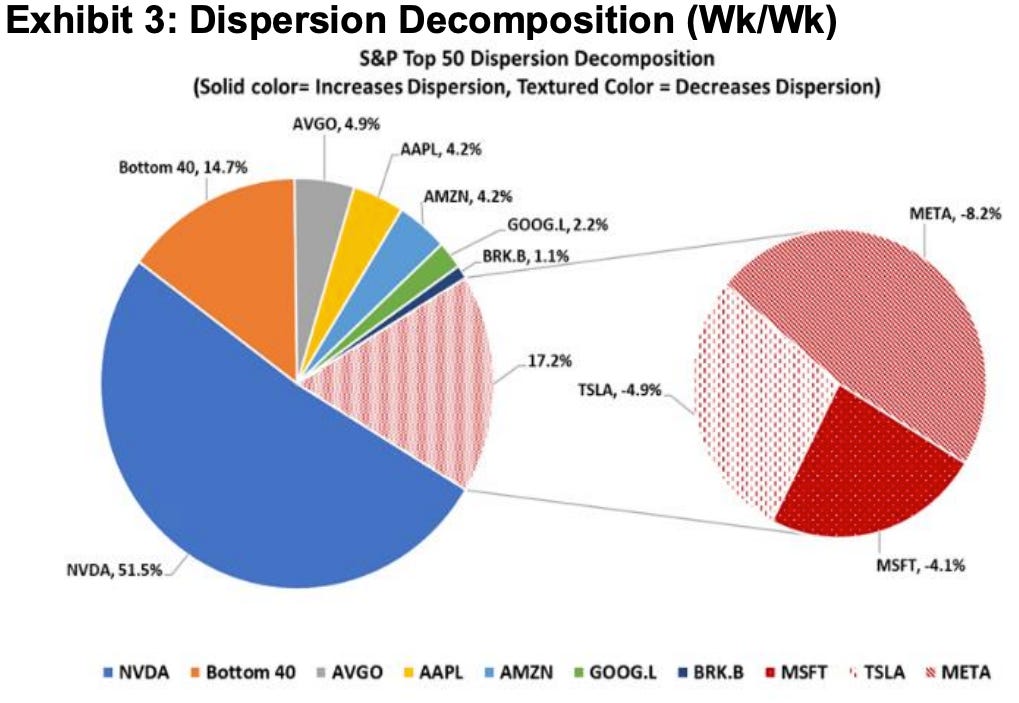
Graphic: Correlation via TradingView. Stocks are expected to move more independently. Peep the pre-2018 Volmageddon levels.
As an aside, implied correlation measures the degree to which the prices of the assets in the basket are expected to move together (positively correlated) or in opposite directions (negatively correlated). Low correlation, in this case, indicates that the stocks are expected to move independently or in opposite directions; hence, dispersion trades betting on this have performed well.
#4 – The Changing Narrative of Bitcoin and Its Maximalists
Similar patterns emerge in bitcoin. As countries face currency debasement and economic stresses, bitcoin stands out as a hedge to some. Like equities, bitcoin options are underappreciated.
For example, implied volatility has traded under 50% for one-month options, representing an attractive entry point for those looking to position themselves for a surge. This low volatility environment in Bitcoin mirrors the opportunities in equities. Here, bitcoin benefits from any volatility reversal, presenting a compelling case for those looking to participate in a big market move.
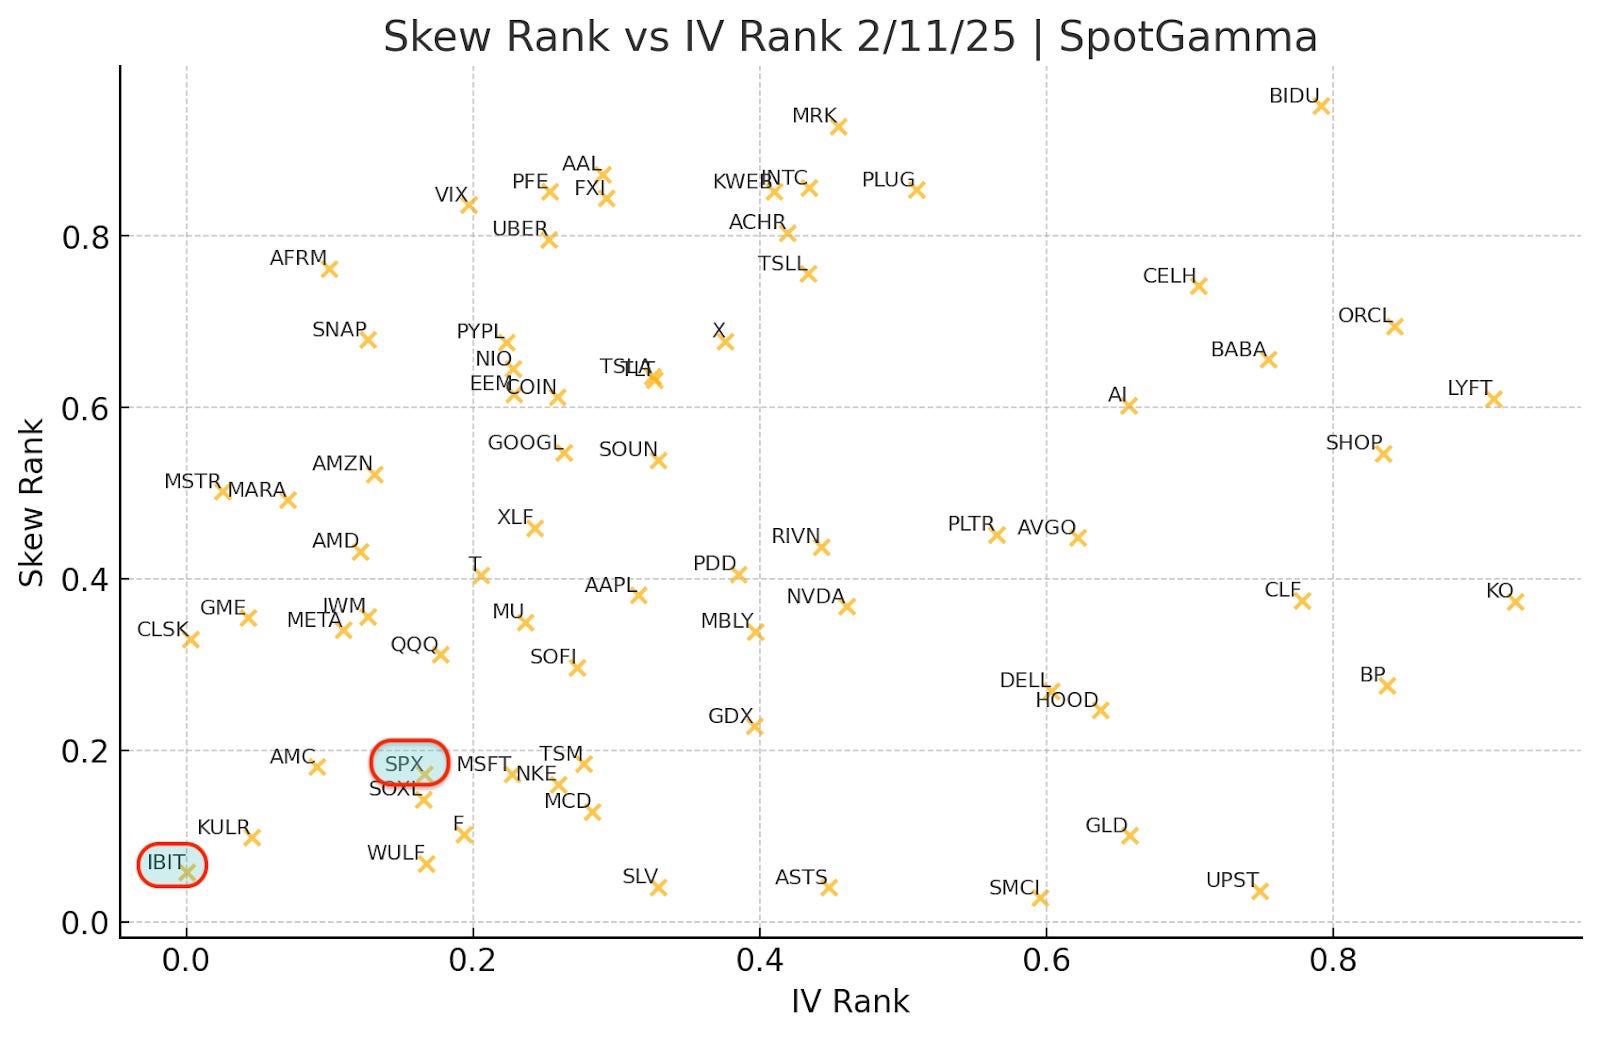
Graphic: Retrieved from SpotGamma. Higher skew and IV rank suggest calls are expensive and moves are stretched.
Context Applied: Trade Structuring
Trade structuring this year is all about creativity. We’ve added the following to our portfolios.
#1 – Rates
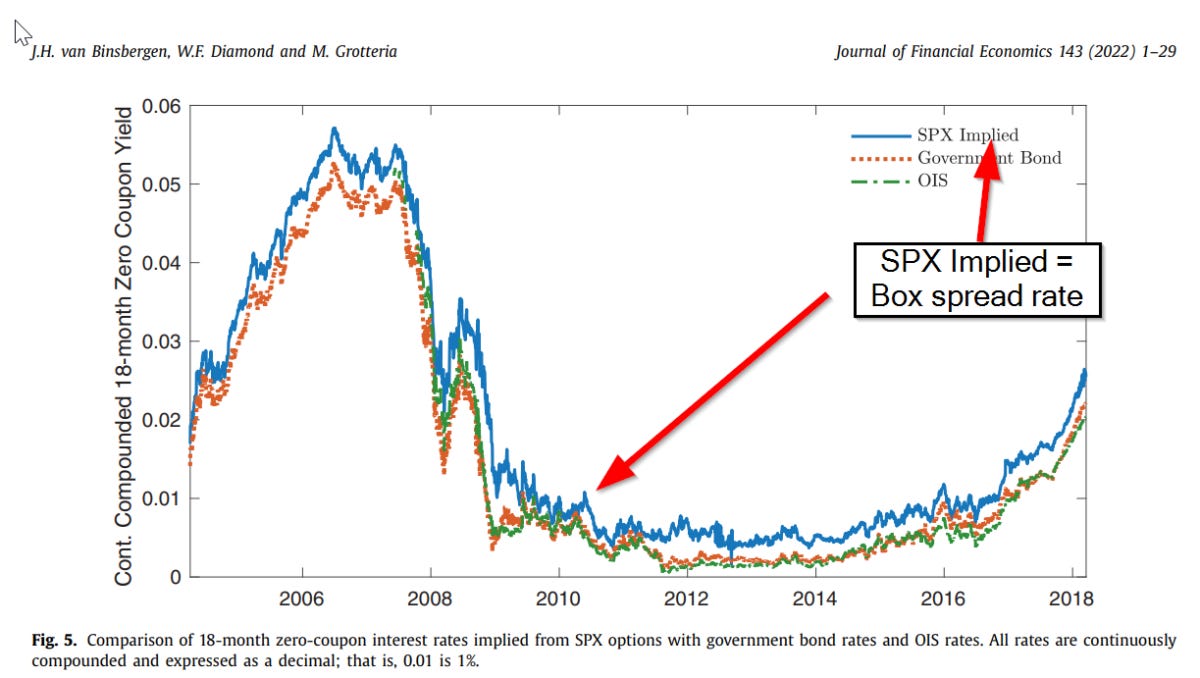
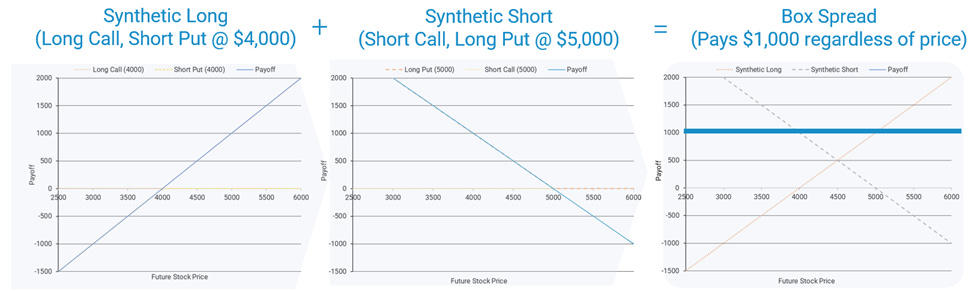
One efficient structure for safeguarding cash is the box spread, which offers several key benefits: a convenience yield, capital efficiency (especially for users of portfolio margin), easy execution via most retail brokers, and favorable tax treatment—60% long-term and 40% short-term if executed using cash-settled index options (e.g., SPX). This strategy combines a bull call spread and a bear put spread, matching lower and higher strikes and the same expiration date.
We frequently trade such structures. For instance, here’s one we purchased at the beginning of this year: BOT +1 IRON CONDOR SPX 100 (Quarterlys) 31 DEC 25 4000/7100/7100/4000 CALL/PUT @2964.25 CBOE
In this case, we invest $296,425 now to receive $310,000 in a year. This represents an implied interest rate of 5.32% or ((3100-2964.25)/2964.25)*(365/314)=0.053234. Note that there is a convenience yield, and that’s due to counterparty risk, as box spreads depend on the Options Clearing Corporation (OCC) to guarantee the transaction.
Tools like boxtrades.com help with tracking yields and finding attractive box structures.
Box trades unlock the power of yield stacking, enhancing returns by layering multiple exposures without increasing capital outlay. They preserve full buying power with portfolio margin for margin-intensive trades like synthetic longs.
For non-portfolio margin traders, yield stacking is less applicable. Instead, you can allocate ~95% of cash to box spreads, locking in your principal at maturity while risking only ~5% (the interest you stand to make), with limited downside.
Low correlation and subdued implied volatility signal stability, but any disruption could spark sharp moves.
As we explained better in Reality Is Path-Dependent, Cem Karsan notes that a slow grind higher cheapens options, fueled by continued volatility selling. Eventually, realized upside volatility will surpass implied, prompting smart money to buy options at these discounts. If the VIX holds steady or rises, it suggests fixed-strike volatility is creeping up, potentially forcing options counterparties to cut exposure or hedge, boosting markets higher; increased call demand could push counterparties to hedge by buying the underlying asset, reinforcing stability and giving a floor to options prices and the market by that token.
The play here? Replace stock exposure with options. You can buy calls outright and hedge them by selling stock—gains on the calls should outpace hedge losses. Karsan has talked about this a lot. One of our moves is to structure broken-wing butterflies or similar: buy an option near the money, sell a larger number of options further out, and cap risk with an even farther out option. In this environment, you can often put on these trades for little cost and exit at multiples higher if the market drifts sideways or up. Please see our website for case studies and example trades.
Don’t overlook crypto, either. Implied volatility remains underappreciated in bitcoin, making synthetic exposures compelling. Swapping spot for synthetic alternatives is a play on these opportunities. Though we haven’t touched them, check out Cboe’s cash-settled options on spot bitcoin: the Cboe Bitcoin US ETF Index (CBTX) and Cboe Mini Bitcoin US ETF Index (MBTX).
#3 – Hedging
Though less attractive now, VIX calls and call spreads remain a powerful tool for hedging tail risks. In our RealityIsPath-Dependent letter, we explore this topic further.
There are more compelling structures within the S&P 500 complex, particularly back spreads. For example, a put back spread involves selling a higher strike put option and buying a larger number of lower strike put options, positioning you to profit from substantial volatility shifts—similar to what we saw on August 5, 2024.
Although this structure takes advantage of the market’s unappealing volatility skew, drift presents challenges; if volatility fails to perform well during a downturn, you risk losing more money than you initially invested in the spread. Caution!
Graphic: Retrieved from Bloomberg via Goldman Sachs.
Bonus: From the White House to Wall Street
We had the opportunity to catch up with Steven Orr, founder of Quasar Markets. We discussed his career and the future of fintech and trading technology. Before Quasar Markets, Orr worked as an executive at Money.net and Benzinga. He also serves on the board of the American Blockchain and Cryptocurrency Association. His diverse background includes positions with the White House, the U.S. State Department, the PGA Tour, the NBA, and various professional sports leagues. Orr frequently shares his insights on TV and appears at events like the World Economic Forum. Check it out, and thank you, Steven!
Disclaimer
By viewing our content, you agree to be bound by the terms and conditions outlined in this disclaimer. Consume our content only if you agree to the terms and conditions below.
Physik Invest is not registered with the US Securities and Exchange Commission or any other securities regulatory authority. Our content is for informational purposes only and should not be considered investment advice or a recommendation to buy or sell any security or other investment. The information provided is not tailored to your financial situation or investment objectives.
We do not guarantee the accuracy, completeness, or timeliness of any information. Please do not rely solely on our content to make investment decisions or undertake any investment strategy. Trading is risky, and investors can lose all or more than their initial investment. Hypothetical performance results have limitations and may not reflect actual trading results. Other factors related to the markets and specific trading programs can adversely affect actual trading results. We recommend seeking independent financial advice from a licensed professional before making investment decisions.
We don’t make any claims, representations, or warranties about the accuracy, completeness, timeliness, or reliability of any information we provide. We are not liable for any loss or damage caused by reliance on any information we provide. We are not liable for direct, indirect, incidental, consequential, or damages from the information provided. We do not have a professional relationship with you and are not your financial advisor. We do not provide personalized investment advice.
Our content is provided without warranties, is the property of our company, and is protected by copyright and other intellectual property laws. You may not be able to reproduce, distribute, or use any content provided through our services without our prior written consent. Please email renato@physikinvest for consent.
We reserve the right to modify these terms and conditions at any time. Following any such modification, your continued consumption of our content means you accept the modified terms. This disclaimer is governed by the laws of the jurisdiction in which our company is located.
This edition shouts out Public.com, a multi-asset investing platform built for those who take investing seriously. Public recently launched Alpha, an AI investment exploration tool, in the app store. We’re excited to host co-founder and co-CEO Jannick Malling on the next podcast to discuss the market and how AI levels the playing field. Stay tuned!
When market expectations drift too far from underlying fundamentals, they eventually become unsustainable. This sometimes leads to corrections that can trigger cascading effects across the broader market.
It is prevailing investment practices that partly fuel such a dynamic. While concepts like diversification and efficient markets appear sound, they often fail to account for the pressures investors face in practice. For instance, sophisticated retail investors have no mandate and typically have the space to make deliberate, calculated decisions. On the other hand, institutional-type investors, driven by the need to deliver consistent short-term profits, may feel compelled to chase returns. This pressure can lead to riskier behaviors, such as betting on low volatility by selling options. While this may produce steady returns in calm markets, it exposes investors to sudden shocks, volatility repricings, and forced unwinds when markets turn unexpectedly. Investors are often unprepared for such volatility, seldom owning options outright due to the rarity of shocks. This creates a market landscape skewed toward a “winner-takes-all” outcome, where only a few are positioned to benefit from such rare moments.
The following sections explore this realm of increasingly frequent, dramatic, and unpredictable outcomes. Let’s dive in.
In our excruciatingly detailed ‘Reality is Path-Dependent’ newsletter, we explored how markets are shaped by reflexivity (feedback loops) and path dependency (how past events influence the present), setting the stage for August 2024’s turbulence and recovery.
To recap, we noticed that while individual stocks experienced big price swings, the broader indexes, like the S&P 500—representing those stocks—showed restraint. Remarkably, the S&P 500 went over 350 sessions without a single 2% or more significant move lower, reflecting this calm. This happened because of a mix of factors, including many investors focusing on broader market calm, often expressed by selling options and, in some cases, using their profits to double down on directional bets in high-flying stocks. This helped create a gap between the calmer movements in the indexes and wilder swings in individual stock components, leading to falling correlations; beneath the surface, big tech, AI, and Mag-7 stocks gained ground, while smaller stocks in the index struggled, as shown by fewer stocks driving the market higher (weaker breadth).
By arbitrage constraints, declining correlation is the reconciliation. When investors sell options on an index, the firms on the other side of the trade—like dealers or market makers—dynamically hedge their risk. They may do this by buying the index as its price drops and selling it when it rises, which can help keep the index within a narrower range and reduce actual realized volatility. However, this doesn’t apply as much to individual stocks, where we observed more options buying. For these stocks, hedging works differently: dealers may buy when prices rise and sell when prices fall, reinforcing trends and extending price moves. This creates a situation where the index stays relatively calm, but its components can swing more wildly.
Anyway, we noticed that as the connection between the index and its stocks was weakening, traders who bet on these differences (called dispersion) profited. As more participated in this and other volatility-suppressing trades, it became more successful. This shows how feedback loops (reflexivity) and past events (path dependency) influence future market behavior. Overall, this trade helped sustain the market rally and added stability as lesser-weighted stocks stepped up to offset the slowdown in leaders in July.
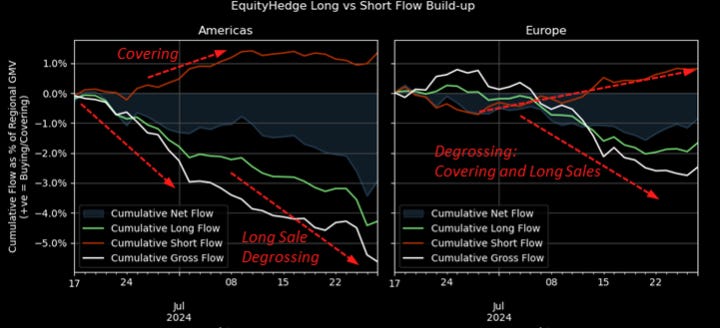
However, we speculated about the risks of a broader “sell-everything” market. Waning enthusiasm for big tech stocks and broader market selling on the news could manifest demand for protection (such as buying longer-dated put options). During the quieter, less liquid summer months, this could trigger increased volatility and lead to a sharp sell-off (as dealers or market makers hedge in the same direction the market’s moving, amplifying moves). Although low and stable volatility gave an optimistic market outlook, we considered advanced structures to hedge against potential pullbacks at low cost, including ultra-wide, broken-wing NDX put butterflies, ratio spreads, and low-cost VIX calls and call spreads (which, by way of the VIX being an indirect measure of volatility or volatility squared, offer amplified protection in a crash). In the event of market weakness, these structures would be closed/monetized, with the proceeds/profits used to lower the cost of upside participating trades through year-end. Again, further details can be found in the ‘Reality is Path-Dependent’ newsletter.
Graphic: Retrieved from UBS. Hedge funds were cutting risk in July 2024.
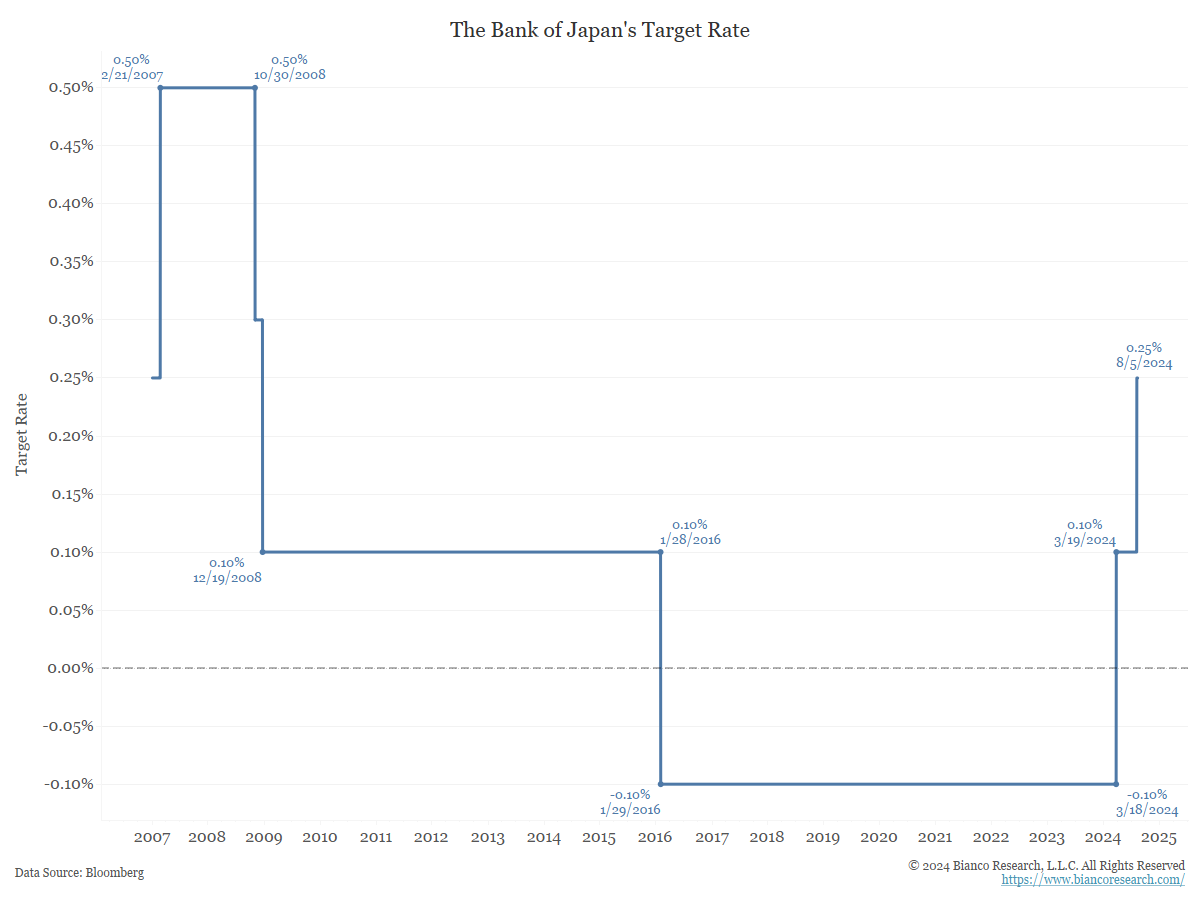
Our warnings about the risks of extreme momentum crowding and positioning leading to violent unwinds were borne out in August 2024. Markets reeled as recession probabilities were repriced, quarterly earnings disappointed, and central bank policies diverged. The Federal Reserve’s dovish stance starkly contrasted with an unanticipated rate hike by the Bank of Japan. This fueled considerable volatility across assets, particularly higher-beta equities and cryptocurrencies, which are more heavily influenced by traditional risk and monetary policy factors. The episode highlighted the vulnerabilities of a market reliant on leveraged trading and concentrated investments; the situation was about more than just a fundamental shock.
The unraveling was marked by spikes in stock market volatility measures like the VIX, a liquidity vacuum, and forced deleveraging by trend-following and volatility-sensitive strategies. Despite this clearing some froth, key equity and volatility positioning and valuation vulnerabilities remained, leaving markets fragile and uncertain whether growth will stabilize or deteriorate.
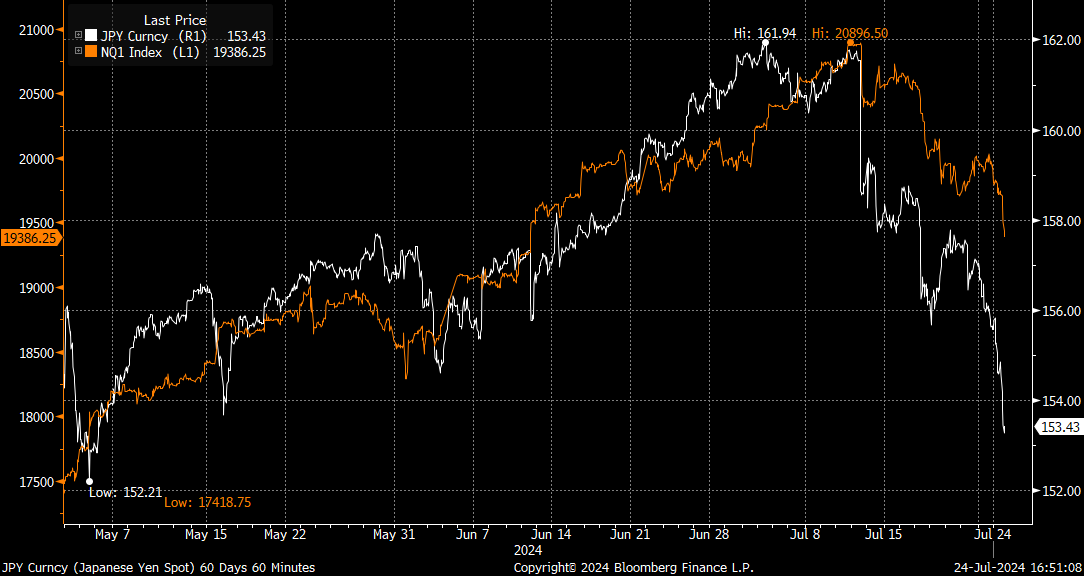
Graphic: Retrieved from Bloomberg via PPGMacro. Yen versus Nasdaq.
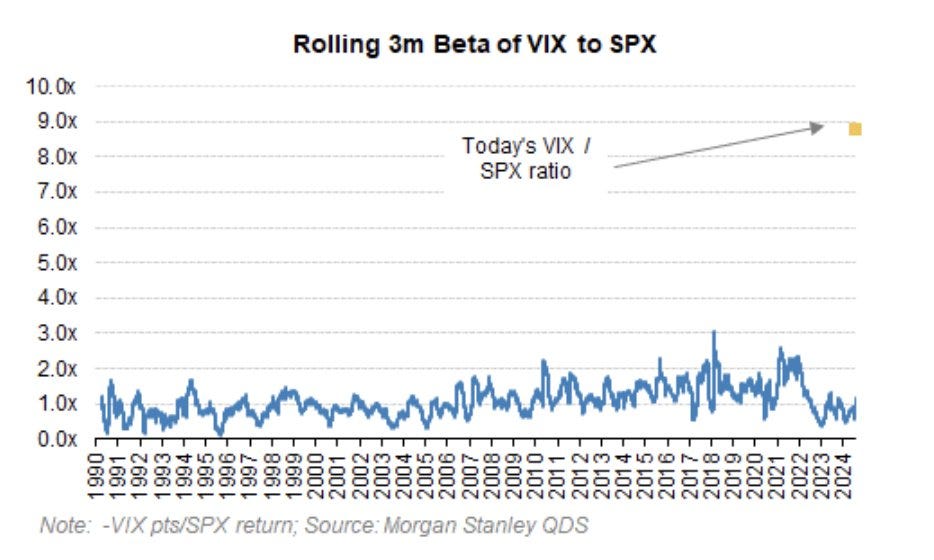
Some accounts compared the selling to the 1987 stock market crash. Volatility broke its calm streak, with spot-vol beta—the relationship between market movements and expected/implied volatility changes—rising and correlations increasing.
Graphic: Retrieved from Morgan Stanley via @NoelConvex.
Early warning signs of precariousness emerged as prices for far out-of-the-money SPX and VIX options—key indicators and drivers of potential crashes when heavily traded—soared hundreds of percent the week before crash day, Monday, August 5. These tail-risk hedges, often viewed as insurance against steep market drops, carried well, becoming significantly more expensive as demand surged. Just as insurers raise premiums on homes in disaster-prone areas to account for higher risk, the soaring cost of these options reflected the market’s growing fear of extreme outcomes. This repricing fed into broader quantitative measures, triggering a wave of deleveraging and prompting investors to offload hundreds of billions in stock bets, amplifying the sell-off.
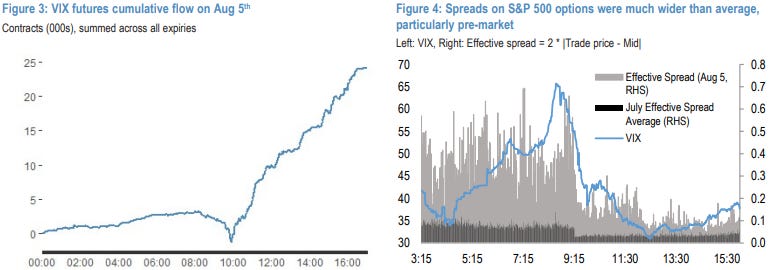
At one point, the VIX breached 65, its highest level since 2020. A lack of liquidity during pre-market hours and the shift from short-term to longer-term hedges contributed to this sharp rise. The VIX is calculated based on a selection of S&P 500 options about 30 days out, chosen by an algorithm that looks at the middle point between the prices people are willing to buy and sell those options. When there’s not a lot of trading activity and markets get volatile, the difference between the buying (bid) and selling (ask) prices widens, lending to the VIX being higher than it should be.
Graphic: Retrieved from JPMorgan via @jaredhstocks.
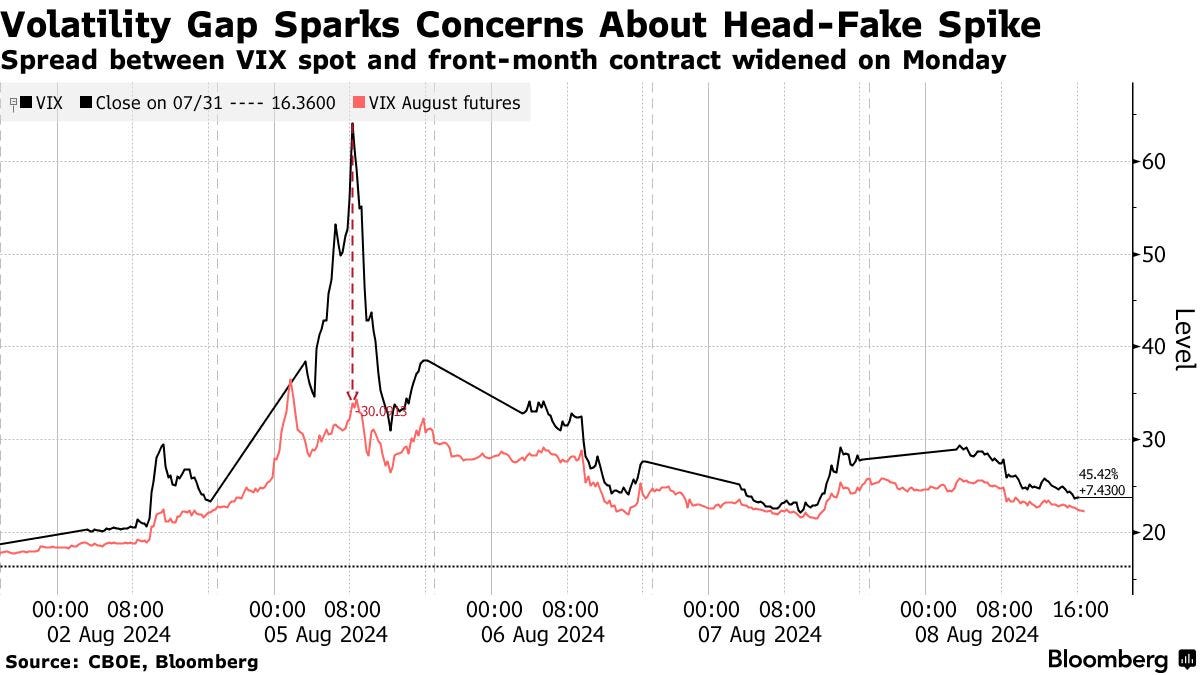
Comparatively, VIX futures—perhaps a better measure of hedging demands outside regular market hours—lagged. JPMorgan claims the fast narrowing in the VIX spot and futures indicates the VIX spot overstated fear and hedging demand.
Moreover, a technical issue at the Cboe options exchange delayed trading, and by the time the problem was resolved, the VIX had already dropped sharply. This coincided with traders doubling down on short-volatility positions and buying stocks, confident in the S&P 500’s historical tendency to rebound in the months following similar volatility spikes.
Graphic: Retrieved from Nomura via The Market Ear.
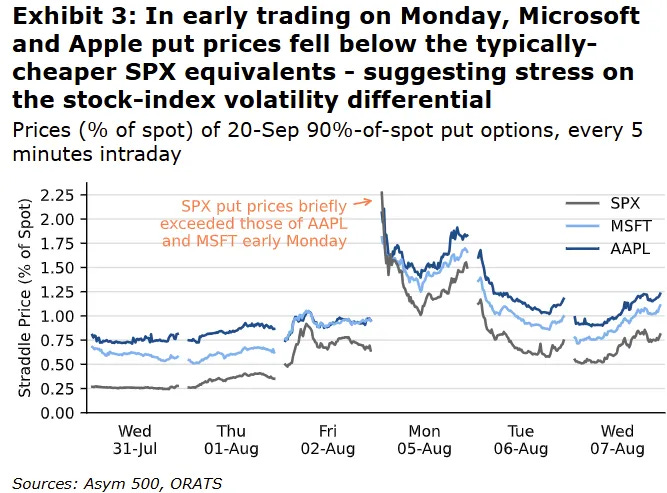
Rocky Fishman, founder of Asym 500, explains that the dislocations above were compounded by dispersion traders who likely experienced mark-to-market losses on their short index positions while single-stock markets remained closed. This forced some to cover their short index volatility positions, resulting in a pre-market surge in index volatility. Once trading resumed, many began selling single-stock options, triggering a broader decline in volatility levels—particularly in single-stock options.
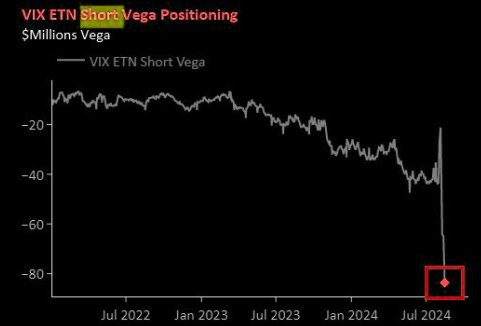
So, the rapid decrease in the VIX was driven more by positioning dynamics and the calculation mechanics of the VIX itself rather than a complete unwinding of risky trades. Additionally, the S&P 500’s movement into lower-volatility segments of the SPX options curve, which the VIX relies on, further intensified this decline. Kris Sidial of The Ambrus Group adds, “It’s quite evident that many have doubled down on [short volatility]. But you don’t need to trust our data. Barring any additional volatility shocks in the next few weeks, I expect some of these firms to deliver stellar numbers by the end of Q3 due to their inclination to take on more risk.”
Graphic: Retrieved from Bloomberg via @iv_technicals.
The market’s recovery in the fall was mainly driven by the Mag-7 giants, whose robust performance overshadowed the struggles of smaller stocks. The August decline created an opportunity to acquire beaten-down stocks at discounts, with investors indeed seeing the panic as a buy signal; outside of significant crises unable to topple the economy (like the bank failures in 2023), back-tests suggest that when the VIX exceeds 35, the S&P 500 has historically risen upwards of 15% over the next six months.
The recovery was not without risks, with the divide between market leaders and laggards highlighting continued fragility. In any case, supportive flows into mega-caps and dealer hedging activities helped stabilize broader indexes through November.
The growing gap between the stable performance of the S&P 500 and the larger fluctuations in its components created profits for those dispersion traders we discussed. However, as valuations for mega-cap stocks climb, the market becomes more vulnerable to shifts in sentiment or capital flows. Events like the yen carry trade—where borrowing in Japan funded investments in U.S. Treasuries and equities—unwind exposed concentration risks and positioning imbalances, which could amplify future shocks.
Graphic: Retrieved from Bloomberg via @Alpha_Ex_LLC.
As for potential triggers and shocks going forward, rising inequality and populism are creating deep divisions within and among major powers, while protectionist policies strain potential global cooperation. According to Cem Karsan of Kai Volatility, these dynamics drive economic battles and indirect conflicts, with Eastern nations working to reduce Western influence. This shift coincides with a new era of high inflation, widening wealth gaps, and changing power dynamics. Millennials, now a dominant force in the workforce and politics, are challenging decades of policies that primarily benefited corporations and the wealthy, reversing globalization and redistributing wealth—though this comes at the cost of heightened inflation.
These structural changes disrupt traditional investment strategies like the 60/40 portfolio. A major geopolitical event, such as China moving on Taiwan, could severely impact supply chains, critical industries, and the global economy, with significant repercussions for stocks like Nvidia and broader indices like the S&P 500. If market bets against panic (like short volatility) unravel, it could trigger more swings like August’s. The same reflexivity that has stabilized markets since then could amplify volatility during future shocks, turning successive disruptions into severe crises if market positioning is misaligned.
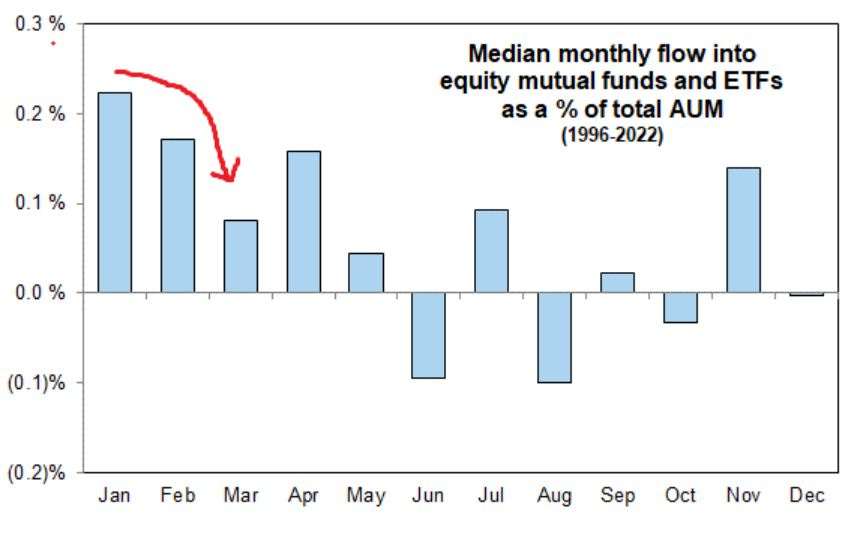
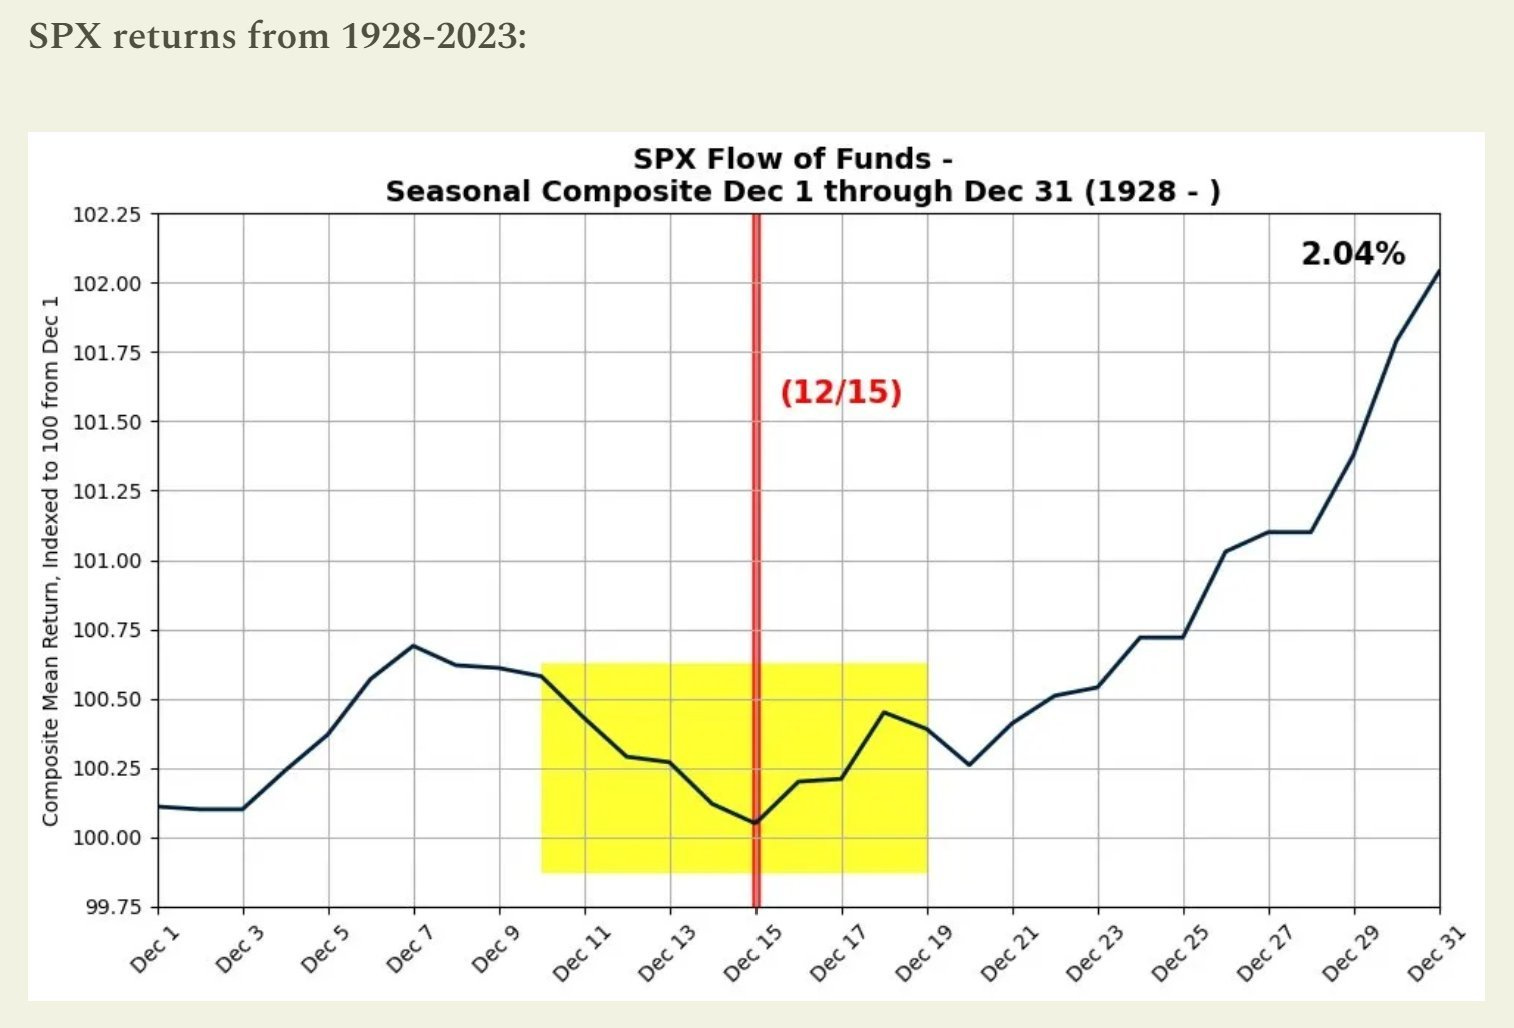
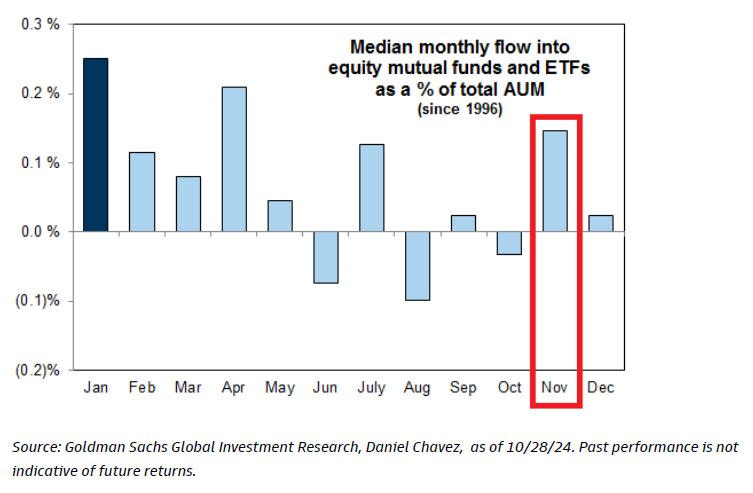
Despite this challenging backdrop, short-term market behavior operates independently, dictated by supply and demand dynamics. Seasonal flows, particularly during year-end, created a bullish bias; reduced holiday trading volumes, combined with reinvestment effects and significant options expirations, contributed to structural upward pressure on markets. These flows and a historical tendency for election years to drive positive performance suggested a right-skewed distribution for near-term outcomes.
The prospect and fulfillment of a “red sweep,” characterized by follow-on deregulation, a business-friendly environment, and more animal spirits, boosted markets. However, caution was spotted in certain areas, like bonds, where expectations for inflation rose.
Ultimately, the market overextended, highlighting the risk of a peak as it caught down to weak breath on the Federal Reserve’s surprising hawkish shift in December. This change led to volatility in equities, interest rates, and currencies, reminiscent of the spike in August when the VIX jumped and surpassed the S&P 500’s decline. Such persistent divergences validate a clear shift into a new market regime characterized by volatility that consistently outpaces market sell-offs.
Graphic: Retrieved from Nomura.
In a report, Cboe said that equity spot/vol beta surged to -3.3, meaning for every 1% drop in the S&P 500, the VIX gained 3.3 points—exceeding even August’s extreme levels. SPX options priced greater downside risk, with skew steepening. Notwithstanding, correlations settled near historic lows, signaling investor focus on sector rotation and stock dispersion.
Graphic: Retrieved from Bloomberg via Alpha Exchange.
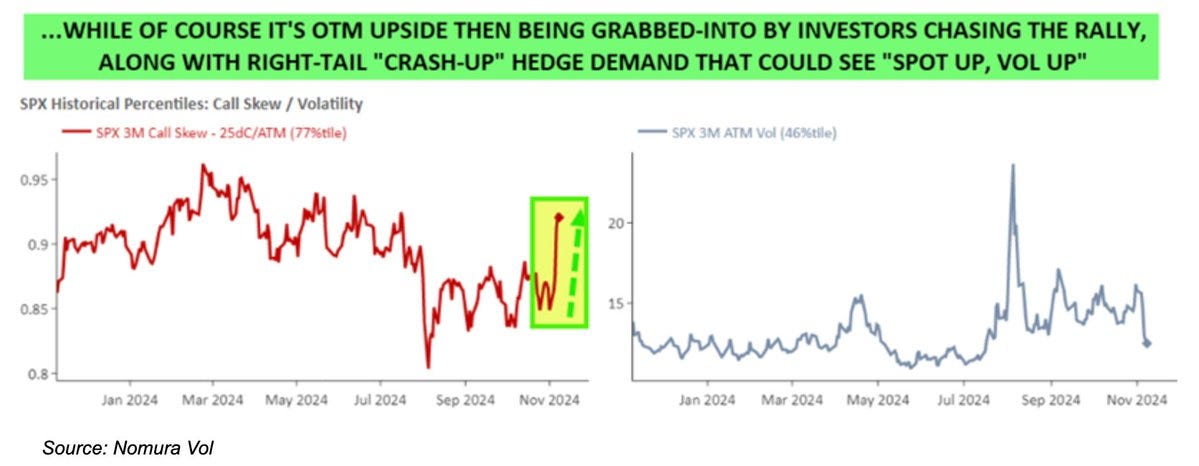
Early warning signals appeared when volatility and equities increased simultaneously, highlighting a “spot up, vol up” pattern that frequently foreshadows market peaks. For instance, at one moment, upside calls on major stocks like Nvidia and the S&P 500 were well-priced and poised to perform strongly in a rally. This occurs because, during rallies, implied volatility of call options generally decreases as investors tend to sell calls tied to their stock holdings rather than liquidating them entirely. When investors chase synthetic upside exposure through call options, indices like the VIX could stabilize or increase as the market rises. Since counterparties typically adjust their exposure by buying the underlying asset, it propels the rally and magnifies market fluctuations.
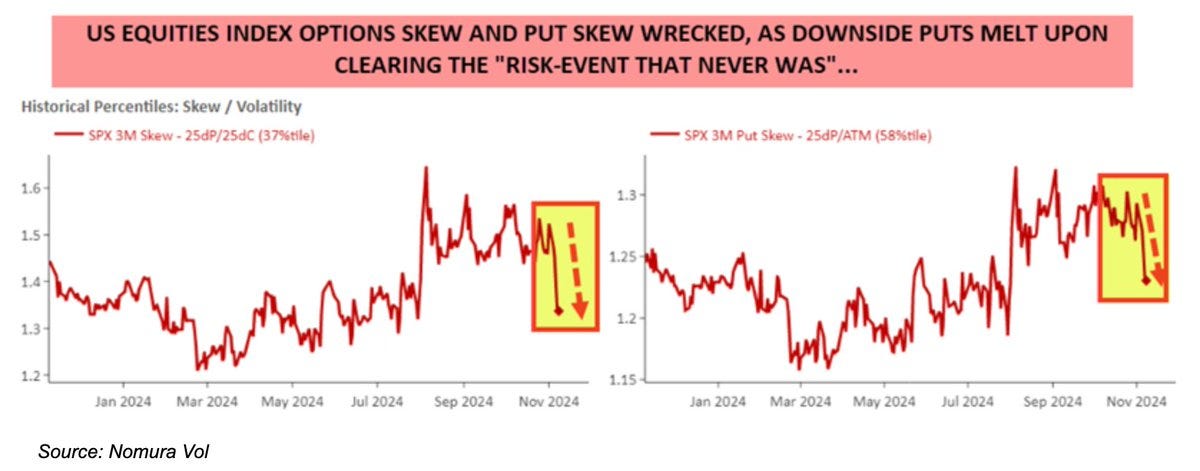
Beyond the chase, the post-election rally got an extra boost from unwinding protective puts. Significant events like elections typically boost demand for puts as hedges against adverse outcomes, with counterparties hedging these positions by selling underlying stocks or futures, among other things. As markets rise, time passes, or uncertainty fades, these puts lose value, leading counterparties to unwind hedges by buying stocks and futures. This is a structural support that pushes markets higher.
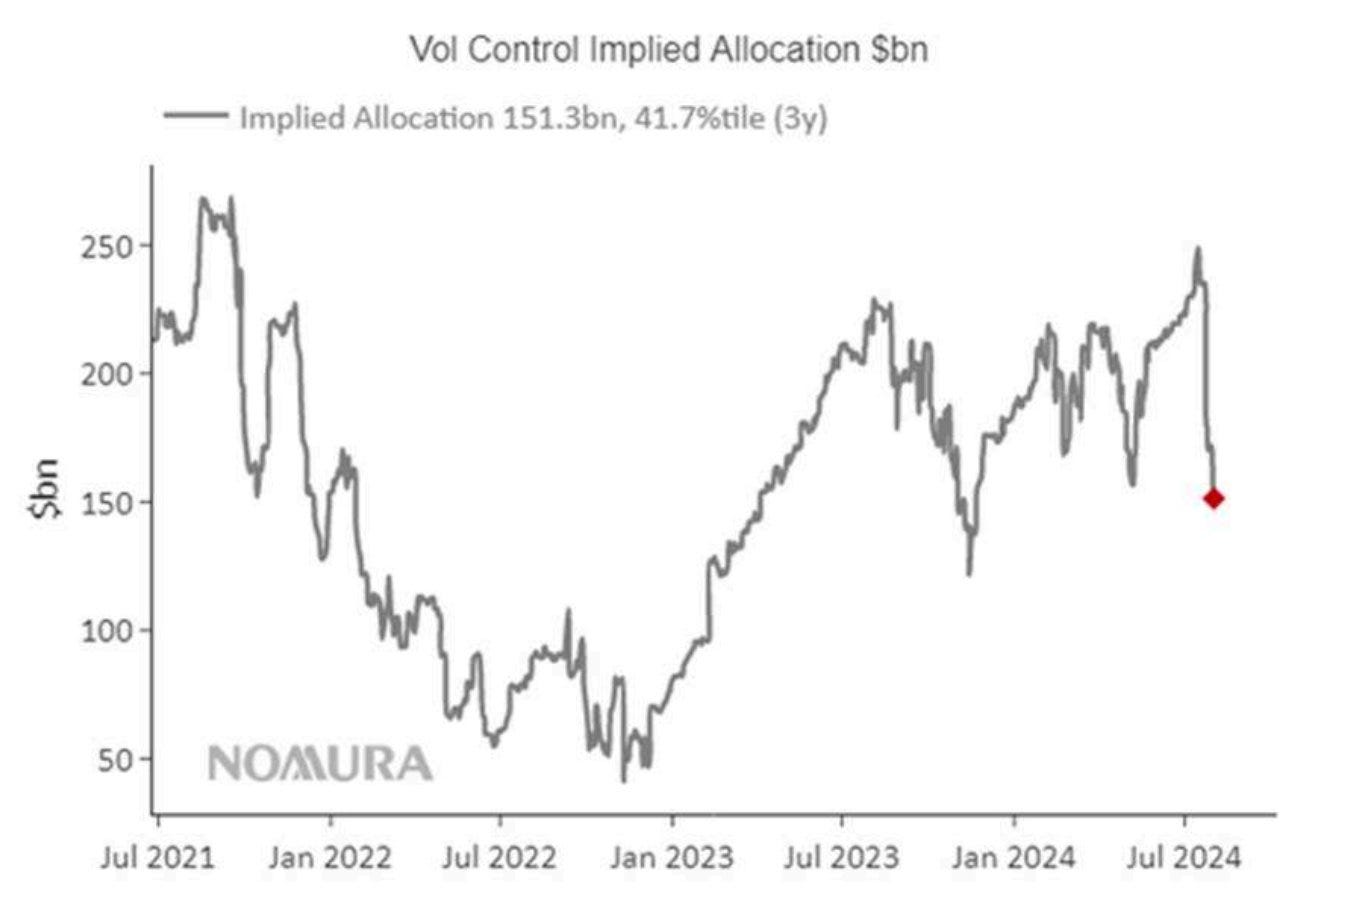
Corporate buybacks and stabilizing volatility levels encouraged funds to increase their exposure. Nomura estimated that assuming stable markets, up to $145 billion in additional volatility-sensitive buying could occur over three months. Although 30-day implied volatility traded a bit above realized volatility, this signaled uncertainty rather than distress. Seasonal factors mentioned in the previous section—like low holiday liquidity and limited selling pressure—added to the upward trend.
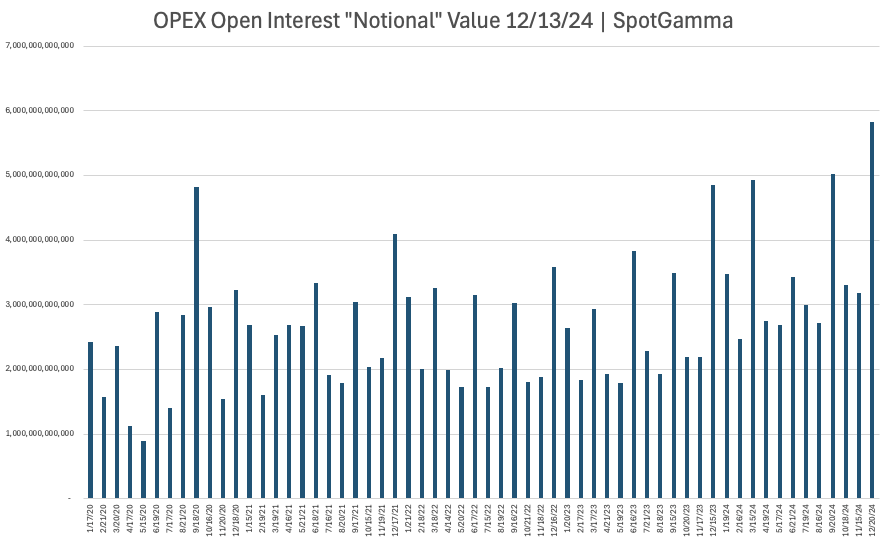
Then came the FOMC meeting, followed by December’s massive options expiration (OPEX), disrupting the supportive dynamics that had fueled the rally. While a rate cut was expected, uncertainty around forward guidance introduced volatility just as the market faced a substantial unwinding of stabilizing exposure. Those who hedged customer-owned call options by buying stock during rallies and hedged customer-owned puts by selling stock during declines were forced to re-hedge as markets turned lower following the FOMC meeting. This involved selling stocks and futures, adding downside pressure.
Macro factors triggered the initial downside, with positioning amplifying equity volatility.
Ultimately, volatility levels signaled oversold conditions ahead of a massive put-clearing OPEX, setting the stage for a year-end lift. The volatility spikes in August and December remained contained, as they were largely event-driven and mitigated by existing hedges and a market structure anchored by year-end flows. The subsequent unwinding of significant options positions in December eased the pressure, while reinvestment and re-leveraging effects into January supported against weak breadth; as the earlier-mentioned Cem Karsan explains best, the substantial gains over the year increased collateral for leveraged investors, enabling them to reinvest profits or take on more leverage, which has given markets a lease on life through today.
2025 might see increased volatility, not driven by typical inflation or recession fears but by the positioning dynamics herein that can magnify market swings during downturns. The so-called “red sweep” introduces optimism and the likelihood of greater risk-taking, which could result in one-sided positioning and heightened volatility. Factors like populism, protectionism, and rising interest rates are additional pressures on stocks and bonds. Gold and Bitcoin are identified as potential stores of value, but Bitcoin remains prone to speculation, liquidity challenges, and regulatory obstacles.
The following newsletters will identify structures to lean into fundamental catalysts and underlying volatility contexts. Notably, the structures discussed earlier (such as ultra-wide, broken-wing NDX put butterflies, ratio spreads, and low-cost VIX calls and call spreads) may continue to perform as effective hedges.
By viewing our content, you agree to be bound by the terms and conditions outlined in this disclaimer. Consume our content only if you agree to the terms and conditions below.
Physik Invest is not registered with the US Securities and Exchange Commission or any other securities regulatory authority. Our content is for informational purposes only and should not be considered investment advice or a recommendation to buy or sell any security or other investment. The information provided is not tailored to your financial situation or investment objectives.
We do not guarantee the accuracy, completeness, or timeliness of any information. Please do not rely solely on our content to make investment decisions or undertake any investment strategy. Trading is risky, and investors can lose all or more than their initial investment. Hypothetical performance results have limitations and may not reflect actual trading results. Other factors related to the markets and specific trading programs can adversely affect actual trading results. We recommend seeking independent financial advice from a licensed professional before making investment decisions.
We don’t make any claims, representations, or warranties about the accuracy, completeness, timeliness, or reliability of any information we provide. We are not liable for any loss or damage caused by reliance on any information we provide. We are not liable for direct, indirect, incidental, consequential, or damages from the information provided. We do not have a professional relationship with you and are not your financial advisor. We do not provide personalized investment advice.
Our content is provided without warranties, is the property of our company, and is protected by copyright and other intellectual property laws. You may not be able to reproduce, distribute, or use any content provided through our services without our prior written consent. Please email renato@physikinvest for consent.
We reserve the right to modify these terms and conditions at any time. Following any such modification, your continued consumption of our content means you accept the modified terms. This disclaimer is governed by the laws of the jurisdiction in which our company is located.
Editor’s Note: The Daily Brief is a free glimpse into the prevailing fundamental and technical drivers of U.S. equity market products. Join the 200+ that read this report daily, below!
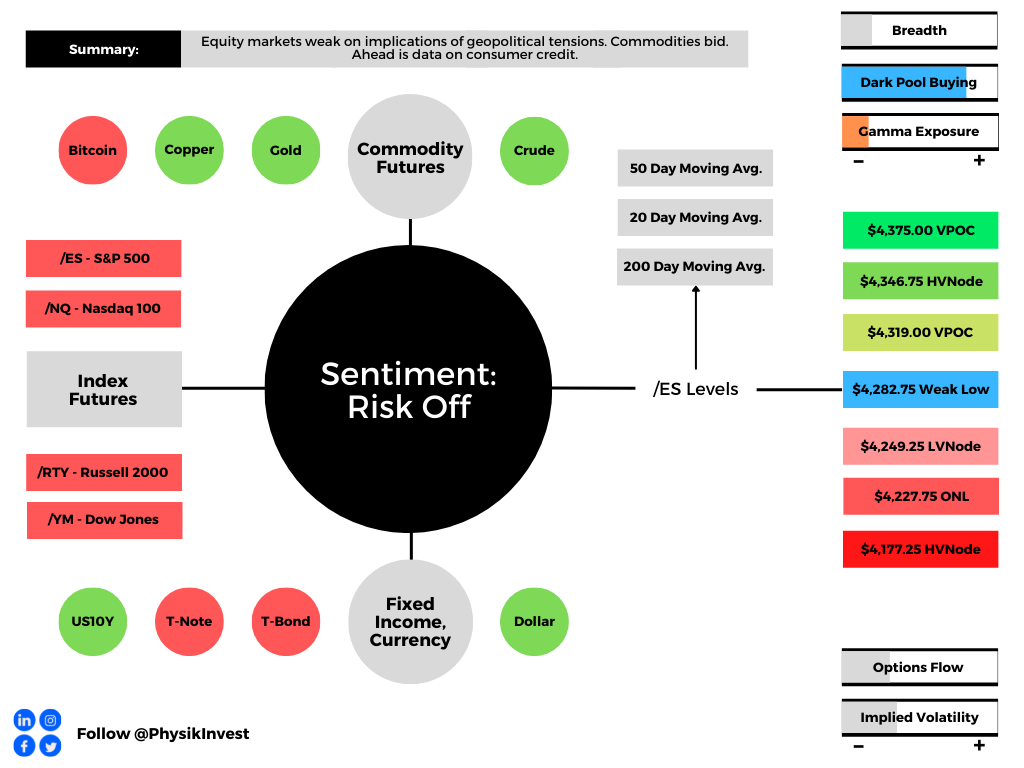
Overnight, equity index futures auctioned lower as participants looked to price in the implications of heightened inflation and risk of recession amidst geopolitical tensions.
Ahead is data on consumer credit (3:00 PM ET).
Graphic updated 5:45 AM ET. Sentiment Risk-Off if expected /ES open is below the prior day’s range. /ES levels are derived from the profile graphic at the bottom of the following section. Levels may have changed since initially quoted; click here for the latest levels. SqueezeMetrics Dark Pool Index (DIX) and Gamma (GEX) calculations are based on where the prior day’s reading falls with respect to the MAX and MIN of all occurrences available. A higher DIX is bullish. At the same time, the lower the GEX, the more (expected) volatility. Learn the implications of volatility, direction, and moneyness. SHIFT data used for S&P 500 (INDEX: SPX) options activity. Note that options flow is sorted by the call premium spent; if more positive, then more was spent on call options. Breadth reflects a reading of the prior day’s NYSE Advance/Decline indicator. VIX reflects a current reading of the CBOE Volatility Index (INDEX: VIX) from 0-100.
What To Expect
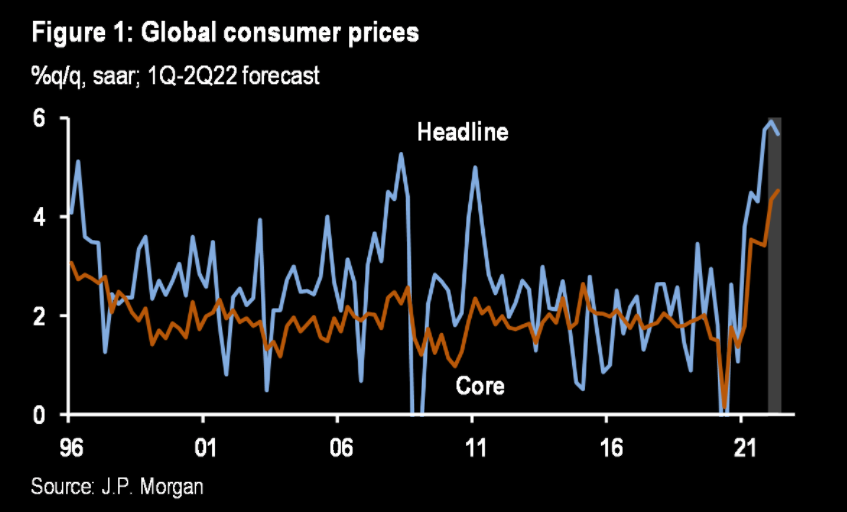
Fundamental: Hawkishness with respect to monetary policy, in the face of heightened inflation and slowing economic growth, is affecting global markets.
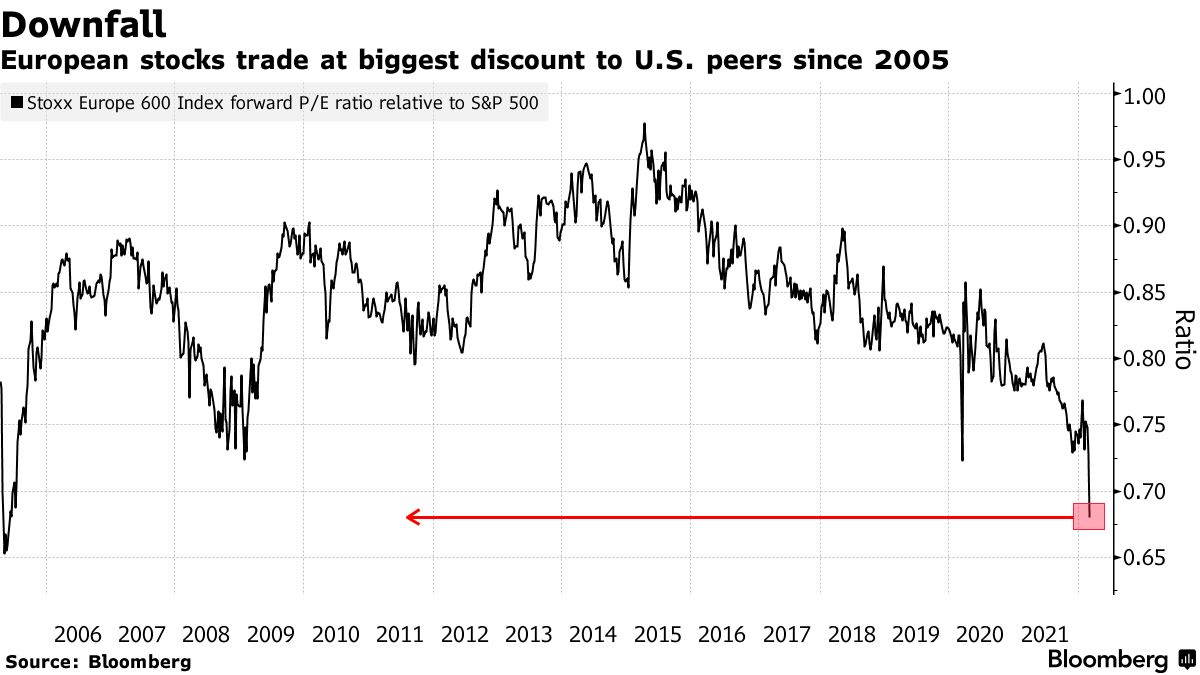
Graphic: Via Bloomberg. European markets trade weak relative to their U.S. peers.
Overseas markets have sold more, relatively, and the pricing of equity market risk in Europe is far outpacing that in the U.S.
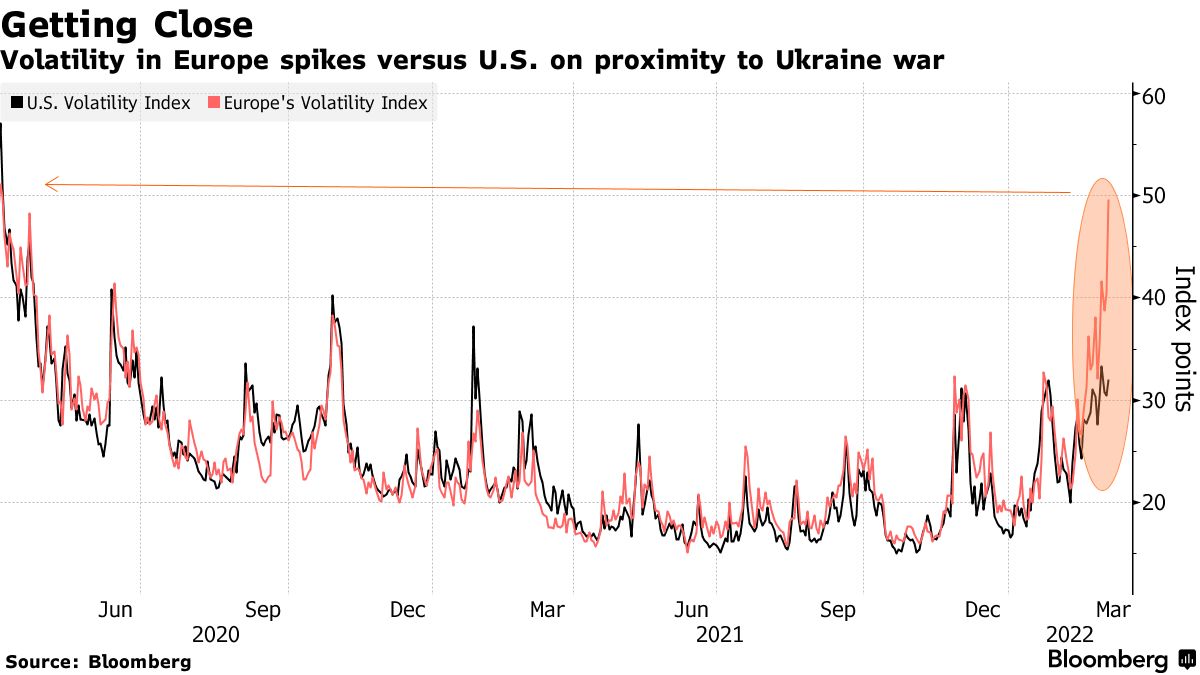
Graphic: Via Bloomberg. Divergences in the pricing of risk across markets.
Last week, we unpacked the potential factors behind (and the implications of) divergences in cross-asset volatility. Mainly, the fear in one market tends to feed into the fear of another.
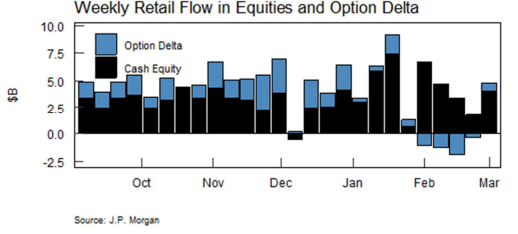
Pursuant to those remarks on this push-and-pull comes as Goldman Sachs Group Inc’s (NYSE: GS) prime brokerage saw hedge-fund clients unloading risk at the fastest rate in three months, while JPMorgan Chase & Co (NYSE: JPM) saw retail buying nearly $4.1 billion, “with money sent to S&P 500-linked ETFs more than 2 standard deviations above the 12-month average.”
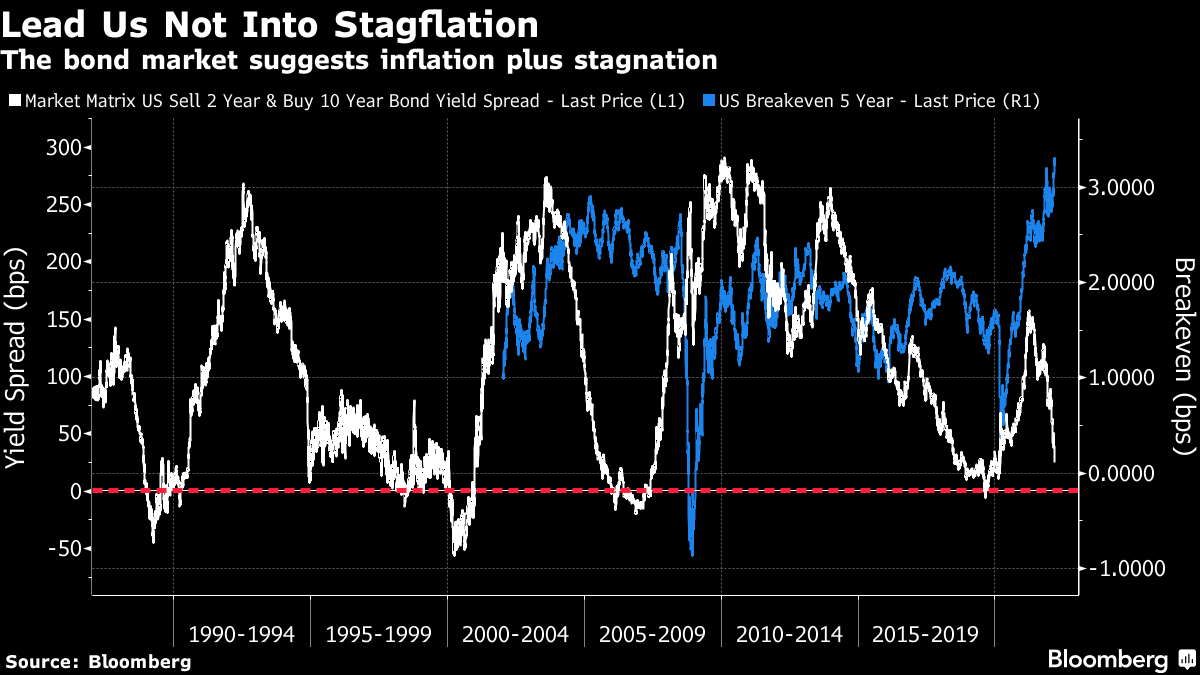
Per Bloomberg’s John Authers, market professionals likely view reactions to geopolitical tension “as increasing the risk of stagflation, a rare combination of high inflation and a recession.”
“This looks like 2007, on the eve of the Global Financial Crisis, with even higher inflation expectations and a yield curve that has not quite yet inverted.”
Graphic: Via Bloomberg. “[A]n outright inversion, which generally signals a recession a matter of months later, now seems an imminent possibility.”
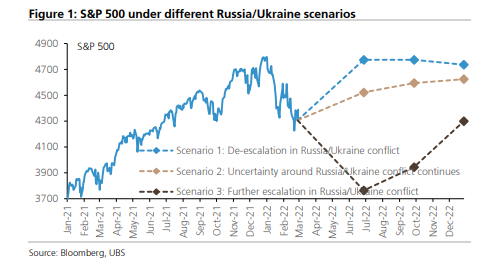
UBS Group AG (NYSE: UBS) ran a machine-learning analysis that “reckons the Russia/Ukraine conflict could send the S&P 500 anywhere from 3,800 to 4,800 – a 26% range – depending on how it resolves.”
Perspectives: “Every other market is consistent with the idea that the economy is in trouble and there’s stress in the markets,” said Jim Bianco, president of Bianco Research LLC in Chicago.
“The stock market historically does this — it’s the last market to turn, it’s the slowest market to understand the problems. It’s the market driven by narratives and hope.”
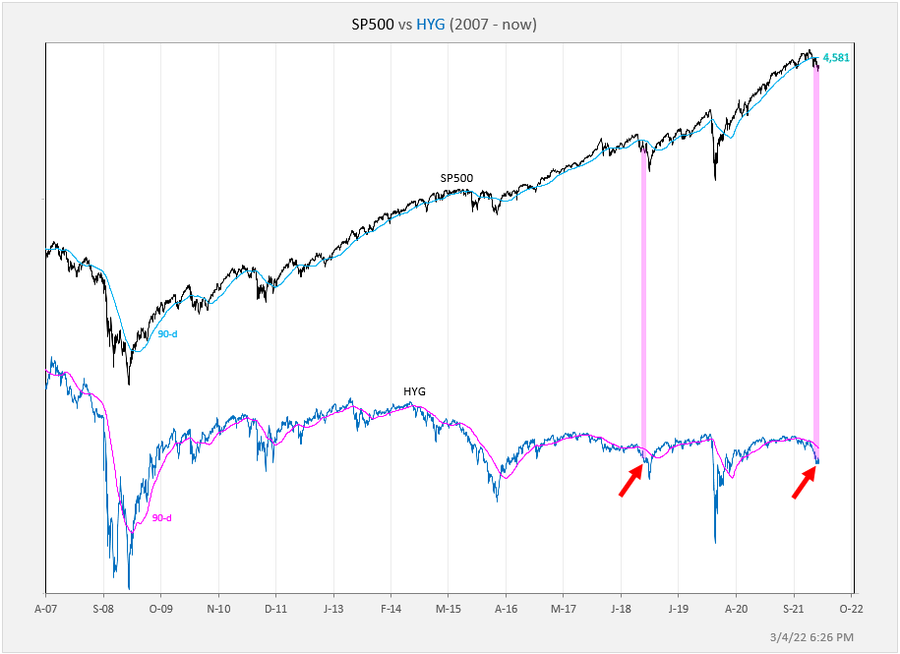
Graphic: Via @exposurerisk from @Callum_Thomas. “Slowly at first, then all of a sudden.”
Alternatively, BCA Research Ltd suggests that “Even if World War III is ultimately averted, markets could experience a freak-out moment over the next few weeks, similar to what happened at the outset of the pandemic. Google searches for nuclear war are already spiking.”
“Despite the risk of nuclear war, it makes sense to stay constructive on stocks over the next 12 months. If an ICBM is heading your way, the size and composition of your portfolio becomes irrelevant. Thus, from a purely financial perspective, you should largely ignore existential risk, even if you do care about it greatly from a personal perspective.”
Positioning: The fundamental picture is clouded by the options market positioning.
At present, in the face of continued passive buying support, the overwhelming demand for downside (put) protection (a negative delta, positive gamma trade) results in counterparty hedging that may exacerbate weakness.
The reason why? The counterparty has exposure to positive delta and negative gamma. If underlying prices print lower and/or measures of implied volatility rise (given increased fear and demand for protection), short puts rise in value (and counterparty losses are multiplied).
To overcome these potential losses, counterparties sell the underlying to hedge. If nothing happens, the protection decays, and counterparties buy back their hedges potentially bolstering the underlying market’s calmness or attempts higher.
As noted earlier and explained in detail last week, the pricing of risk across markets has diverged and the S&P 500, among other U.S. indices, is relatively strong (unlike peers in Europe and Asia).
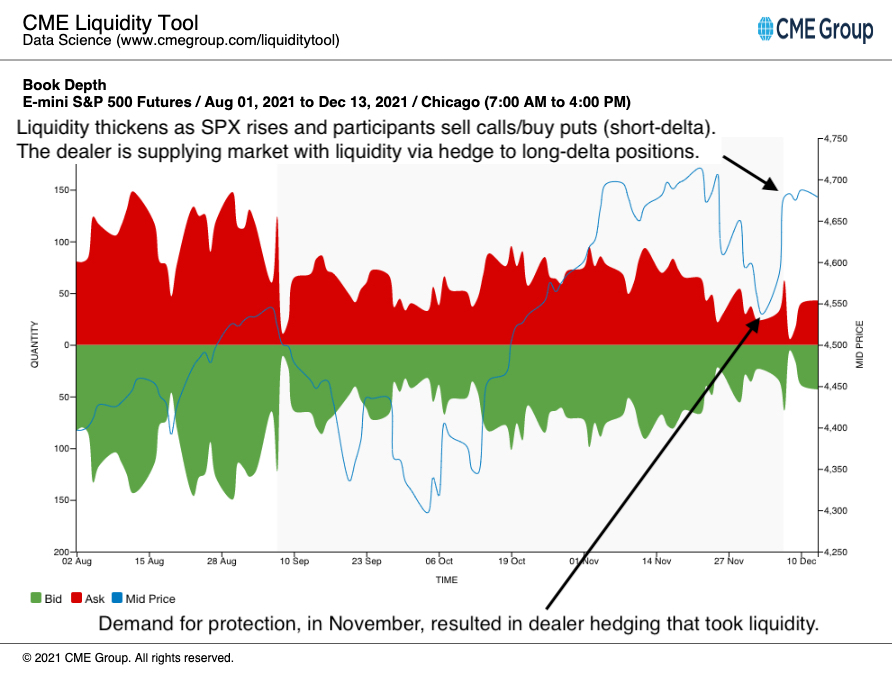
Among other things, one dynamic balancing this pressure from puts is negative-delta trade, by customers, on the call side. In selling calls, dealers are long (a positive delta, positive gamma trade that makes money if the underlying rises). To hedge, dealers tend towards selling strength and buying weakness, adding liquidity to the market.
Still, again, the news is bad, and returns into monthly options expirations (like the one coming up next week) are often weak.
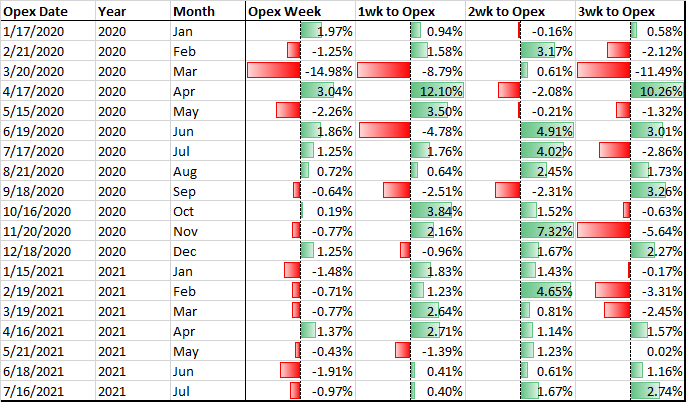
Graphic: @pat_hennessy breaks down returns for the S&P 500, categorized by the week relative to OPEX.
So, there is potential that weakness climaxes into the options expiration. Thereafter, the reduction in put-heavy positioning may coincide with less counterparty exposure to the positive delta.
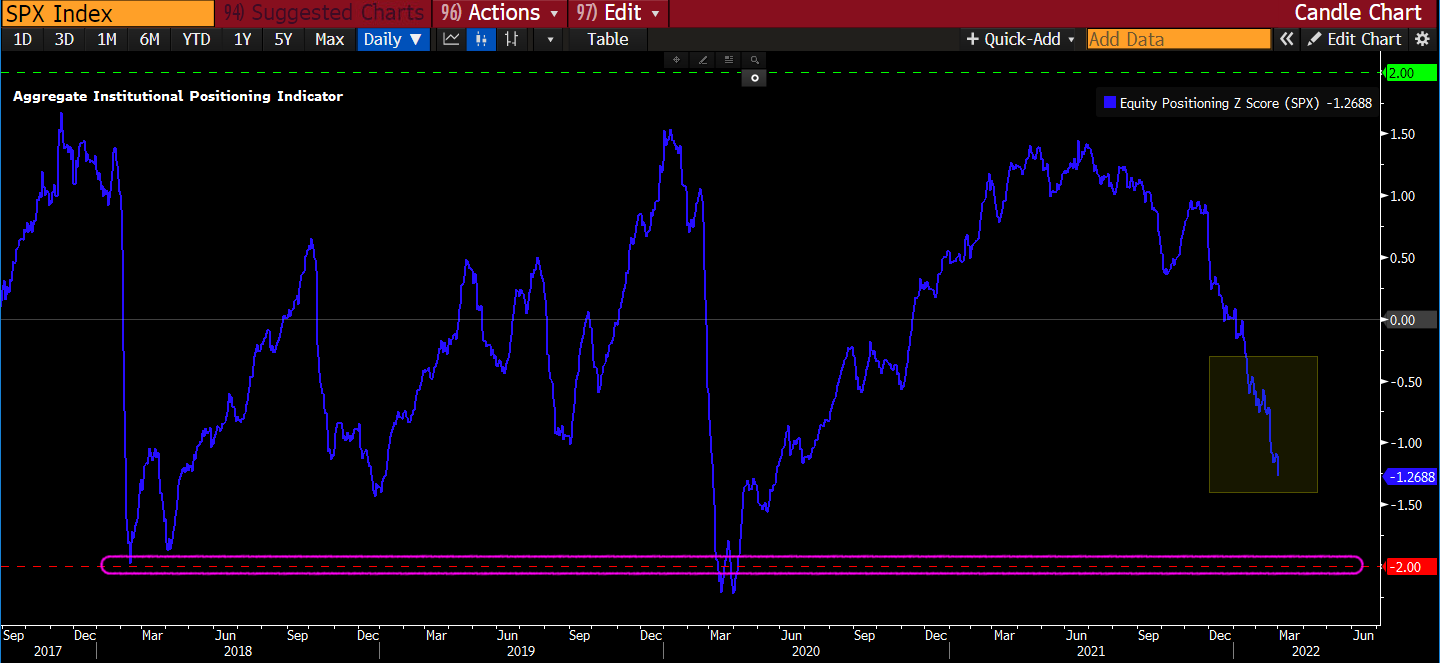
Graphic: Via SpotGamma. “Netting call & put delta, you can see we’re near extremes in terms of put:call positions. Often large put positions are removed by expirations, which seems to coincide with market lows. Many of these are quarterly expirations which coincide w/FOMC meetings – such as next week.”
Still, the return distributions, based on where the implied volatility term structure is at, point to continued chop and expanded ranges.
$VIX / 3Month $VIX (vol term structure) has been persistently flat. The 10sma of the ratio was .99 as of Close on Friday [1].
Sustained periods of the ratio >1 primarily occur during highly stressed markets [2].
Technical: As of 5:45 AM ET, Monday’s regular session (9:30 AM – 4:00 PM ET), in the S&P 500, will likely open in the middle part of a negatively skewed overnight inventory, outside of prior-range and -value, suggesting a potential for immediate directional opportunity.
Balance-Break + Gap Scenarios: A change in the market (i.e., the transition from two-time frame trade, or balance, to one-time frame trade, or trend) is occurring.

Monitor for acceptance (i.e., more than 1-hour of trade) outside of the balance area.

Leaving value behind on a gap-fill or failing to fill a gap (i.e., remaining outside of the prior session’s range) is a go-with indicator.

Rejection (i.e., return inside of balance) portends a move to the opposite end of the balance.
In the best case, the S&P 500 trades higher; activity above the visual $4,282.75 balance boundary puts in play the $4,319.00 untested point of control (VPOC). Initiative trade beyond the VPOC could reach as high as the $4,346.75 high volume area (HVNode) and $4,375.00 VPOC, or higher.
In the worst case, the S&P 500 trades lower; activity below the $4,282.75 balance boundary puts in play the $4,249.25 low volume area (LVNode). Initiative trade beyond the LVNode could reach as low as the $4,227.75 overnight low (ONL) and $4,177.25 HVNode, or lower.
Considerations: The $4,282.75 level has solicited mechanical responses over the past weeks.
Therefore it is considered to be a level at which short-term participants will lack the wherewithal (both emotional and financial) to respond to a successful break.
Click here to load today’s key levels into the web-based TradingView charting platform. Note that all levels are derived using the 65-minute timeframe. New links are produced, daily.
Graphic: 65-minute profile chart of the Micro E-mini S&P 500 Futures.
Definitions
Overnight Rally Highs (Lows): Typically, there is a low historical probability associated with overnight rally-highs (lows) ending the upside (downside) discovery process.
Volume Areas: A structurally sound market will build on areas of high volume (HVNodes). Should the market trend for long periods of time, it will lack sound structure, identified as low volume areas (LVNodes). LVNodes denote directional conviction and ought to offer support on any test.
If participants were to auction and find acceptance into areas of prior low volume (LVNodes), then future discovery ought to be volatile and quick as participants look to HVNodes for favorable entry or exit.
POCs: POCs are valuable as they denote areas where two-sided trade was most prevalent in a prior day session. Participants will respond to future tests of value as they offer favorable entry and exit.
About
After years of self-education, strategy development, mentorship, and trial-and-error, Renato Leonard Capelj began trading full-time and founded Physik Invest to detail his methods, research, and performance in the markets.
Capelj is also a Benzinga finance and technology reporter interviewing the likes of Shark Tank’s Kevin O’Leary, JC2 Ventures’ John Chambers, FTX’s Sam Bankman-Fried, and ARK Invest’s Catherine Wood, as well as a SpotGamma contributor developing insights around impactful options market dynamics.
Disclaimer
Physik Invest does not carry the right to provide advice.
In no way should the materials herein be construed as advice. Derivatives carry a substantial risk of loss. All content is for informational purposes only.
The Daily Brief is a free glimpse into the prevailing fundamental and technical drivers of U.S. equity market products. Join the 200+ that read this report daily, below!
Updates: Hi everyone! To start, I wanted to sincerely apologize for the below graphic being inaccurate, yesterday. Technology problems! I have since updated the graphic. My bad – egg on my face.
As always, for checks on quoted levels, and the like, just read on below. I try to build in as many redundancies to ensure we have the most information to trade on as possible.
If levels do not make sense, I assure you that they are either (A) updated in the attached real-time charts or (B) in the “Technical” section, below.
Feedback and questions are always encouraged/appreciated!
What Happened
Overnight, equity index futures rotated, lower, validating the end-of-day, knee-jerk price exploration. Commodities were mixed, bonds fell, and volatility was bid.
Ahead is data on retail sales and import prices (8:30 AM ET), industrial production and capacity utilization (9:15 AM ET), University of Michigan consumer sentiment figures and business inventories (10:00 AM ET), as well as some speech by New York Fed President John Williams (11:00 AM ET).
Note that in observance of Martin Luther King Jr. Day, markets will be closed on Monday, January 17.
There will be no commentary published, as a result.
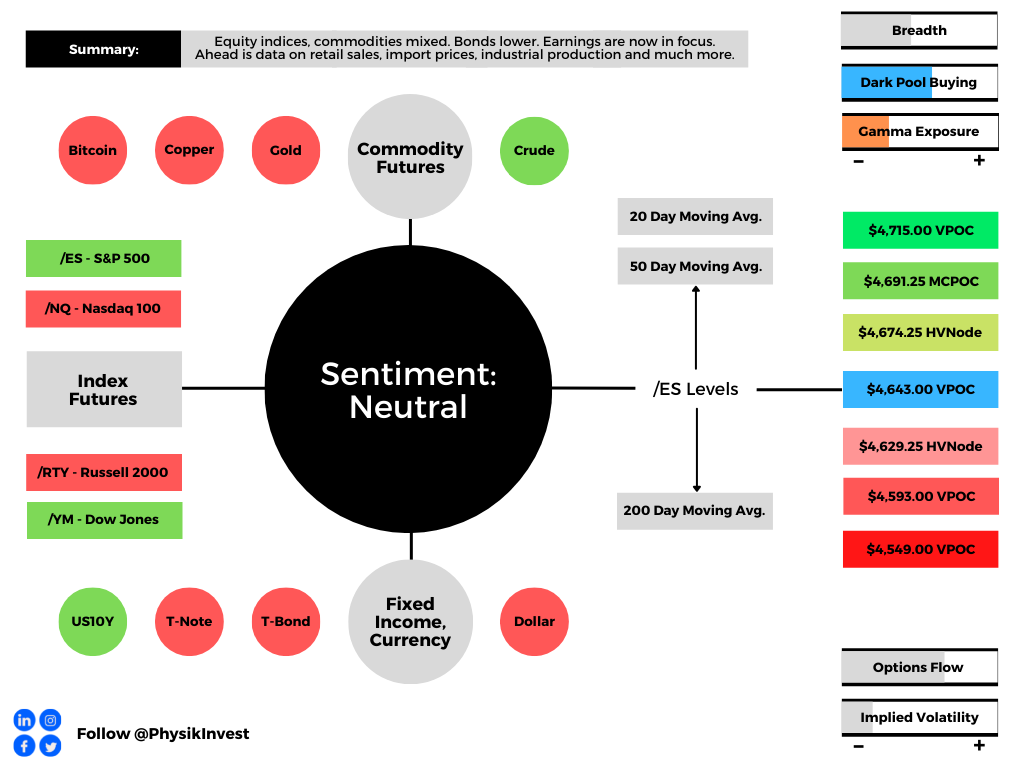
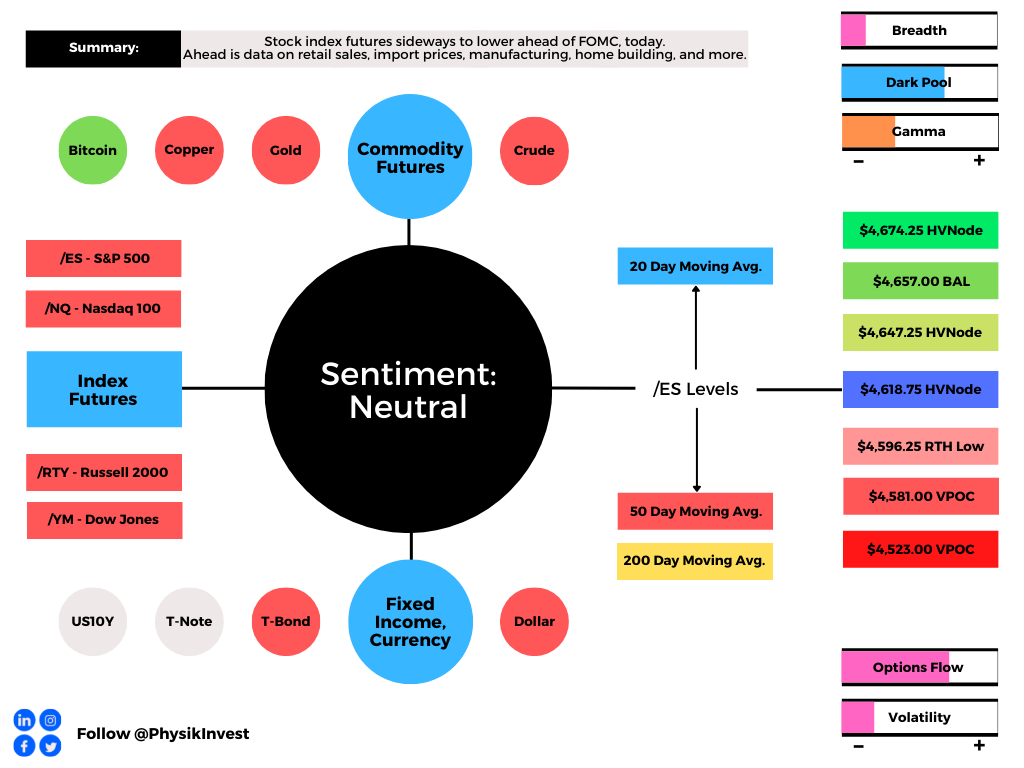
Graphic updated 6:30 AM ET. Sentiment Neutral if expected /ES open is inside of the prior day’s range. /ES levels are derived from the profile graphic at the bottom of the following section. Levels may have changed since initially quoted; click here for the latest levels. SqueezeMetrics Dark Pool Index (DIX) and Gamma (GEX) calculations are based on where the prior day’s reading falls with respect to the MAX and MIN of all occurrences available. A higher DIX is bullish. At the same time, the lower the GEX, the more (expected) volatility. Learn the implications of volatility, direction, and moneyness. SHIFT data used for S&P 500 (INDEX: SPX) options activity. Note that options flow is sorted by the call premium spent; if more positive, then more was spent on call options. Breadth reflects a reading of the prior day’s NYSE Advance/Decline indicator. VIX reflects a current reading of the CBOE Volatility Index (INDEX: VIX) from 0-100.
What To Expect
Fundamental: Markets sold heavy, yesterday, on the heels of hawkish commentary from monetary policymakers.
The Federal Reserve’s Lael Brainard said the central bank would be in a position to start hiking rates as soon as it wound down bond purchases. This is to happen in March.
“The (Fed’s policy-setting) committee has projected several hikes over the course of the year,” Brainard said in testimony.
“Of course, we will be in a position to do that I think as soon as our purchases are terminated, and we’ll simply have to see what the data requires over the course of the year, and you know we started to discuss shrinking our balance sheet.”
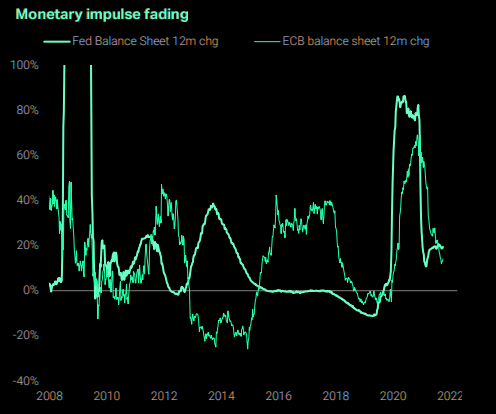
Graphic: Via The Market Ear, “balance sheet delta continues fading. The obvious question is, what is priced in?”
The Fed is moving more quickly to “save itself from having to hike too far and make rates so expensive that they slow down the economy.”
“We understand the Fed’s paralysis given the massive uncertainty coming out of the pandemic,” says Jim Bianco of Bianco Research. “However, the longer they wait to address inflation, the worse this conundrum will become.”
So, what’s the major concern with tightening and eventual balance sheet compression?
It has much to do with left-tail risks. Prevailing monetary frameworks and max liquidity promoted a large divergence in price from fundamentals.
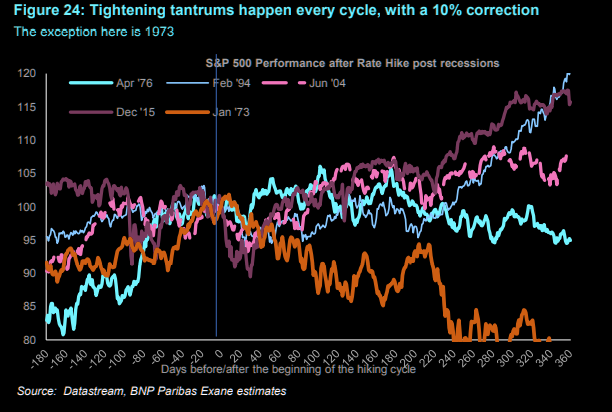
With expected monetary policy evolution, however, valuations are much less justifiable. Many institutions, as a result, see peaks in 2022, just as rate hikes are initiated.
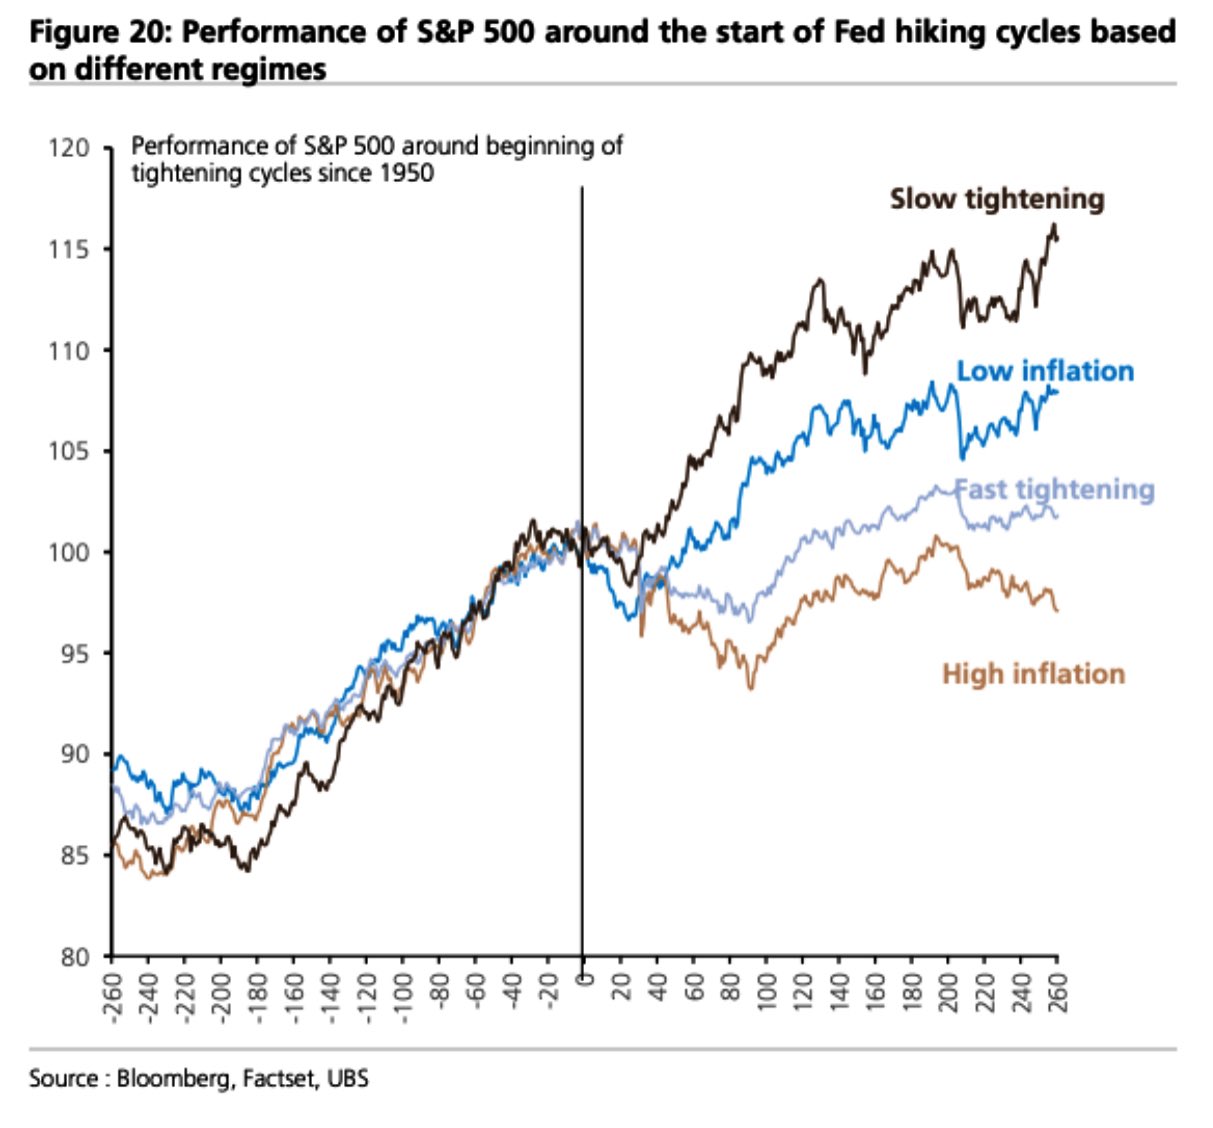
Graphic: S&P 500 performance before and after rate hikes, via The Market Ear.
“The decline in stock prices is forecast to be orderly but it could turn into something worse,” Moody’s Corporation (NYSE: MCO) explains in reference to the growth of passive investing – the effect of increased moneyness among nonmonetary assets – and derivatives trading.
“A drop in stock prices could trigger margin calls.”
Notwithstanding, as stated in the prior day’s, according to JPMorgan Chase & Co (NYSE: JPM) strategists, “[p]olicy tightening is likely to be gradual and at a pace, that risk assets should be able to handle, and is occurring in an environment of strong cyclical recovery.”
This is as Moody’s also notes that “there will still be a lot of excess liquidity—a little less than $1 trillion— when the central bank’s balance sheet does begin to decline.”
Note that over the next weeks, a focus will be the release of earnings, in the face of inflation, supply-chain challenges, and the like. We will cover this in later commentaries.
Positioning: Thursday’s trade did little to upset the narratives discussed in the “Positioning” section of this commentary over the past few days.
As stated, metrics that overlay options positioning and buying pressure (via short sales or liquidity provision on the market-making side) are positively skewed, albeit less so than before.
At the same time, we have trading desks suggesting “the conditions are not in place for a larger correction (>5%),” while volatility remains compressed, relatively so, at the index level.
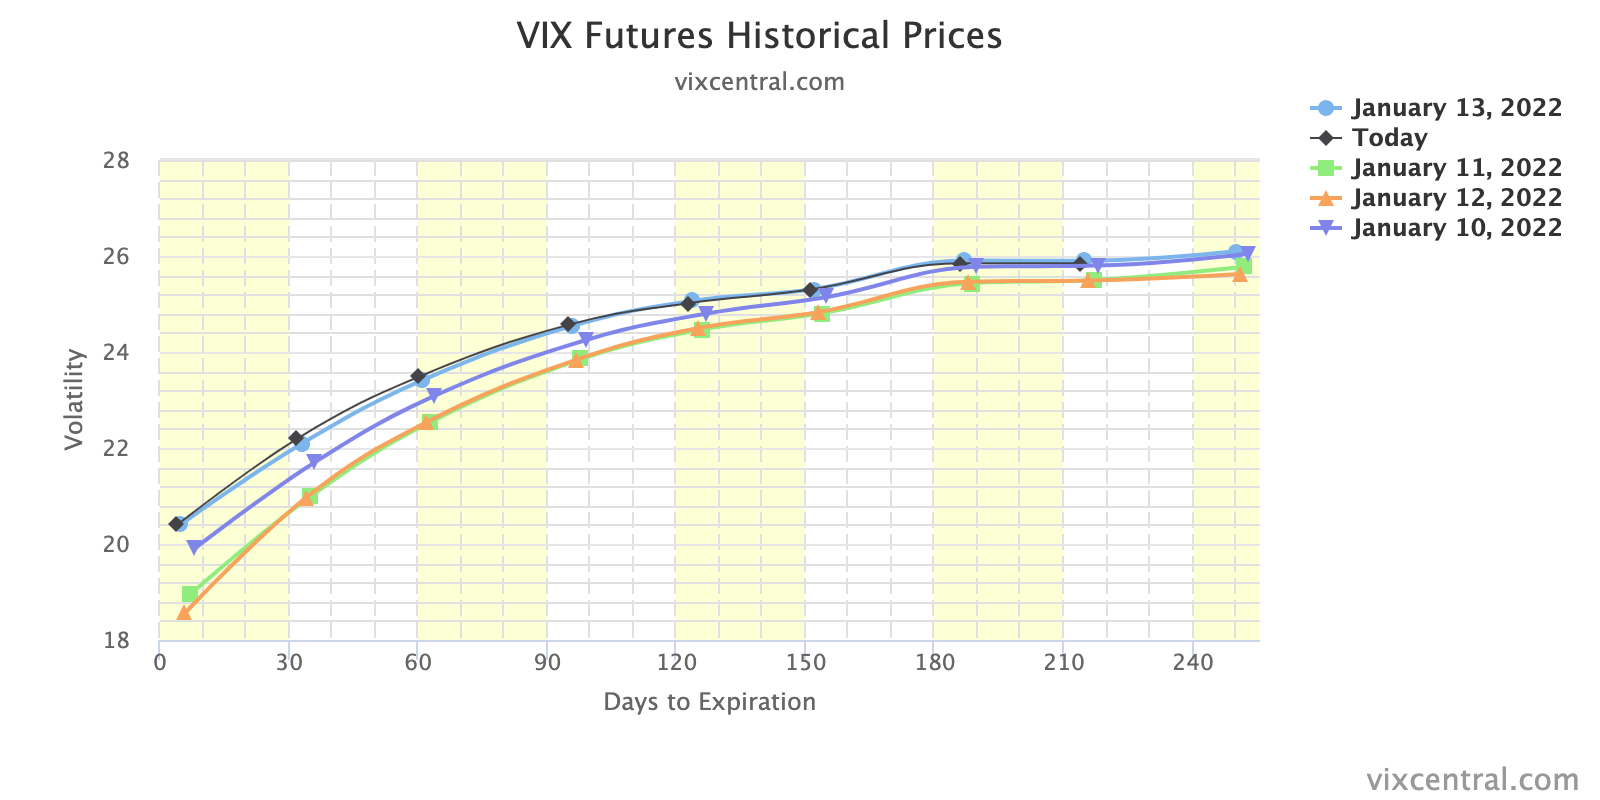
Graphic: Upward sloping VIX term structure. Per Interactive Brokers Group Inc (NASDAQ: IBKR), “An inverted curve, or even a flattish one, indicates a shortage of available volatility protection. We saw that as recently as a month ago, but not now.” Still, short-dated implied volatility is bid and this is taking away from the supportive “vanna” flows you would expect with declining volatility.
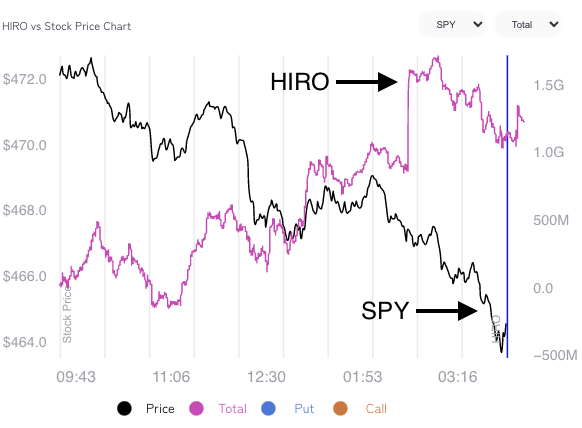
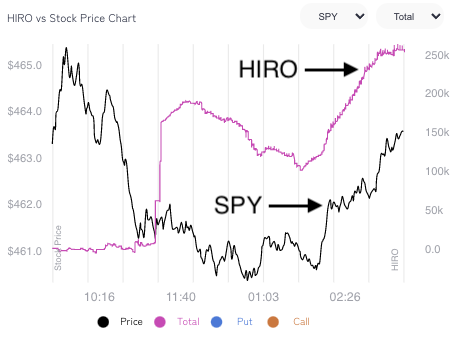
For instance, SpotGamma’s (beta) Hedging Impact of Real-Time options indicator suggested S&P 500 options activity diverged, markedly, from what underlying prices were doing.
This could mean that Thursday’s news-driven sell-off did not change the status quo.
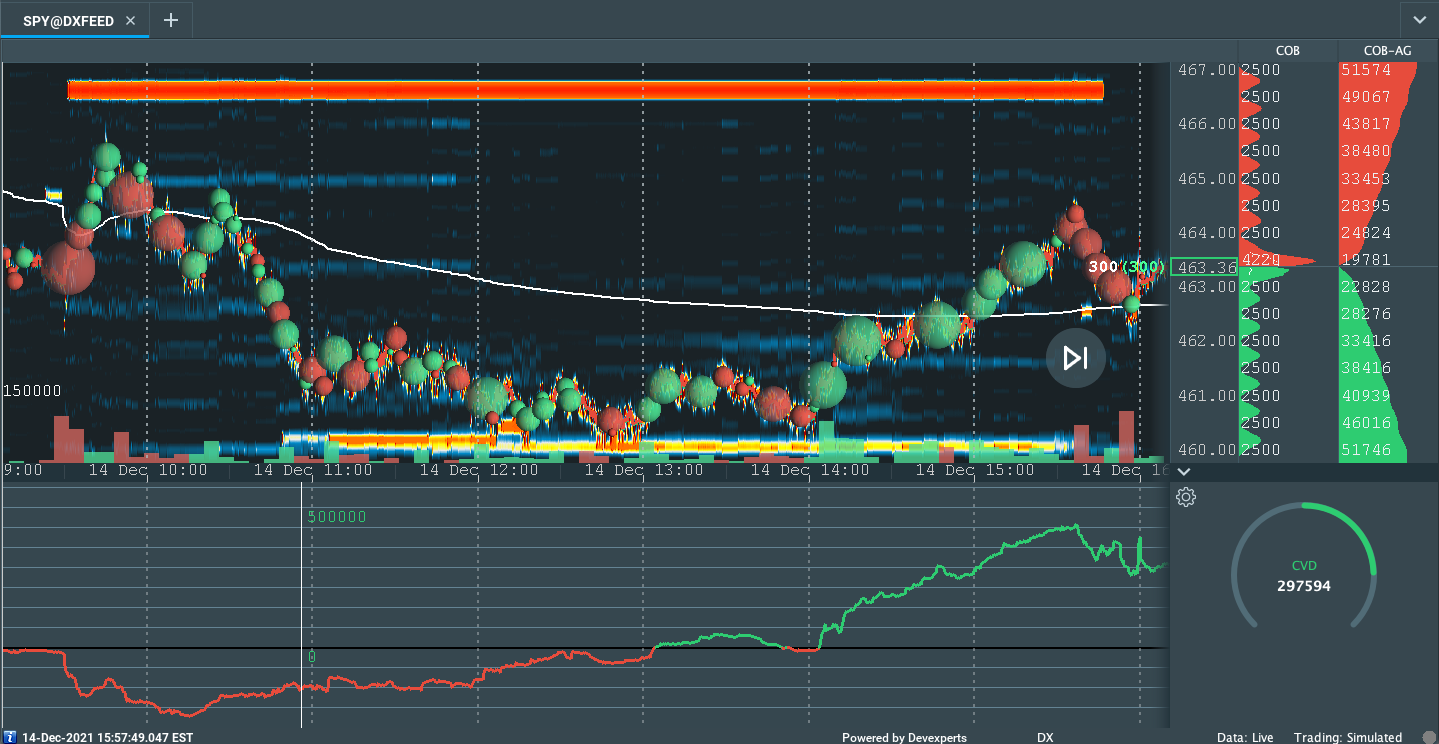
Graphic: SpotGamma’s Hedging Impact of Real-Time Options (HIRO) indicator.
Obviously, elsewhere, in single stock land, conditions are different. Metrics suggest options were a contributing factor in the weakness of rate-sensitive names, yesterday.
This is as many products are in lower liquidity and short-gamma (wherein an options delta rises with stock prices rises and falls when stock prices drop) in which moves are more erratic.
Note: As a position’s delta rises with stock or index price rises, gamma (or how an option’s delta is expected to change given a change in the underlying) is added to the delta.
Therefore, coming into weighty options expiration, correlations may (continue to) be off (as that is the only reconciliation in an environment where, at the index level, hedging pressures are sticky, whereas elsewhere they aren’t).
After the large January monthly options expiration (OPEX), correlations ought to fall back in line.
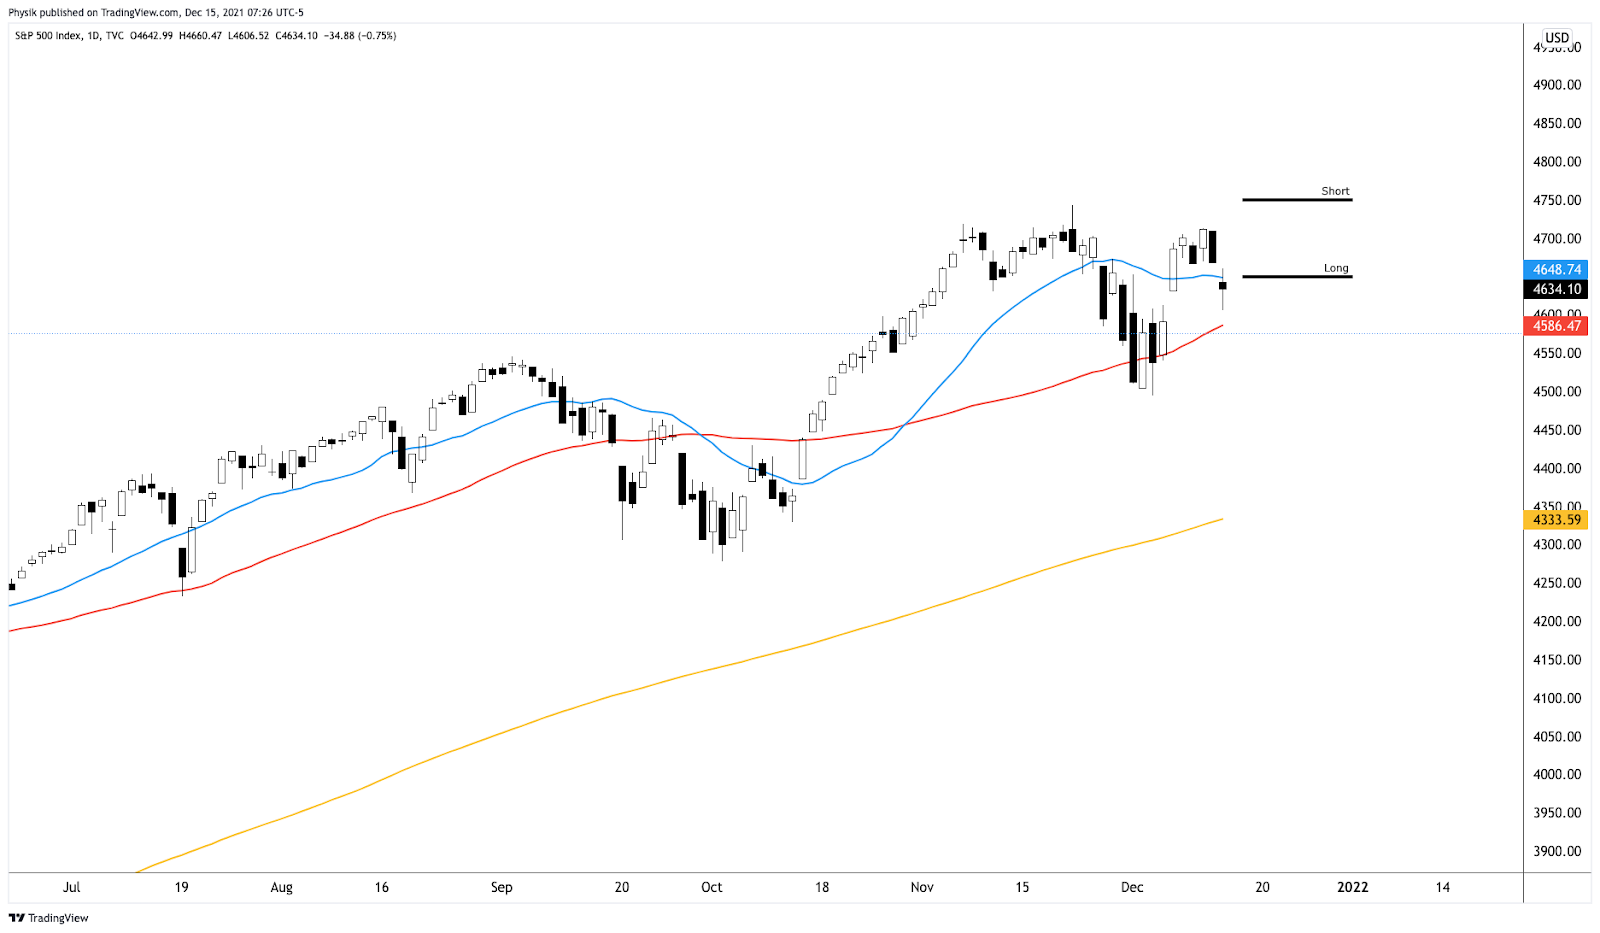
Technical: As of 6:30 AM ET, Friday’s regular session (9:30 AM – 4:00 PM ET), in the S&P 500, will likely open in the middle part of a balanced skewed overnight inventory, just of prior-range and -value, suggesting a limited potential for immediate directional opportunity.
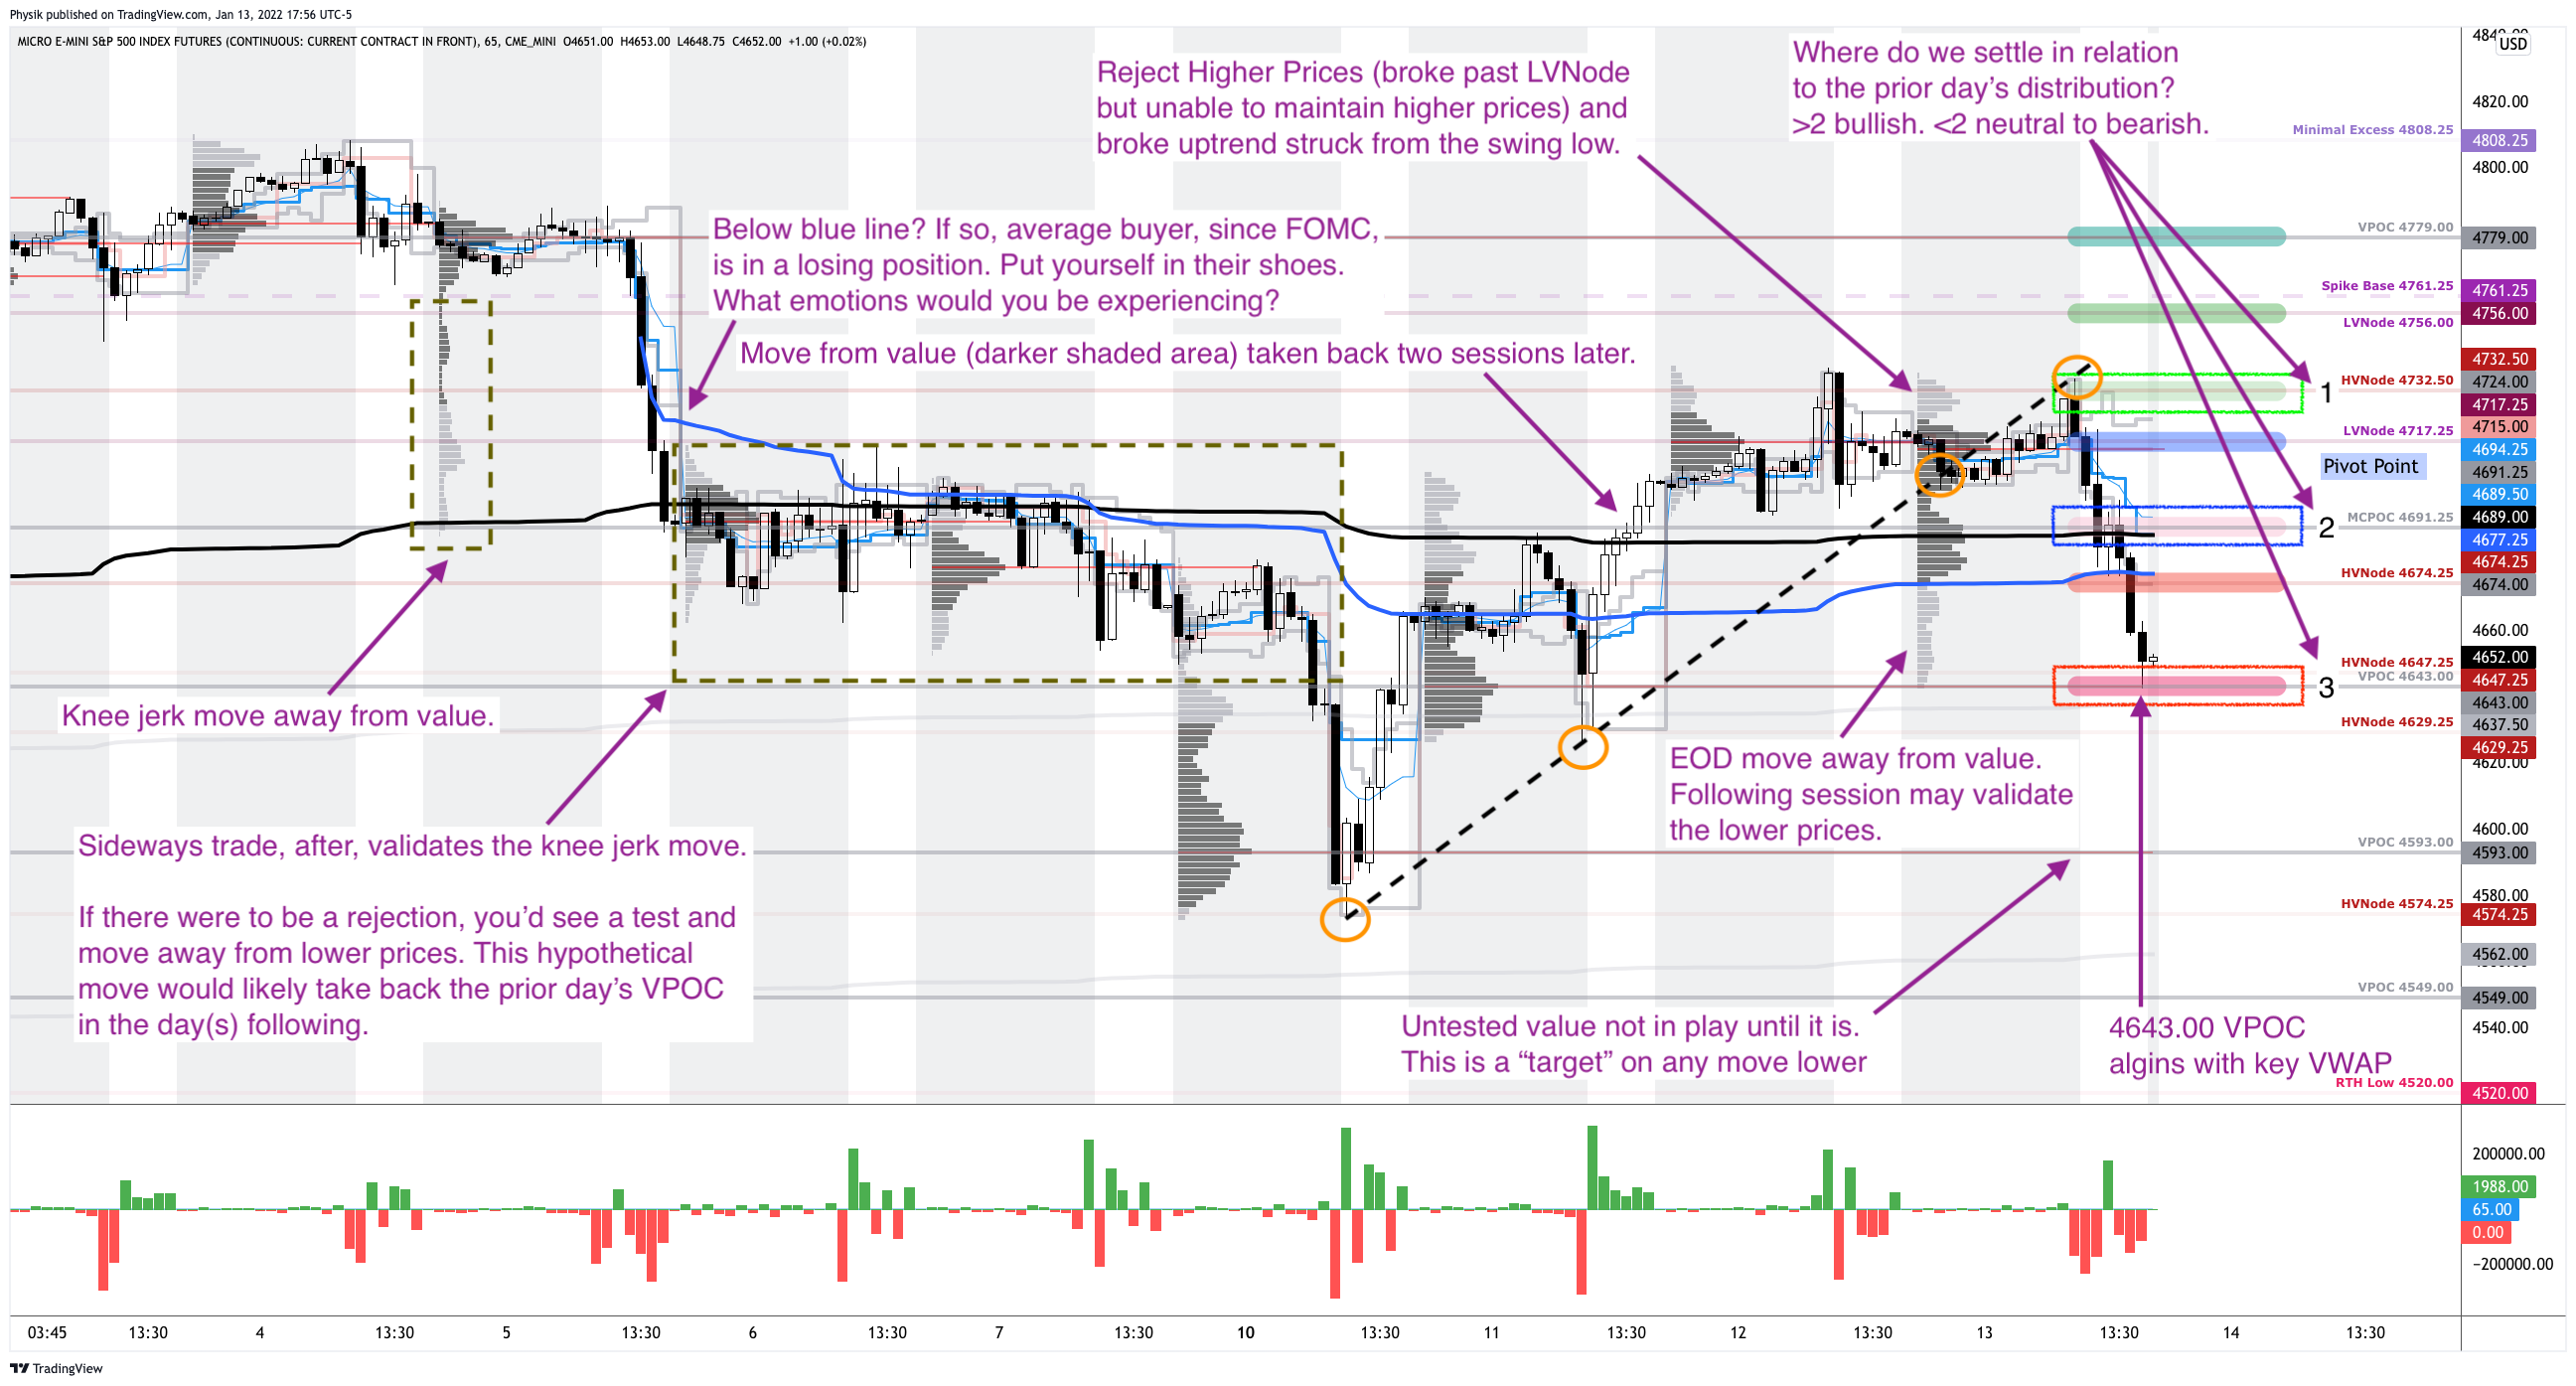
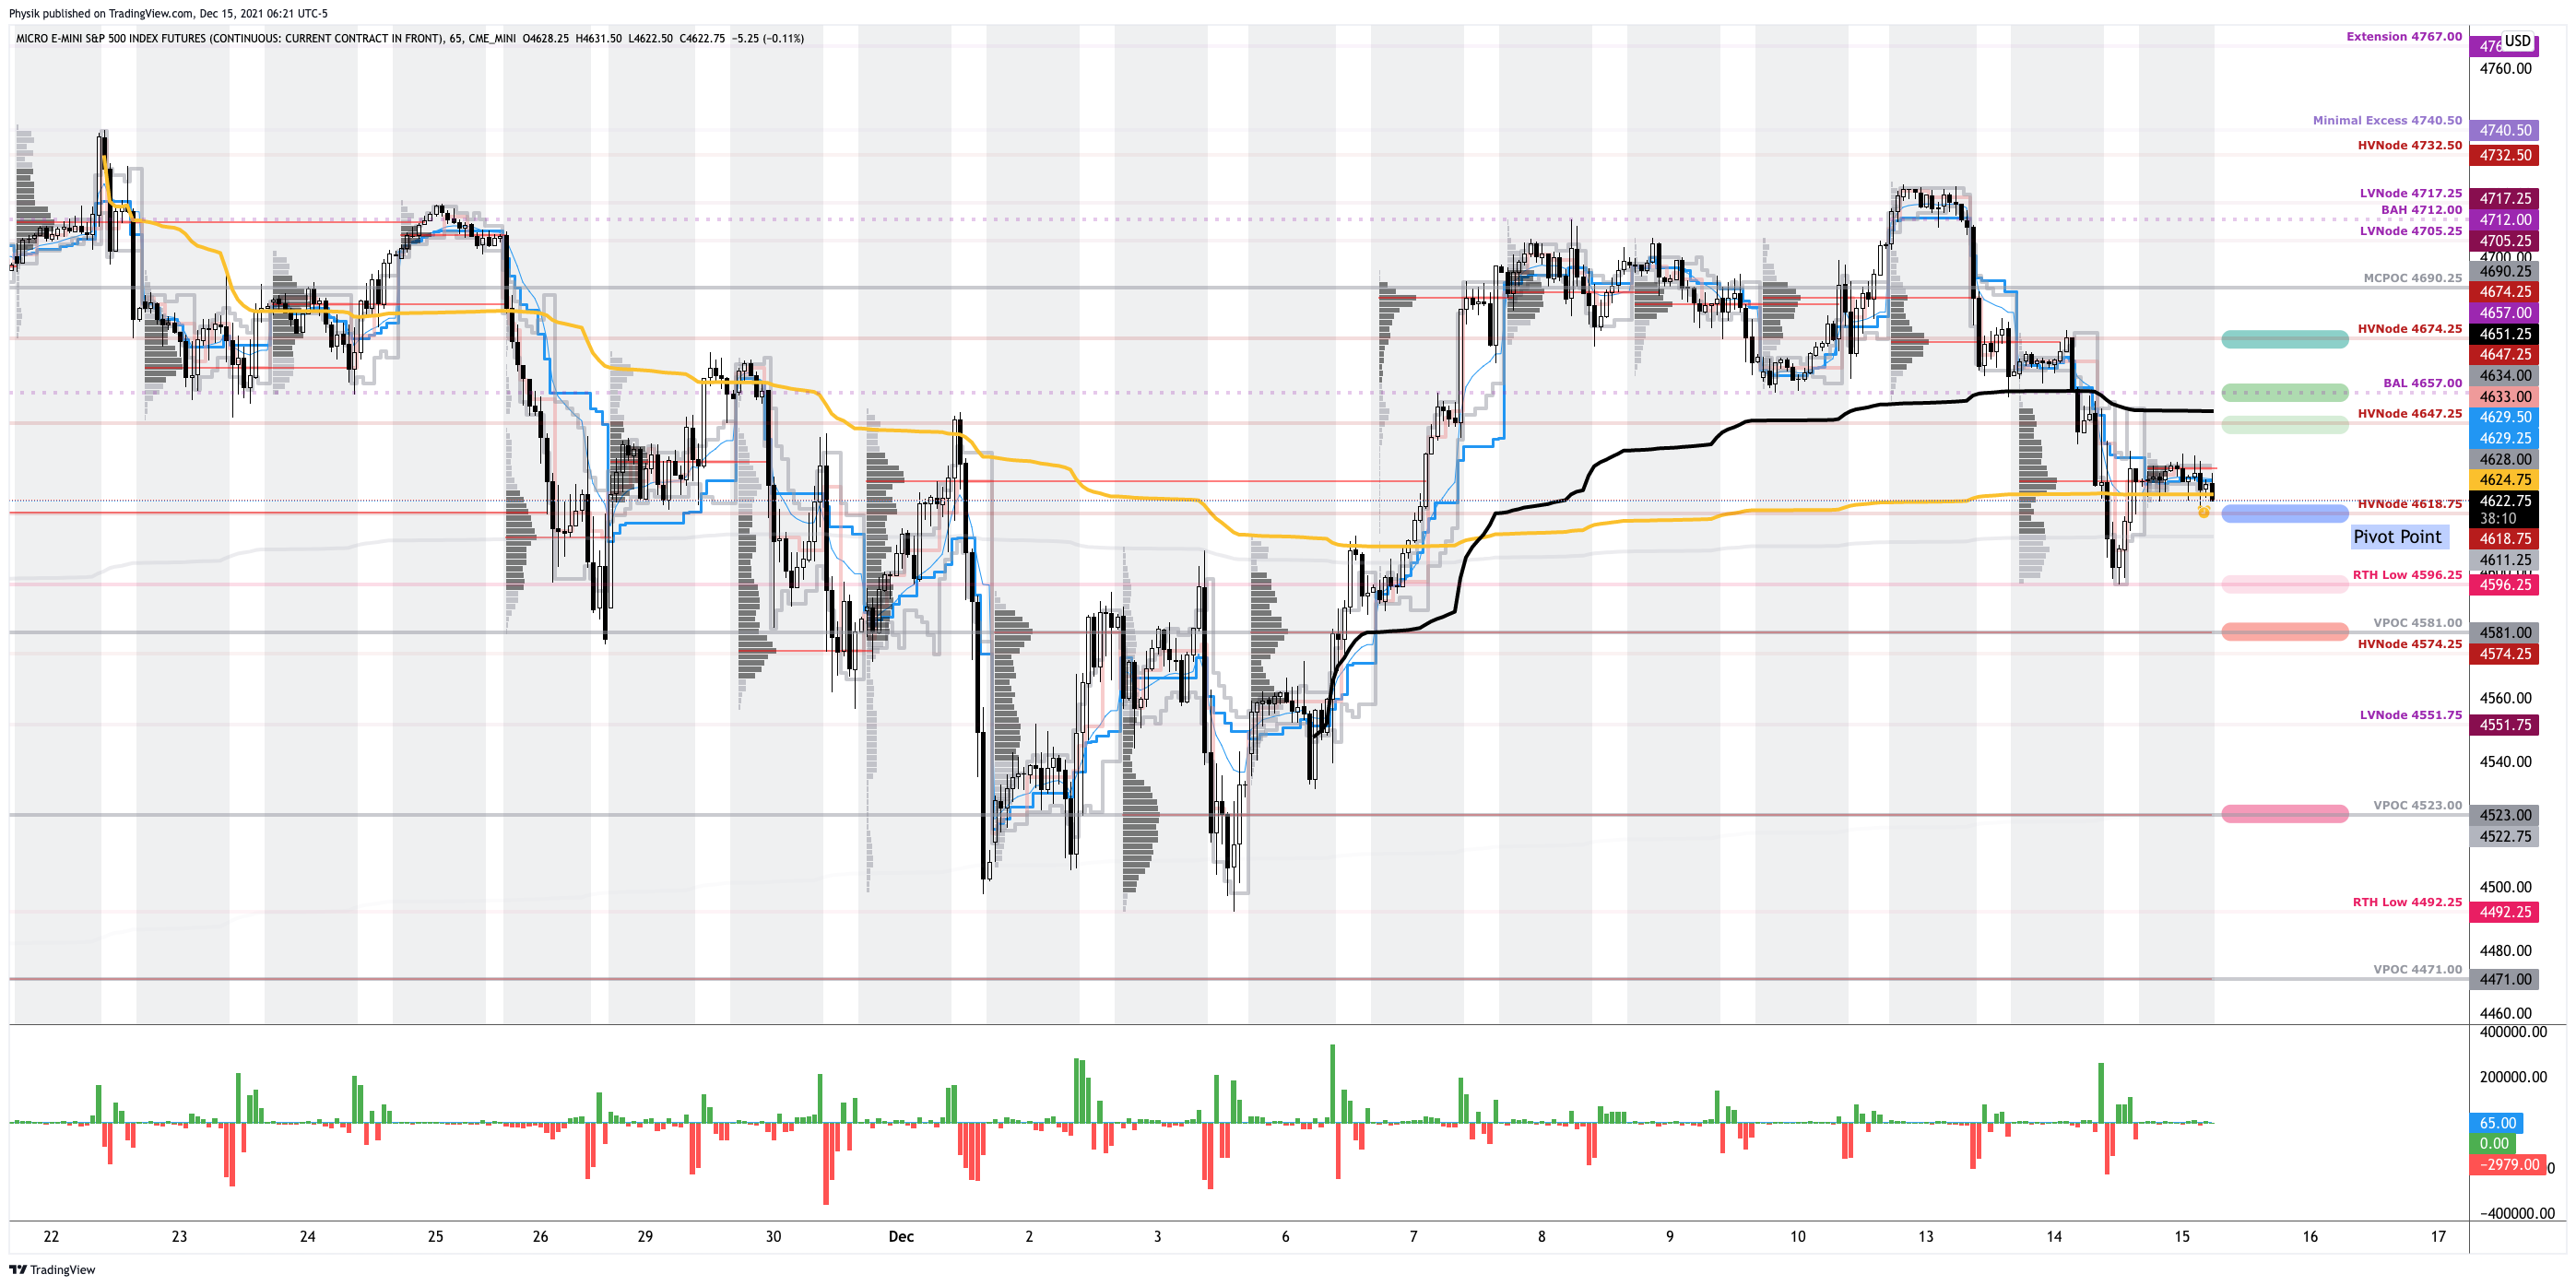
In the best case, the S&P 500 trades higher; activity above the $4,643.00 untested point of control (VPOC) puts in play the $4,674.25 high volume area (HVNode). Initiative trade beyond the HVNode could reach as high as the $4,691.25 micro composite point of control (MCPOC) and $4,715.00 VPOC, or higher.
In the worst case, the S&P 500 trades lower; activity below the $4,643.00 VPOC puts in play the $4,629.25 HVNode. Initiative trade beyond the HVNode could reach as low as the $4,593.00 and $4,549.00 VPOC, or lower.
Click here to load today’s key levels into the web-based TradingView charting platform. Note that all levels are derived using the 65-minute timeframe. New links are produced, daily.
Graphic: 65-minute profile chart of the Micro E-mini S&P 500 Futures.
Considerations: Recent trade is more so dominated by visually-driven, weaker-handed momentum players that mechanically respond to key technical levels like the 20-day simple moving average or profile levels.
Simply put, the other time frame participants are waiting for more information before committing to substantial expansion of range via large sales or buys.
Graphic: Despite selling, heavy, the S&P 500 is “sound” so to speak.
Definitions
Volume Areas: A structurally sound market will build on areas of high volume (HVNodes). Should the market trend for long periods of time, it will lack sound structure, identified as low volume areas (LVNodes). LVNodes denote directional conviction and ought to offer support on any test.
If participants were to auction and find acceptance into areas of prior low volume (LVNodes), then future discovery ought to be volatile and quick as participants look to HVNodes for favorable entry or exit.
POCs: POCs are valuable as they denote areas where two-sided trade was most prevalent in a prior day session. Participants will respond to future tests of value as they offer favorable entry and exit.
MCPOCs: POCs are valuable as they denote areas where two-sided trade was most prevalent over numerous day sessions. Participants will respond to future tests of value as they offer favorable entry and exit.
Options Expiration (OPEX): Traditionally, option expiries mark an end to pinning (i.e, the theory that market makers and institutions short options move stocks to the point where the greatest dollar value of contracts will expire) and the reduction dealer gamma exposure.
Inversion Of VIX Futures Term Structure: Longer-dated VIX expiries are less expensive; is a warning of elevated near-term risks for equity market stability.
Volume-Weighted Average Prices (VWAPs): A metric highly regarded by chief investment officers, among other participants, for quality of trade. Additionally, liquidity algorithms are benchmarked and programmed to buy and sell around VWAPs.
About
After years of self-education, strategy development, mentorship, and trial-and-error, Renato Leonard Capelj began trading full-time and founded Physik Invest to detail his methods, research, and performance in the markets.
Capelj is also a Benzinga finance and technology reporter interviewing the likes of Shark Tank’s Kevin O’Leary, JC2 Ventures’ John Chambers, FTX’s Sam Bankman-Fried, and ARK Invest’s Catherine Wood, as well as a SpotGamma contributor developing insights around impactful options market dynamics.
Disclaimer
Physik Invest does not carry the right to provide advice.
In no way should the materials herein be construed as advice. Derivatives carry a substantial risk of loss. All content is for informational purposes only.
The Daily Brief is a free glimpse into the prevailing fundamental and technical drivers of U.S. equity market products. Join the 200+ that read this report daily, below!
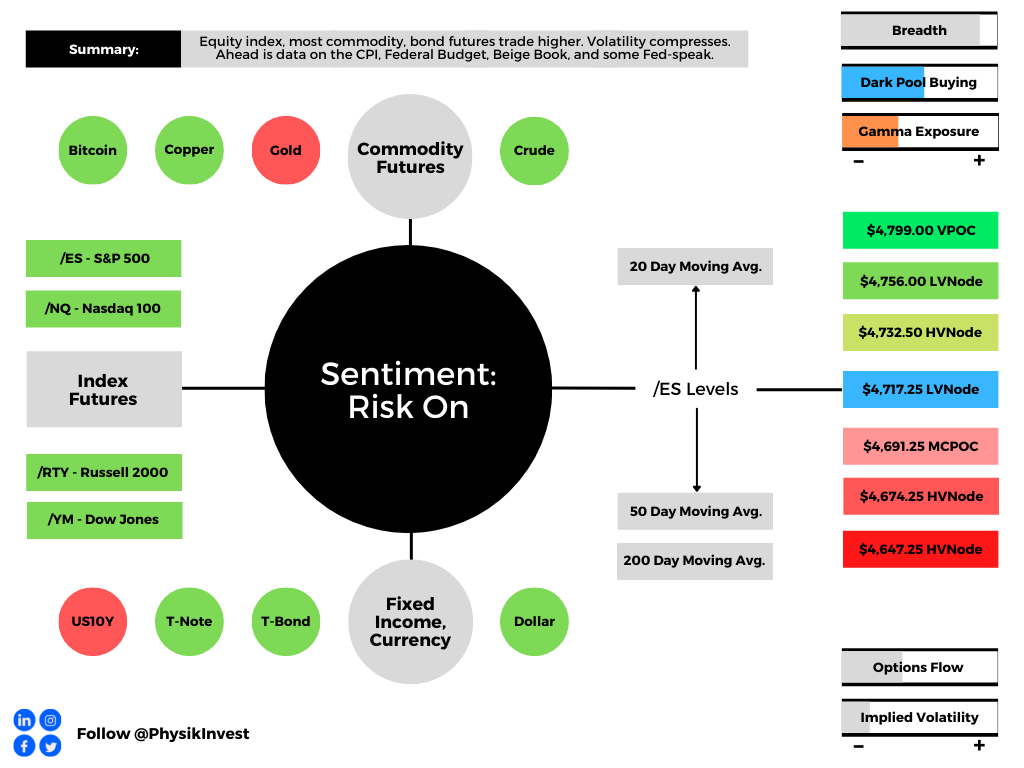
Overnight, equity index, as well as most commodity, and bond futures were higher ahead of data releases on the Consumer Price Index (8:30 AM ET), Federal Budget, and Beige Book (2:00 PM ET), as well as Fed-speak by Neel Kashkari (1:00 PM ET).
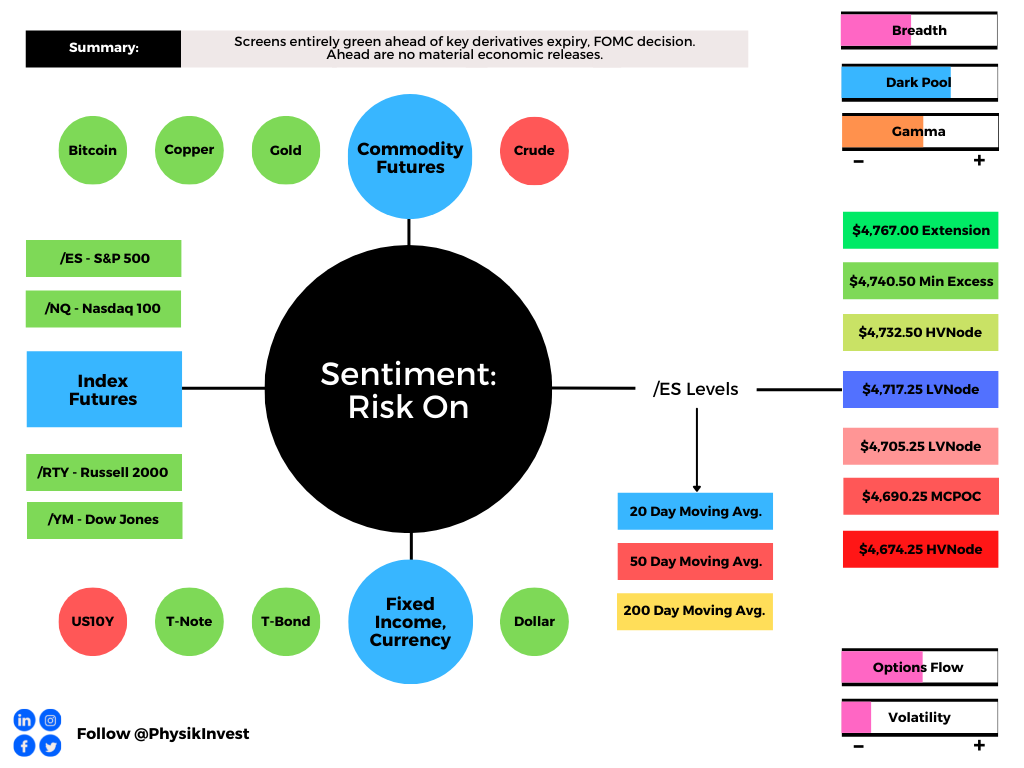
Graphic updated 6:30 AM ET. Sentiment Risk-On if expected /ES open is above the prior day’s range. /ES levels are derived from the profile graphic at the bottom of the following section. Levels may have changed since initially quoted; click here for the latest levels. SqueezeMetrics Dark Pool Index (DIX) and Gamma (GEX) calculations are based on where the prior day’s reading falls with respect to the MAX and MIN of all occurrences available. A higher DIX is bullish. At the same time, the lower the GEX, the more (expected) volatility. Learn the implications of volatility, direction, and moneyness. SHIFT data used for S&P 500 (INDEX: SPX) options activity. Note that options flow is sorted by the call premium spent; if more positive, then more was spent on call options. Breadth reflects a reading of the prior day’s NYSE Advance/Decline indicator. VIX reflects a current reading of the CBOE Volatility Index (INDEX: VIX) from 0-100.
What To Expect
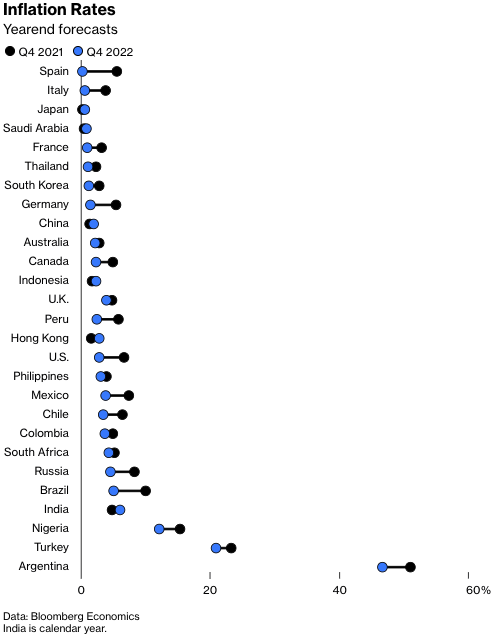
Fundamental: The focus, today, is whether or not the headline inflation rate tops 7%.
This is as improvements in the U.S. labor market and increased hawkishness from the Federal Reserve (Fed) are playing into a recent rotation (into value) and broad market slump.
As stocks recover from their multi-day slump; Jerome Powell reassured investors, Tuesday, that the Fed would stem increasing inflation and shrink its balance sheet.
“Hawkish Fed repricing is likely largely done for now,” and “resilient earnings should help equities rebound,” Barclays Plc (NYSE: BCS) strategists explained in a recent note.
Graphic: Via @biancoresearch, “we are in a rare period when what the market has priced in is the outlier call.”
JPMorgan Chase & Co (NYSE: JPM) agrees. Equities should be able to withstand hikes and balance sheet runoff amidst above-trend growth and a rebound in some international markets.
“As long as yields are rising for the right reasons, including better growth, we believe that equities should be able to tolerate the move,” a JPMorgan note said.
“The rise in real rates should not be hurting equity markets, or economic activity, at least until they move into positive territory, or even as long as real rates are below the real potential growth.”
In support of JPMorgan’s comments on real rates and growth, Sanford Bernstein outlines a bull case stating: “[H]istorically, when real yields normalized back to zero from negative levels, equities have had positive returns.”
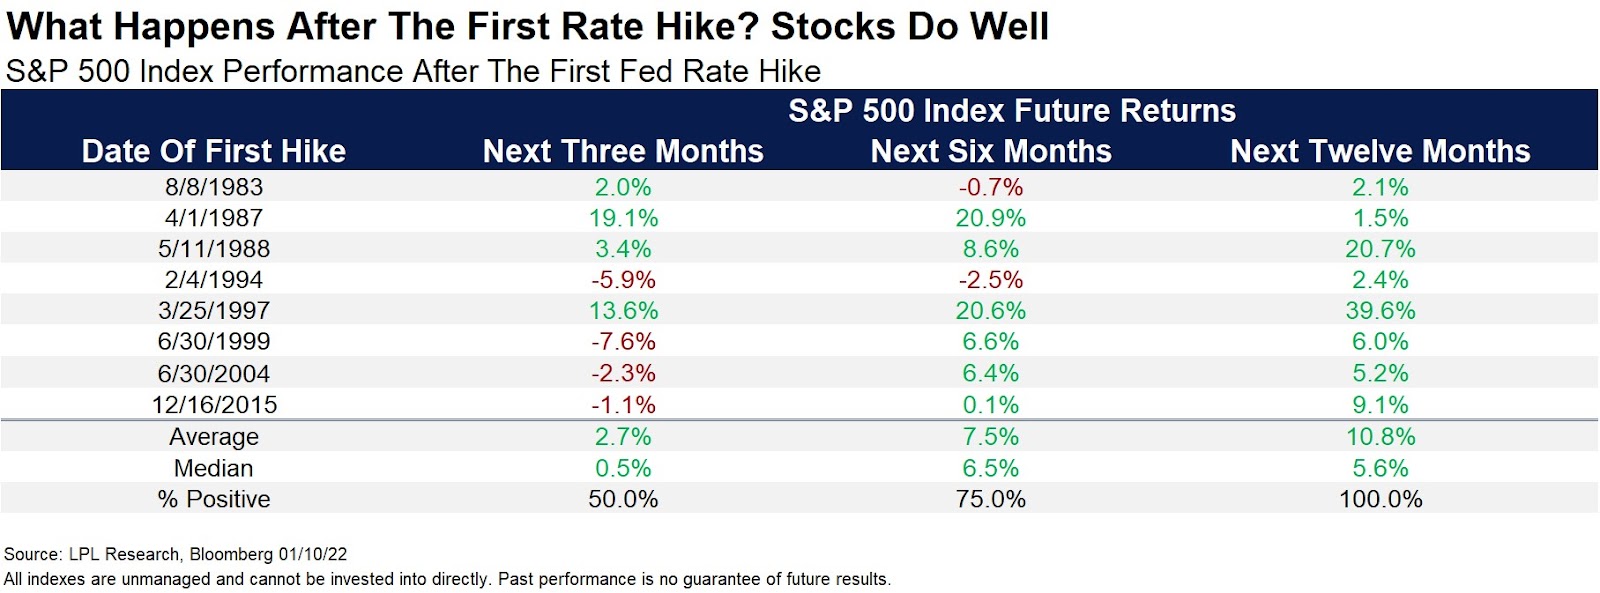
As a bonus, per Ryan Detrick of LPL Financial, “Yes, the Fed will probably hike rates for the first time in a new cycle some time during the first half of 2022. Remember though, looking at the past 8 first hikes, stocks were higher a year later every single time.”
Graphic: S&P 500 performance post-hiking, via LPL Financial.
In opposition to the bull-narrative, Jim Bianco of Bianco Research puts it well: “So, if the bond market is having epic convulsions in the wake Fed printer getting turned off, do not take solace that the stock market ‘doesn’t get it.’
“This is how financial markets turn, the stock market often stays too long and turns last.”
Positioning: To keep things fresh, recall that in buying a put, for instance, customers indirectly take liquidity as the counterparties hedge short put exposure by selling underlying.
Higher implied volatility marks up options delta (exposure to direction) and this leads to more selling, as hedging pressures exacerbate weakness. Higher volatility, higher delta, more selling.
As implied volatility compresses, options delta (exposure to direction) is marked down. This leads to buying by the counterparty.
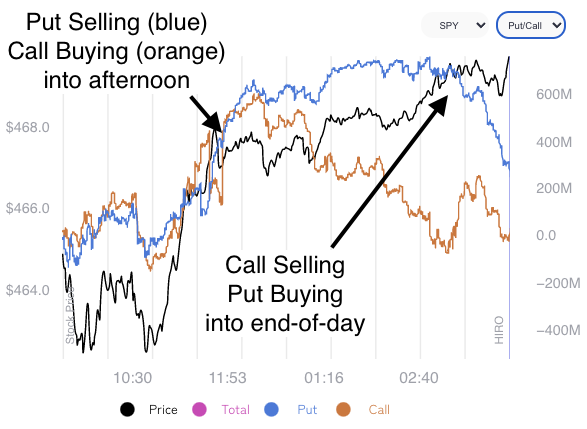
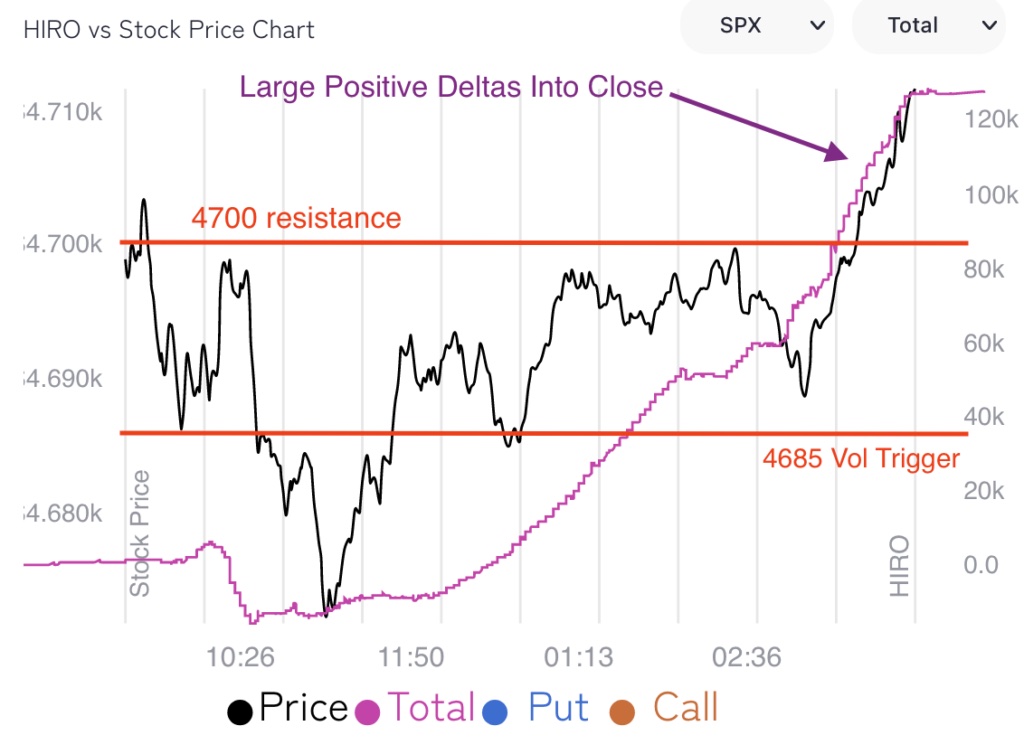
Per SpotGamma’s (unreleased) Hedging Impact of Real-Time Options indicator, over the past sessions, positive delta trade on the part of counterparties, as a result of customer put selling and call buying, has supported the near-vertical price rise from Monday’s lows.
Graphic: SpotGamma’s (beta) Hedging Impact of Real-Time Options (HIRO) indicator.
As visualized, above, positive delta trade tapered off into the close, Tuesday, while S&P 500 prices continued higher. Interesting, right? Part of that rally has to do with volatility compression.
The VIX term structure remains upward sloping and volatility (via the INDEX: VIX) has fallen. As stated, above, compression marks options delta down and leads to buying by the counterparty.
My $VIX technical analysis shows a big wick yesterday as a result of the intraday VIX reversal from 23.5 to 19.5. Seems to be associated with (VIX) tops. pic.twitter.com/JgFdmfLybE
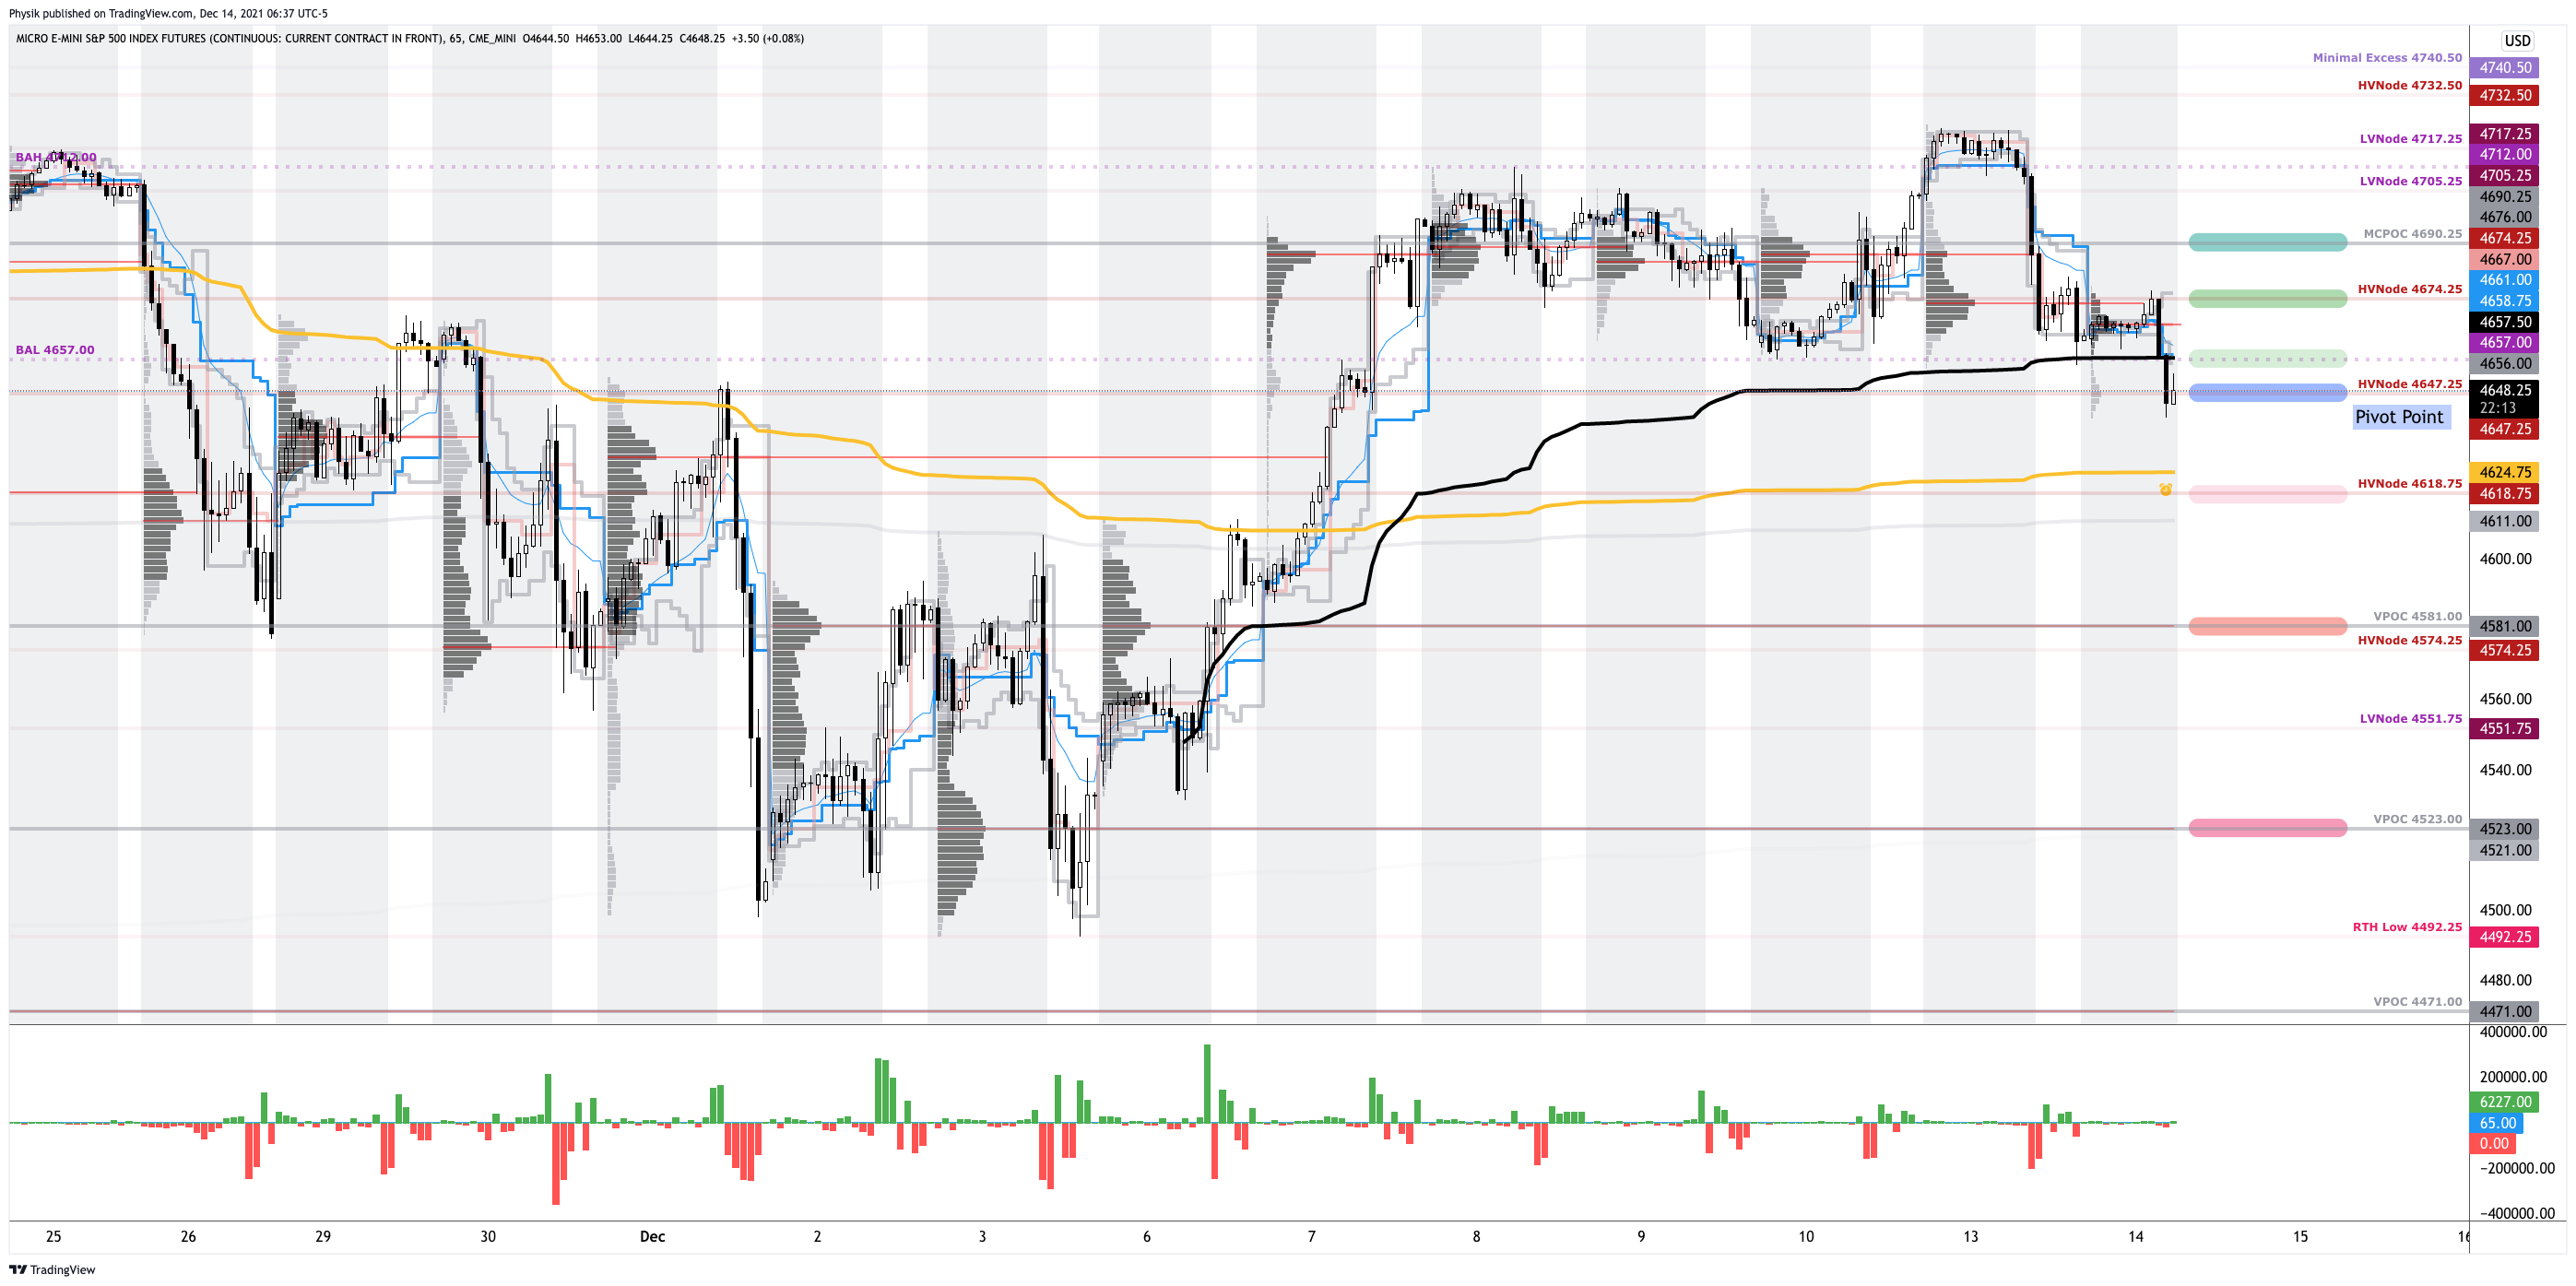
Technical: As of 6:30 AM ET, Wednesday’s regular session (9:30 AM – 4:00 PM ET), in the S&P 500, will likely open in the middle part of a positively skewed overnight inventory, just outside of prior-range and -value, suggesting a potential for immediate directional opportunity.
Gap Scenarios: Gaps ought to fill quickly. Should they not, that’s a signal of strength; do not fade. Leaving value behind on a gap-fill or failing to fill a gap (i.e., remaining outside of the prior session’s range) is a go-with indicator.

Auctioning and spending at least 1-hour of trade back in the prior range suggests a lack of conviction; in such a case, do not follow the direction of the most recent initiative activity.
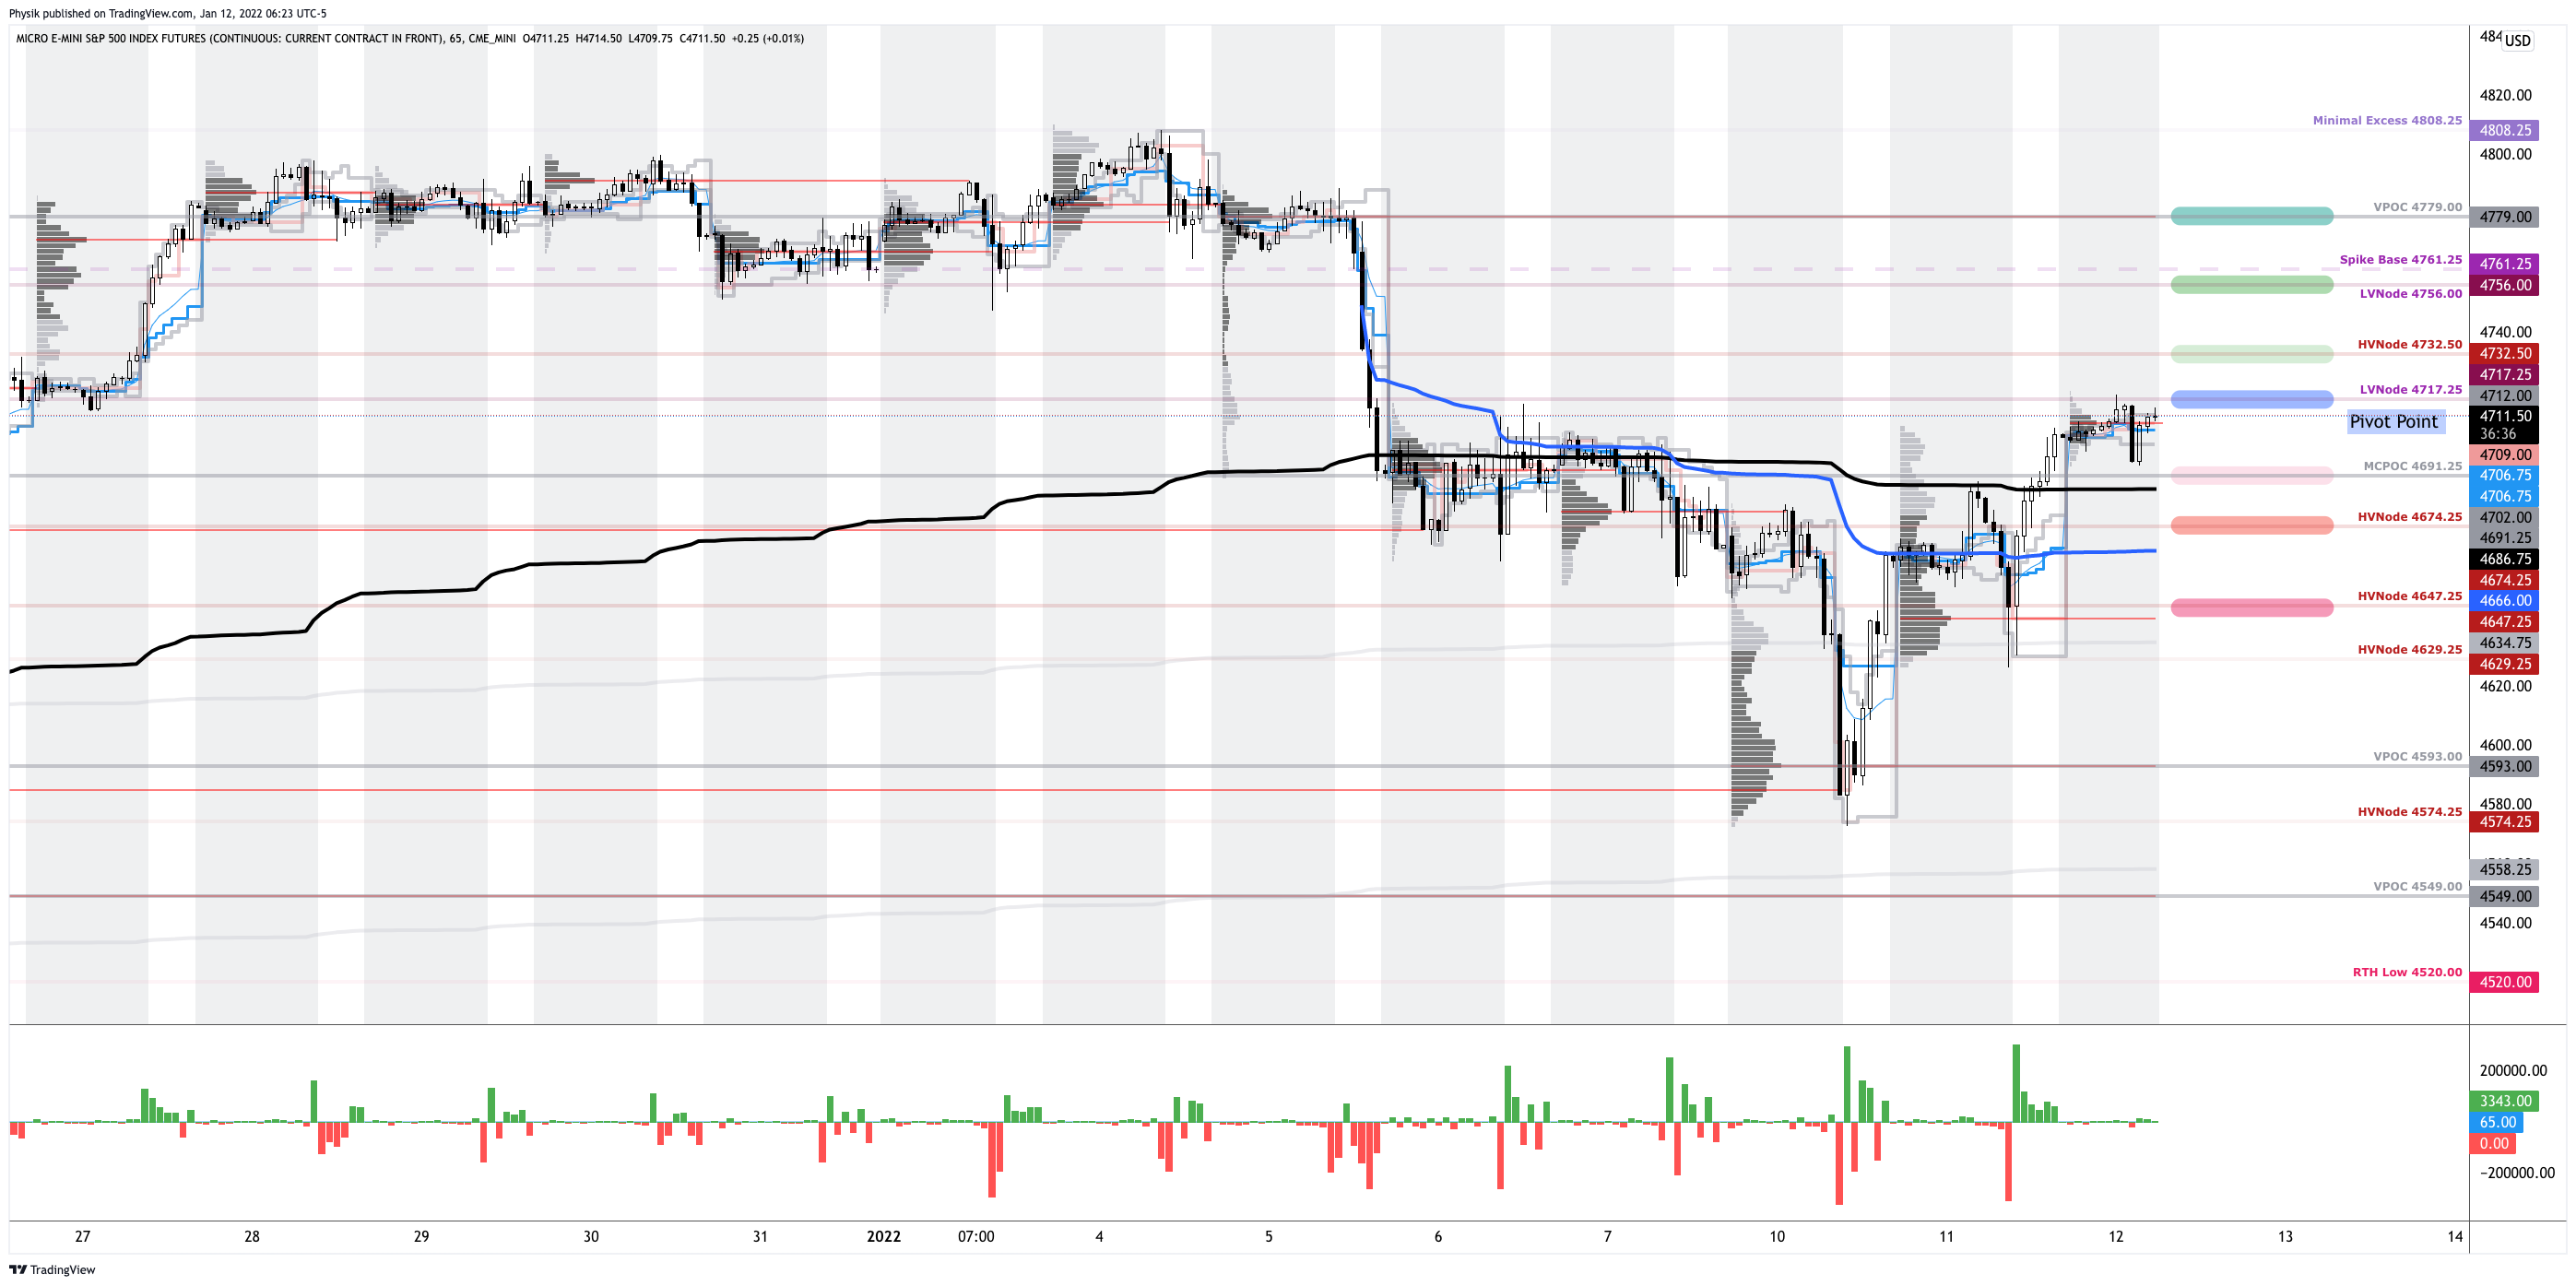
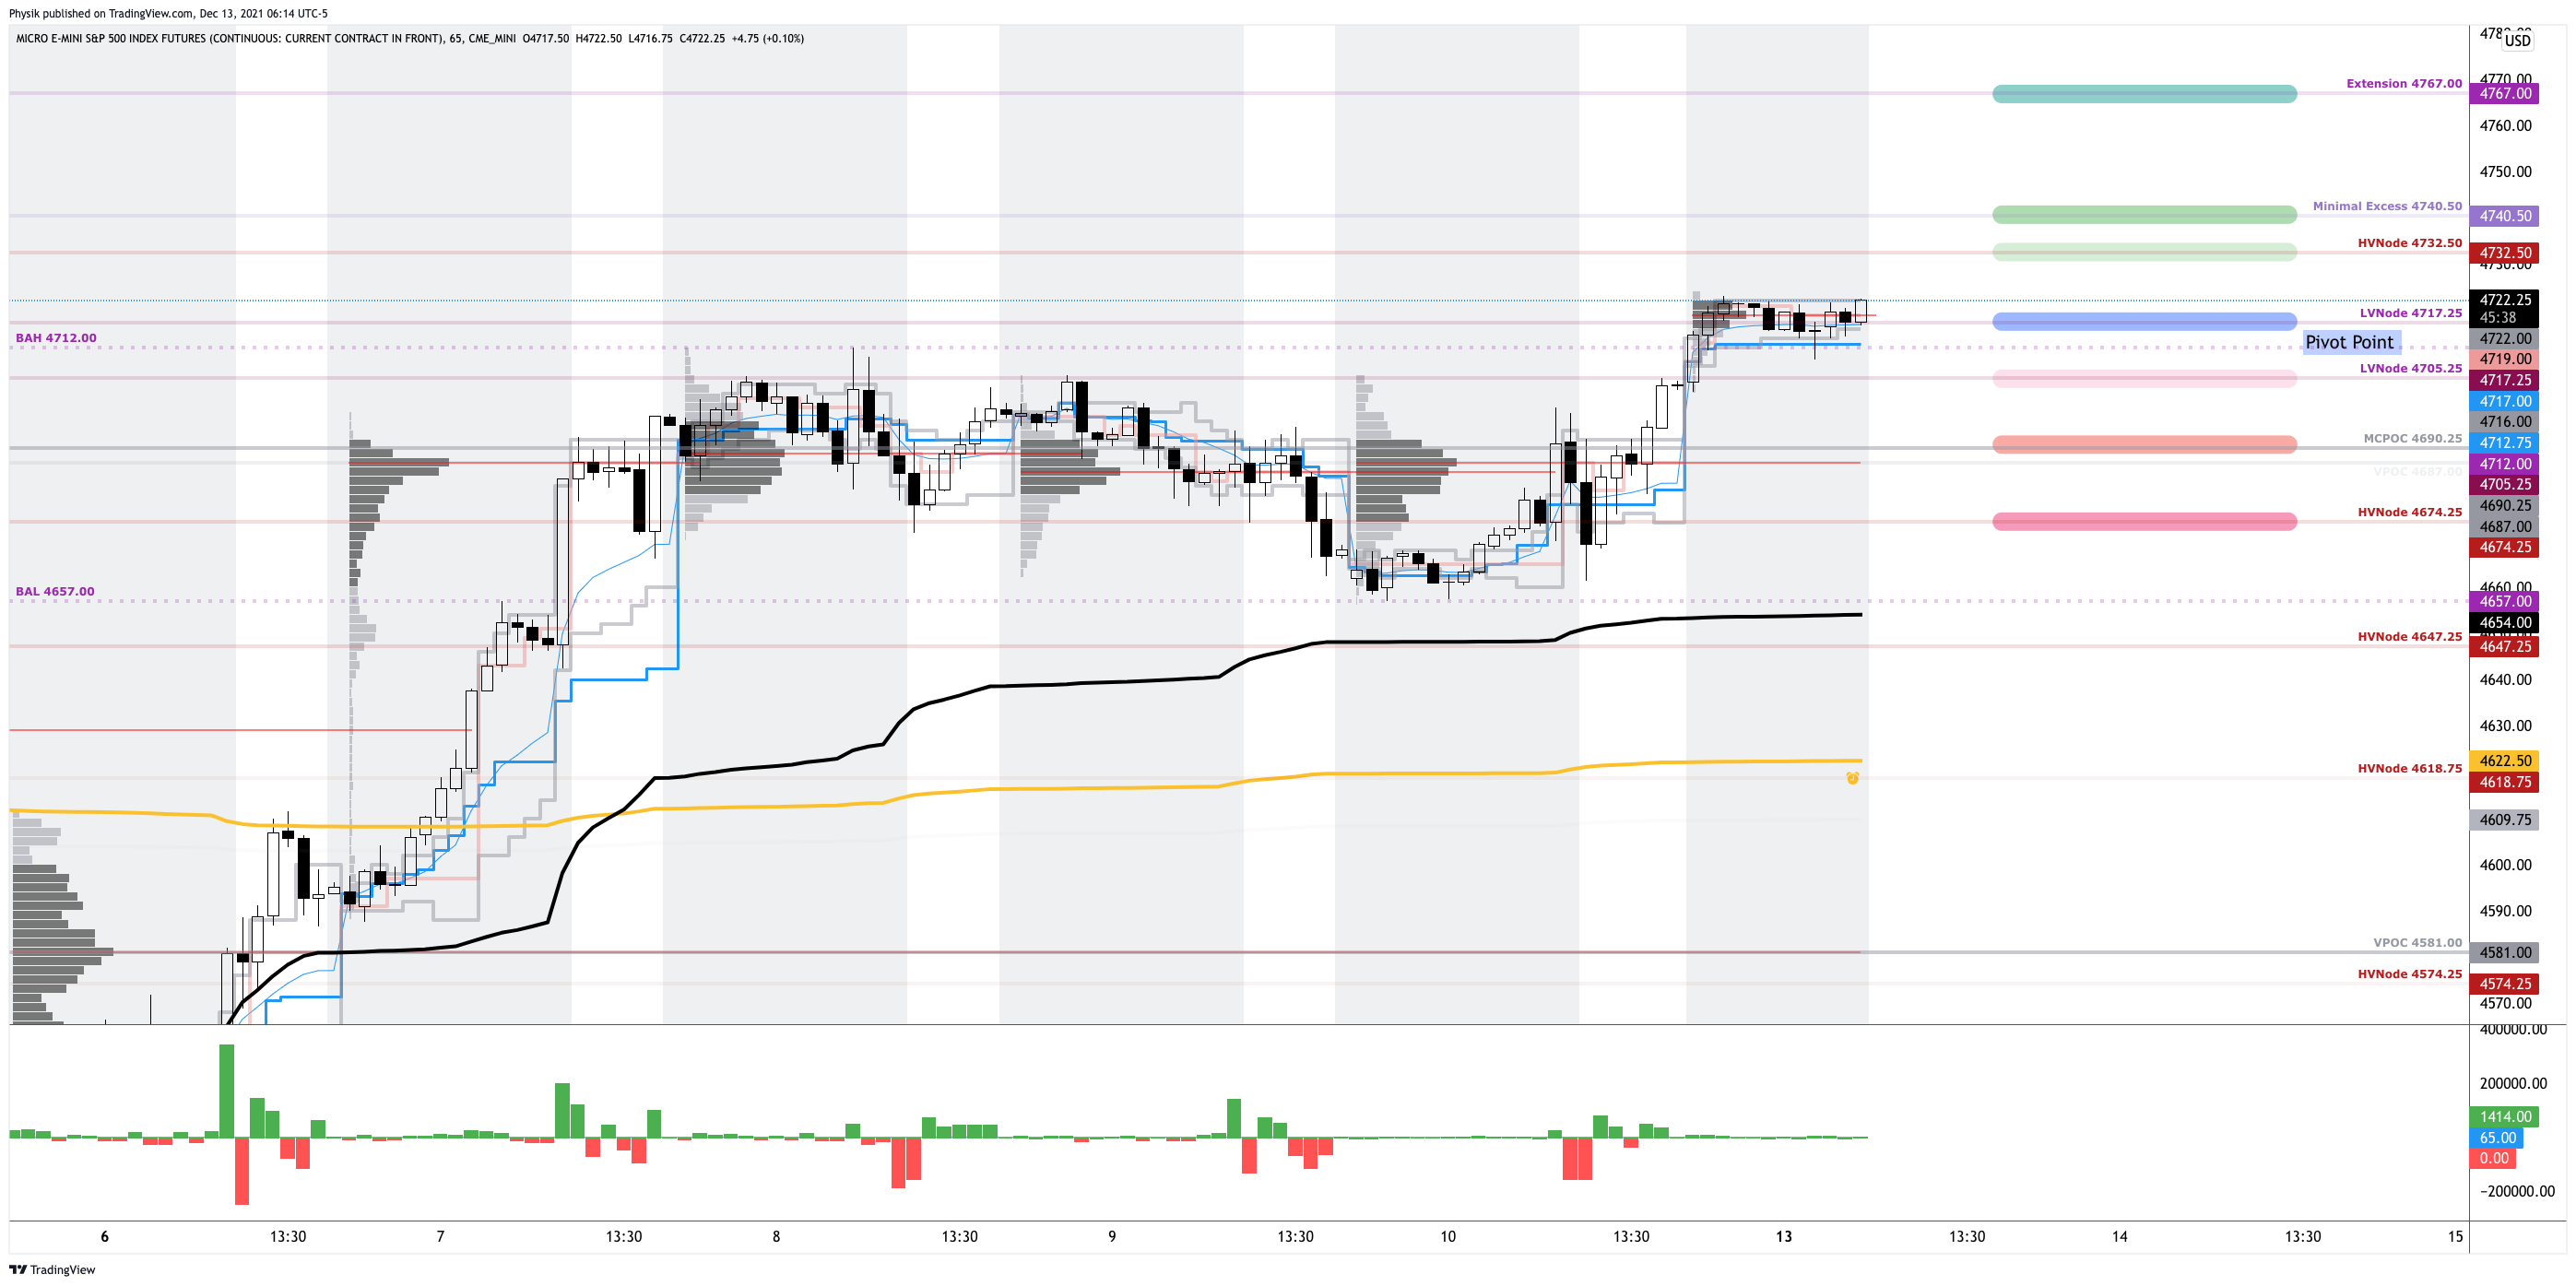
In the best case, the S&P 500 trades higher; activity above the $4,717.25 low volume area (LVNode) puts in play the $4,732.50 high volume area (HVNode). Initiative trade beyond the HVNode could reach as high as the $4,756.00 LVNode and $4,779.00 untested point of control (VPOC), or higher.
In the worst case, the S&P 500 trades lower; activity below the $4,717.25 LVNode puts in play the $4,691.25 micro composite point of control (MCPOC). Initiative trade beyond the MCPOC could reach as low as the $4,674.25 and $4,647.25 HVNode, or lower.
Click here to load today’s key levels into the web-based TradingView charting platform. Note that all levels are derived using the 65-minute timeframe. New links are produced, daily.
Graphic: 65-minute profile chart of the Micro E-mini S&P 500 Futures.
What People Are Saying
A fundamental question that is overlooked as traders jump into indicators, tools, chart types, patterns, moon cycles or whatever: why should the market reward your trade? Why here? Why long or short? For what target and at what stop? Cont… #trading
Volume Areas: A structurally sound market will build on areas of high volume (HVNodes). Should the market trend for long periods of time, it will lack sound structure, identified as low volume areas (LVNodes). LVNodes denote directional conviction and ought to offer support on any test.
If participants were to auction and find acceptance into areas of prior low volume (LVNodes), then future discovery ought to be volatile and quick as participants look to HVNodes for favorable entry or exit.
POCs: POCs are valuable as they denote areas where two-sided trade was most prevalent in a prior day session. Participants will respond to future tests of value as they offer favorable entry and exit.
MCPOCs: POCs are valuable as they denote areas where two-sided trade was most prevalent over numerous day sessions. Participants will respond to future tests of value as they offer favorable entry and exit.
About
After years of self-education, strategy development, mentorship, and trial-and-error, Renato Leonard Capelj began trading full-time and founded Physik Invest to detail his methods, research, and performance in the markets.
Capelj is also a Benzinga finance and technology reporter interviewing the likes of Shark Tank’s Kevin O’Leary, JC2 Ventures’ John Chambers, FTX’s Sam Bankman-Fried, and ARK Invest’s Catherine Wood, as well as a SpotGamma contributor developing insights around impactful options market dynamics.
Disclaimer
Physik Invest does not carry the right to provide advice.
In no way should the materials herein be construed as advice. Derivatives carry a substantial risk of loss. All content is for informational purposes only.
Equity index futures are lower after Monday’s failed balance-area breakout in the S&P 500 had that index rotate to and through the opposite end of a multi-day consolidation, yesterday.
This trade is in the face of expectations the Federal Reserve (Fed) will accelerate the taper to bond-buying, clearing the way for interest-rate hikes.
Rising rates, among other factors, have the potential to decrease the present value of future earnings, thereby making stocks, especially those that are high growth, less attractive.
The ruling narrative, so to speak, has resulted in the selling of expensive areas of the market.
Ahead is retail sales, import prices, and Empire State Manufacturing Index (8:30 AM ET) data.
Then there are releases on the NAHB Home Builders’ Index, business inventories, inventory-sales ratio (10:00 AM ET). Later is a Federal Open Market Committee (FOMC) announcement (2:00 PM ET) and press conference (2:30 PM ET).
Graphic updated 6:25 AM ET. Sentiment Neutral if expected /ES open is inside of the prior day’s range. /ES levels are derived from the profile graphic at the bottom of the following section. Levels may have changed since initially quoted; click here for the latest levels. SqueezeMetrics Dark Pool Index (DIX) and Gamma (GEX) calculations are based on where the prior day’s reading falls with respect to the MAX and MIN of all occurrences available. A higher DIX is bullish. At the same time, the lower the GEX, the more (expected) volatility. Learn the implications of volatility, direction, and moneyness. SHIFT data used for S&P 500 (INDEX: SPX) options activity. Note that options flow is sorted by the call premium spent; if more positive then more was spent on call options. Breadth reflects a reading of the prior day’s NYSE Advance/Decline indicator. VIX reflects a current reading of the CBOE Volatility Index (INDEX: VIX) from 0-100.
What To Expect
According to SpotGamma, into this week, participants had been increasing their short-delta exposure (via a lot of call selling and a bit of put buying).
This resulted in dealers selling (buying) futures into strength (weakness), a dynamic that promotes consolidation.
Later, as participants positioned for the FOMC event, demand for protection expanded and the S&P 500 made it to and through the low-end of the consolidation against the $4,700.00 high activity options strike.
The trade built out areas of high volume (HVNode) via the cave-fill process in locations where prior discovery left weak structure – gaps and p-shaped emotional, multiple distribution profile structures (i.e., old-money covering shorts).
As evidenced by the divergent delta, below, responsive buyers surfaced at a key volume-weighted average price (VWAP) level (near $4,600.00 S&P 500), at which liquidity algorithms are benchmarked and programmed to buy and sell.
Graphic: Divergent delta (i.e., non-committed selling as measured by volume delta or buying and selling power as calculated by the difference in volume traded at the bid and offer) in SPDR S&P 500 ETF Trust (NYSE: SPY), one of the largest ETFs that track the S&P 500 index, via Bookmap. The readings are supportive of responsive trade (i.e., rotational trade that suggests current prices offer favorable entry and exit; the market is attempting in balance).
At the same time, as SpotGamma (beta) Hedging Impact of Real-Time Options (HIRO) indicator suggested “participants saw lower prices as an opportunity to express their opinion of lower volatility into Wednesday’s Federal Open Market Committee (FOMC) update.”
Graphic: SpotGamma’s Hedging Impact of Real-Time Options (HIRO) indicator, which is pink in color, was sideways to higher. This suggests positive options delta trades likely had dealers buying stock/futures into the close.
Context: Today, we get clarity from the Fed.
The expectation is that the asset purchases are scaled back by $30 billion per month versus the expected $15 billion. In doubling the pace of the taper to bond-buying, the odds of earlier rate hikes increase markedly.
“If the Fed does not address inflation soon, they risk long rates shooting much higher,” says Jim Bianco of Bianco Research.
“But if they follow the market’s lead in aggressively hiking rates, they risk hurting the economy. We understand the Fed’s paralysis given the massive uncertainty coming out of the pandemic. However, the longer they wait to address inflation, the worse this conundrum will become.”
Notwithstanding, today’s rates are supporting validations better than in the ‘90s.
At the same time, equity markets tend to rally into the first hike; Moody’s Corporation’s (NYSE: MCO) forecast aligns with that – “the Dow Jones Industrial Average increases this quarter and peaks in early 2022, … [followed by] steady decline through 2022.”
Graphic: S&P 500 performance before and after rate hikes.
Immediate risks, though, remain.
There are growing pockets of weakness – as evidenced by divergent breadth – in the face of U.S. stocks’ inflation-adjusted earnings yield turning negative.
Similarly, participants are more exposed to leveraged products, among other things, which increases the speed with which volatility is realized.
“One potential catalyst would be an explosion in the value of margin accounts at brokers and dealers, which amounted to $595 billion in the second quarter, nearly double the pre-pandemic level. A drop in stock prices could trigger margin calls.”
So despite “natural, passive buying support” and positioning metrics flashing a buy, as well as expectations of “the strongest quarterly nominal [economic] growth in more than three decades,” offsides positioning may prompt a reaction that exacerbates underlying price movements.
So what? The market is in a positive-gamma environment wherein the counterparties to customer options trades add market liquidity and temper realized volatility.
If participants’ monetary policy fears are assuaged, a collapse in event-related implied volatility ought to bring positive flows as the long delta (from dealers’ exposure to short puts) decreases.
The decrease in dealer supply (short delta) post-FOMC and -OPEX, via the covering of short stock/futures hedges to put-heavy positioning, ought to bolster any attempt higher.
That’s not to say that some of the vulnerabilities like participants’ large exposure to leveraged products (which increases the speed with which volatility is realized) couldn’t prompt a round of destabilizing demand for downside protection.
Graphic: The “Biggest tail risk to SPX isn’t any macro data/virus/war but its own options market.”
Though order book depth “in isolation is not the correct method to gauge liquidity,” it can help in roughly assessing participants’ demand/supply as volatility (and stress, by that token) increases.
Graphic: Analysis of book depth for the E-mini S&P 500 futures contract, via CME Group Inc’s (NASDAQ: CME) Liquidity Tool. For more on the implications of participants’ options positioning and dealer hedging, read here.
Already, according to Bloomberg, some participants are positioning for “a seasonably favorable period for stocks” in 2021; “someone purchase[d] roughly 20,000 call spreads that are linked to the S&P 500 and expire right before the Christmas holiday. The transaction involved selling calls with a strike price at 4,750 to fund bullish options exercisable at 4,650.”
Graphic: S&P 500 finds support in area between the 20- and 50-day simple moving average. The aforementioned bullish “call spread” trade expiring before the Christmas holiday is included.
Expectations: As of 6:25 AM ET, Wednesday’s regular session (9:30 AM – 4:00 PM ET), in the S&P 500, will likely open in the middle part of a balanced overnight inventory, inside of prior-range and -value, suggesting a limited potential for immediate directional opportunity.
In the best case, the S&P 500 trades sideways or higher; activity above the $4,618.75 high volume area (HVNode) puts in play the $4,647.25 HVNode. Initiative trade beyond the latter could reach as high as the $4,657.00 balance area low (BAL) and $4,674.25 HVNode, or higher.
In the worst case, the S&P 500 trades lower; activity below the $4,618.75 HVNode puts in play the $4,596.25 regular trade low (RTH Low). Initiative trade beyond the RTH Low could reach as low as the $4,581.00 and $4,523.00 untested point of control (VPOC), or lower.
Click here to load today’s key levels into the web-based TradingView charting platform. Note that all levels are derived using the 65-minute timeframe. New links are produced, daily.
Graphic: 65-minute profile chart of the Micro E-mini S&P 500 Futures. Learn about the profile.
What People Are Saying
The end of the year (December) is typically a tough trading month for me. Ive learned that it’s about what people have to do in the market, not what they want to do. Correlations are also deceiving because of this. Don’t ruin Christmas by overthinking & over trading in December
Volume Areas: A structurally sound market will build on areas of high volume (HVNodes). Should the market trend for long periods of time, it will lack sound structure, identified as low volume areas (LVNodes). LVNodes denote directional conviction and ought to offer support on any test.
If participants were to auction and find acceptance into areas of prior low volume (LVNodes), then future discovery ought to be volatile and quick as participants look to HVNodes for favorable entry or exit.
POCs: POCs are valuable as they denote areas where two-sided trade was most prevalent in a prior day session. Participants will respond to future tests of value as they offer favorable entry and exit.
Options Expiration (OPEX): Traditionally, option expiries mark an end to pinning (i.e, the theory that market makers and institutions short options move stocks to the point where the greatest dollar value of contracts will expire) and the reduction dealer gamma exposure.
About
After years of self-education, strategy development, and trial-and-error, Renato Leonard Capelj began trading full-time and founded Physik Invest to detail his methods, research, and performance in the markets.
Additionally, Capelj is a Benzinga finance and technology reporter interviewing the likes of Shark Tank’s Kevin O’Leary, JC2 Ventures’ John Chambers, and ARK Invest’s Catherine Wood, as well as a SpotGamma contributor, helping develop insights around impactful options market dynamics.
Disclaimer
At this time, Physik Invest does not carry the right to provide advice. In no way should the materials herein be construed as advice. Derivatives carry a substantial risk of loss. All content is for informational purposes only.
Overnight, equity index futures were mixed after Monday’s failed balance-area breakout in the S&P 500 had that index rotate to and through the opposite end of a multi-day consolidation.
This is as market participants await clarity on monetary policy from the Federal Reserve and the weighty “quad-witching” derivatives expiry, late this week.
Ahead is data on the producer price index (8:30 AM ET).
Graphic updated 6:40 AM ET. Sentiment Risk-Off if expected /ES open is below the prior day’s range. /ES levels are derived from the profile graphic at the bottom of the following section. Levels may have changed since initially quoted; click here for the latest levels. SqueezeMetrics Dark Pool Index (DIX) and Gamma (GEX) calculations are based on where the prior day’s reading falls with respect to the MAX and MIN of all occurrences available. A higher DIX is bullish. At the same time, the lower the GEX, the more (expected) volatility. Learn the implications of volatility, direction, and moneyness. SHIFT data used for S&P 500 (INDEX: SPX) options activity. Note that options flow is sorted by the call premium spent; if more positive then more was spent on call options. Breadth reflects a reading of the prior day’s NYSE Advance/Decline indicator. VIX reflects a current reading of the CBOE Volatility Index (INDEX: VIX) from 0-100.
What To Expect
A change in the market was occurring, yesterday, as participants sought to break the S&P 500 out of a multi-day balance area and discover higher prices.
Shortly after the U.S. cash open, however, there was no follow-through; the index liquidated to the opposite end of the balance with sellers turning aggressive into the close.
Selling carried-forward, overnight, as the S&P 500 made it through the low-end of balance before finding responsive buyers at an anchored volume-weighted average price (VWAP) level, at which liquidity algorithms are benchmarked and programmed to buy and sell.
As noted many sessions ago, prior discovery left gaps and p-shaped emotional, multiple-distribution profile structures (i.e., old-money covering shorts).
Participants are now revisiting, repairing, and strengthening – building out areas of high volume (HVNodes) via the cave-fill process – these areas of low volume (LVNodes).
Graphic: Supportive delta (i.e., committed selling into end-of-day as measured by volume delta or buying and selling power as calculated by the difference in volume traded at the bid and offer) in SPDR S&P 500 ETF Trust (NYSE: SPY), one of the largest ETFs that track the S&P 500 index, via Bookmap. Though initial readings were supportive of responsive trade (i.e., rotational trade that suggests current prices offer favorable entry and exit), selling turned aggressive with the S&P 500 breaking its multi-day consolidation low, overnight.
Context: The S&P 500 can’t seem to crack the pin beneath $4,700.00.
This pin is the result of customers committing capital to bets on low volatility into this week’s Federal Open Market Committee (FOMC) meeting and Friday’s large derivatives expiry.
Graphic: Customers increased their exposure to short-delta call exposure. “Last week was about selling index calls,” SpotGamma’s Brent Kochuba said on Twitter. “This is likely why the $SPX stopped at $4,700.00.”
According to SpotGamma, participants are increasing their short-delta exposure (via a lot of call selling and a bit of put buying).
In hedging their rising (declining) long-delta exposure, the dealer or counterparty to this positioning will sell (buy) futures into strength (weakness).
This forces the market into a consolidation.
This trend ought to continue until(A) there’s a collapse in event-related implied volatility which would bring in positive flows as dealers cover static hedges, (B) the poor breadth and single-stock weakness feeds into feverishly destabilizing demand for downside protection, or (C) participants commit more capital to calls further out in time and higher in price.
We talk about the implications of options positioning mainly because it is a growing market that provides a clear indication of how participants (no matter how large) are positioned.

Also, with FOMC approaching, the “other” timeframe participant (e.g., the hedge funds and institutions behind impactful buy/sell programs) is likely awaiting policy clarity to reposition.

As Mind Over Markets author James Dalton best explained: “Market participants balance their positions in expectation of the market’s reaction to the external stimuli – there is simply no activity. Trade is not being facilitated in any direction, for there is little participation and no confidence.”
Notwithstanding, last night, we broke a multi-session balance area. Based on profile theory, a new trend may begin. Context, though, suggests otherwise.
Participants (large in size) are seeking clarity and, given the market’s responsiveness to technical levels, weaker, less well-capitalized short-term participants are in control.
Therefore, we ought to discount (give less weight to) what happens in the coming days.
If later this week, participants are assuaged of their fears surrounding monetary policy, a collapse in event-related implied volatility ought to bring in positive flows as the long delta (from dealers’ exposure to short puts) decreases.
The decrease in dealer supply (short delta), via covering of short stock/futures hedges, would bolster any attempt higher.
According to SpotGamma, if “interest in call options was to grow (evidenced by a shift higher in the Call Wall), a rally into (and beyond) end-of-year is further affirmed.”
That’s not to say that some of the vulnerabilities like participants’ large exposure to leveraged products (which increases the speed with which volatility is realized) couldn’t prompt a round of destabilizing demand for downside protection.
So, the question is whether the few companies leading this year’s rally can continue to lead?
Or, in light of recent exuberance in heavy-weights like Apple Inc (NASDAQ: AAPL), in which participants are underexposed to downside protection, post-FOMC demand for protection bids volatility and results in a destabilizing, reflexive reaction on the part of dealers.
Graphic: As U.S. stocks’ inflation-adjusted earnings yield turns negative, as seen near the peak of the tech bubble, via Bloomberg, “Investors in the Nasdaq increasingly seem to think that only a few companies have much of a chance. With a growing possibility of more aggressive attempts to prosecute antitrust issues, that’s a riskier position than it appears.”
Expectations: As of 6:30 AM ET, Tuesday’s regular session (9:30 AM – 4:00 PM ET), in the S&P 500, will likely open in the lower part of a balanced overnight inventory, outside of prior-range and -value, suggesting a potential for immediate directional opportunity.
Balance-Break + Gap Scenarios: A change in the market (i.e., the transition from two-time frame trade, or balance, to one-time frame trade, or trend) is occurring.

Monitor for acceptance (i.e., more than 1-hour of trade) outside of the balance area.

Leaving value behind on a gap-fill or failing to fill a gap (i.e., remaining outside of the prior session’s range) is a go-with indicator.

Rejection (i.e., return inside of balance) portends a move to the opposite end of the balance.
In the best case, the S&P 500 trades sideways or higher; activity above the $4,647.25 HVNode puts in play the $4,657.00 balance area low (BAL). Initiative trade beyond the BAL could reach as high as the $4,674.25 HVNode and $4,690.25 micro composite point of control (MCPOC), or higher.
In the worst case, the S&P 500 trades lower; activity below the $4,647.25 HVNode puts in play the $4,618.75 HVNode. Initiative trade beyond the latter could reach as low as the $4,581.00 and $4,523.00 untested point of control (VPOC), or lower.
Click here to load today’s key levels into the web-based TradingView charting platform. Note that all levels are derived using the 65-minute timeframe. New links are produced, daily.
Graphic: 65-minute profile chart of the Micro E-mini S&P 500 Futures. Learn about the profile.
Even those inside the Fed have shown how there is no real worthwhile evidence to believe "expectations" have any role for inflation. They are cited because, frankly, officials have nothing else to go on.
Cave-Fill Process: Widened the area deemed favorable to transact at by an increased share of participants. This is a good development.
Volume Areas: A structurally sound market will build on areas of high volume (HVNodes). Should the market trend for long periods of time, it will lack sound structure, identified as low volume areas (LVNodes). LVNodes denote directional conviction and ought to offer support on any test.
If participants were to auction and find acceptance into areas of prior low volume (LVNodes), then future discovery ought to be volatile and quick as participants look to HVNodes for favorable entry or exit.
Liquidation Breaks: The profile shape suggests participants were “too” long and had poor location.
POCs: POCs are valuable as they denote areas where two-sided trade was most prevalent in a prior day session. Participants will respond to future tests of value as they offer favorable entry and exit.
MCPOCs: POCs are valuable as they denote areas where two-sided trade was most prevalent over numerous day sessions. Participants will respond to future tests of value as they offer favorable entry and exit.
Options Expiration (OPEX): Traditionally, option expiries mark an end to pinning (i.e, the theory that market makers and institutions short options move stocks to the point where the greatest dollar value of contracts will expire) and the reduction dealer gamma exposure.
Initiative Buying (Selling): Buying (selling) within or above (below) the previous day’s value area.
Responsive Buying (Selling): Buying (selling) in response to prices below (above) an area of recent price acceptance.
Price Discovery (One-Timeframe Or Trend): Elongation and range expansion denotes a market seeking new prices to establish value, or acceptance (i.e., more than 30-minutes of trade at a particular price level).
Balance (Two-Timeframe Or Bracket): Rotational trade that denotes current prices offer favorable entry and exit. Balance-areas make it easy to spot a change in the market (i.e., the transition from two-time frame trade, or balance, to one-time frame trade, or trend).
Modus operandi is responsive trade (i.e., fade the edges), rather than initiative trade (i.e., play the break).
Excess: A proper end to price discovery; the market travels too far while advertising prices. Responsive, other-timeframe (OTF) participants aggressively enter the market, leaving tails or gaps which denote unfair prices.
Value-Area Placement: Perception of value unchanged if value overlapping (i.e., inside day). Perception of value has changed if value not overlapping (i.e., outside day). Delay trade in the former case.
About
After years of self-education, strategy development, and trial-and-error, Renato Leonard Capelj began trading full-time and founded Physik Invest to detail his methods, research, and performance in the markets.
Additionally, Capelj is a Benzinga finance and technology reporter interviewing the likes of Shark Tank’s Kevin O’Leary, JC2 Ventures’ John Chambers, and ARK Invest’s Catherine Wood, as well as a SpotGamma contributor, helping develop insights around impactful options market dynamics.
Disclaimer
At this time, Physik Invest does not carry the right to provide advice. In no way should the materials herein be construed as advice. Derivatives carry a substantial risk of loss. All content is for informational purposes only.
Overnight, most equity, commodity, and bond futures were higher.
This comes ahead of the weighty December 17 options and futures expiration – “quad witching” – large portfolio rebalances, and an update to Federal Reserve (Fed) policy, December 15.
Ahead, today, there are no key economic releases scheduled.
Graphic updated 6:15 AM ET. Sentiment Risk-On if expected /ES open is above the prior day’s range. /ES levels are derived from the profile graphic at the bottom of the following section. Levels may have changed since initially quoted; click here for the latest levels. SqueezeMetrics Dark Pool Index (DIX) and Gamma (GEX) calculations are based on where the prior day’s reading falls with respect to the MAX and MIN of all occurrences available. A higher DIX is bullish. At the same time, the lower the GEX, the more (expected) volatility. Learn the implications of volatility, direction, and moneyness. SHIFT data used for S&P 500 (INDEX: SPX) options activity. Note that options flow is sorted by the call premium spent; if more positive then more was spent on call options. Breadth reflects a reading of the prior day’s NYSE Advance/Decline indicator. VIX reflects a current reading of the CBOE Volatility Index (INDEX: VIX) from 0-100.
What To Expect
On lackluster breadth and supportive market liquidity metrics, the best case outcome occurred, evidenced by an expansion of range, Friday, followed by a gap out of balance, Sunday.
Graphic: SpotGamma’s (beta) Hedging Impact of Real-Time Options (HIRO) indicator suggested participants were buying (or covering short) calls and selling put options, into the close. S&P 500 prices followed as dealers added to their long-delta hedges.
Context: As fears of a COVID-19 resurgence are assuaged, in the face of U.S. job growth that fell short of expectations, per Bloomberg, the Fed ought to move more quickly to “save itself from having to hike too far and make rates so expensive that they slow down the economy.”
The expectation is that the Fed scales asset purchases by $30 billion per month versus the expected $15 billion. In doubling the pace of the taper to bond-buying, the odds of a rate hike happening as early as next June increase markedly.
“If the Fed does not address inflation soon, they risk long rates shooting much higher,” says Jim Bianco of Bianco Research.

“But if they follow the market’s lead in aggressively hiking rates, they risk hurting the economy. We understand the Fed’s paralysis given the massive uncertainty coming out of the pandemic. However, the longer they wait to address inflation, the worse this conundrum will become.”
Rising rates, among other factors, have the potential to decrease the present value of future earnings, thereby making stocks, especially those that are high growth, less attractive.
Despite today’s rates supporting validations better than in the ‘90s, an intent to reduce stimulus serves as a headwind.
That said, equity markets typically rally into the first hike; Moody’s Corporation’s (NYSE: MCO) “forecast is that the Dow Jones Industrial Average increases this quarter and peaks in early 2022, … [followed by] steady decline through 2022.”
Graphic: S&P 500 performance before and after rate hikes, via The Market Ear.
Prevailing monetary frameworks and max liquidity promoted a large divergence in price from fundamentals; the growth of passive investing – the effect of increased moneyness among nonmonetary assets – and derivatives trading imply a lot of left-tail risks.
Graphic: As U.S. stocks’ inflation-adjusted earnings yield turns negative, as seen near the peak of the tech bubble, via Bloomberg, “Investors in the Nasdaq increasingly seem to think that only a few companies have much of a chance. With a growing possibility of more aggressive attempts to prosecute antitrust issues, that’s a riskier position than it appears.”
Adding, the Fed, too, is seeing vulnerabilities in asset prices.
“The decline in stock prices is forecast to be orderly but it could turn into something worse,” Moody’s explains.
“One potential catalyst would be an explosion in the value of margin accounts at brokers and dealers, which amounted to $595 billion in the second quarter, nearly double the pre-pandemic level. A drop in stock prices could trigger margin calls.”
Margin calls happen when customers owe money to their brokerage firm; “If there is no money, investors have to sell other assets.”
Putting it simply, participants are more exposed to leveraged products, among other things, which increases the speed with which volatility is realized.
So despite positioning metrics flashing a buy, and expectations of “the strongest quarterly nominal [economic] growth in more than three decades,” offsides positioning may prompt a cascading reaction that exacerbates underlying price movements.
Short-term, however, aside from the presence of “natural, passive buying support,” the market is in a positive-gamma environment wherein the counterparties to customer options trades add market liquidity and temper realized volatility.
Graphic: “[N]atural, passive buying support,” coupled with strong put flows results in positive return distribution. Data via SqueezeMetrics. Graph via Physik Invest.
If participants are further assuaged of their fears at this week’s Federal Open Market Committee (FOMC) meeting, a collapse in event-related implied volatility ought to bring in positive flows as the long delta (from dealers’ exposure to short puts) decreases.
The decrease in dealer supply (short delta), via covering of short stock/futures hedges, would bolster any attempt higher.
470 $SPY is the dominate strike into FOMC. >40% of total S&P gamma goes away Friday.
Expectations: As of 6:15 AM ET, Monday’s regular session (9:30 AM – 4:00 PM ET), in the S&P 500, will likely open in the upper part of a positively skewed overnight inventory, outside of prior-range and -value, suggesting a potential for immediate directional opportunity.
Balance-Break + Gap Scenarios: A change in the market (i.e., the transition from two-time frame trade, or balance, to one-time frame trade, or trend) is occurring.

Monitor for acceptance (i.e., more than 1-hour of trade) outside of the balance area.

Leaving value behind on a gap-fill or failing to fill a gap (i.e., remaining outside of the prior session’s range) is a go-with indicator.

Rejection (i.e., return inside of balance) portends a move to the opposite end of the balance.
In the best case, the S&P 500 trades sideways or higher; activity above the $4,717.25 low volume area (LVNode) puts in play the $4,732.50 high volume area (HVNode). Initiative trade beyond the HVNode could reach as high as the $4,740.50 minimal excess and $4,767.00 extension, or higher.
In the worst case, the S&P 500 trades lower; activity below the $4,717.25 LVNode puts in play the $4,705.25 LVNode. Initiative trade beyond the LVNode could reach as low as the $4,690.25 MCPOC and $4,674.25 HVNode, or lower.
Click here to load today’s key levels into the web-based TradingView charting platform. Note that all levels are derived using the 65-minute timeframe. New links are produced, daily.
Graphic: 65-minute profile chart of the Micro E-mini S&P 500 Futures. Learn about the profile.
What People Are Saying
I will always be a trader,I’m challenged everyday to be the best possible version of myself. That’s my focus. When my focus was strictly money it was never enough. Know what # you need to be financially independent, always work to be the best version of yourself.
Volume Areas: A structurally sound market will build on areas of high volume (HVNodes). Should the market trend for long periods of time, it will lack sound structure, identified as low volume areas (LVNodes). LVNodes denote directional conviction and ought to offer support on any test.
If participants were to auction and find acceptance into areas of prior low volume (LVNodes), then future discovery ought to be volatile and quick as participants look to HVNodes for favorable entry or exit.
POCs: POCs are valuable as they denote areas where two-sided trade was most prevalent in a prior day session. Participants will respond to future tests of value as they offer favorable entry and exit.
MCPOCs: POCs are valuable as they denote areas where two-sided trade was most prevalent over numerous day sessions. Participants will respond to future tests of value as they offer favorable entry and exit.
Excess: A proper end to price discovery; the market travels too far while advertising prices. Responsive, other-timeframe (OTF) participants aggressively enter the market, leaving tails or gaps which denote unfair prices.
About
After years of self-education, strategy development, and trial-and-error, Renato Leonard Capelj began trading full-time and founded Physik Invest to detail his methods, research, and performance in the markets.
Additionally, Capelj is a Benzinga finance and technology reporter interviewing the likes of Shark Tank’s Kevin O’Leary, JC2 Ventures’ John Chambers, and ARK Invest’s Catherine Wood, as well as a SpotGamma contributor, helping develop insights around impactful options market dynamics.
Disclaimer
At this time, Physik Invest does not carry the right to provide advice. In no way should the materials herein be construed as advice. Derivatives carry a substantial risk of loss. All content is for informational purposes only.