Editor’s Note: The Daily Brief is a free glimpse into the prevailing fundamental and technical drivers of U.S. equity market products. Join the 200+ that read this report daily, below!
Equity index futures rebound after exploring prices below Monday’s close. Most commodity products, alongside measures of implied volatility, remain bid.
The overnight response higher came as the European Union announced it was considering joint bond sales to assist in the fiscal fallout from Russia’s invasion of Ukraine.
Still, at home in the U.S., policymakers are looking to rein in inflation and apply contractionary monetary policy whilst inflation remains heightened and economic growth is slowing.
As noted in prior commentaries, in spite of continued (albeit lightly cooled) passive buying support, the equity markets are prone to continued weakness. We add to this narrative, below.
Ahead is data on the foreign trade deficit (8:30 AM ET) and wholesale inventories (10:00 AM ET).
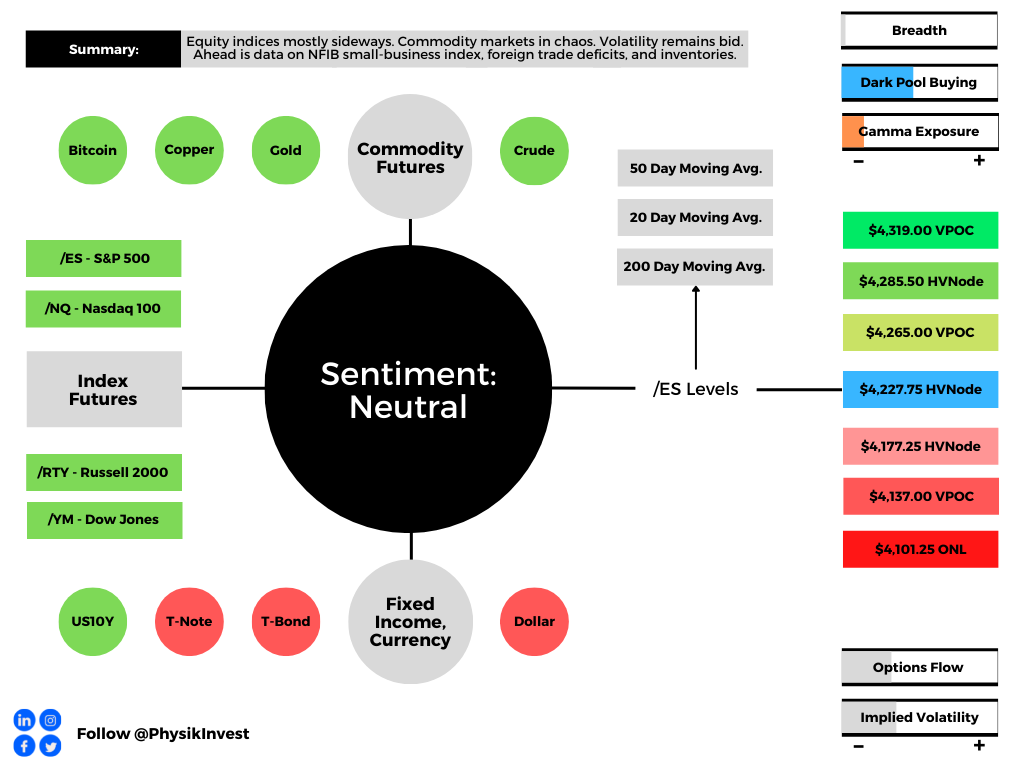
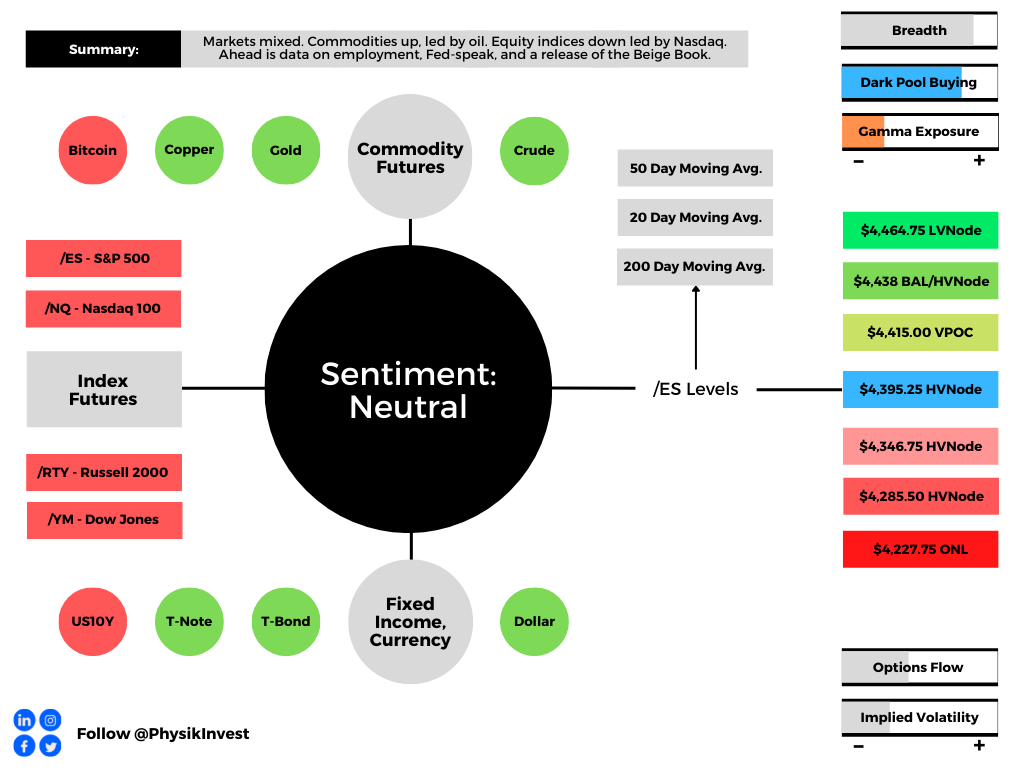
Graphic updated 6:40 AM ET. Sentiment Neutral if expected /ES open is inside of the prior day’s range. /ES levels are derived from the profile graphic at the bottom of the following section. Levels may have changed since initially quoted; click here for the latest levels. SqueezeMetrics Dark Pool Index (DIX) and Gamma (GEX) calculations are based on where the prior day’s reading falls with respect to the MAX and MIN of all occurrences available. A higher DIX is bullish. At the same time, the lower the GEX, the more (expected) volatility. Learn the implications of volatility, direction, and moneyness. SHIFT data used for S&P 500 (INDEX: SPX) options activity. Note that options flow is sorted by the call premium spent; if more positive, then more was spent on call options. Breadth reflects a reading of the prior day’s NYSE Advance/Decline indicator. VIX reflects a current reading of the CBOE Volatility Index (INDEX: VIX) from 0-100.
What To Expect
Fundamental: Shortened note, today.
The prevailing narrative is concerned with the slowdown in economic growth, the intent to withdraw monetary stimulus, and the response to Russia’s invasion of Ukraine.
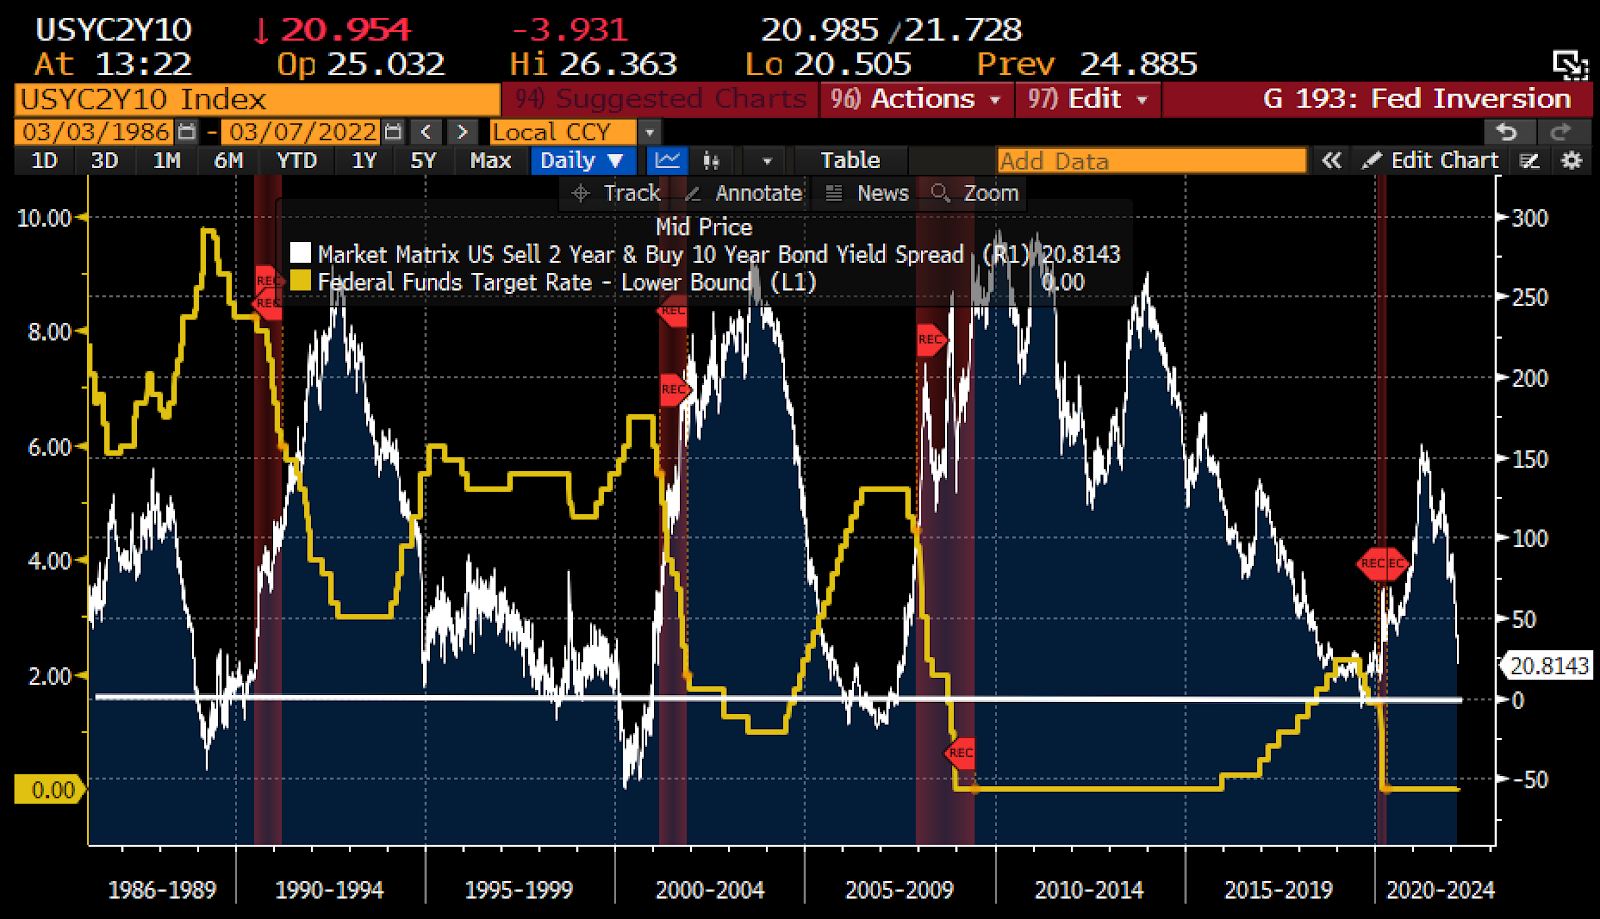
Graphic: Via @TheBondFreak. Per Bloomberg, “The gap between two-year and 10-year Treasury yields is around the narrowest since March 2020, a sign of expectations of slowing economic expansion.”
Heading into this week, broad-based indexes in the U.S. were weak but steady; fixed income, commodity, and equity markets abroad traded more volatile in comparison.
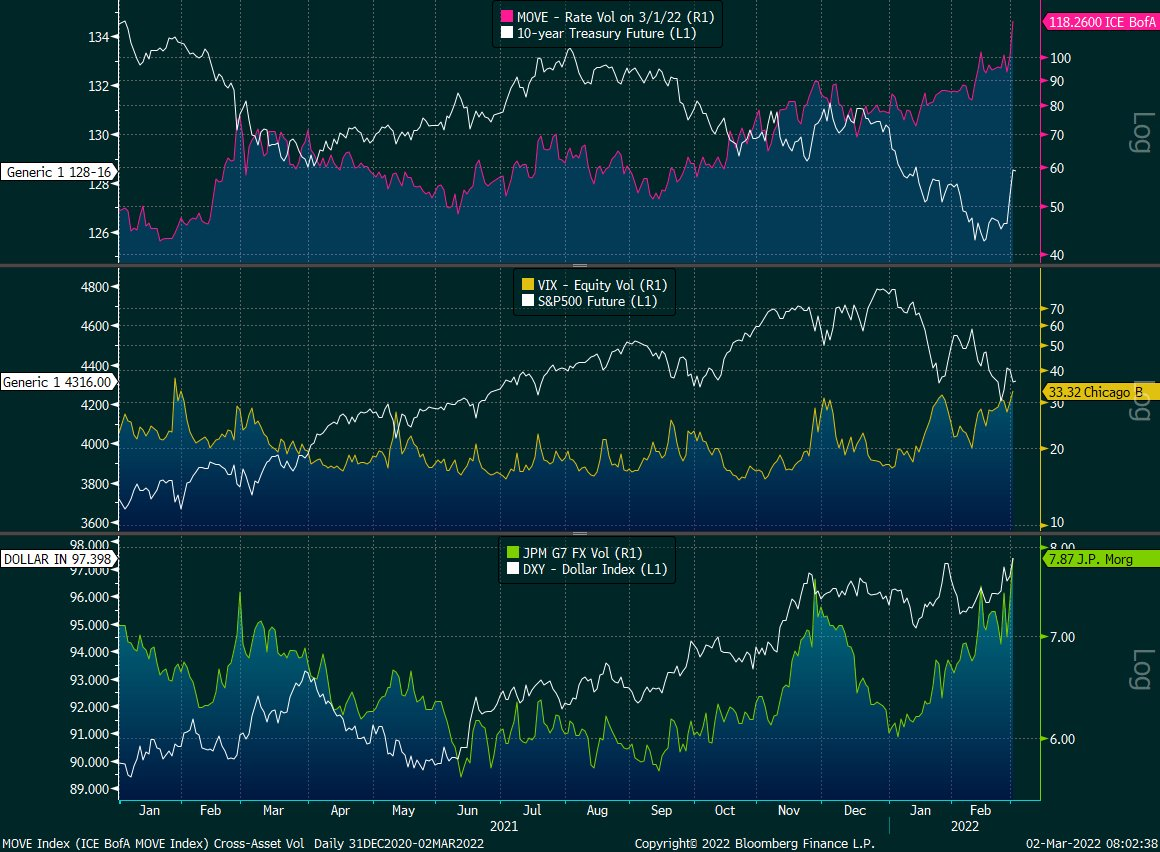
Graphic: Via @EffMktHype. “Rate vol through the roof, FX picking up steam while equity vol arguably still cheap in comparison despite being at the high end of its 1-year end.”
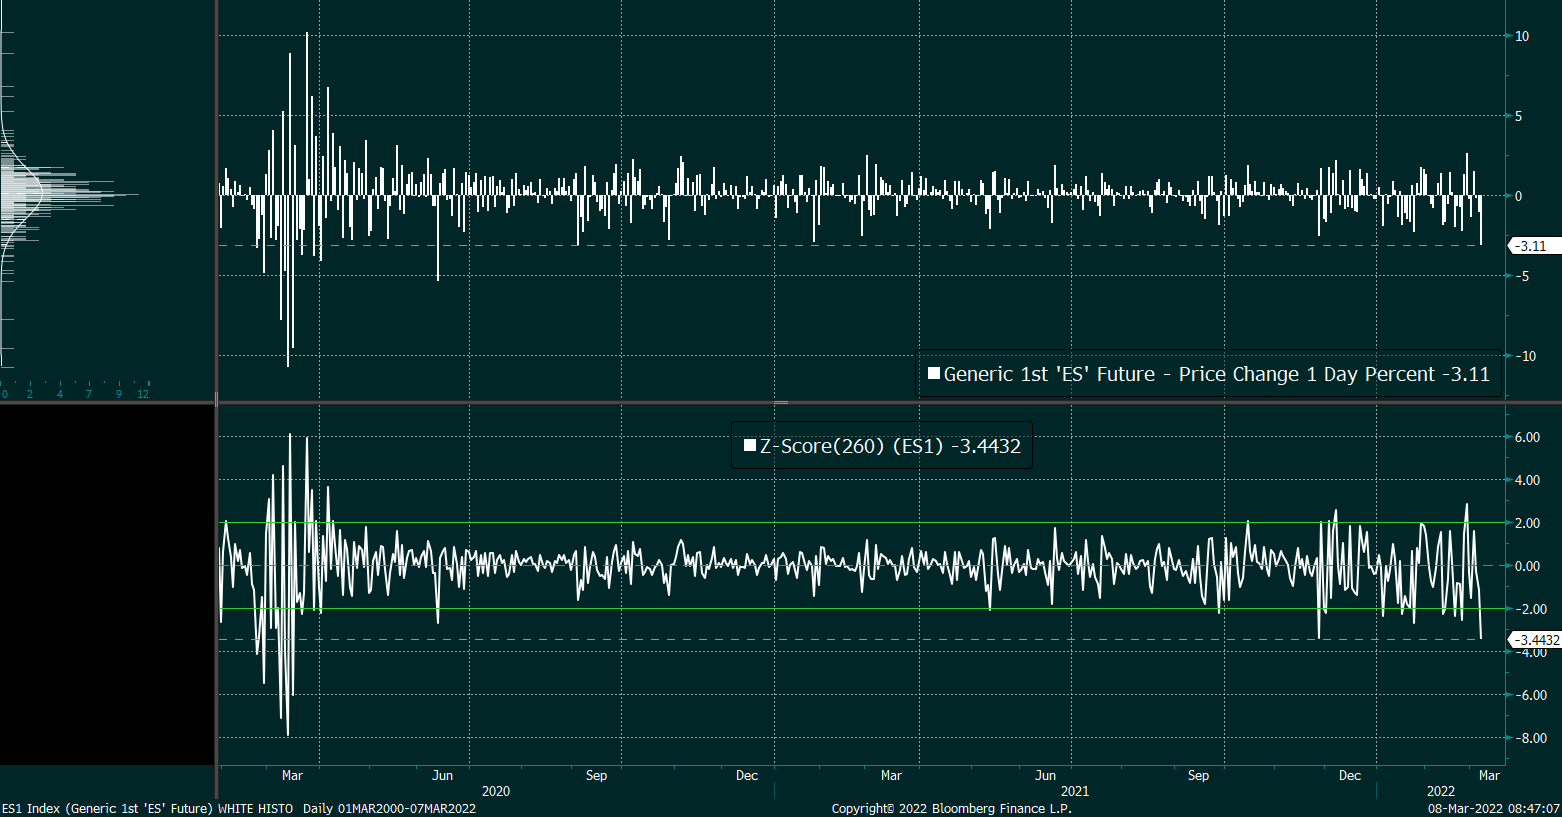
The tone changed, slightly, yesterday, after the S&P 500 pushed the lower bound of price changes it has logged since 2020.
Still, it is likely that participants have yet to witness a climactic de-leveraging; in part, what is supporting the market (as described in detail before, here) is passive buying support and the supply of liquidity, at the index level.
At the single-stock level, the de-rate in anticipation of slowing growth Fed tightening has mostly played its course. At the index level, there are signs of more room to go.
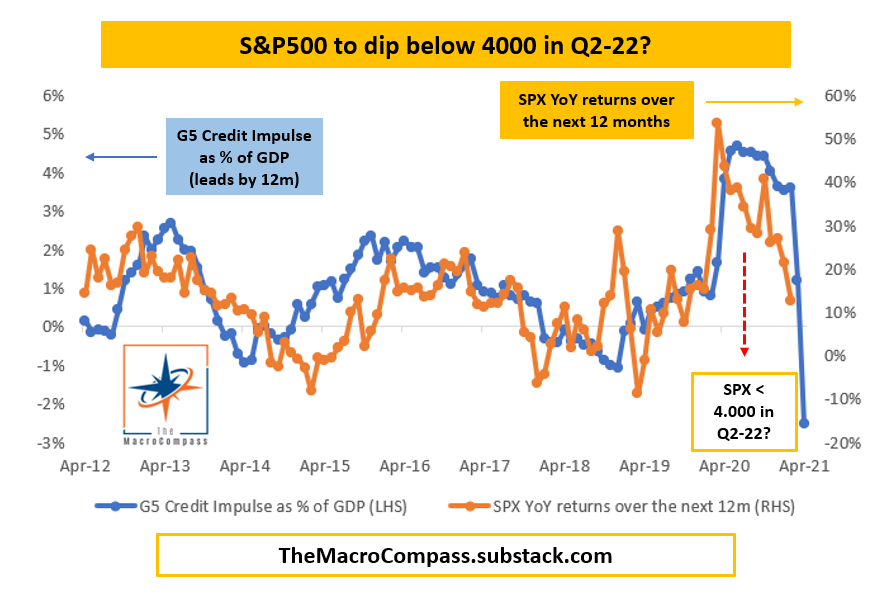
Graphic: Alfonso Peccatiello of The Macro Compass. He says “YTD: 2022 hikes priced in up from 3 to 6-7. Curves big-time flatter. Inflation expectations 10 bps lower. Real yields higher 40-50 bps. Credit spreads wider. Cyclical growth impulse fading away. Not a risk-on environment.”
This is “[v]ery resemblant of prior market events,” The Ambrus Group’s Kris Sidial explained in a reference to extreme events in markets having a higher likelihood of becoming more extreme.
“Just when you think ‘this is the top/ bottom’ it puts in another massive leg that makes everyone go ‘oh sh*t’.”
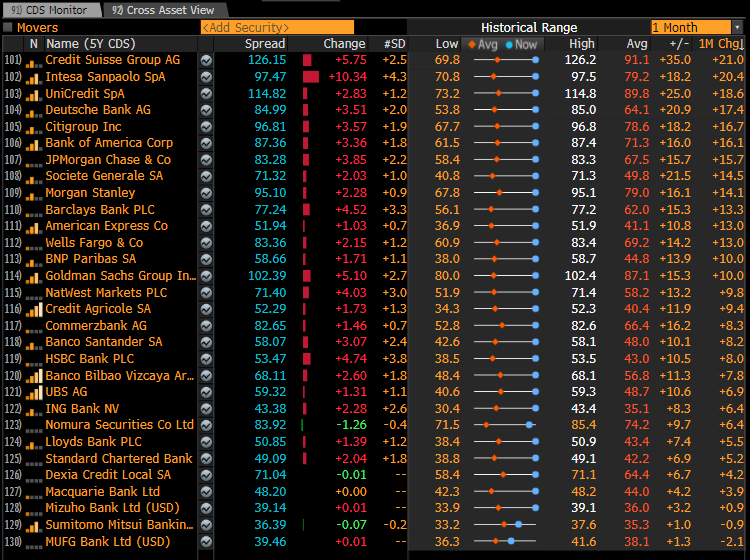
Graphic: Via @AnalystDC. A credit default swap will compensate buyers in the event of debt default. CDS spreads rise for record stretch in light of geopolitical tensions.
Positioning: At present, in the face of continued passive buying support, the overwhelming demand for downside (put) protection (a negative delta, positive gamma trade) results in counterparty hedging that may exacerbate weakness.
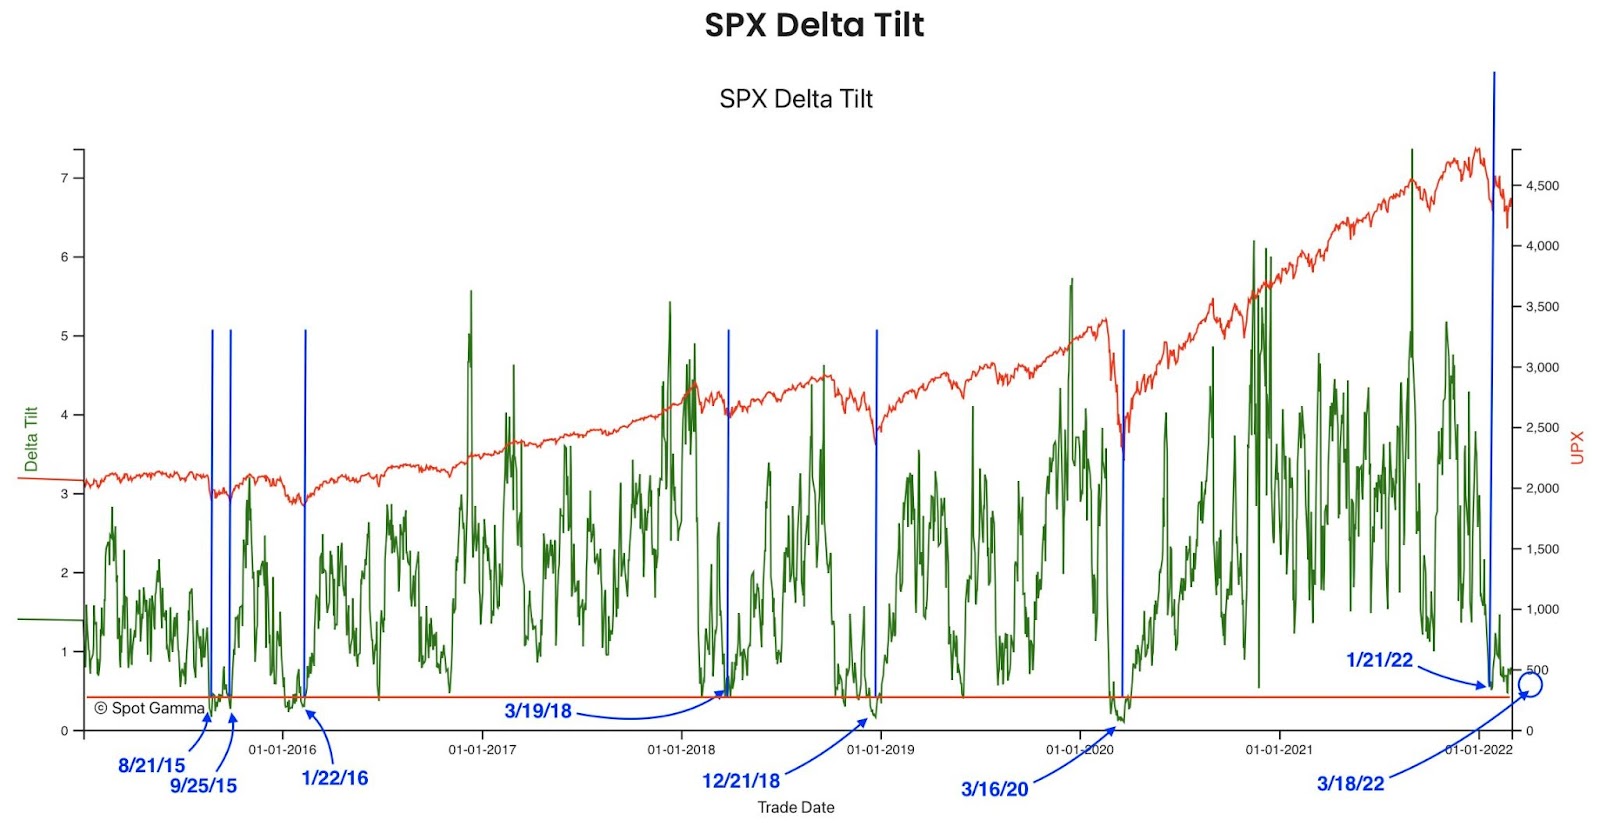
Graphic: Via SpotGamma. “Netting call & put delta, you can see we’re near extremes in terms of put:call positions. Often large put positions are removed by expirations, which seems to coincide with market lows. Many of these are quarterly expirations which coincide w/FOMC meetings – such as next week.”
The reason why? The counterparty has exposure to positive delta and negative gamma. If underlying prices print lower and/or measures of implied volatility rise (given increased fear and demand for protection), short puts rise in value (and counterparty losses are multiplied).
To overcome these potential losses, counterparties sell the underlying to hedge. If nothing happens, the protection decays, and counterparties buy back their hedges potentially bolstering the underlying market’s calmness or attempts higher.
In the coming week, participants will gain clarity with respect to the Federal Reserve’s intent to tighten. Closely after, there is a monthly options expiration (OPEX).
The compression in volatility post-FOMC, coupled with a reduction in put-heavy positioning post-OPEX, could help support markets.
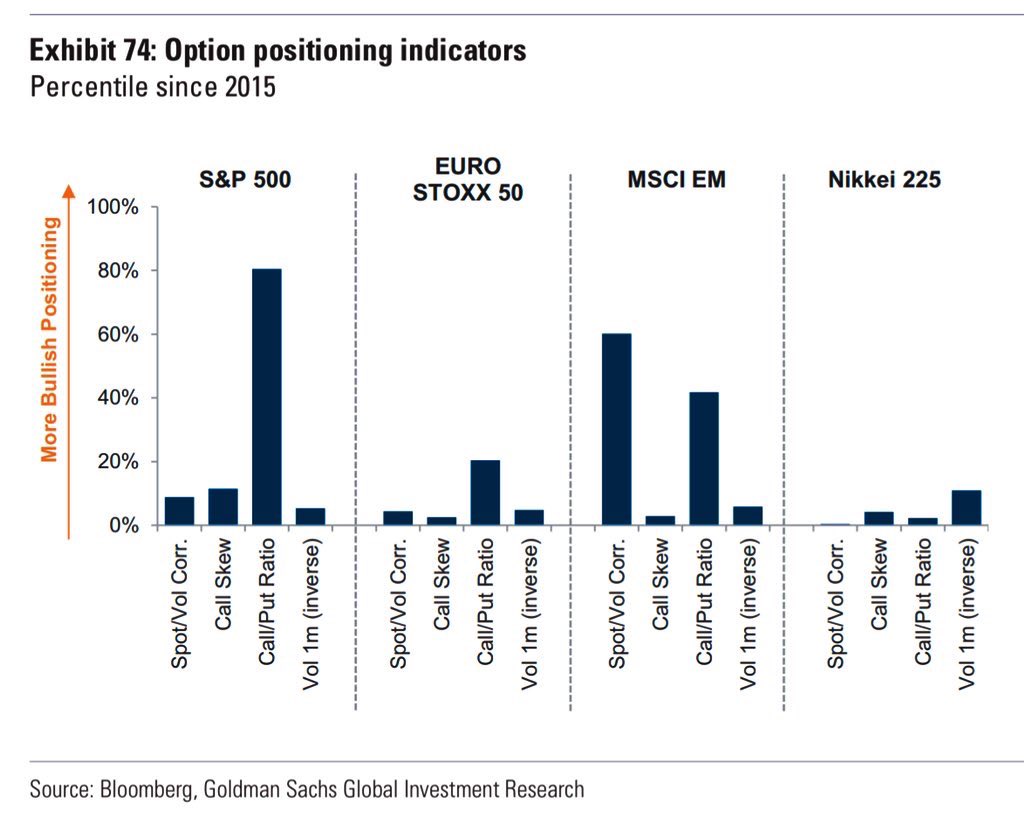
Interested in more about options and unique structures that may assist with navigating current volatility, check out this volatility trading primer by Santander.
Graphic: Via Goldman Sachs Group Inc (NYSE: GS).
Technical: As of 6:40 AM ET, Tuesday’s regular session (9:30 AM – 4:00 PM ET), in the S&P 500, will likely open in the top part of a balanced overnight inventory, inside of prior-range and -value, suggesting a limited potential for immediate directional opportunity.
In the best case, the S&P 500 trades higher; activity above the $4,227.25 high volume area (HVNode) puts in play the $4,265.00 untested point of control (VPOC). Initiative trade beyond the VPOC could reach as high as the $4,285.50 HVNode and $4,319.00 VPOC, or higher.
In the worst case, the S&P 500 trades lower; activity below the $4,227.75 HVNode puts in play the $4,177.25 HVNode. Initiative trade beyond the latter HVNode could reach as low as the $4,137.00 VPOC and $4,101.25 ONL, or lower.
Click here to load today’s key levels into the web-based TradingView charting platform. Note that all levels are derived using the 65-minute timeframe. New links are produced, daily.
Graphic: 65-minute profile chart of the Micro E-mini S&P 500 Futures.
Definitions
Overnight Rally Highs (Lows): Typically, there is a low historical probability associated with overnight rally-highs (lows) ending the upside (downside) discovery process.
Volume Areas: A structurally sound market will build on areas of high volume (HVNodes). Should the market trend for long periods of time, it will lack sound structure, identified as low volume areas (LVNodes). LVNodes denote directional conviction and ought to offer support on any test.
If participants were to auction and find acceptance into areas of prior low volume (LVNodes), then future discovery ought to be volatile and quick as participants look to HVNodes for favorable entry or exit.
POCs: POCs are valuable as they denote areas where two-sided trade was most prevalent in a prior day session. Participants will respond to future tests of value as they offer favorable entry and exit.
About
After years of self-education, strategy development, mentorship, and trial-and-error, Renato Leonard Capelj began trading full-time and founded Physik Invest to detail his methods, research, and performance in the markets.
Capelj is also a Benzinga finance and technology reporter interviewing the likes of Shark Tank’s Kevin O’Leary, JC2 Ventures’ John Chambers, FTX’s Sam Bankman-Fried, and ARK Invest’s Catherine Wood, as well as a SpotGamma contributor developing insights around impactful options market dynamics.
Disclaimer
Physik Invest does not carry the right to provide advice.
In no way should the materials herein be construed as advice. Derivatives carry a substantial risk of loss. All content is for informational purposes only.
Editor Note: In light of travel commitments, there will be no Daily Brief published tomorrow, March 4, 2022. Thank you for the support and see you next week!
Overnight, equity index futures were sideways to lower while commodity and bond products remained bid. Cross-asset volatility measures remain heightened in the face of uncertainties with respect to geopolitical tensions and monetary policy action.
To note, in light of the economic war waged on Russia, participants received positive news from Federal Reserve Chair Jerome Powell who ruled out a 50 basis-point hike.
Moreover, ahead is data on jobless claims, productivity, labor costs (8:30 AM ET), ISM services, factory orders, core capital equipment orders, and Fed-speak by Jerome Powell (10:00 AM ET), as well as John Williams (6:00 PM ET).
Graphic updated 6:30 AM ET. Sentiment Neutral if expected /ES open is inside of the prior day’s range. /ES levels are derived from the profile graphic at the bottom of the following section. Levels may have changed since initially quoted; click here for the latest levels. SqueezeMetrics Dark Pool Index (DIX) and Gamma (GEX) calculations are based on where the prior day’s reading falls with respect to the MAX and MIN of all occurrences available. A higher DIX is bullish. At the same time, the lower the GEX, the more (expected) volatility. Learn the implications of volatility, direction, and moneyness. SHIFT data used for S&P 500 (INDEX: SPX) options activity. Note that options flow is sorted by the call premium spent; if more positive, then more was spent on call options. Breadth reflects a reading of the prior day’s NYSE Advance/Decline indicator. VIX reflects a current reading of the CBOE Volatility Index (INDEX: VIX) from 0-100.
What To Expect
Positioning: Skipping the fundamentals section and will follow up on (and add to) some notes established in Wednesday’s commentary.
Mainly, cross-asset volatility is spiking as investors are seeking protection against the uncertainties posed by geopolitical tensions and monetary policy action.
Graphic: Via @EffMktHype. “Rate vol through the roof, FX picking up steam while equity vol arguably still cheap in comparison despite being at the high end of its 1-year end.”
As explained, however, the equity market’s pricing of risk (which we can take as being reflected by the CBOE Volatility Index [INDEX: VIX]) is not moving lock-step with that of measures in FX and rate markets.
“The fear in one market tends to feed into the fear of another; regardless of the cause, it seems that equity and bond market participants are not (quite) on the same page,” is the direct quote.
In the subsequent text, I did little to mention the implications of liquidity supply at the index level. This realization came to me while writing some commentary for SpotGamma (who just launched its Hedging-Impact of Real-Time Options indicator or HIRO).
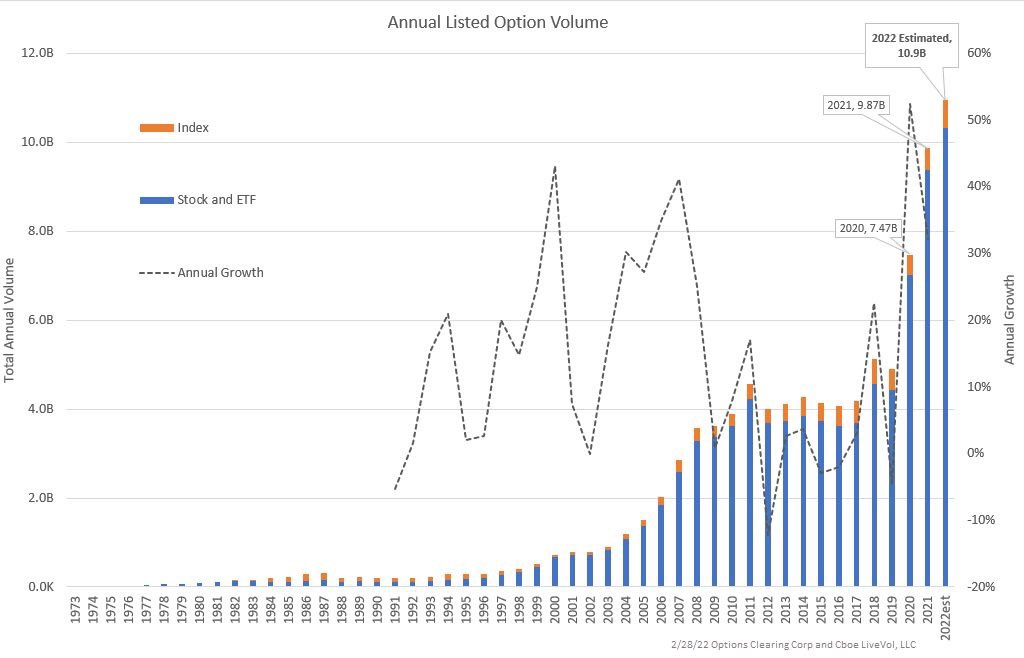
Moreover, the evolving monetary frameworks and intention to take from the max liquidity – which pushed participants out of the risk curve and promoted a divergence from fundamentals – has the effect of removing market excesses that have found their way into volatility markets.
Graphic: Taken from The Ambrus Group’s Kris Sidial. Annual listed option volumes.
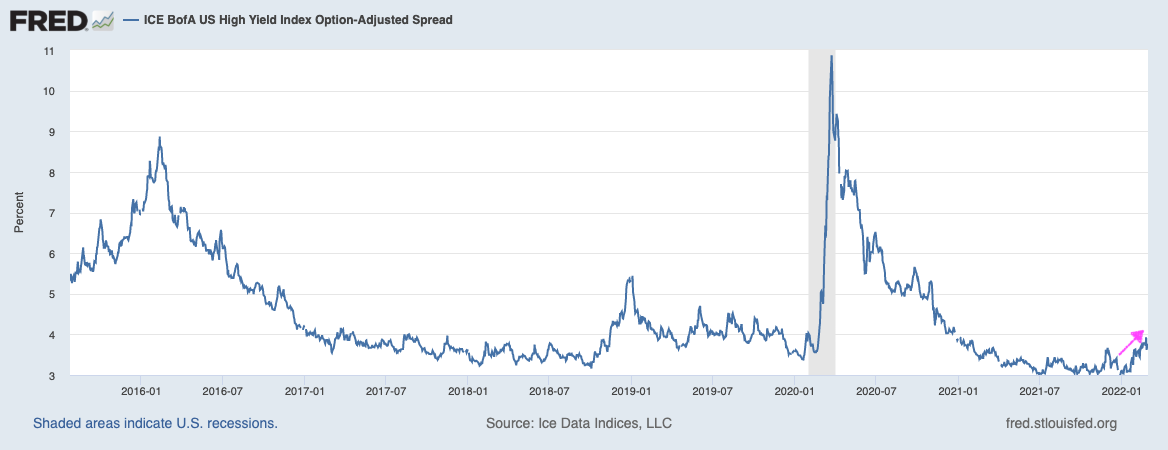
Taking a look at the U.S. high yield OAS (option-adjusted spread), participants see a “risk-off” bottom; deteriorating credit conditions are a bearish leading indicator and that’s likely been reflected by the bond market’s pricing of risk (but not equity markets, as noted above).
Tempering equity market volatility is likely supply, particularly at the index level, whereas elsewhere, at the single-stock level, underlying components are volatile.
As explained in the SpotGamma note: “We’re using the VIX as a proxy for equity market volatility while underlying components are actually very volatile.”
“There is a decline in correlation, and this is due to suppressive counterparty hedging of the most dominant customer positioning.”
The dominant positioning at the index level is best explained as follows:
Customers have positive directional (delta) exposure to the equity markets.
The indexes (in which there are tax advantages, cash-settlement, among other things) provide participants exposure to a diversified and liquid hedge, easy to get in and out of.
To hedge positive delta exposure against drops, customers will purchase downside put protection. Puts carry a negative delta and their gains are multiplied to the downside (positive gamma).
To reduce the cost of this hedge, they sell upside call protection (also a negative delta trade). This “offset” so to speak can be initiated as a ratio to the protection carried on the downside (e.g., 2 calls for 1 put, and so on), and this feeds into skewness, also.
Options counterparties, who are on the other side of this customer activity, have positive exposure to direction.
In selling a put, the dealer has positive exposure to the direction (meaning the position makes money, all else equal, with trade higher), but their losses are multiplied with movement to the downside (negative gamma).
To hedge this put exposure, all else equal, they must sell into weakness and buy strength.
On the call side, however, the counterparty has positive exposure to delta and gamma (meaning gains are multiplied to the upside).
To hedge this call exposure, all else equal, they must buy into weakness and sell strength.
When, in the normal course of action, protection decays (given that time and volatility trend to zero), counterparty positive delta exposure decreases.
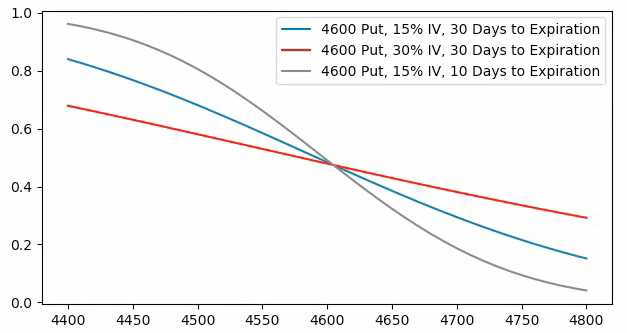
Graphic: Via SpotGamma. “SPX prices X-axis. Option delta Y-axis. When the factors of implied volatility and time change, hedging ratios change. For instance, if SPX is at $4,700.00 and IV jumps 15% (all else equal), the dealer may sell an additional 0.2 deltas to hedge their exposure to the addition of a positive 0.2 delta. The graphic is for illustrational purposes, only.”
This solicits the buy-back of short futures hedges (static negative delta against dynamic positive delta options exposure) that can support the market.
As we’ve seen, a feature of falling markets is the demand for protection. When this protection is monetized (or decay ensues), options counterparties add to the market liquidity (i.e., buying back short futures hedges).
A feature of rising markets is the supply of protection (and more active hedging of call options).
Further, as markets rise, volatility falls. Participants’ demand for yield drives participants further out the risk curve (i.e., they sell more volatility) and this can solicit even more supply.
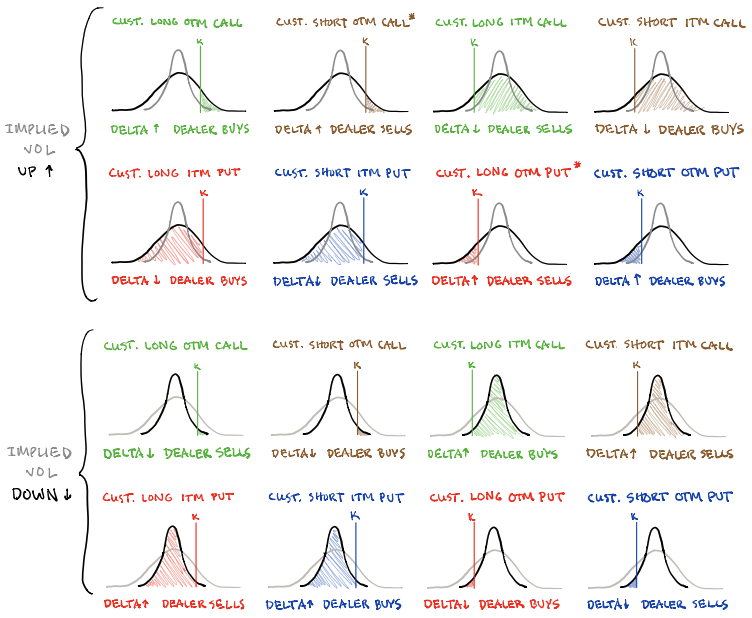
Pictured: SqueezeMetrics highlights implications of volatility, direction, and moneyness.
As explained in the SpotGamma note: “The counterparty is left carrying more positive exposure to delta and gamma (meaning gains are multiplied to the upside). As time and volatility trend to zero, the sensitivity of these options to underlying price (gamma) increases.”
“When gamma increases, counterparties add more liquidity (i.e., sell [buy] more into strength [weakness] against increasing [decreasing] positive delta exposure).”
Amidst this most recent leg higher, volatility has fallen (some) and the heavily-demanded put protection amidst earlier trade lower has solicited decreased hedging. The buyback of hedges has bolstered sideways to higher trade.
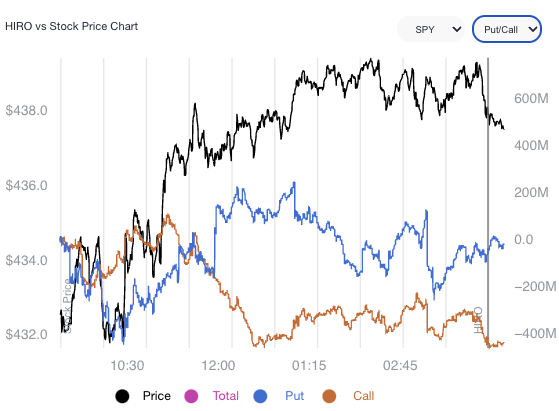
Pursuant to that remark, however, participants are still adding to their negative delta options exposure. They’re doing this via call sales (downward sloping HIRO line, below).
Graphic: SpotGamma’s Hedging Impact of Real-Time Options (HIRO) indicator.
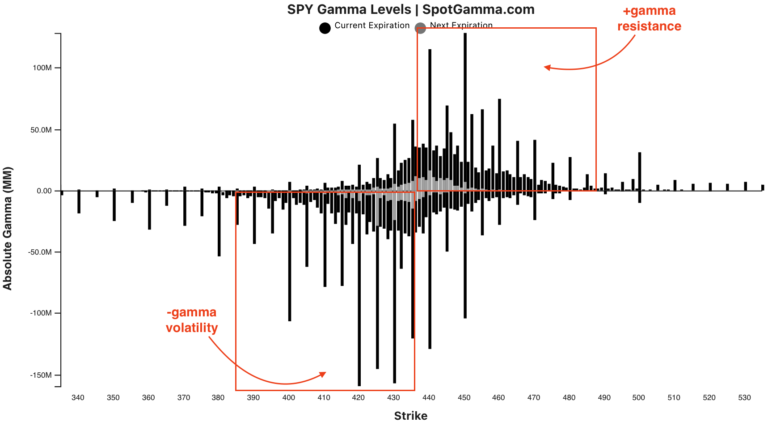
Moreover, given the build in open interest in options at higher strike prices – through naive assumptions and data collected from HIRO, among other measures – we surmise options counterparties are tending to add to the market liquidity and this is stabilizing.
Graphic: Updated 3/2/2022. There is rising interest in options at higher strike prices.
“As the highly-demanded put protection decays, dealers have less exposure to positive delta. To re-hedge this, dealers buy back (cover) existing short (negative-delta) futures hedges,” SpotGamma further explains. “At the same time, as markets trend higher, … the additional interest in options participants supplied on the call side solicits increased hedging.”
From above, we surmise counterparties are long and therefore tend to sell (buy) into strength amid increasing (decreasing) positive delta exposure.
As short-dated activity clusters in the area just north of the most recent week-long consolidation area, and this protection decays, dealer exposure to positive delta (gamma) falls (rises).
0DTE Incites volatility
In the final 20 minutes of trading the S&P rallied >1%.
Here we've plotted the 2/28 SPY options contract volume. You can see the massive spike in today's expiration volume as 0DTE vampires get pushed offsides. pic.twitter.com/Mlc2MmlKKC
“Taken together, dealers add to the market liquidity. When there is rising liquidity, volatility (a measure of how ample liquidity is) falls.”
It is options market activity and associated hedging – the supply of liquidity – that’s tempering equity market volatility relative to that of rates and FX.
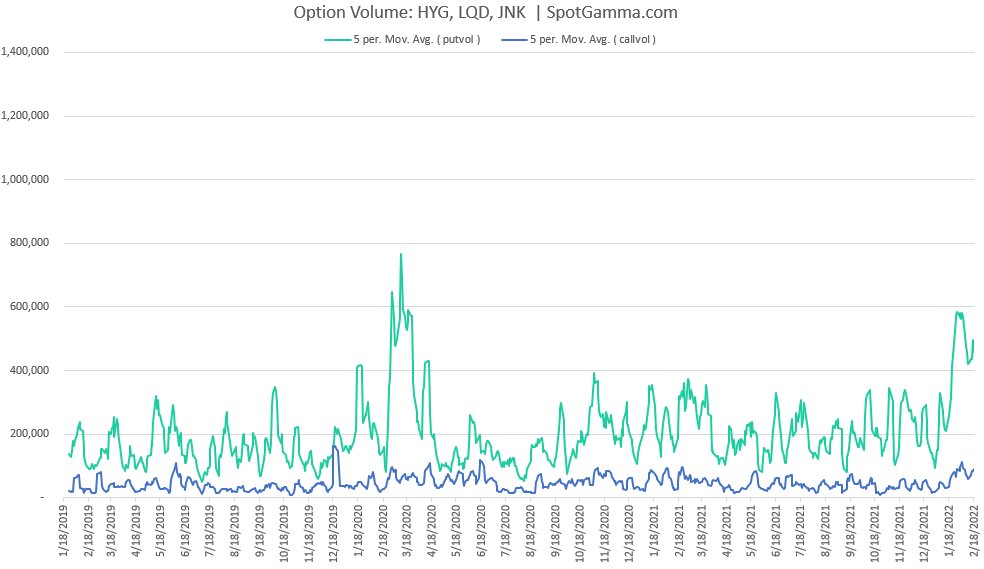
We have not seen moves in European bond markets like these since the the Euro-crisis (2011-2012), and there are few episodes like this in general (ERM crisis 1992, GFC 2008)
Graphic: Via SpotGamma. “There’s been a big pop in put volumes for the higher yield bond ETFs: JNK, HYG, and LQD. This syncs with the idea this sell-off is based mainly on rates with a side of geopolitics.”
Hope that better explains index-level volatility and the decline in correlation by constituents.
Still be careful out there.
The Nasdaq, S&P 500 and DJIA are all still below their respective 200d ma.
Nearly 80% of Nasdaq stocks are below their 200d ma.
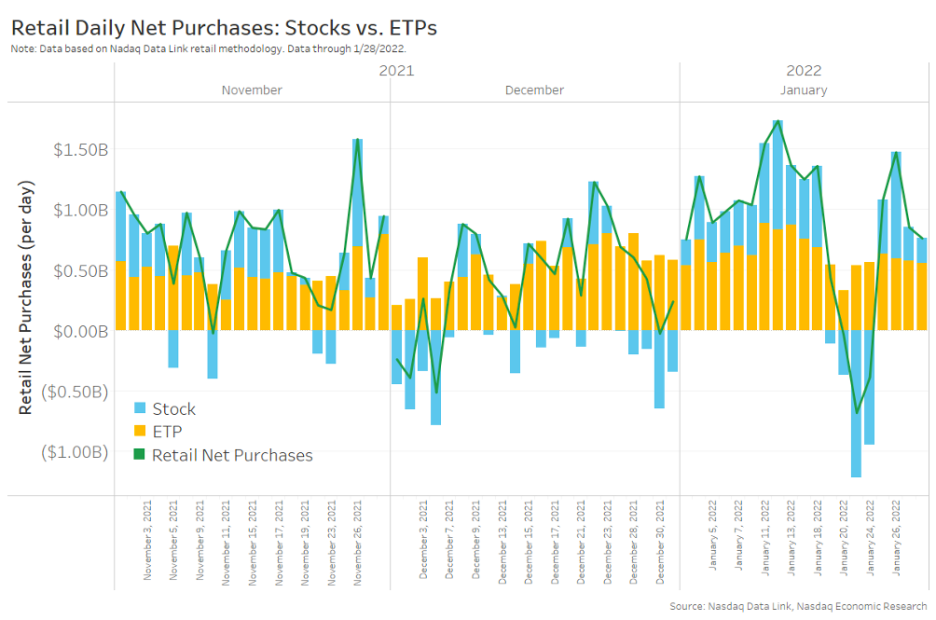
As an aside, these forces are, too, amplified by the general trend toward “passive” investing. This is a topic for another time, though.
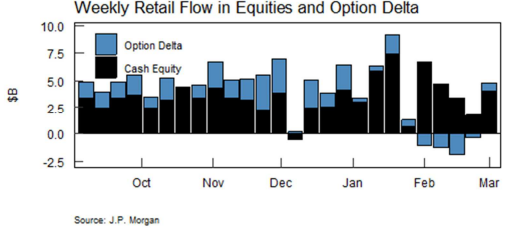
Graphic: Per Nasdaq, “we’ve seen patches of retail selling of stocks that have mostly lasted for less than a week (blue bars in Chart 2). Interestingly, ETFs (yellow bars) remained net buy every single day, albeit at lower levels than usual in the last week of January.”
Technical: As of 6:30 AM ET, Thursday’s regular session (9:30 AM – 4:00 PM ET), in the S&P 500, will likely open in the middle part of a balanced overnight inventory, inside of prior-range and -value, suggesting a limited potential for immediate directional opportunity.
Balance (Two-Timeframe Or Bracket): Rotational trade that denotes current prices offer favorable entry and exit. Balance-areas make it easy to spot a change in the market (i.e., the transition from two-time frame trade, or balance, to one-time frame trade, or trend).

Modus operandi is responsive trade (i.e., fade the edges), rather than initiative trade (i.e., play the break).
In the best case, the S&P 500 trades higher; activity above the $4,395.25 high volume area (HVNode) puts in play the $4,415.00 untested point of control (VPOC). Initiative trade beyond the VPOC could reach as high as the $4,438.00 key response area and $4,464.75 low volume area (LVNode), or higher.
In the worst case, the S&P 500 trades lower; activity below the $4,395.25 HVNode puts in play the $4,346.75 HVNode. Initiative trade beyond the $4,346.75 could reach as low as the $4,285.50 HVNode and $4,227.75 overnight low (ONL), or lower.
Click here to load today’s key levels into the web-based TradingView charting platform. Note that all levels are derived using the 65-minute timeframe. New links are produced, daily.
Graphic: 65-minute profile chart of the Micro E-mini S&P 500 Futures.
Definitions
Volume Areas: A structurally sound market will build on areas of high volume (HVNodes). Should the market trend for long periods of time, it will lack sound structure, identified as low volume areas (LVNodes). LVNodes denote directional conviction and ought to offer support on any test.
If participants were to auction and find acceptance into areas of prior low volume (LVNodes), then future discovery ought to be volatile and quick as participants look to HVNodes for favorable entry or exit.
POCs: POCs are valuable as they denote areas where two-sided trade was most prevalent in a prior day session. Participants will respond to future tests of value as they offer favorable entry and exit.
Overnight Rally Highs (Lows): Typically, there is a low historical probability associated with overnight rally-highs (lows) ending the upside (downside) discovery process.
About
After years of self-education, strategy development, mentorship, and trial-and-error, Renato Leonard Capelj began trading full-time and founded Physik Invest to detail his methods, research, and performance in the markets.
Capelj is also a Benzinga finance and technology reporter interviewing the likes of Shark Tank’s Kevin O’Leary, JC2 Ventures’ John Chambers, FTX’s Sam Bankman-Fried, and ARK Invest’s Catherine Wood, as well as a SpotGamma contributor developing insights around impactful options market dynamics.
Disclaimer
Physik Invest does not carry the right to provide advice.
In no way should the materials herein be construed as advice. Derivatives carry a substantial risk of loss. All content is for informational purposes only.
Editor’s Note: The Daily Brief is a free glimpse into the prevailing fundamental and technical drivers of U.S. equity market products. Join the 200+ that read this report daily, below!
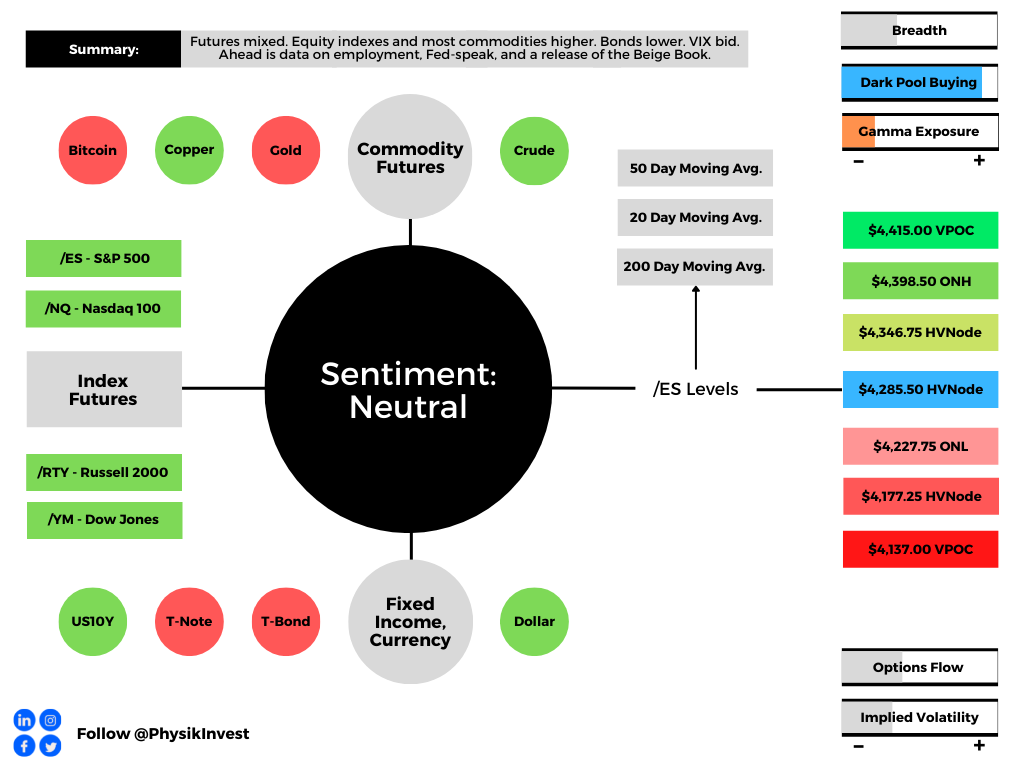
Overnight, futures were mixed. The equity indices auctioned sideways to higher, in line with most commodity products. Bonds were lower, as was the VIX, an implied volatility measure.
Pursuant to the VIX remark, volatility measures in the rates, foreign exchange, and commodity markets are surging amidst geopolitical uncertainties and monetary policy action.
Ahead is data on ADP employment (8:15 AM ET), Fed-speak by Charles Evans (9:00 AM ET), James Bullard (9:30 AM ET), and Jerome Powell (10:00 AM ET). Later, is a release of the Beige Book (2:00 PM ET).
Graphic updated 6:30 AM ET. Sentiment Neutral if expected /ES open is inside of the prior day’s range. /ES levels are derived from the profile graphic at the bottom of the following section. Levels may have changed since initially quoted; click here for the latest levels. SqueezeMetrics Dark Pool Index (DIX) and Gamma (GEX) calculations are based on where the prior day’s reading falls with respect to the MAX and MIN of all occurrences available. A higher DIX is bullish. At the same time, the lower the GEX, the more (expected) volatility. Learn the implications of volatility, direction, and moneyness. SHIFT data used for S&P 500 (INDEX: SPX) options activity. Note that options flow is sorted by the call premium spent; if more positive, then more was spent on call options. Breadth reflects a reading of the prior day’s NYSE Advance/Decline indicator. VIX reflects a current reading of the CBOE Volatility Index (INDEX: VIX) from 0-100.
What To Expect
Fundamental: Cross-asset volatility is spiking as investors look to protect against Russia-Ukraine and monetary policy action, among other things.
Graphic: Via @EffMktHype. “Rate vol through the roof, FX picking up steam while equity vol arguably still cheap in comparison despite being at the high end of its 1-year end.” Please note the spike in rate and FX vol versus equity vol (which is sideways to higher, mostly).
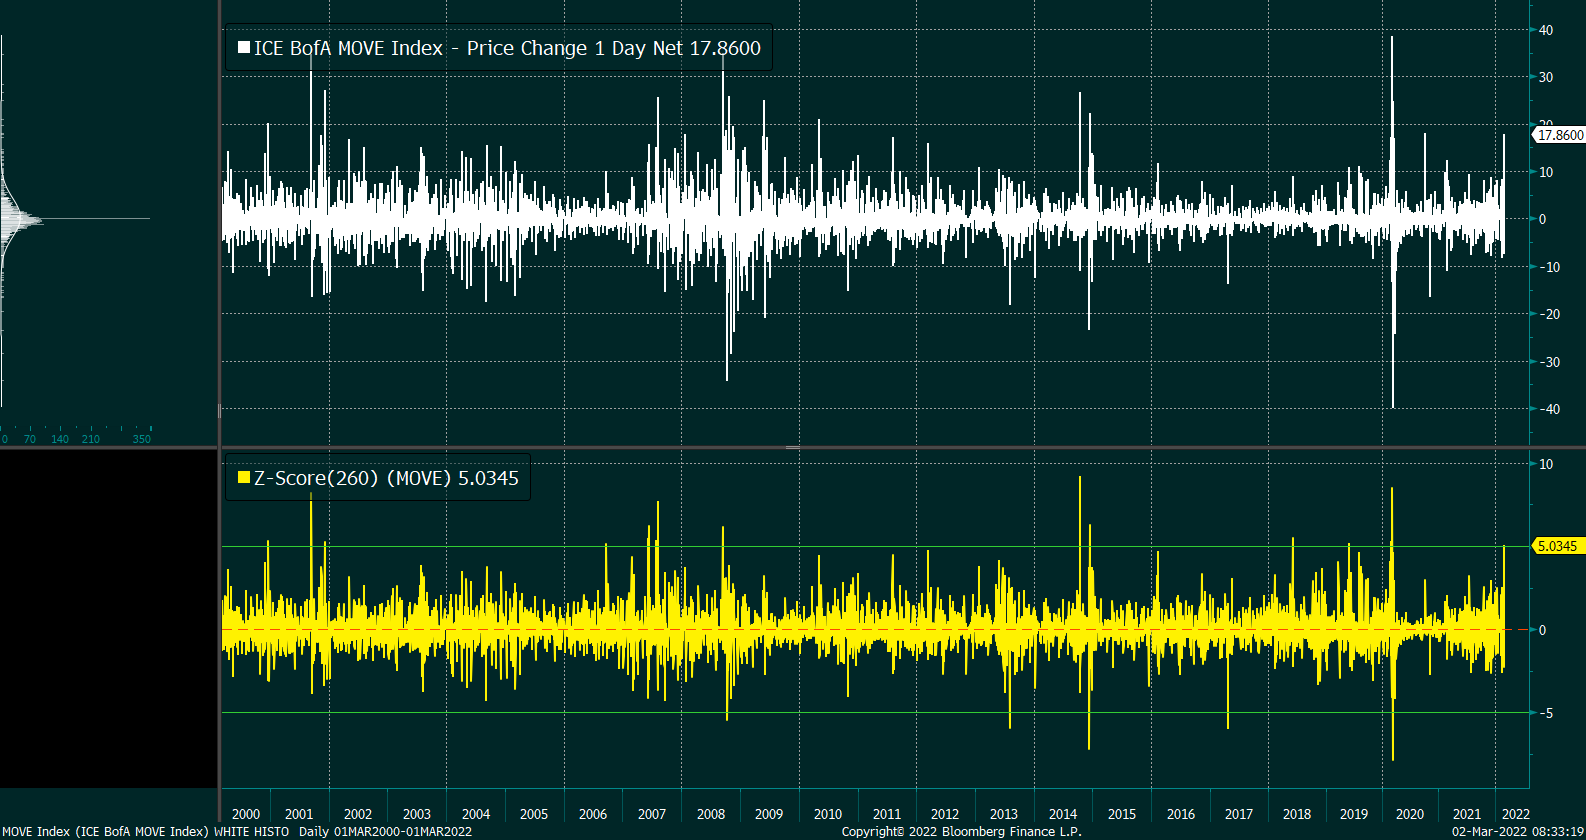
Very interesting is action in the rates market where there was a “5-sigma upward shift in MOVE on 3/1/22. [This] has happened 13 times prior in the last 22 years,” said one commentator.
Graphic: Via @EffMktHype. Merrill Lynch Option Volatility Estimate (INDEX: MOVE).
Taken together, the bond market’s pricing of risk – reflected by the Merrill Lynch Option Volatility Estimate (INDEX: MOVE) – is not in line (or moving in-step) with equity market risk, via the CBOE Volatility Index (INDEX: VIX).
Today is the first day since late Jan that the option market is pricing up volatility a noteworthy but not extreme amount (on a closing basis). $VIX closed at 33.32, ATM implied volatility closed at ~29 highest in over a yr.
The fear in one market tends to feed into the fear of another; regardless of the cause, it seems that equity and bond market participants are not (quite) on the same page.
Moreover, this is in part beyond a decline in liquidity (the variable that’s been connected with the creation of wealth through higher asset prices over time), and has much to do with participants “de-risking” amidst a wide distribution of potential outcomes, another commentator explained.
These fears are in the face of emerging risks to growth (given Russia-Ukraine and beyond); the question is whether there is a dovish surprise and this lends to assuaging participants of fear.
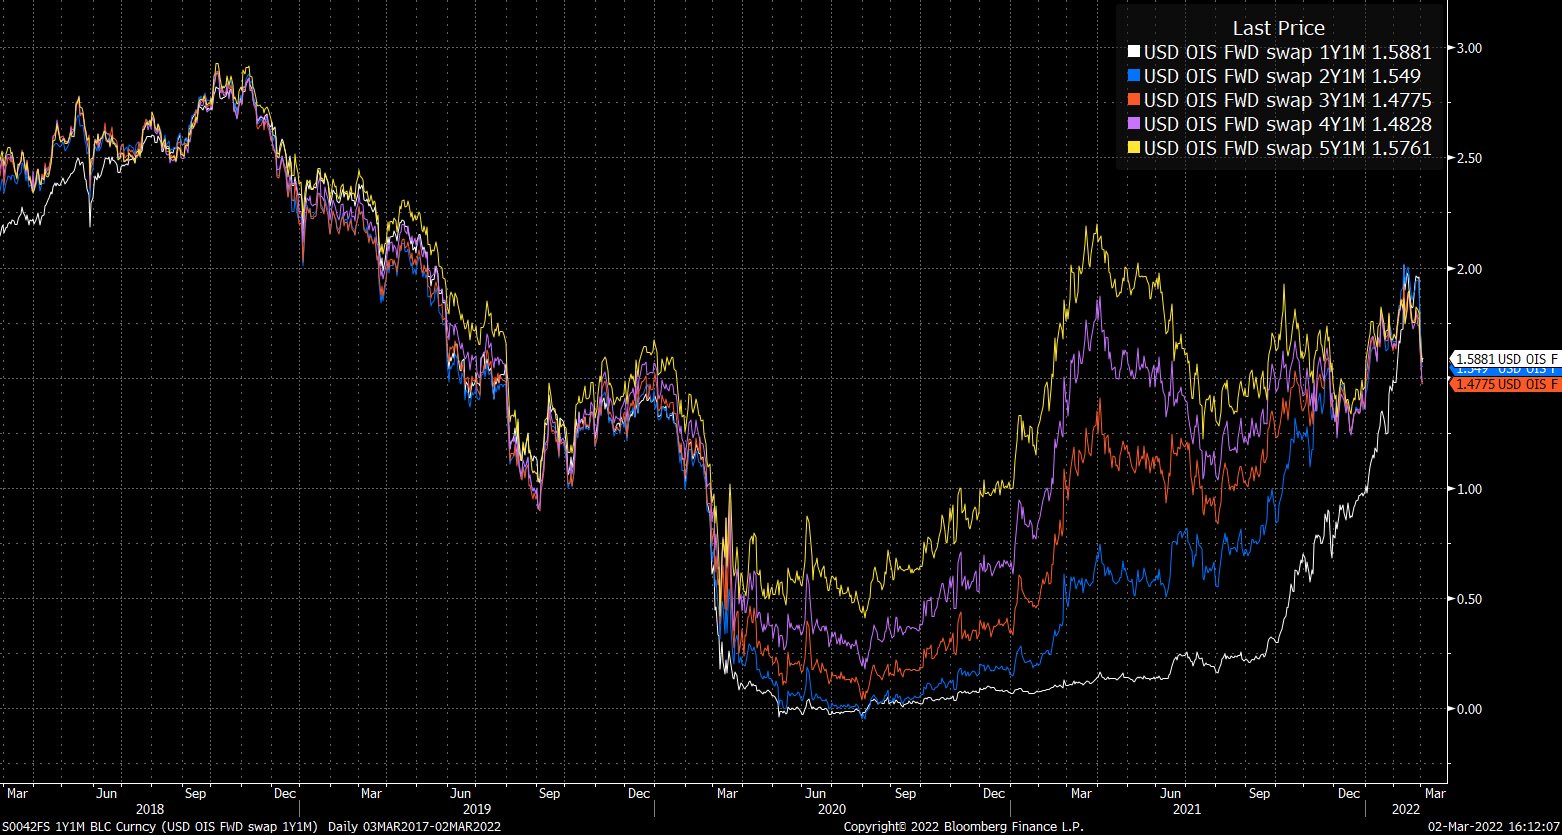
Graphic: Via @EffMktHype. “Forward OIS have coalesced since end-Jan and started to aggressively price out rate hikes.”
Taking a look at the U.S. high yield OAS (option-adjusted spread), participants see a “risk-off” bottom; deteriorating credit conditions are a bearish leading indicator.
Will there be further deterioration that feeds into an eventual repricing of equity market risk? Or, will there be a pullback on hawkishness like the market has started pricing?
Positioning: Pursuant to the remarks made on equity implied volatility, March 1, 2022, was “the first day since late January that the options market [was] pricing up volatility a noteworthy but not extreme amount (on a closing basis).”
This is, per SpotGamma, amidst participants’ heightened demand for downside (put) protection; in purchasing protection, traders indirectly take liquidity as counterparties hedge exposure in the underlying.
Everyone in the world is sick of the “dealer gamma hedging” narrative. Including myself and the rest of the vol guys.
However, it remains such a big part of this market it’s hard to downplay the implications and not discuss it when talking about the environment. pic.twitter.com/pDLmlALNR1
The effects of this hedging are more notable given reticence on the part of counterparties.
“Essentially, with markets swinging there is a hesitance amongst liquidity providers to step in. This creates an environment in which the absorption of orders deteriorates,” SpotGamma explains. “Given this, the hedging of options exposure further amplifies market moves.”
A heightened VIX, in the face of an equity market that is not trading much weaker, is a clear reflection of this so-called reticence.
Pictured: SqueezeMetrics highlights implications of volatility, direction, and moneyness.
Going forward, bearing in mind the continued passive buying support alluded to in past commentaries, if participants were to be assuaged of their fears, that would likely coincide with less(er) demand for downside protection and compression in volatility.
The implications of this? Reduced demand for protection coincides with less counterparty negative gamma exposure (as counterparty put buying [a negative delta, positive gamma trade] coincides with the addition of liquidity [purchase of underlying, a positive delta trade]).
In counterparties being less exposed to losses on the downside (via reduced negative gamma exposure), their (re)hedging may bolster attempts higher (i.e., open the door to the upside).
The likelihood of this dynamic coming to fruition is low(er), up until the passage of the Federal Open Market Committee event March 15-16, 2022, and options expiration (that same week).
Graphic: Fear and demand for protection concentrated in shorter-dated contracts most sensitive to changes in implied volatility and direction results in pressure from hedging. The compression of volatility likely coincides with support of attempts higher (as this removes pressure).
Technical: As of 6:30 AM ET, Wednesday’s regular session (9:30 AM – 4:00 PM ET), in the S&P 500, will likely open in the upper part of a balanced overnight inventory, inside of prior-range and -value, suggesting a limited potential for immediate directional opportunity.
In the best case, the S&P 500 trades higher; activity above the $4,285.50 high volume area (HVNode) puts in play the $4,346.75 HVNode. Initiative trade beyond the $4,346.75 HVNode could reach as high as the $4,398.50 overnight high (ONH) and $4,415.00 VPOC, or higher.
In the worst case, the S&P 500 trades lower; activity below the $4,285.50 HVNode puts in play the $4,227.75 overnight low. Initiative trade beyond the ONL could reach as low as the $4,177.25 HVNode and $4,137.00 untested point of control (VPOC), or lower.
Considerations: The market is in balance or rotational trade that suggests current prices offer favorable entry and exit. Balance-areas make it easy to spot a change in the market (i.e., the transition from two-time frame trade, or balance, to one-time frame trade, or trend).
Modus operandi is responsive trade (i.e., fade the edges), rather than initiative trade (i.e., play the break).
Click here to load today’s key levels into the web-based TradingView charting platform. Note that all levels are derived using the 65-minute timeframe. New links are produced, daily.
Graphic: 65-minute profile chart of the Micro E-mini S&P 500 Futures.
What People Are Saying
For investors who imagine the S&P 500 is somehow "cheap" at a P/E above 22 – amid record profit margins – you may want to examine historical data and think through what P/E ratios mean.
Volume Areas: A structurally sound market will build on areas of high volume (HVNodes). Should the market trend for long periods of time, it will lack sound structure, identified as low volume areas (LVNodes). LVNodes denote directional conviction and ought to offer support on any test.
If participants were to auction and find acceptance into areas of prior low volume (LVNodes), then future discovery ought to be volatile and quick as participants look to HVNodes for favorable entry or exit.
Gamma: Gamma is the sensitivity of an option to changes in the underlying price. Dealers that take the other side of options trades hedge their exposure to risk by buying and selling the underlying. When dealers are short-gamma, they hedge by buying into strength and selling into weakness. When dealers are long-gamma, they hedge by selling into strength and buying into weakness. The former exacerbates volatility. The latter calms volatility.
Vanna: The rate at which the delta of an option changes with respect to volatility.
Charm: The rate at which the delta of an option changes with respect to time.
POCs: POCs are valuable as they denote areas where two-sided trade was most prevalent in a prior day session. Participants will respond to future tests of value as they offer favorable entry and exit.
Volume-Weighted Average Prices (VWAPs): A metric highly regarded by chief investment officers, among other participants, for quality of trade. Additionally, liquidity algorithms are benchmarked and programmed to buy and sell around VWAPs.
Rates: Low rates have to potential to increase the present value of future earnings making stocks, especially those that are high growth, more attractive. To note, inflation and rates move inversely to each other. Low rates stimulate demand for loans (i.e., borrowing money is more attractive).
About
After years of self-education, strategy development, mentorship, and trial-and-error, Renato Leonard Capelj began trading full-time and founded Physik Invest to detail his methods, research, and performance in the markets.
Capelj is also a Benzinga finance and technology reporter interviewing the likes of Shark Tank’s Kevin O’Leary, JC2 Ventures’ John Chambers, FTX’s Sam Bankman-Fried, and ARK Invest’s Catherine Wood, as well as a SpotGamma contributor developing insights around impactful options market dynamics.
Disclaimer
Physik Invest does not carry the right to provide advice.
In no way should the materials herein be construed as advice. Derivatives carry a substantial risk of loss. All content is for informational purposes only.