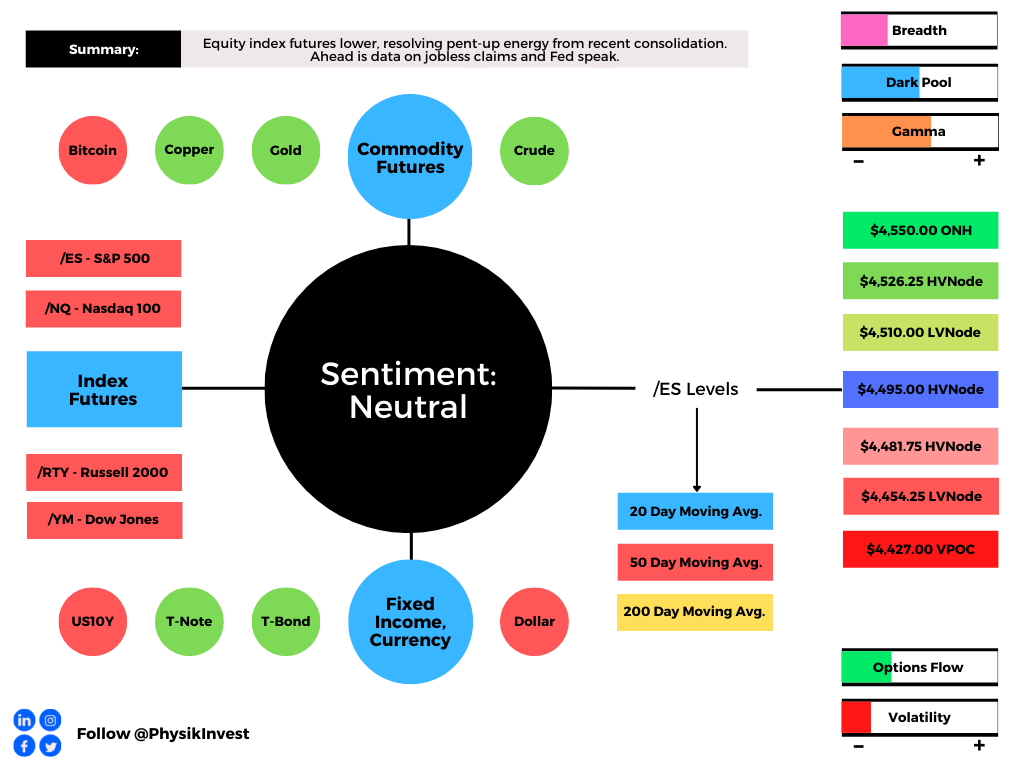
What Happened
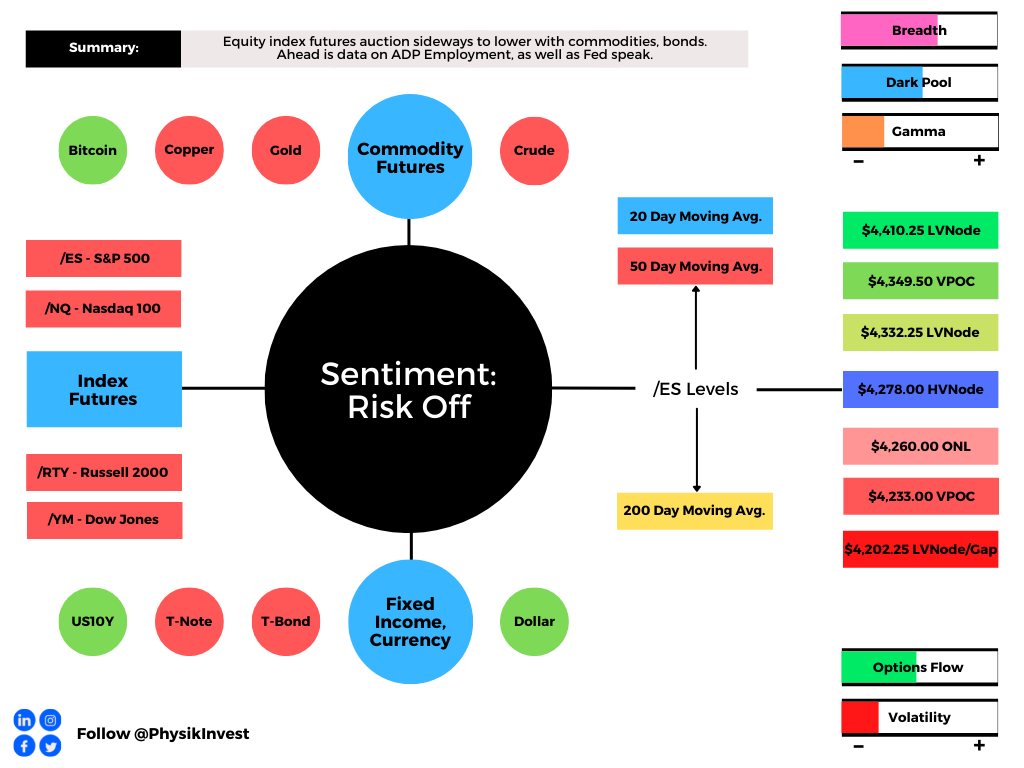
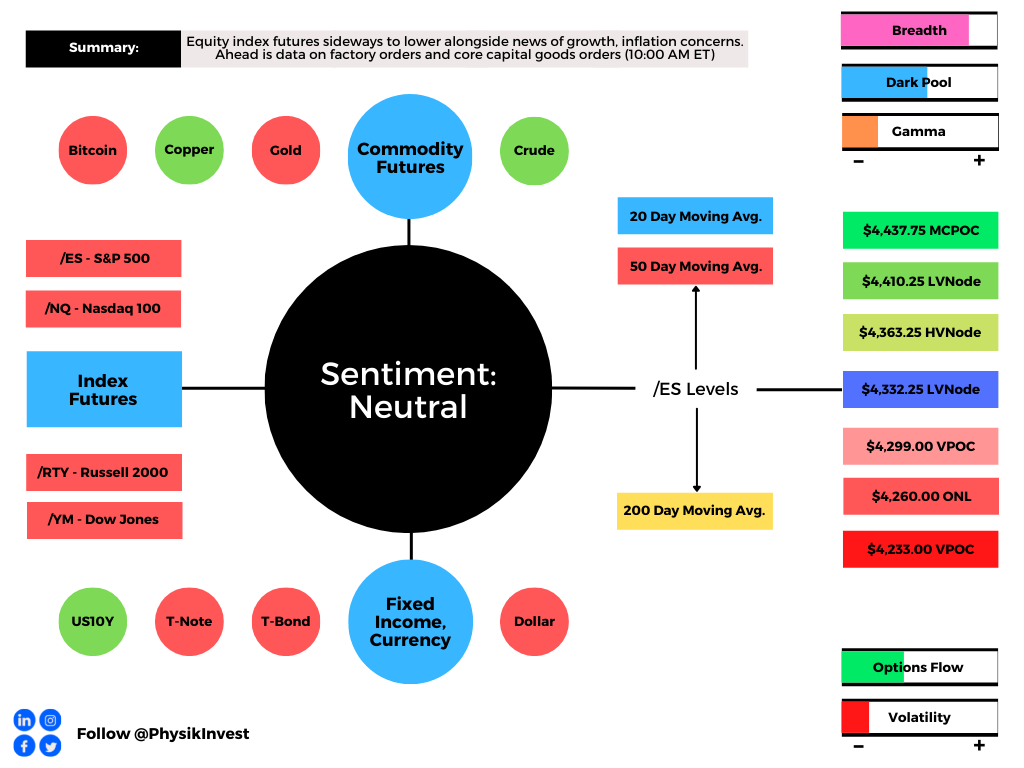
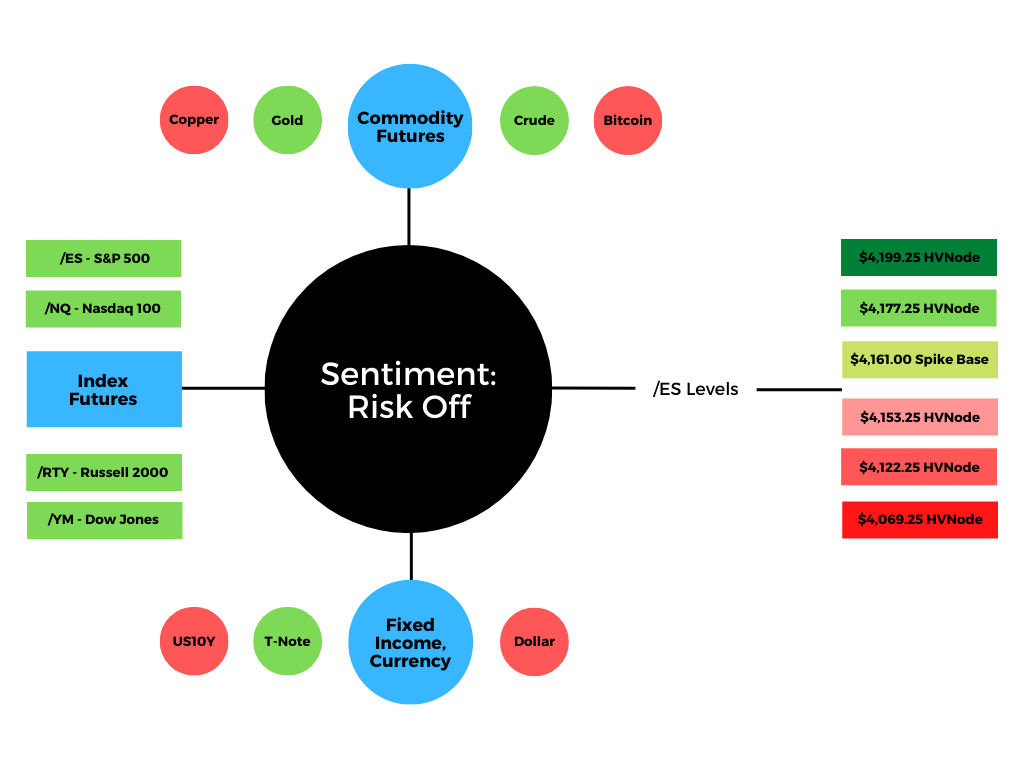
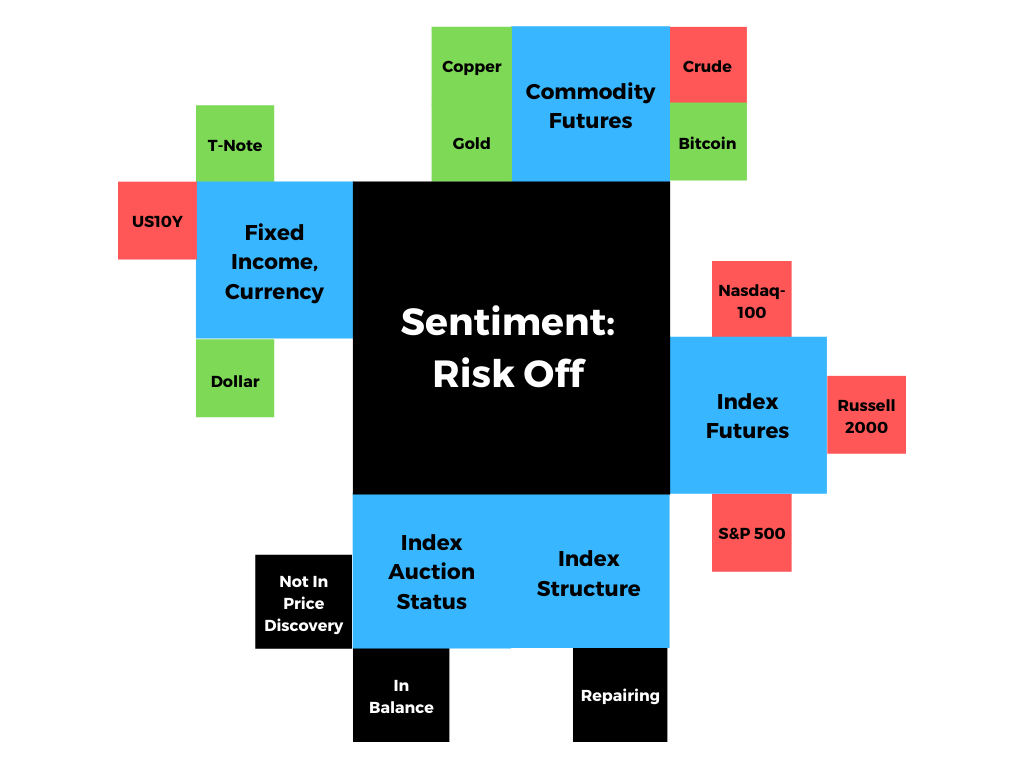
Ahead of a shortened holiday session, equity index futures auctioned lower alongside the narrative of a resurgence in the COVID-19 coronavirus.
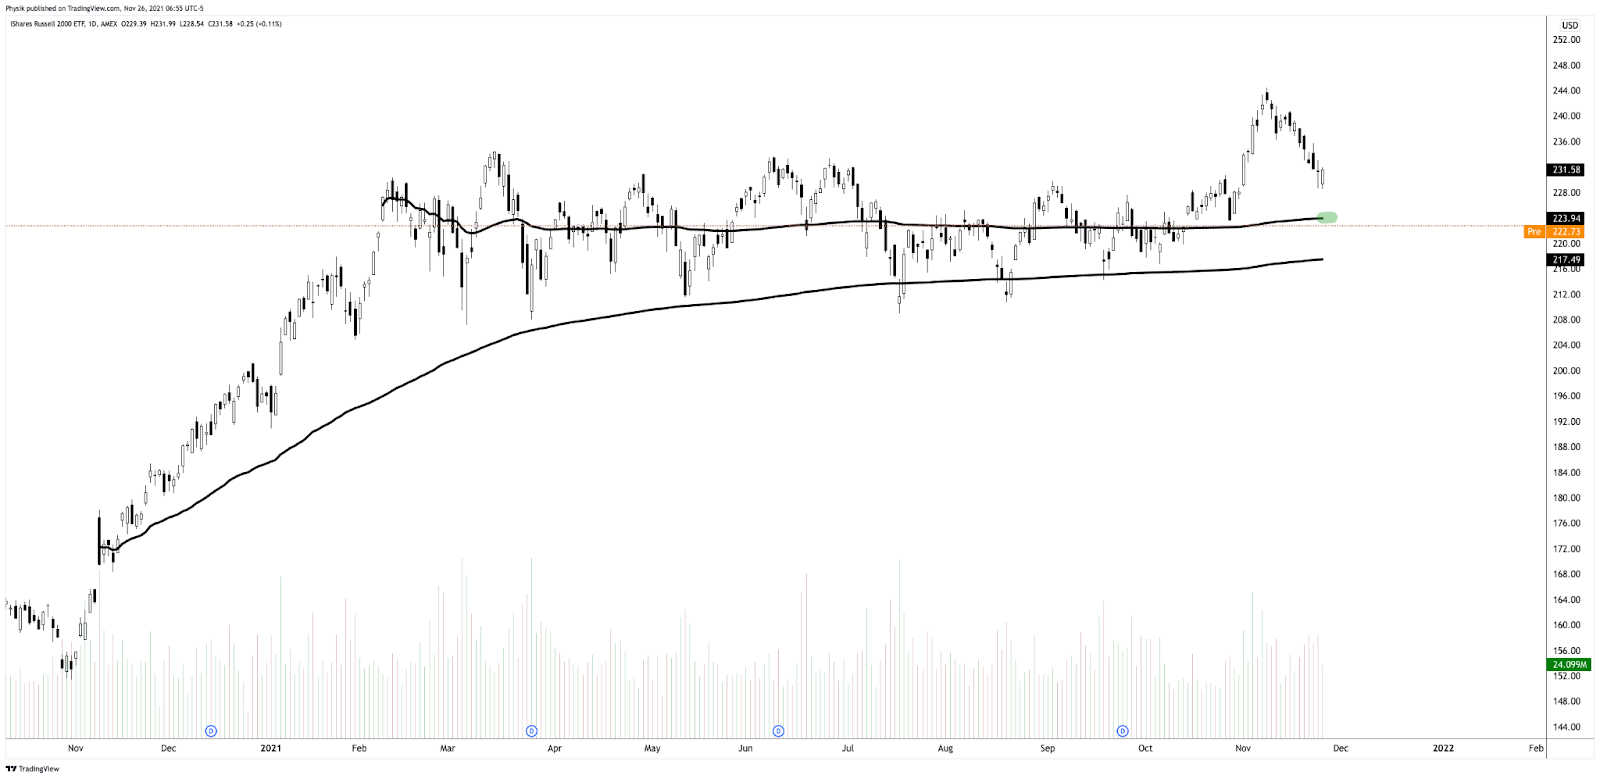
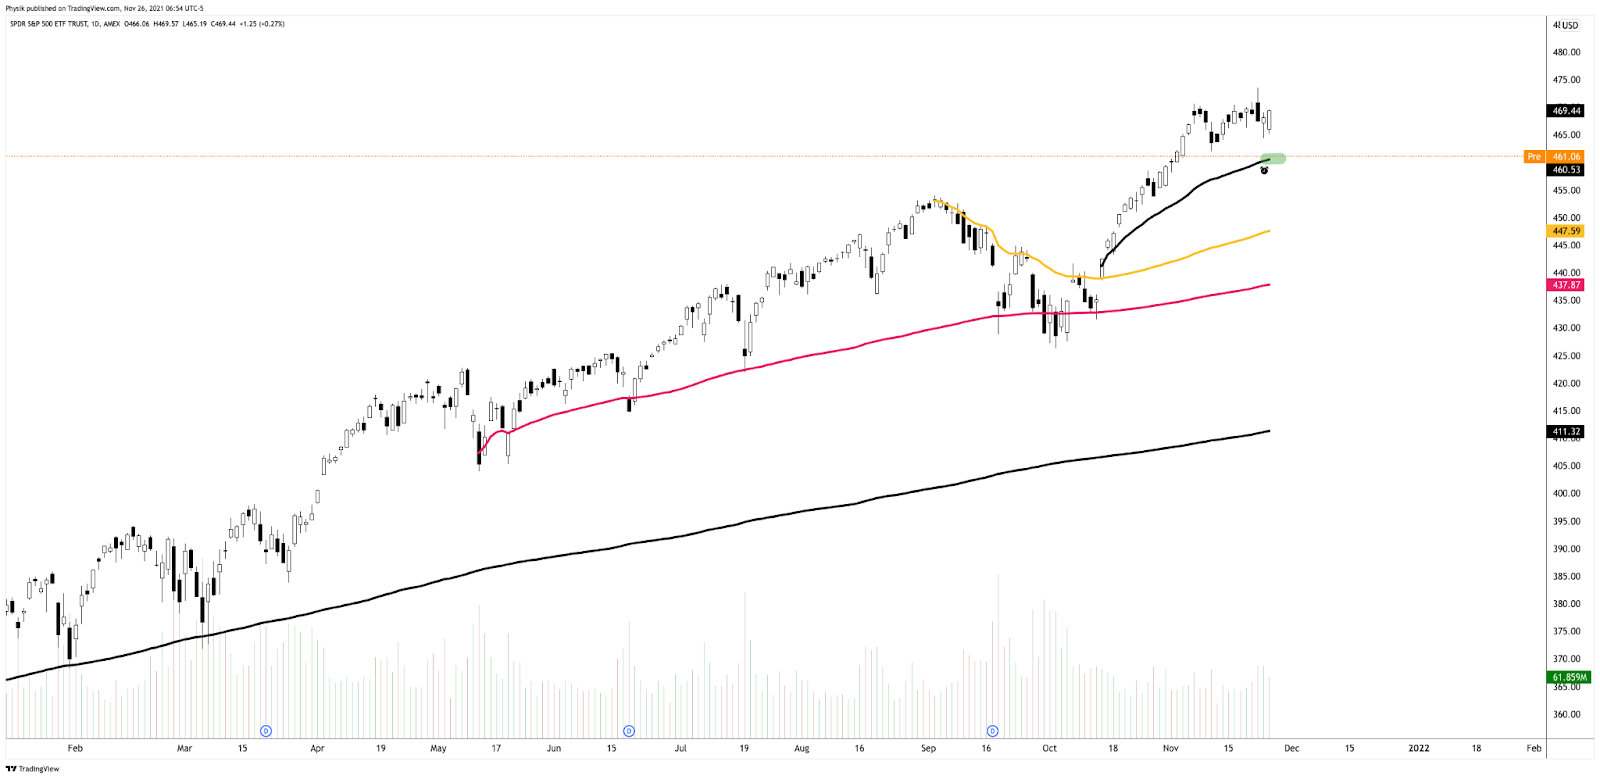
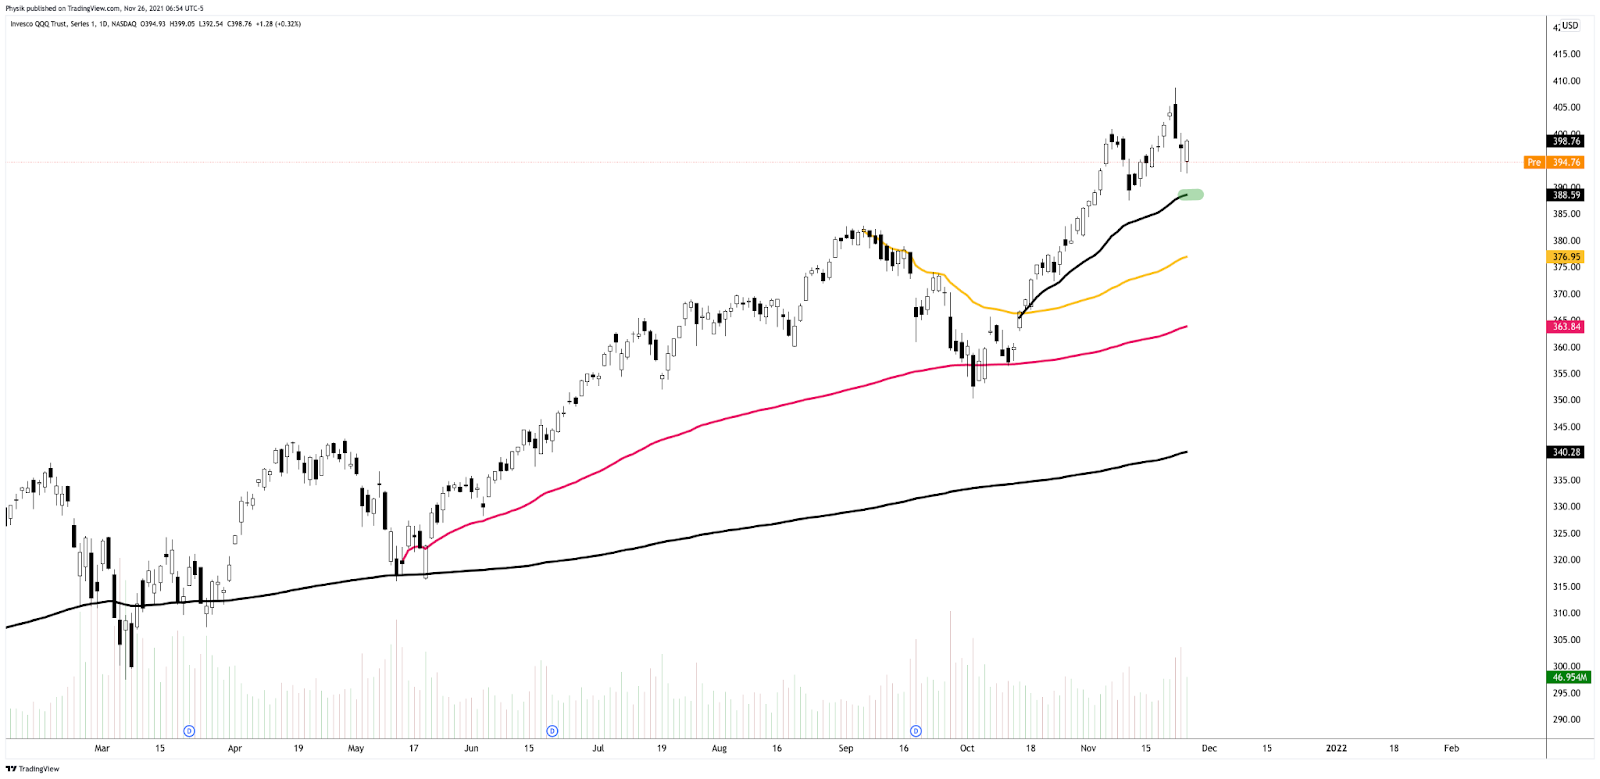
Most affected appears the Russell 2000 which was down nearly 4.00%, at the time of this writing. The S&P 500 was off about 2.00% or so, buoyed by the innovation- and tech-heavy Nasdaq 100 which was only down about 1.00%.
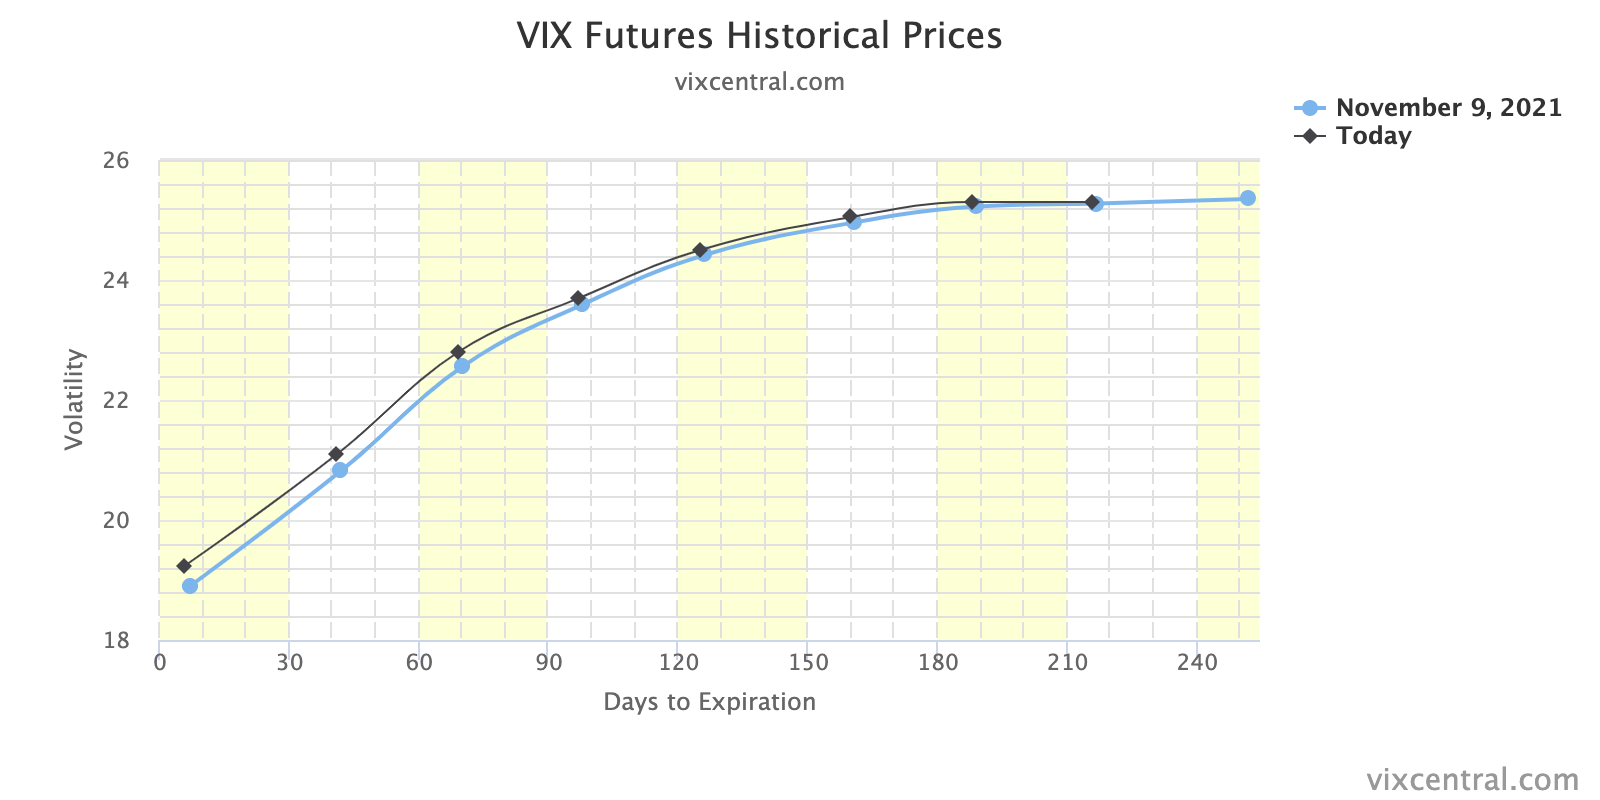
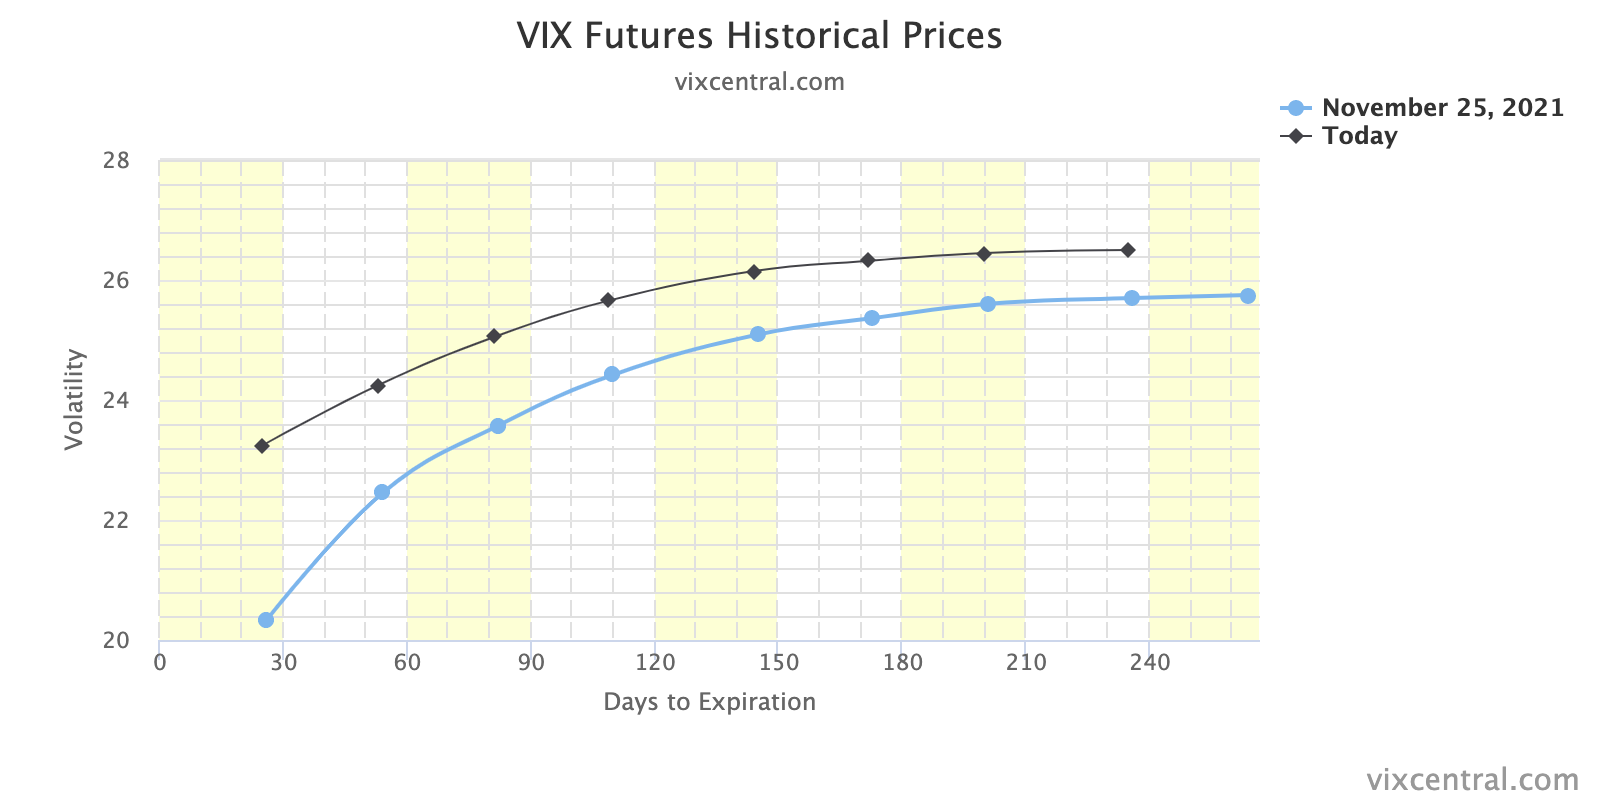
This shift in relative strength comes as the ten-year yield sits lower about 8.00%. The CBOE Volatility Index (INDEX: VIX) was up over 40.00% and the implications of this are staggering, given the underhedged market I talked about over the past sessions.
Moreover, there are no scheduled economic releases, today.

What To Expect
On Wednesday’s lackluster breadth and market liquidity metrics, the best case occurred.
The S&P 500 recovered its $4,697.50 spike base, below which selling activity appeared to be the result of weaker-handed participants liquidating as a result of poor location and news.
Overnight, however, the tone shifted. The S&P 500 initiated back through its $4,647.25 high volume area (HVNode) which had corresponded with the 20-day simple moving average.
The 20-day presented participants with a clear way to measure risk, given the mechanical responses in prior trade. As explained, Wednesday, should participants manage to break past the 20-day, then conditions have changed and follow-through was likely.
Reason being? Those visual levels are acted on by short-term, technically-driven participants who generally are unable to defend retests.
Context: The aforementioned trade is happening in the context of an “insatiable appetite for stocks this year,” as Bloomberg explains.
“Investors have poured almost $900 billion into equity exchange-traded and long-only funds in 2021 — exceeding the combined total from the past 19 years.”
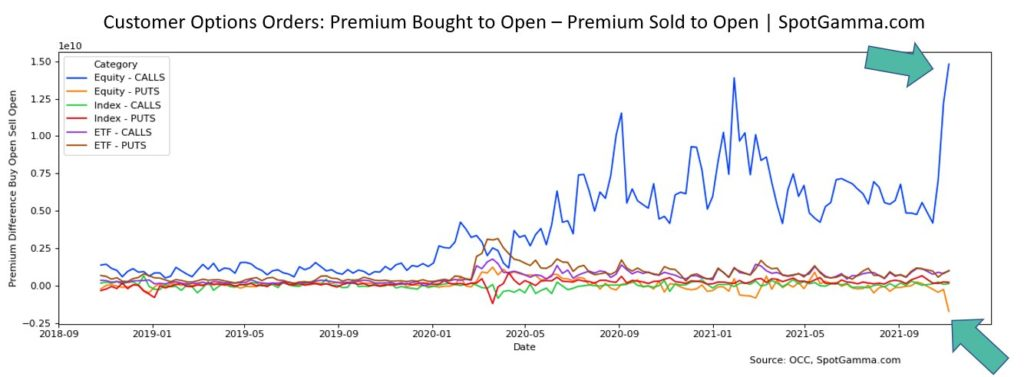
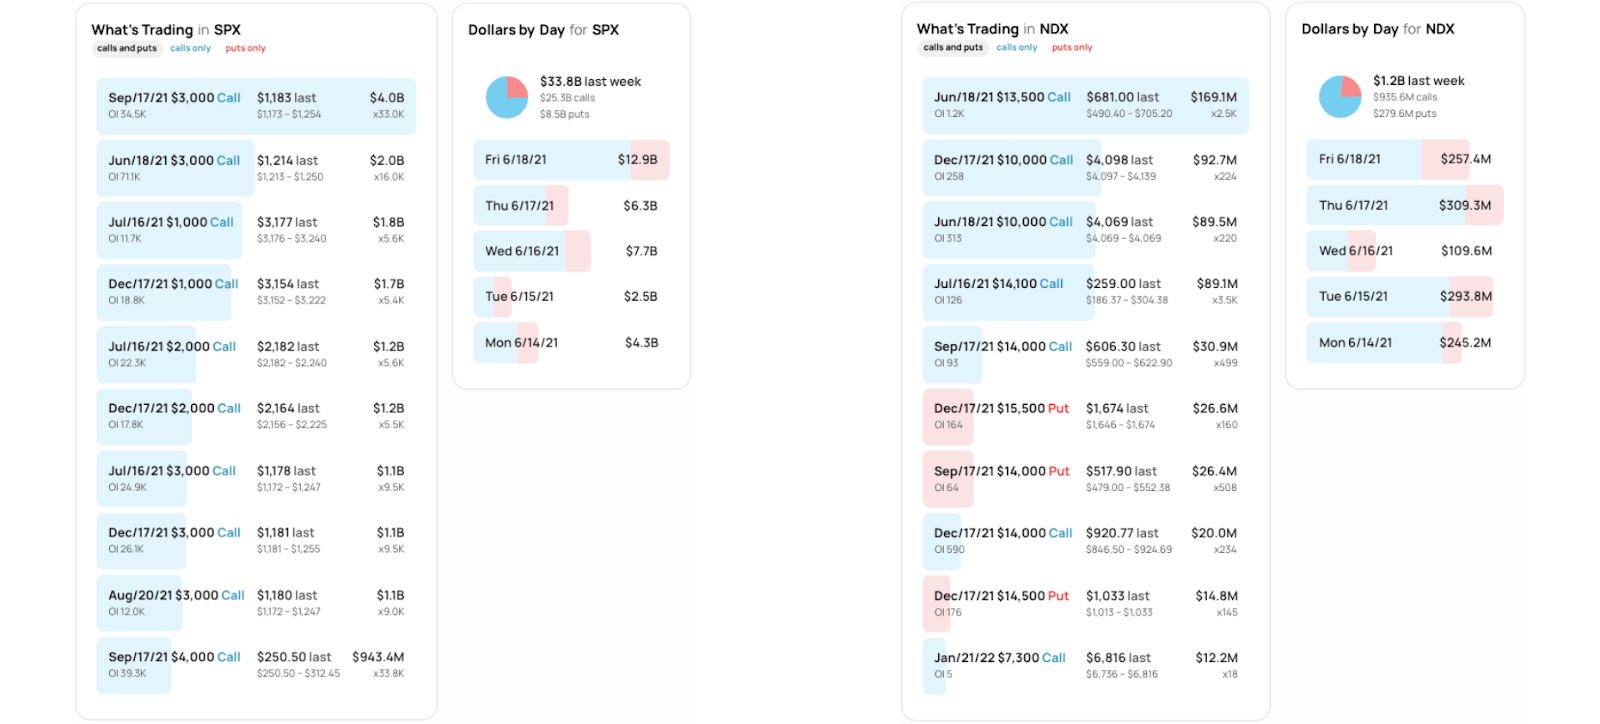
This appetite fed into the activity of some high-flyers like Tesla Inc (NASDAQ: TSLA) with customers opting to aggressively sell puts and buy calls heading into the November monthly options expiration (OPEX).
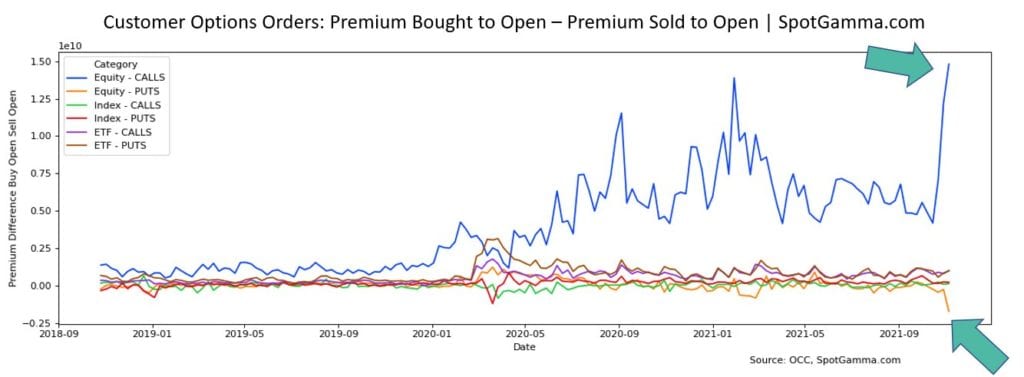
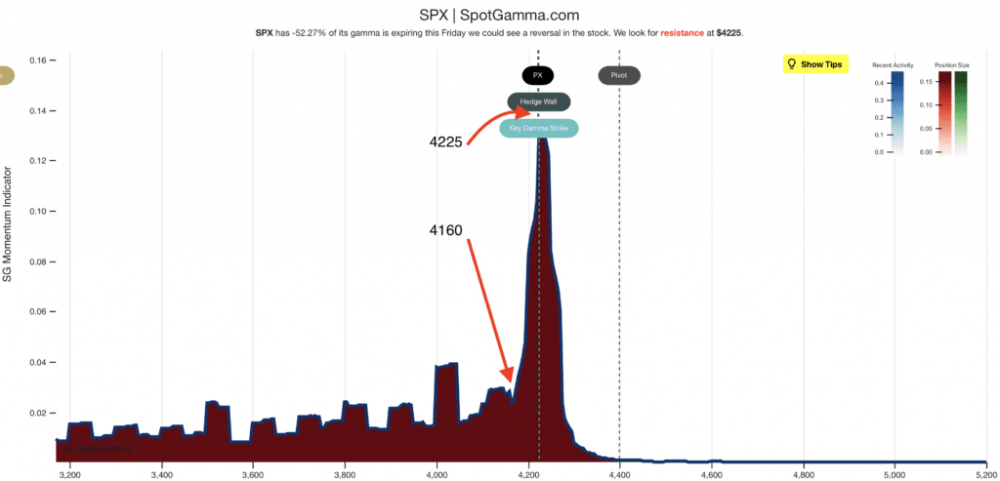
Unfortunately, (1) after OPEX, the absence of sticky and supportive hedging flows freed the broader market for directional resolve, and (2) according to SpotGamma, in light of recent exuberance, “participants [were] underexposed to downside put protection.”
The implications of the latter are staggering.
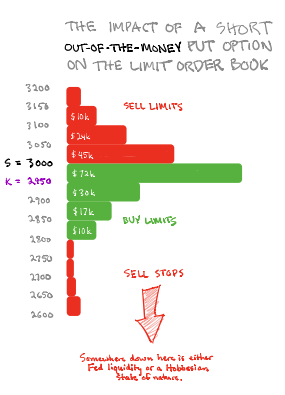
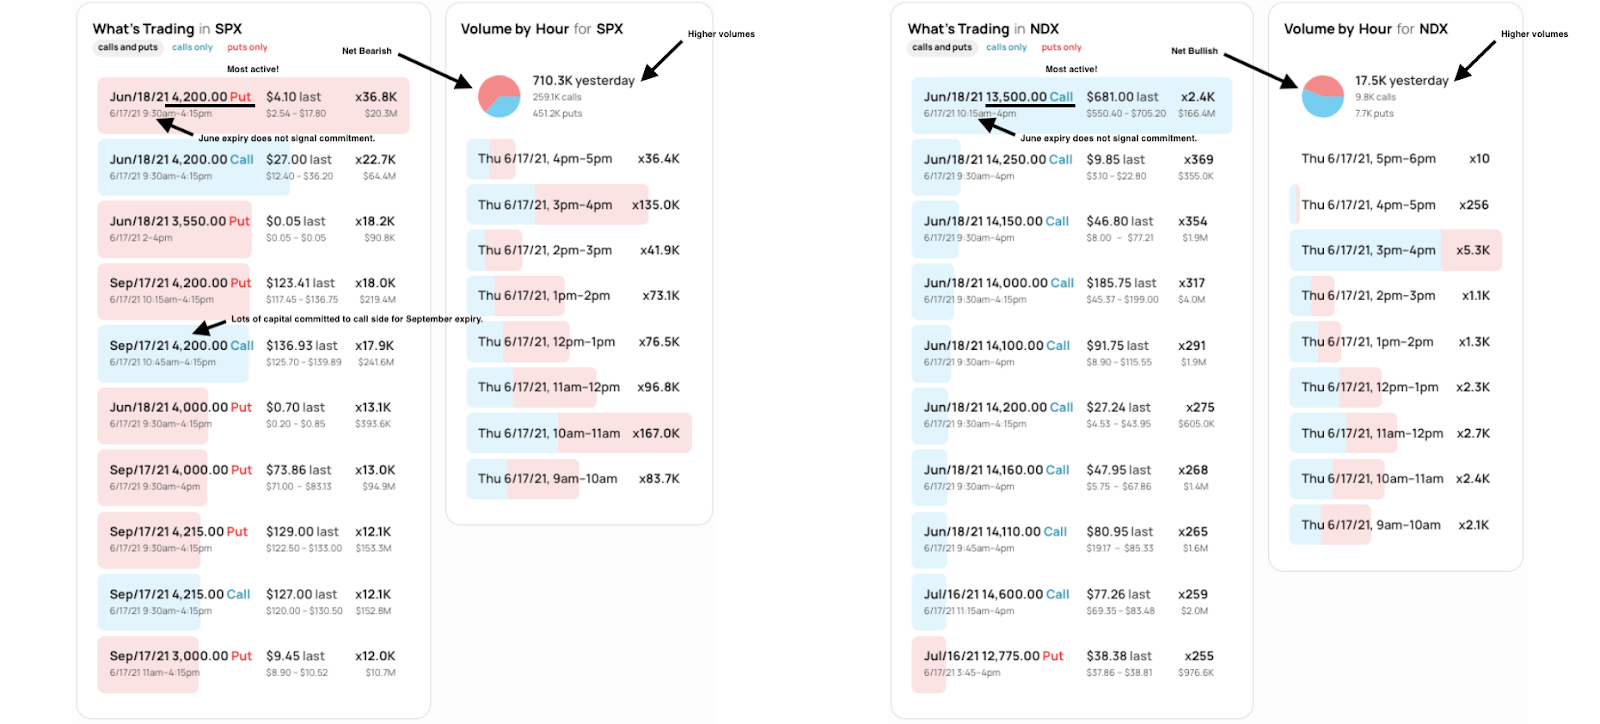
In short, should volatility continue to pick up, those participants (who were once exuberant) are likely to reach for protection forcing dealers to reflexively hedge in a destabilizing manner.
As volatility rises and customers demand protection, counterparties are to hedge by selling into weakness. The conditions worsen when much of the activity is in shorter-dated tenors where options gamma is more sensitive if we will. This is what we’re seeing.
Note that I said short-dated.
Once that exposure rolls off the table (and/or is monetized), dealers/counterparties will reverse and support the market, buying-to-close their existing stock/futures hedges to negative gamma positions.
This flow is stabilizing and may play into a seasonally-aligned rally into Christmas.
As stated on November 23, 2021: “This last part is educated conjecture. It’s what I also feel as though would frustrate the most amount of participants. Basically, a quick wash (or sideways to lower), followed by a move higher into year-end. Be nimble and responsive!”
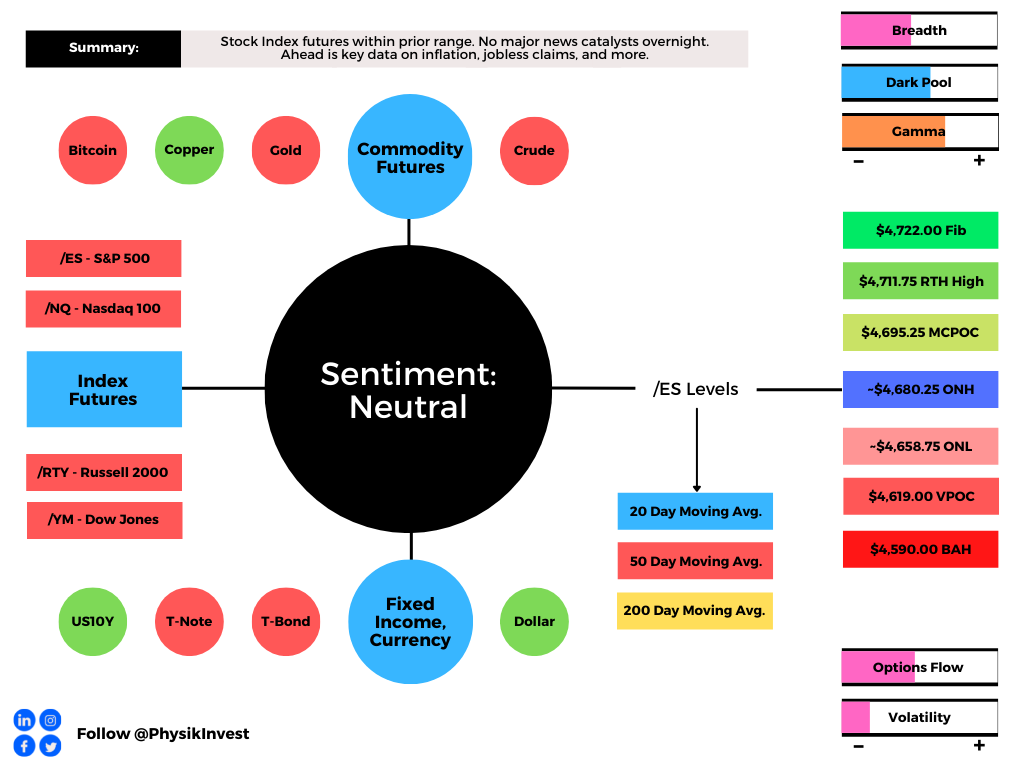
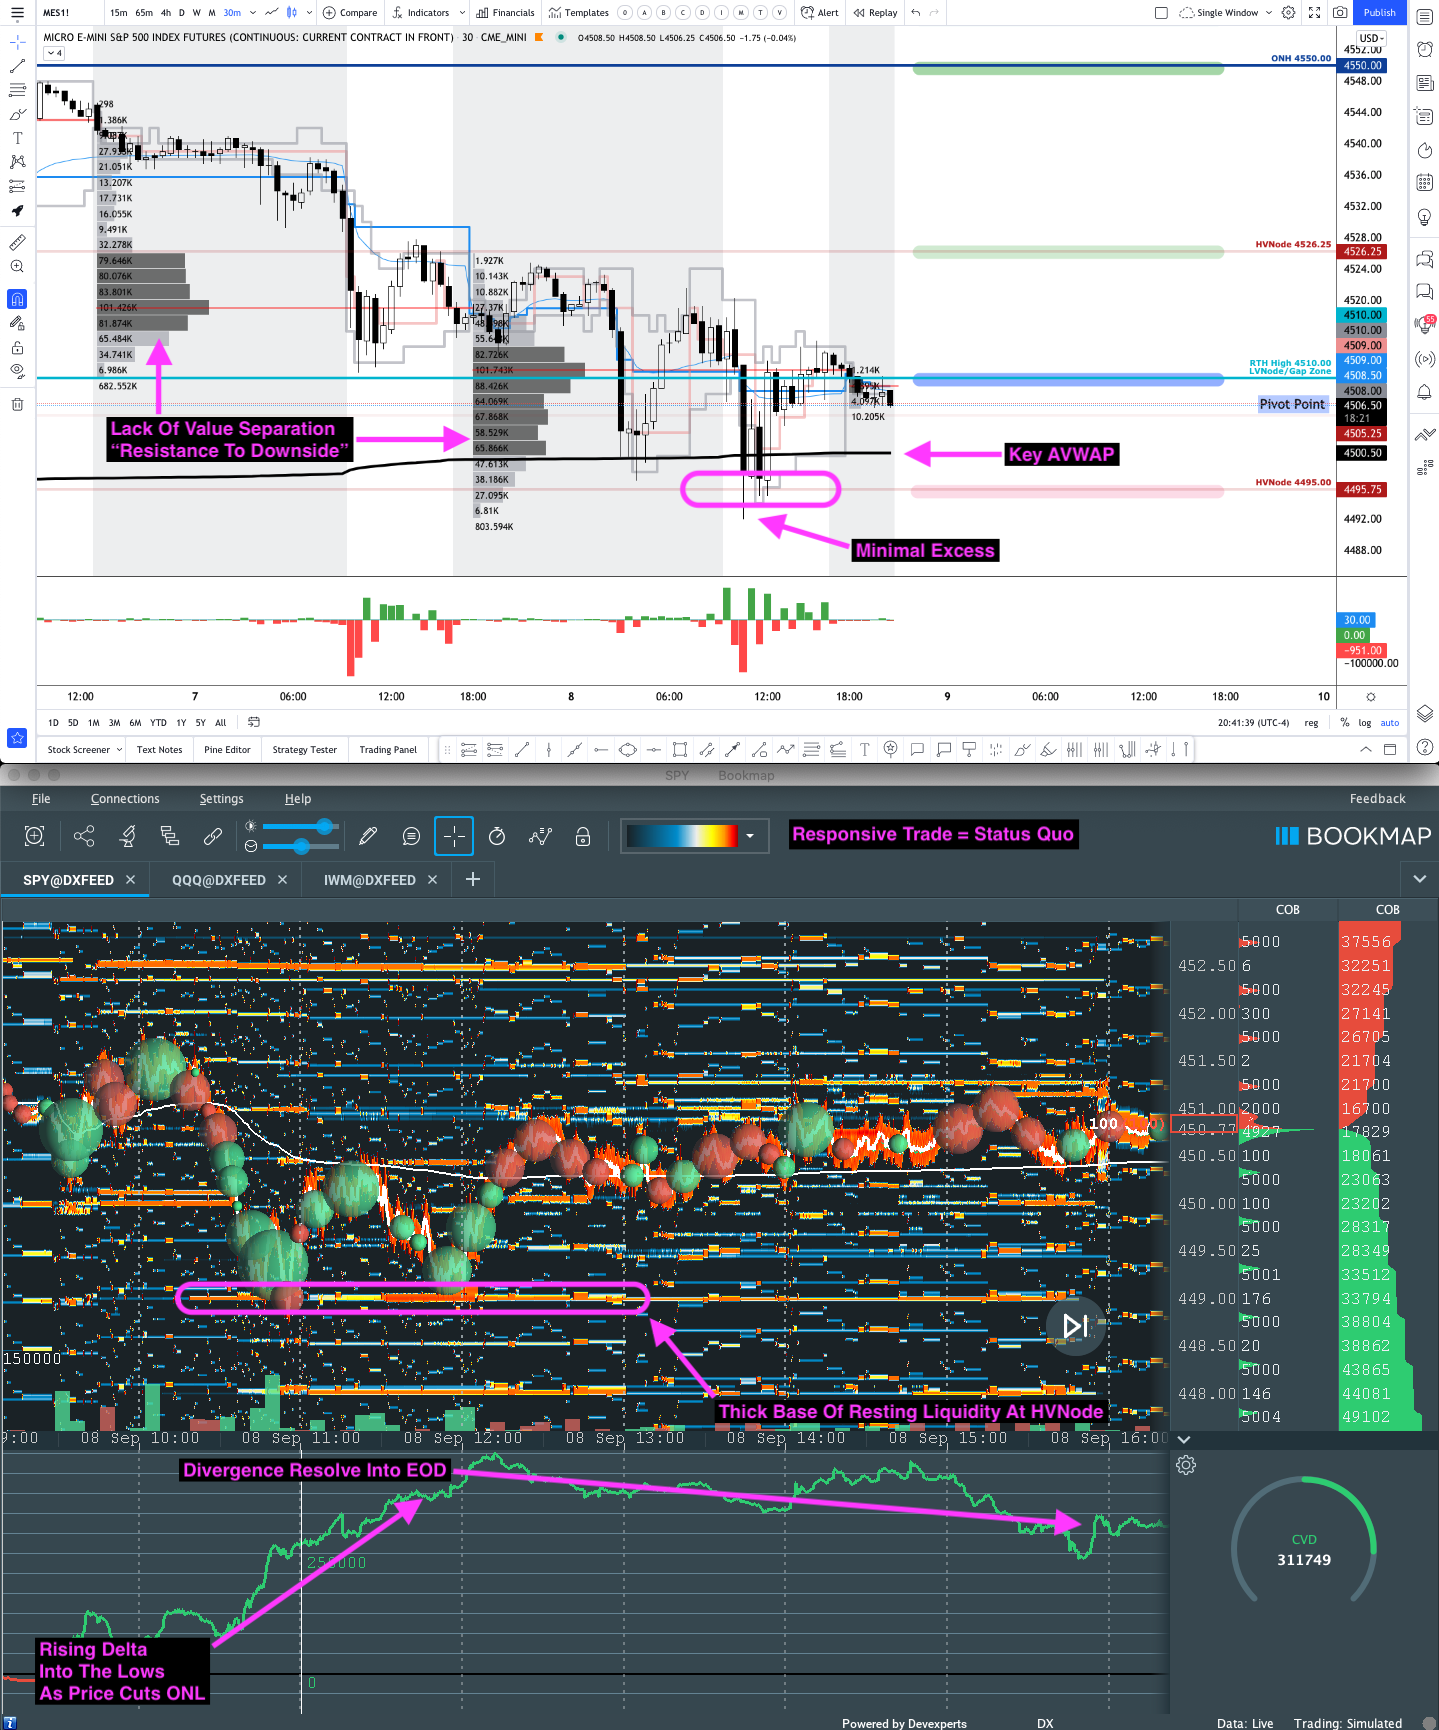
Expectations: As of 6:00 AM ET, Friday’s regular session (9:30 AM – 1:00 PM ET), in the S&P 500, will likely open in the lower part of a negatively skewed overnight inventory, outside of prior-range and -value, suggesting a potential for immediate directional opportunity.
Gap Scenarios Are In Play: Gaps ought to fill quickly. Should they not, that’s a signal of strength; do not fade. Leaving value behind on a gap-fill or failing to fill a gap (i.e., remaining outside of the prior session’s range) is a go-with indicator.

Auctioning and spending at least 1-hour of trade back in the prior range suggests a lack of conviction; in such a case, do not follow the direction of the most recent initiative activity.
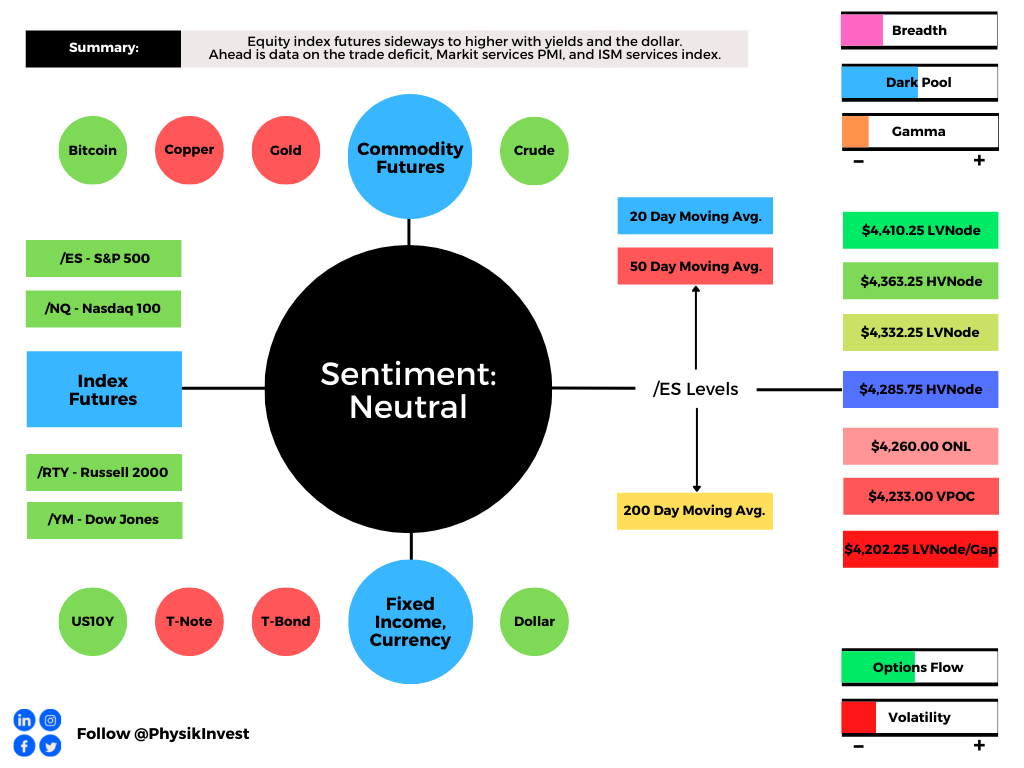
In the best case, the S&P 500 trades sideways or higher; activity above the $4,618.75 high volume area (HVNode) puts in play the $4,647.25 HVNode. Initiative trade beyond the latter HVNode could reach as high as the $4,674.25 micro composite point of control (MCPOC) and $4,691.25 HVNode, or higher.
In the worst case, the S&P 500 trades lower; activity below the $4,618.75 HVNode puts in play the $4,596.75 overnight low (ONL) and $4,590.00 balance boundary (BAH). Initiative trade beyond the BAH could reach as low as the $4,574.25 HVNode and $4,551.75 LVNode, or lower.
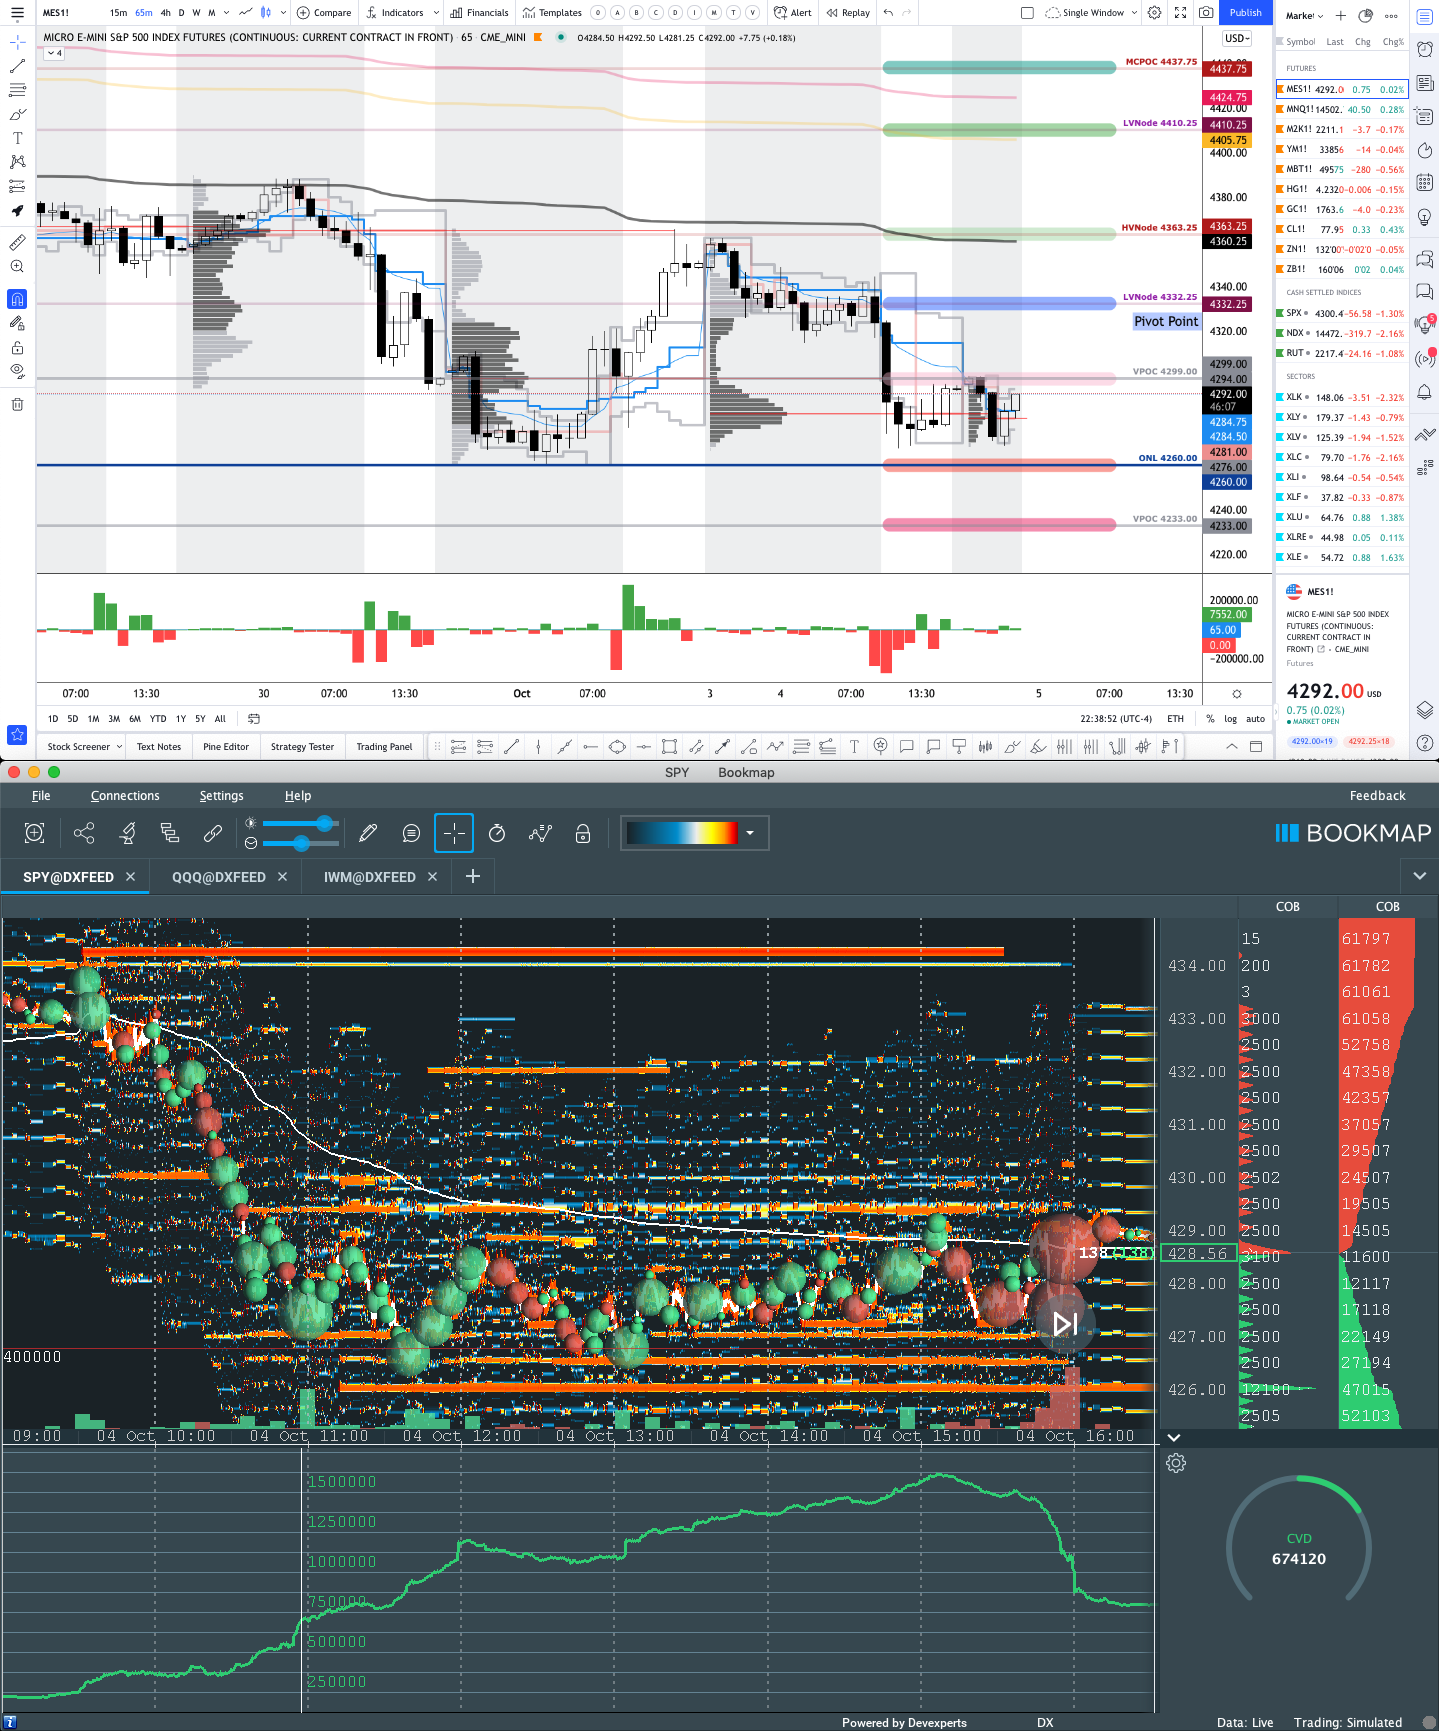
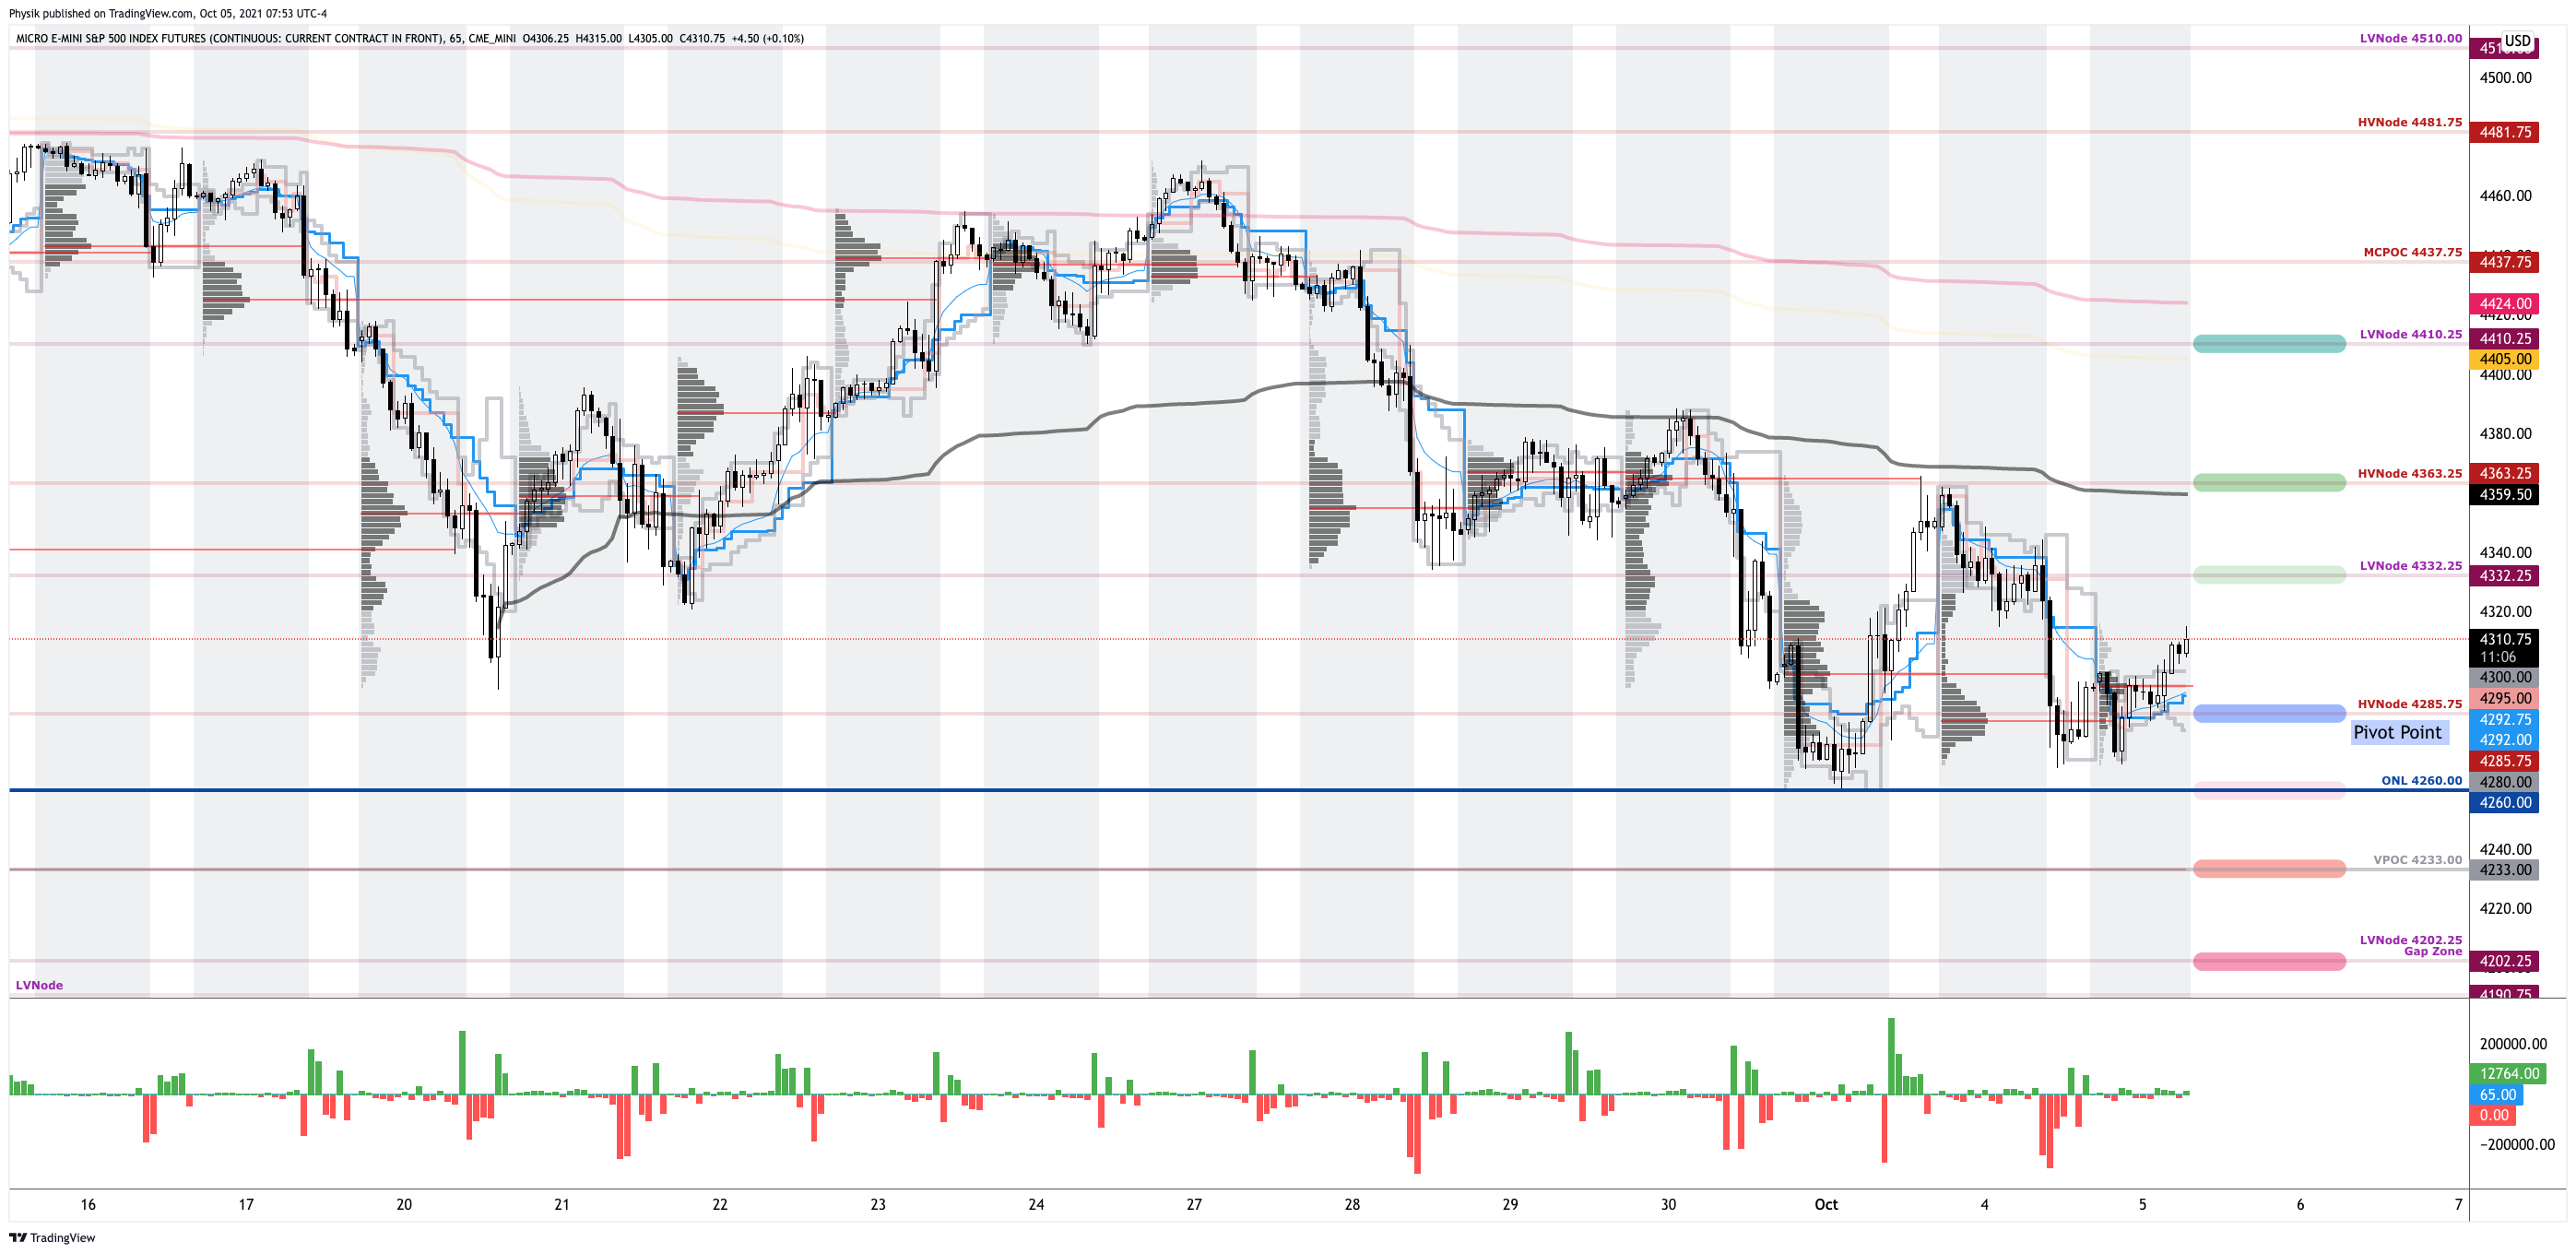
Click here to load today’s updated key levels into the web-based TradingView charting platform. Note that all levels are derived using the 65-minute timeframe. New links are produced, daily.

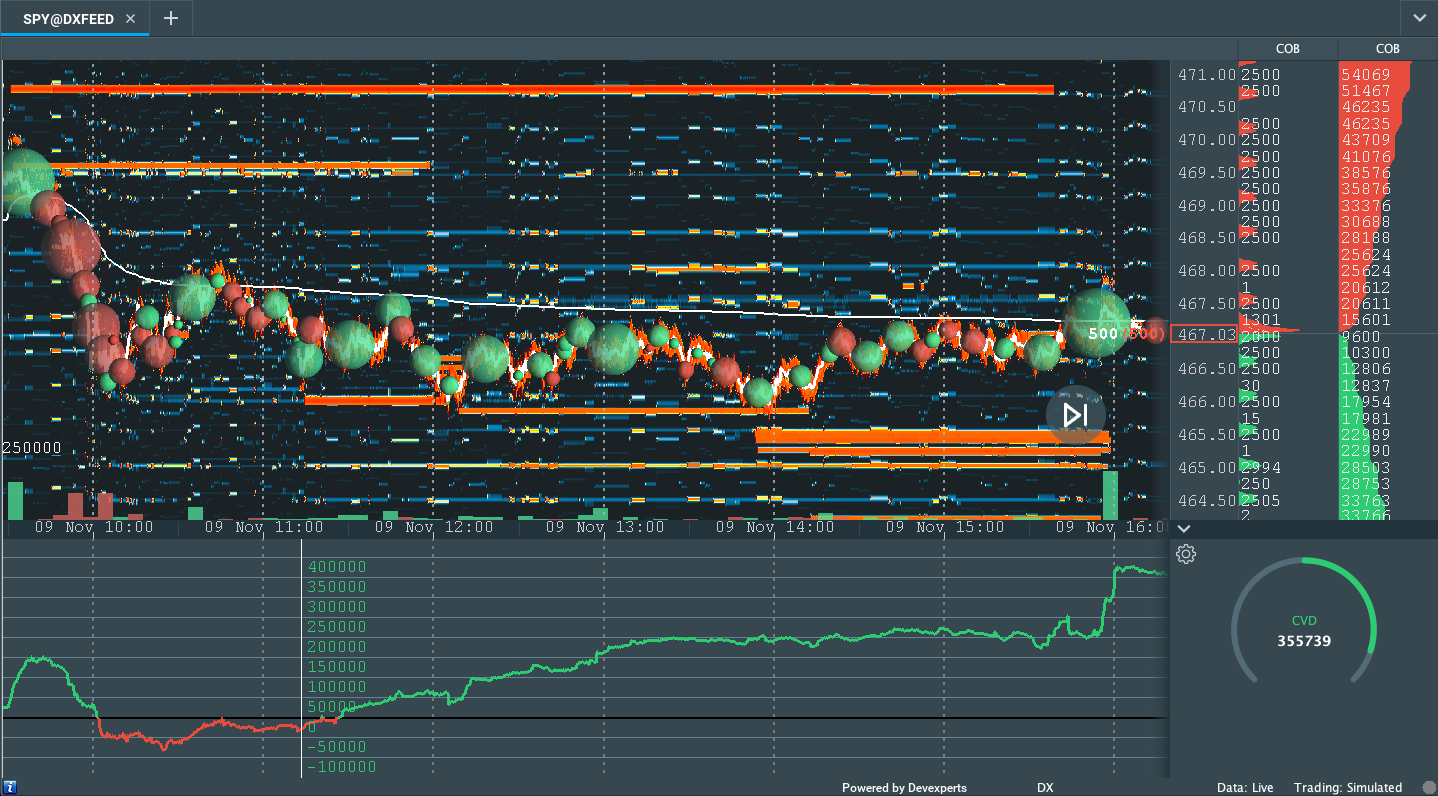
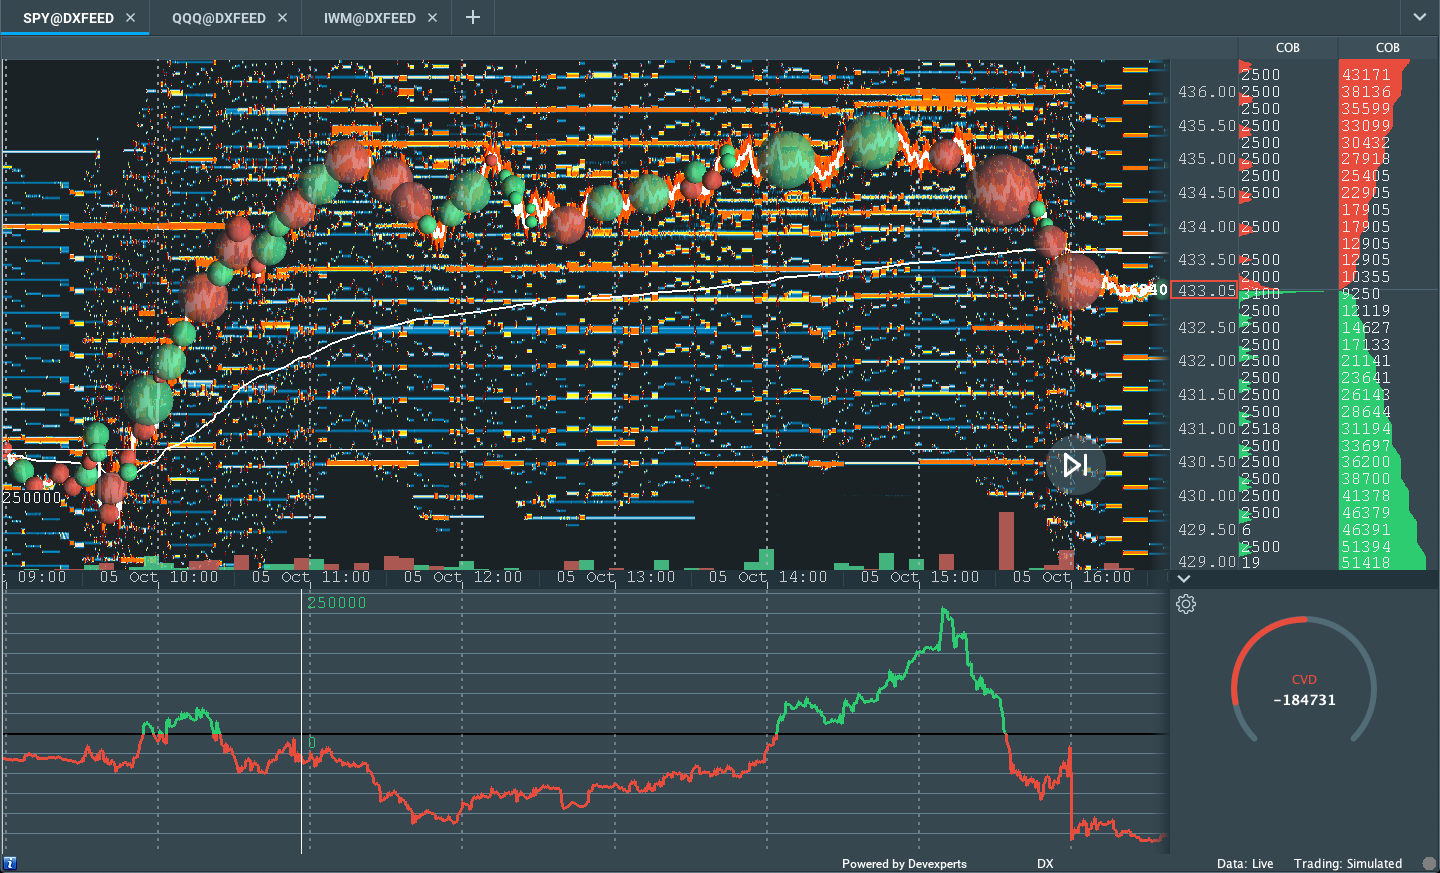
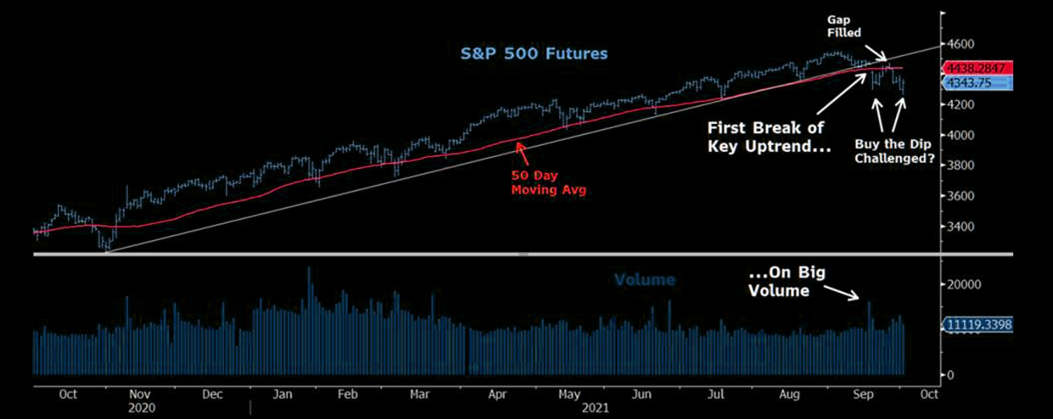
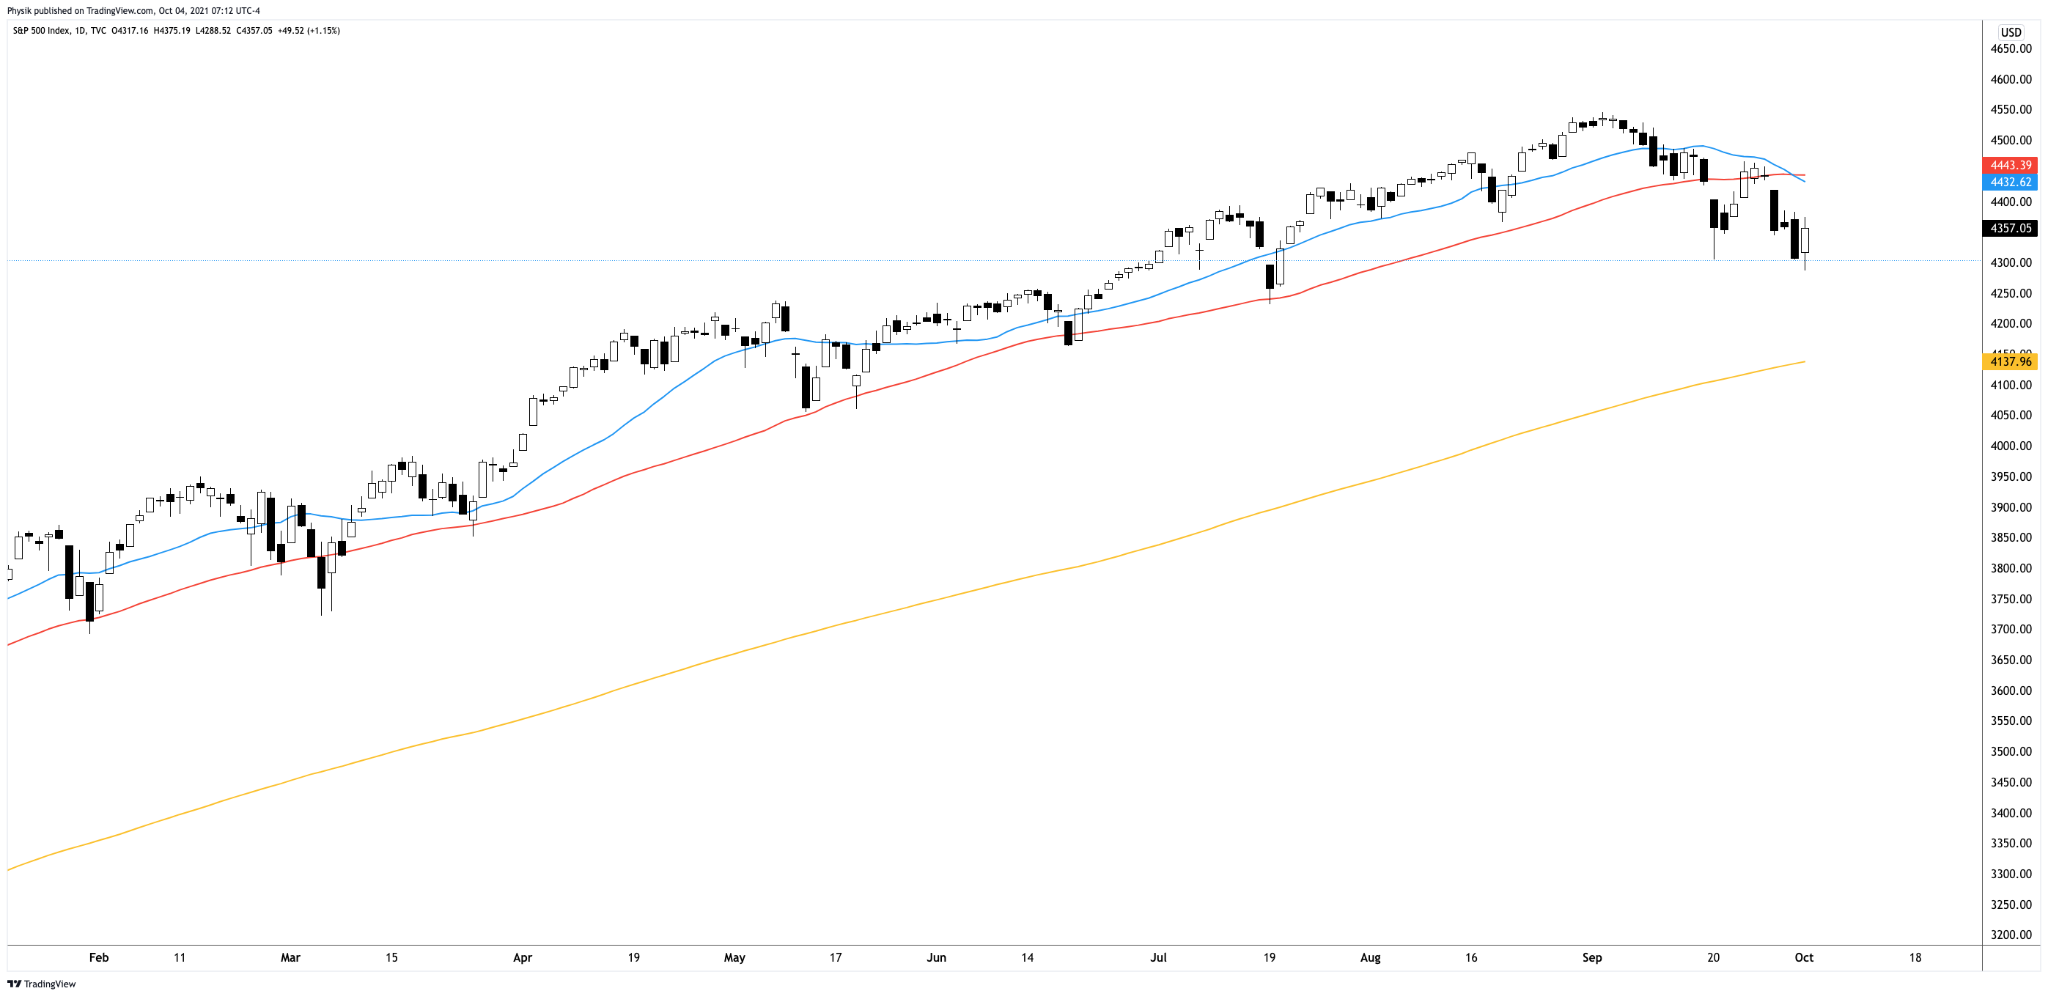
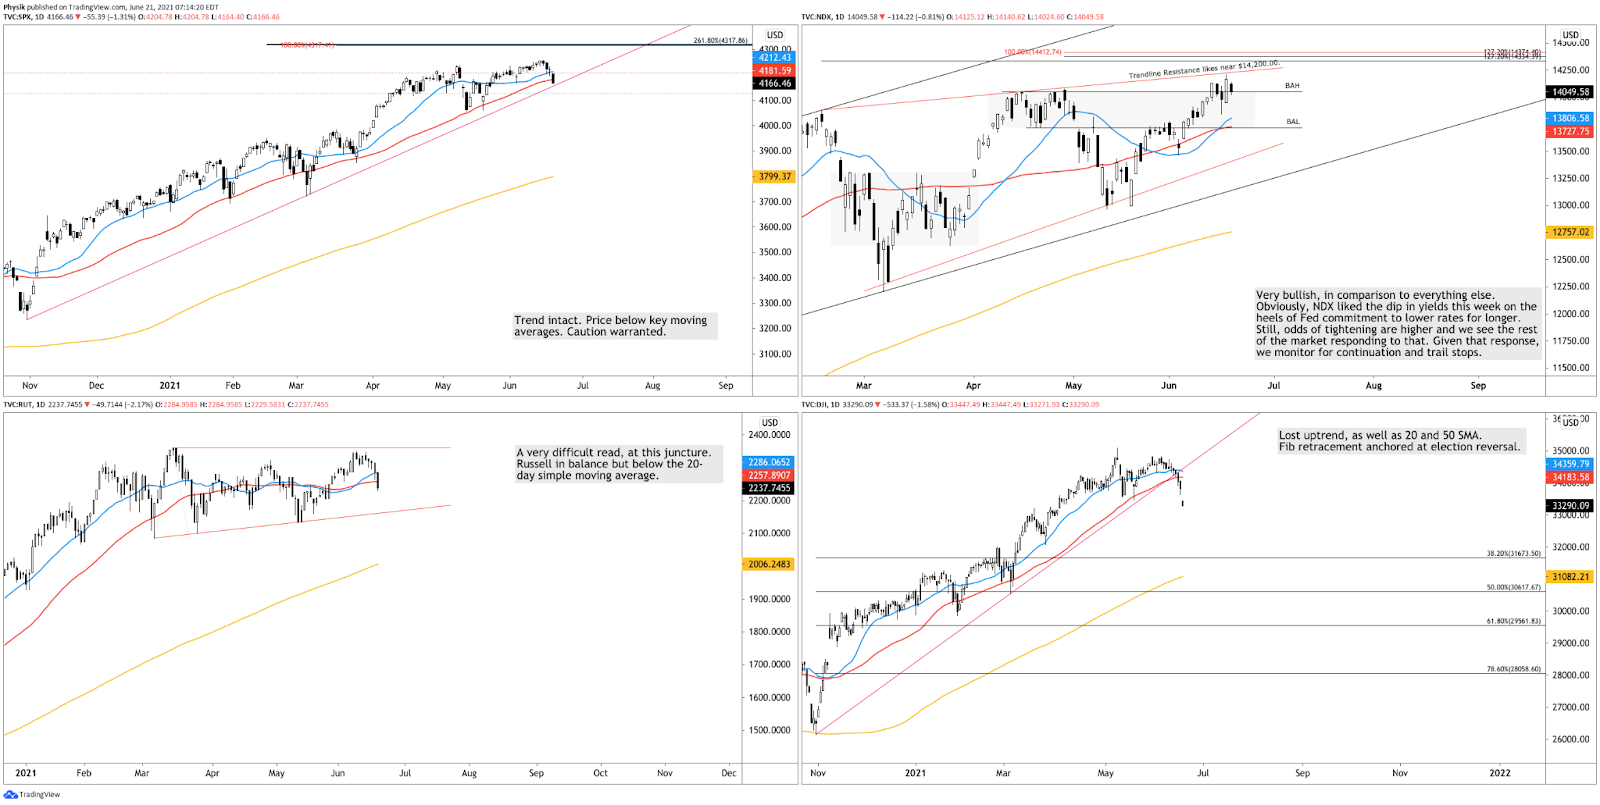
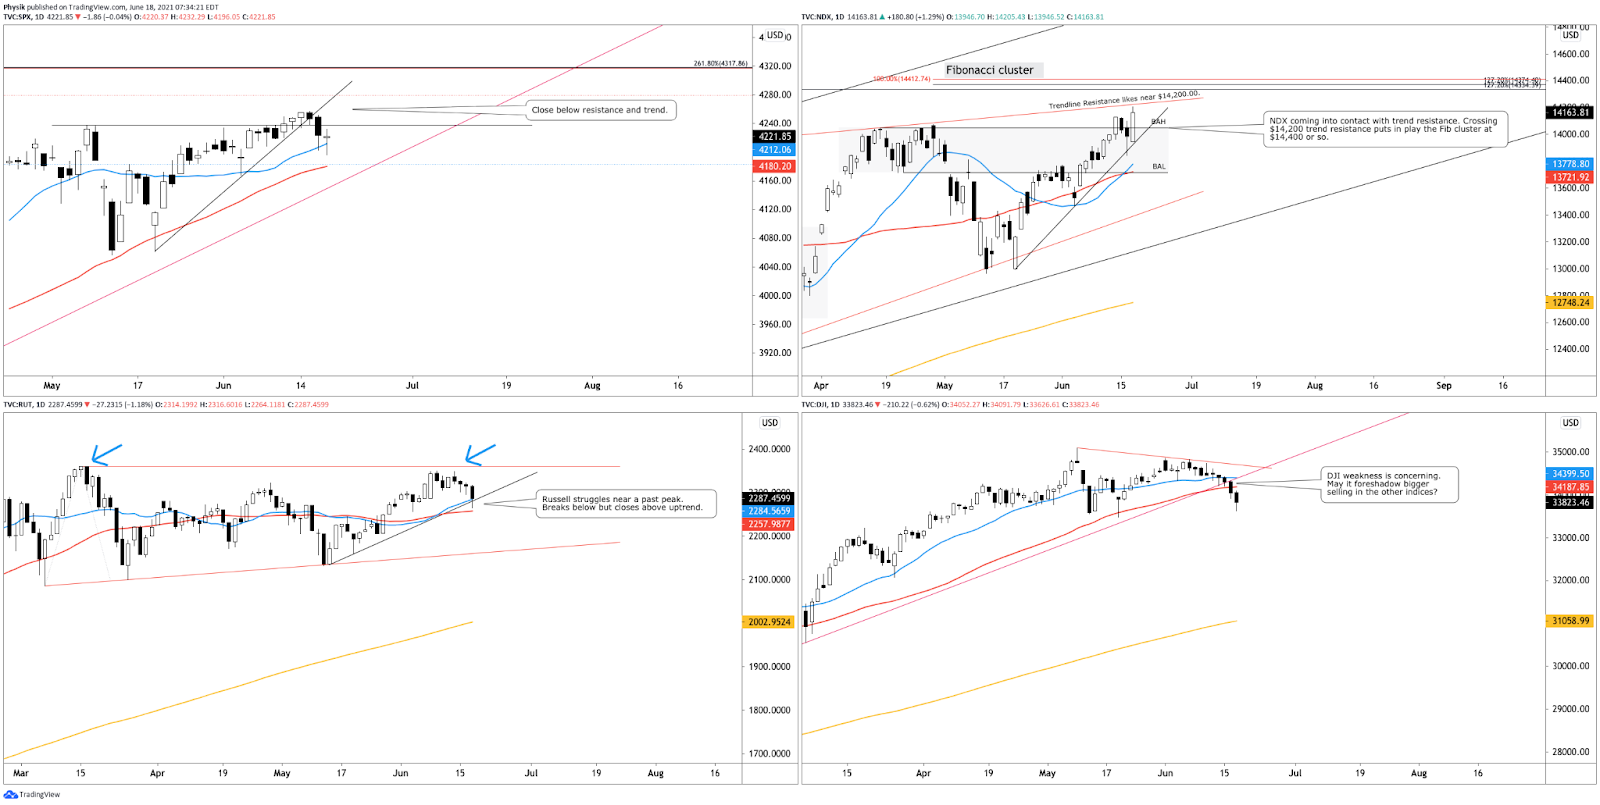
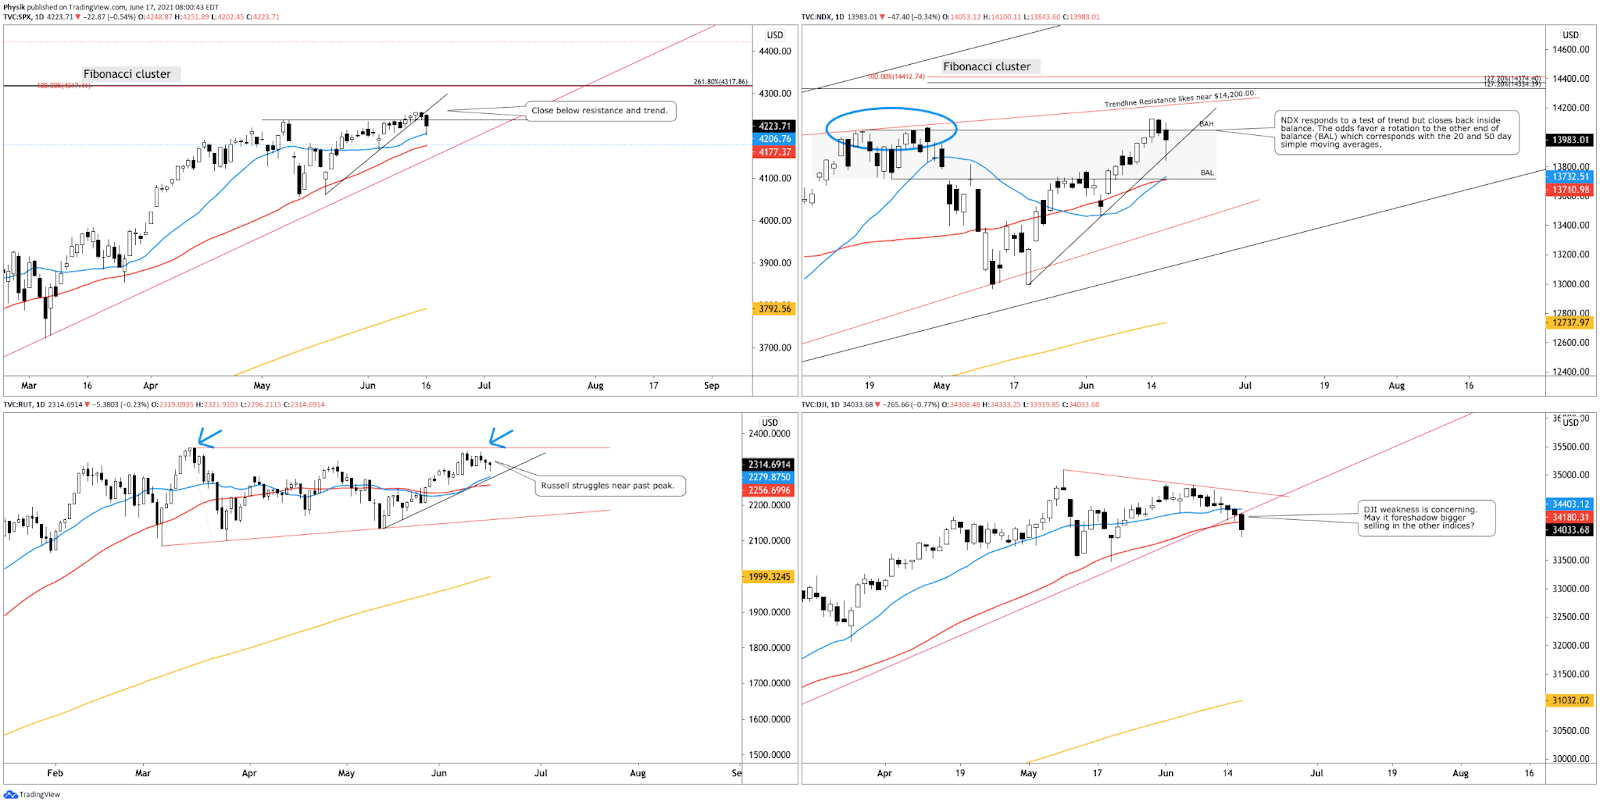
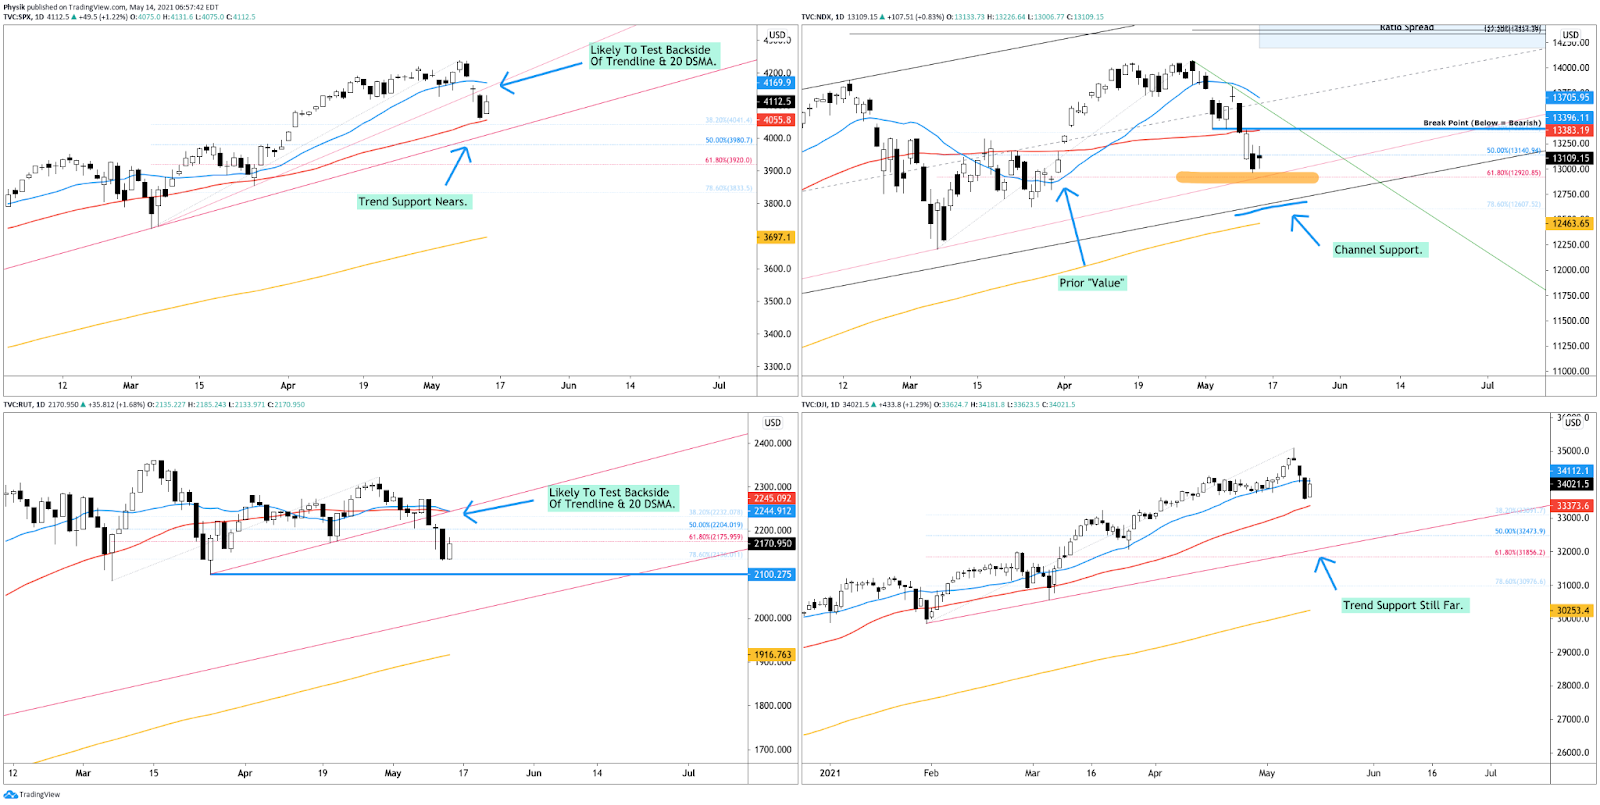
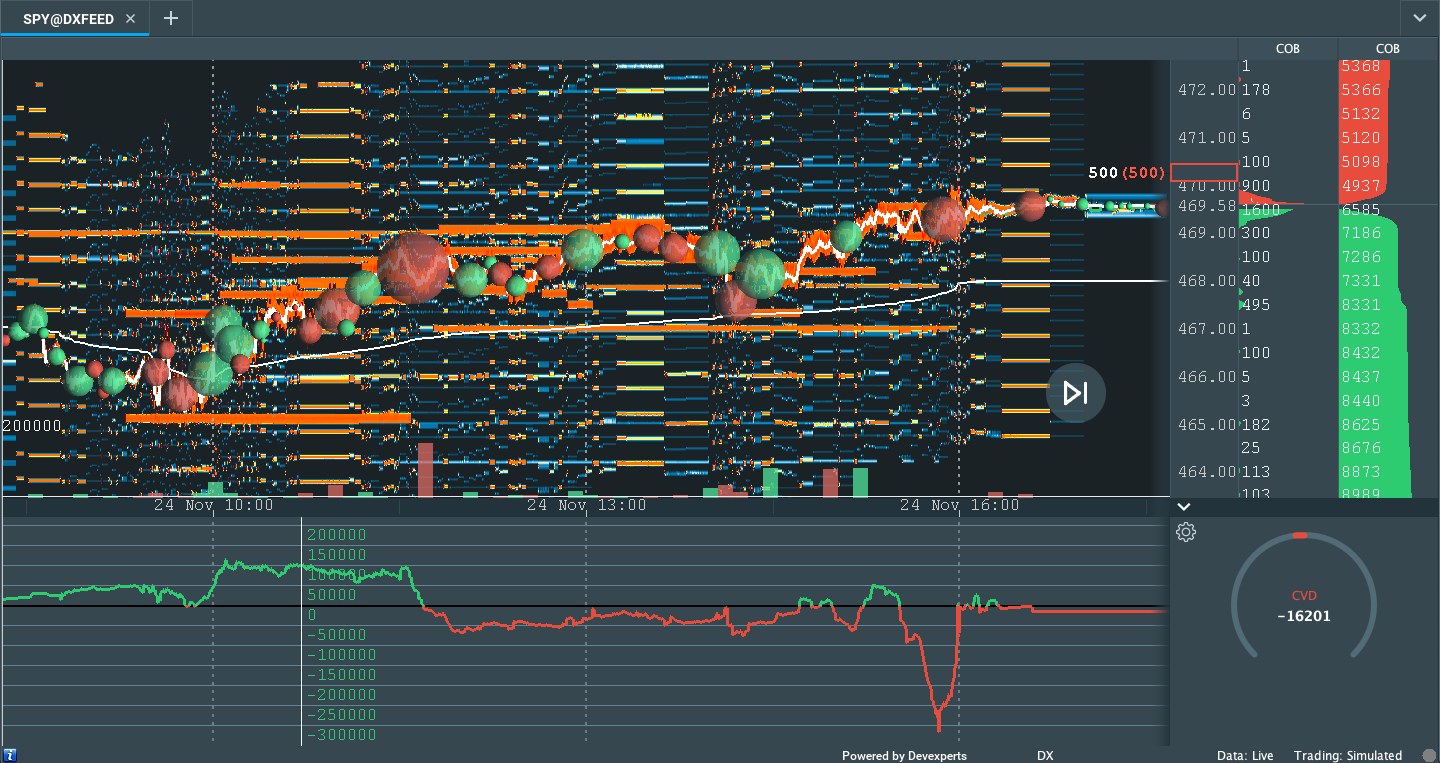
Charts To Watch
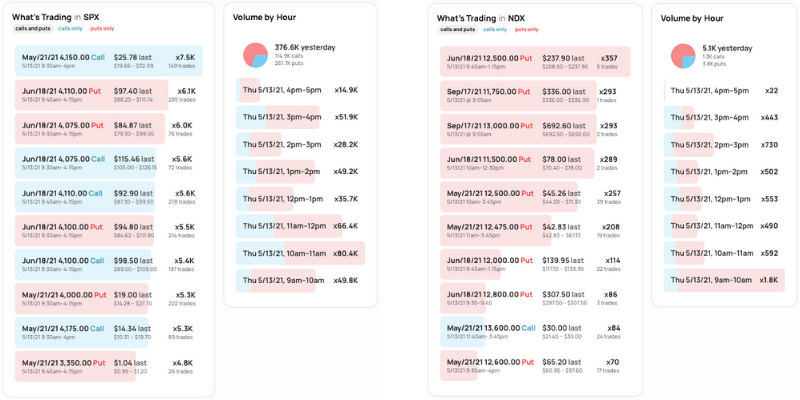
What People Are Saying
Definitions
Spikes: Spike’s mark the beginning of a break from value. Spikes higher (lower) are validated by trade at or above (below) the spike base (i.e., the origin of the spike).
Overnight Rally Highs (Lows): Typically, there is a low historical probability associated with overnight rally-highs (lows) ending the upside (downside) discovery process.
Volume Areas: A structurally sound market will build on areas of high volume (HVNodes). Should the market trend for long periods of time, it will lack sound structure, identified as low volume areas (LVNodes). LVNodes denote directional conviction and ought to offer support on any test.
If participants were to auction and find acceptance into areas of prior low volume (LVNodes), then future discovery ought to be volatile and quick as participants look to HVNodes for favorable entry or exit.
Gamma: Gamma is the sensitivity of an option to changes in the underlying price. Dealers that take the other side of options trades hedge their exposure to risk by buying and selling the underlying. When dealers are short-gamma, they hedge by buying into strength and selling into weakness. When dealers are long-gamma, they hedge by selling into strength and buying into weakness. The former exacerbates volatility. The latter calms volatility.
MCPOCs: POCs are valuable as they denote areas where two-sided trade was most prevalent over numerous day sessions. Participants will respond to future tests of value as they offer favorable entry and exit.
Options Expiration (OPEX): Traditionally, option expiries mark an end to pinning (i.e, the theory that market makers and institutions short options move stocks to the point where the greatest dollar value of contracts will expire) and the reduction dealer gamma exposure.
Volume-Weighted Average Prices (VWAPs): A metric highly regarded by chief investment officers, among other participants, for quality of trade. Additionally, liquidity algorithms are benchmarked and programmed to buy and sell around VWAPs.
About
After years of self-education, strategy development, and trial-and-error, Renato Leonard Capelj began trading full-time and founded Physik Invest to detail his methods, research, and performance in the markets.
Additionally, Capelj is a Benzinga finance and technology reporter interviewing the likes of Shark Tank’s Kevin O’Leary, JC2 Ventures’ John Chambers, and ARK Invest’s Catherine Wood, as well as a SpotGamma contributor, developing insights around impactful options market dynamics.
Disclaimer
At this time, Physik Invest does not manage outside capital and is not licensed. In no way should the materials herein be construed as advice. Derivatives carry a substantial risk of loss. All content is for informational purposes only.